Zions Bank Economic Overview Meridian Chamber of Commerce. May 2, 2017
|
|
|
- Angelina Harrington
- 6 years ago
- Views:
Transcription

1 Zions Bank Economic Overview Meridian Chamber of Commerce May 2, 2017
2 National Economic Conditions
3 Dow 20,000 The Trump Bump Dow Reaches New Heights Following U.S. Presidential Election Source: Wall Street Journal
4 Current Level of Consumer Confidence Indicates Economic Prosperity Above 110 indicates economic prosperity Apr CCI = Mar-12 Jun-12 Sep-12 Dec-12 Mar-13 Jun-13 Sep-13 Dec-13 Mar-14 Jun-14 Sep-14 Dec-14 Mar-15 Jun-15 Sep-15 Dec-15 Mar-16 Jun-16 Sep-16 Dec-16 Mar-17 Source: The Conference Board
5 Expectations of Future Inflation on the Rise
6 NFIB Small Business Optimism Index Source: Trading Economics
7 Irrational Exuberance?

8 Divergence of Soft vs Hard Data
9 Why?
10 Cumulative Job Loss by Months of Recession Thousands Source: Euler Hermes analysis of Bureau of Labor Statistics Data
11 Cumulative Job Loss by Months of Recession Thousands Source: Euler Hermes analysis of Bureau of Labor Statistics Data
12 Index Slower Recovery than Past Recessions Periods from Value Scaled to Recession 2001 Recession 1990 Recession 1981 Recession 1980 Recession 1973 Recession Source: Federal Reserve Bank of St. Louis

13 Slower Recovery than Past Recessions
14 Mixed March Job Indicators Indicator Expectation Actual Total Nonfarm Payrolls 175,000 98,000 Unemployment Rate 4.7% 4.5% Private Payrolls 200,000 89,000 Monthly Average Hourly Wage Growth Yearly Average Hourly Wage Growth 0.3% 0.2% 2.8% 2.7% Labor Force Participation 62.9% 63.0% Sources: Wall street Journal and Bureau of Labor Statistics
15 98,000 Jobs Added in March Million Jobs Lost Payroll Change 000 s Million Jobs Recovered Source: Bureau of Labor Statistics
16 98,000 Jobs Added in March Payroll Change 000 s January-16 February-16 March-16 April-16 May-16 June-16 July-16 August-16 September-16 October-16 November-16 December-16 January-17 February-17 March-17 Source: Bureau of Labor Statistics
17 National Employment Change Percent Change in National Employment by Industry: Mar 2016 to Mar 2017 Ntl. Res. & Mining Construction Manufacturing Trade, Trans., Utilities Information Financial Activity Prof. & Bus. Serv. Ed. & Health Serv. Leisure & Hospitality Other Services Government -1.2% Total: 1.5% 0.4% 0.3% 0.7% 0.9% 0.7% 2.6% 2.2% 3.2% 2.3% 1.7% -2% -1% 0% 1% 2% 3% 4% Source: Bureau of Labor Statistics; seasonally adjusted
18 National Employment Change Total Change in Number of Jobs by Industry in Thousands: Mar 2016 to Mar 2017 Ntl. Res. & Mining Construction Manufacturing Trade, Trans., Utilities Information Financial Activity Prof. & Bus. Serv. Ed. & Health Serv. Leisure & Hospitality Other Services Government Source: Bureau of Labor Statistics; seasonally adjusted
19 Unemployment Rate Indicates Full Employment % = Full Employment Source: Bureau of Labor Statistics
20 Unemployed and Discouraged Workers Down from Last Month U-6 (Underemployed) U-3 (Unemployment) Source: Bureau of Labor Statistics
21 % Labor Force Participation Among Lowest Level in Almost 40 Years Mar % Apr % Mar % Source: U.S. Bureau of Labor Statistics Note: Seasonally adjusted
22 % 68.0 Labor Force Participation Increasing Slightly Source: U.S. Bureau of Labor Statistics Note: Seasonally adjusted
23 90% 80% 70% 60% 50% Civilian Labor Force Participation Rate Male vs Female 40% 30% Men Women Source: Bureau of Labor Statistics
24 Participation Among Women Aged Has Surged
25 4.0% 3.5% Yearly Wage Growth Down Slightly in March Mar % 3.0% 2.5% Average = 2.4% 2.0% 1.5% 1.0% Source: U.S. Bureau of Labor Statistics Note: Growth rate calculated using real chained dollars
26 Producer Price Index Rising Slightly in March Percent Year-to-Year Change Source: Bureau of Labor Statistics; not seasonally adjusted
27 4.5% 4.0% 3.5% 3.0% 2.5% 2.0% 1.5% 1.0% 0.5% 0.0% -0.5% Inflation Above Fed Target But Below Expectations in March U.S. Consumer Price Index Yearly Change Rate Sept 2011 Dec 2011 Mar 2012 Jun 2012 Sept 2012 Dec 2012 Mar 2013 Jun 2013 Sept 2013 Dec 2013 Mar 2014 Jun 2014 Sept 2014 Dec 2014 Mar 2015 Jun 2015 Sep 2015 Dec 2015 Mar 2016 June 2016 Sep 2016 Dec 2016 Mar 2017 Source: Bureau of Labor Statistics
28 Growth in Consumer Spending Under Par Personal Consumption Expenditure Yearly Percent Change Percent Source: Bureau of Economic Analysis
29 Consumers Drive Growth in GDP 6.00% 4.00% 2.00% 0.00% -2.00% -4.00% Government Inventories Net Exports Fixed Investment Personal Consumption Real GDP Growth Q GDP 0.7%
30 = 100 The U.S. Dollar is Strong Trade Weighted U.S. Dollar Index: Broad Source: Federal Reserve
31 Euro compared to U.S. Dollar $1.60 $ $1.40 $1.30 $1.20 $1.10 $1.00 $0.90 $0.80 PARITY 1.06 Source: Federal Reserve Bank of St. Louis
32 U.S. Dollar Compared to Chinese Yuan $6.00 $6.50 $7.00 $7.50 $8.00 $ China stops the yuan s rise 2001 China joins WTO 2005 China allows the yuan to rise 2010 China allows the yuan to rise Aug 2015 China devalues the yuan by largest amount in 20 years Source: Federal Reserve Bank of St. Louis
33
34 $1.80 $1.70 $1.60 $1.50 $1.40 $1.30 $1.20 $1.10 British Pound Dropped to New Low Following BrexitVote Brexit Vote $ Source: Federal Reserve Bank of St. Louis
35 U.S. Total Rig Count Recovering from Low as Oil Prices Rise $120 $110 $100 $90 $80 $70 $60 $50 $40 $30 $ Oil Prices 2015 Source: Baker Hughes and U.S. Energy Information Administration Note: Total count includes oil and gas rigs 2016 Active Oil Rigs ,200 2,000 1,800 1,600 1,400 1,200 1,
36 Federal Funds Target Rate Sees 3 nd Increase in Over a Decade Federal Funds Target Rate = Source: U.S. Federal Reserve
37 March 2017 Fed Rate Increase Projections 4% 3% 3.0% 3.0% 2% 1.4% 2.1% 1% 0% Long Run Source: Board of Governors of the Federal Reserve
38 Idaho Economic Conditions Source: U.S Census Bureau
39 CA 0.7% OR 1.7% WA 1.8% NV 2.0% ID 1.8% AK 0.6% Idaho Population 3 rd Fastest Growing in U.S. UT 2.0% AZ 1.7% MT 1.0% WY -0.2% CO 1.7% NM 0.0% HI 0.2% Percent Change: 2015 to 2016 U.S. Rate = 0.7% ND 0.1% SD 0.9% NE 0.7% TX 1.6% KS 0.3% 0.0% OK 0.4% MN 0.7% IA 0.4% MO 0.3% AR 0.3% WI 0.2% LA 0.3% IL -0.3% MS 0.0% MI 0.1% IN 0.3% TN 0.9% AL 0.2% 1.5% or more OH 0.1% KY 0.3% 0.7% to 1.4% (at or above U.S. rate) 0.2% to 0.6% 0.0% to 0.1% Population Loss WV -0.5% VT -0.2% PA -0.1% NC 1.1% SC 1.4% GA 1.1% VA 0.5% FL 1.8% NH 0.4% NY 0.0% ME 0.2% DC 1.6% CT -0.2% DE 0.8% MD 0.4% MA 0.4% RI 0.1% NJ 0.1% Source: U.S. Census Bureau
40 Total Population 1,800,000 1,600,000 1,400,000 1,200,000 1,000, , ,000 Idaho Population and Components of Change 1,683,140 18,869 10,296 60,000 50,000 40,000 30,000 20,000 10, ,000 Components of Population Change 400, Net Migration Natural Increase Total Population -20,000 Source: Zions Bank analysis of U.S. Census Bureau data
41 Idaho Population Growth Rates By County 2015 to 2016 State Average = 1.8% Increase of 3.0% or Greater Increase of 1.8% to 2.9% Increase of 1.0% to 1.7% Increase of 0.0% to 0.9% Population Loss Boundary 3.1% Bonner 1.8% Kootenai 2.6% Benewah 0.6% Latah 1.2% Nez Perce Lewis 0.6% 1.6% Adams 1.6% Washington 2.1% Payette Gem 0.8% 1.6% Canyon 2.2% Ada 2.4% Owyhee 0.7% Shoshone 0.0% Clearwater 0.2% Boise 1.6% Idaho -0.6% Valley 4.1% Elmore 0.9% Camas 0.7% Gooding -0.1% Custer 0.2% Jerome 1.2% Twin Falls 1.7% Lemhi -0.4% Blaine 1.1% Lincoln -0.7% Cassia 0.0% Butte 0.0% Minidoka 1.1% Power 0.4% Clark -1.4% Jefferson 2.5% Bingham 0.5% Oneida 1.3% Bannock 0.6% Franklin 2.9% Fremont 1.0% MadisonTeton 2.5% 3.7% Bonneville 2.0% Caribou 1.8% Bear Lake 0.7% Source: U.S. Census Bureau
42 CA 2.1% OR 2.2% WA 2.9% Note: Seasonally Adjusted Source: Bureau of Labor Statistics Idaho Employment Growth 6th in the Nation Percent Change in Employment for States: March 2016 to March 2017 U.S. Rate = 1.5% NV 3.0% AK -2.1% ID 2.7% UT 3.2% AZ 2.0% MT 2.1% WY -2.1% HI 0.7% CO 1.9% NM 0.9% ND -0.3% SD 1.6% NE 0.9% KS 0.3% TX 2.1% OK -0.1% MN 1.5% IA 0.5% MO 1.4% AR 1.1% WI 0.9% LA -0.1% IL 0.4% MS 0.0% MI 1.9% IN 1.5% TN 2.2% AL 1.4% OH 0.7% KY 1.5% GA 3.0% WV -0.8% VT 0.9% PA 1.0% NC 1.6% SC 1.8% VA 1.2% FL 3.0% NY 1.2% 2.0% or more 1.6% to 1.9% (at or above the U.S. rate) 1.0% to 1.5% 0.0% to 0.9% Loss ME 0.9% DC 0.8% CT 0.1% DE 0.8% MD 1.6% MA 1.4% RI 0.8% NJ 1.2%
43 Idaho Total Employment at New Highs Thousands of Employees Loss of 59,000 jobs from Gain of 110,100 jobs since low in Total Nonfarm Employment Source: U.S. Bureau of Labor Statistics, Total nonfarm seasonally adjusted Note: Numbers rounded to nearest thousand
44 Idaho Employment Gains and Losses by Industry Percent Change in Idaho Employment by Industry: March 2016 March 2017 Ntl. Res. & Mining Construction Manufacturing Trade, Trans., Utilities Information Financial Activity Prof. & Bus. Serv. Ed. & Health Serv. Leisure & Hospitality Other Services Government -3.0% Total: 2.6% 5.2% 1.9% 1.5% 4.5% 4.5% 2.7% 3.7% 1.7% 2.5% 2.6% -4% -2% 0% 2% 4% 6% Source: Idaho Department of Labor
45 Idaho Employment Gains and Losses by Industry Total Change in Idaho Employment by Industry: March 2016 March 2017 Ntl. Res. & Mining Construction Manufacturing Trade, Trans., Utilities Information Financial Activity Prof. & Bus. Serv. Ed. & Health Serv. Leisure & Hospitality Other Services Government ,000 1,200 2,000 1,500 2,300 3,700 1,200 Total: 18,000 3,200-1, ,000 2,000 3,000 4,000 Source: Idaho Department of Labor
46 Idaho Employment Change Rates By County March 2016 to March 2017 State Rate = 2.7% Boundary -1.1% Bonner 4.9% Kootenai 2.3% Benewah -1.2% Latah 3.9% Nez Perce 2.8% Lewis -0.55% Shoshone 1.7% Clearwater -2.3% Idaho -0.4% 4.0% or more 2.7% to 3.9% 1.0% to 2.6% 0.0% to 0.9% Loss Adams 4.2% Washington Valley 0.5% Elmore -1.6% Source: Idaho Department of Labor, Seasonally Adjusted Total Nonfarm Employment 0.45% Custer Clark 0.2% -2.4% Payette 1.6% Gem 2.3% Canyon 2.7% Ada 2.8% Owyhee 0.7% Boise 2.8% Camas 1.6% Gooding 1.4% Twin Falls 2.1% Lemhi 2.0% Blaine 1.0% Lincoln 0.8% Jerome 2.8% Minidoka 1.1% Cassia 1.1% Butte 2.33% Power 0.2% Jefferson 2.3% Bingham 4.1% Oneida 2.3% Bannock -2.0% Fremont 4.7% MadisonTeton 5.4% 0.9% Bonneville 2.5% Caribou 0.6% Bear Lake Franklin -1.9% 1.3%
47 OR 4.0% 3.8% CA 5.0% 4.9% WA 4.9% 4.7% NV 4.9% 4.8% AK 6.4% ID 3.6% 3.5% UT 3.1% AZ 5.1% 5.0% Note: Seasonally Adjusted Source: Bureau of Labor Statistics ID Unemployment Rates 12 th Lowest in the Nation MT 3.8% HI 2.8% WY 4.7% 4.5% CO 2.9% 2.6% NM 6.7% 6.8% March 2017 U.S. Rate = 4.5% TX 4.9% 5.0% LA 5.7% 5.8% FL 5.0% 4.8% NH 2.7% 2.8% VT ND 3.0% 2.9% 2.8% MN 4.0% 3.8% NY WI SD 4.4% 4.3% 3.7% 3.4% 2.8% MI 5.3% 5.1% PA IA 5.0% 4.8% NE 3.2% 3.1% OH 3.2% 3.1% IL IN 5.1% 5.4% 4.9% 4.1% 3.9% WV VA 5.2% KS MO 4.9% KY 3.9% 3.8% 4.0% 3.8% 4.1% 3.9% 4.9% 5.0% NC 4.9% 5.1% TN 5.3% 5.1% OK AR SC 4.6% 4.3% 3.7% 3.6% 4.4% MS AL GA 5.2% 5.0% 6.2% 5.8% 5.3% 5.1% 3.9% or less 4.0% to 4.7% (at or below U.S. rate) 4.8% to 5.4% 5.5% to 5.9% 6.0% or more ME MA 3.0% 3.2% 3.4% 3.6% RI 4.3% 4.5% CT 4.7% 4.8% NJ 4.4% 4.2% DE 4.5% DC MD 5.7% 5.8% 4.2% 4.3%
48 Idaho Unemployment Rates By County March 2017 State Rate = 3.5% Boundary 5.5% Bonner 5.0% Kootenai 4.3% Benewah 6.9% Latah 3.2% Nez Lewis Perce7.0% 3.1% % Shoshone 7.0% Clearwater 9.0% Idaho 5.5% 3.0% or lower Adams 7.1% Valley 5.1% Lemhi 6.0% 3.1% to 3.6% 3.7% to 5.9% 6.0% to 6.9% 7.0% or greater Washington 5.6% Custer Clark 4.5% 2.0% PayetteGem 6.0% 4.2% Canyon 3.9 Ada 3.0% Owyhee 4.2% Boise 5.4% Elmore 4.1% Camas 3.1% Gooding 2.8% Twin Falls 3.2% Blaine 2.8% Lincoln 4.2% Jerome 3.1% Cassia 2.7% Butte 3.5% Minidoka 2.9% Power 3.6% Jefferson 2.7% Bingham 3.4% Bannock 3.3% Oneida 3.0% Fremont 2,8% Madison Teton 2.1% 3.0% Bonneville 2.9% Caribou 3.7% Bear Lake Franklin 3.4% 2.7% Source: Idaho Department of Labor
49 CA 4.5% WA 4.8% OR 4.5% NV 5.9% UT 5.6% AZ 4.3% Source: Bureau of Economic Analysis ID Personal Income Growth Same as National Average AK -1.0% ID 3.6% Percent Change in Personal Income : U.S. = 3.6%; ID = 3.6% MT 2.3% WY -1.7% HI 4.5% CO 3.9% NM 2.1% ND -1.5% SD 1.2% NE 2.8% KS 2.8% TX 2.9% OK 0.6% MN 3.0% IA 2.3% MO 3.5% AR 3.2% WI 3.1% LA 1.5% IL 3.1% MS 3.2% MI 3.6% IN 3.9% TN 3.9% AL 3.3% 4.0% or more OH 3.0% KY 2.6% GA 4.8% WV 1.0% VT 3.3% PA 2.9% NC 4.1% SC 4.4% VA 3.6% FL 4.9% NH 4.7% NY 2.9% 3.6% to 3.9% (at or above the U.S. rate) 2.0% to 3.5% 0.0% to 1.9% Decrease ME 3.7% DC 4.5% CT 3.0% DE 2.9% MD 3.7% MA 4.3% RI 3.1% NJ 3.2%
50 Construction
51 Idaho Median Home Sale Prices Reaching Approaching Pre-Recession Highs $240,000 $220,000 $200,000 $180,000 $160,000 $140,000 $120,000 $100, Idaho U.S. Source: Graphiq.com reporting data from CoreLogic
52 Idaho Maintains Lower Percentage of Foreclosures than Nation 2008 Percentage of total homes in foreclosure process U.S. Idaho Source: Graphiq.com
53 25,000 Idaho Residential Construction Activity Slowly Climbing 20,000 15,000 10,000 5, Single-Family Units Multifamily Total f Source: U.S. Department of Commerce and U.S. Census Bureau
54 Millions $3,500 $3,000 $2,500 $2,000 $1,500 $1,000 $500 Idaho Value of New Residential Construction Increasing $ Single Family Units Multi Family Units Total f Source: U.S. Census Bureau
55 Meridian
56 Meridian At a Glance Population 90,739 Unemployment 3.0% Median Income - $54,746 Median Home Value - $213,100 Median Gross Rent - $987 Largest Employers Blue Cross Scentsy Forbes best places to retire 2016

57 Meridian is Experiencing Explosive Growth

58 Manufacturing and Construction Lead Jobs in Meridian

59 Meridian Unemployment Dropping

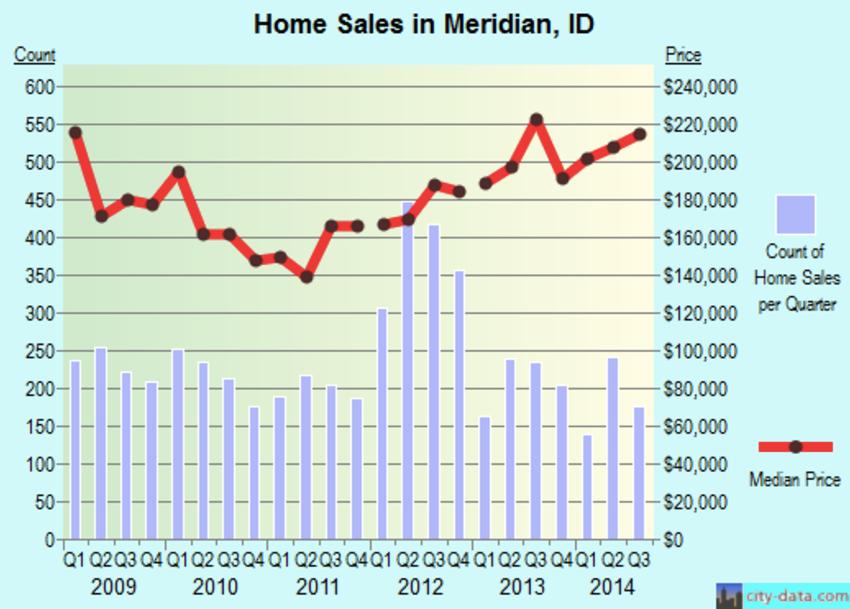
60 Housing Prices Increasing in Meridian
61
62 Idaho Economic Indicators Population Nonfarm Employment Unemployment Rate Personal Income Housing Starts f 2018f Sources: Idaho Division of Financial Management and Moody s Economy.com e = estimate f = forecast

63 Zions Bank, A Division of ZB, N.A. Member FDIC. Content is offered for informational purposes only and should not be construed as tax, legal, financial or business advice. Please contact a professional about your specific needs and advice. Content may contain trademarks or trade names owned by parties who are not affiliated with ZB, N.A. Use of such marks does not imply any sponsorship by or affiliation with third parties, and ZB, N.A. does not claim any ownership of or make representations about products and services offered under or associated with such marks. Robert Spendlove Economic and Public Policy Officer Robert.Spendlove@zionsbank.com Phone:
Rotary Club of Pocatello Economic Overview. April 28, 2016
 Rotary Club of Pocatello Economic Overview April 28, 2016 Economic Headwinds National and international uncertainty Continued low energy prices Depressed business investment Unstable inflation outlook
Zions Bank Economic Overview Cache Valley Home Builders Association. April 12, 2017
 Zions Bank Economic Overview Cache Valley Home Builders Association April 12, 2017 National Economic Conditions Dow 20,000 The Trump Bump Dow Reaches New Heights Following U.S. Presidential Election Source:
Zions Bank Economic Overview West Point Economic Summit. March 30, 2017
 Zions Bank Economic Overview West Point Economic Summit March 30, 2017 National Economic Conditions Dow 20,000 The Trump Bump Dow Reaches New Heights Following U.S. Presidential Election Source: Wall Street
Zions Bank Economic Overview
 Zions Bank Economic Overview Kenworth National Dealers Conference November 8, 2018 1 National Economic Conditions 2 Volatility Returns to the Stock Market 27,000 Dow Jones Industrial Average October 10,
Zions Bank Economic Overview
 Zions Bank Economic Overview WIB Education Summit September 19, 2017 National Economic Conditions Dow Breaks 22,000 The Trump Bump Dow Reaches New Heights Following U.S. Presidential Election Source: Federal
Zions Bank Economic Overview Utah Government Finance Officers Assoc. April 21, 2017
 Zions Bank Economic Overview Utah Government Finance Officers Assoc. April 21, 2017 National Economic Conditions Dow 20,000 The Trump Bump Dow Reaches New Heights Following U.S. Presidential Election Source:
Zions Bank Economic Overview. March 14, 2017
 Zions Bank Economic Overview March 14, 2017 National Economic Conditions Dow 20,000 The Trump Bump Dow Reaches New Heights Following U.S. Presidential Election Source: Wall Street Journal 120.0 110.0 100.0
Zions Bank Economic Overview Logan Rotary Club. March 16, 2017
 Zions Bank Economic Overview Logan Rotary Club March 16, 2017 National Economic Conditions Dow 20,000 The Trump Bump Dow Reaches New Heights Following U.S. Presidential Election Source: Wall Street Journal
Zions Bank Economic Overview
 Zions Bank Economic Overview Intermountain Credit Education League May 10, 2018 Dow Tops 26,000 Up 48% Since 2016 Election Jan 26, 2018 26,616 Oct 30, 2016 17,888 Source: Wall Street Journal Dow Around
Zions Bank Economic Overview
 Zions Bank Economic Overview Veteran Owned Business Conference May 11, 2018 Dow Tops 26,000 Up 48% Since 2016 Election Jan 26, 2018 26,616 Oct 30, 2016 17,888 Source: Wall Street Journal Dow Around Correction
Zions Bank Economic Overview Utah Bankers Association Emerging Bank Leaders Conference. November 9, 2017
 Zions Bank Economic Overview Utah Bankers Association Emerging Bank Leaders Conference November 9, 2017 National Economic Conditions Dow Breaks 23,000 The Trump Bump Dow Reaches New Heights Following U.S.
Zions Bank Economic Overview Coldwell Banker Commercial Group. November 6, 2017
 Zions Bank Economic Overview Coldwell Banker Commercial Group November 6, 2017 National Economic Conditions Dow Breaks 23,000 The Trump Bump Dow Reaches New Heights Following U.S. Presidential Election
Zions Bank Economic Overview
 Zions Bank Economic Overview Utah Valley University Business and Economic Forum May 18, 2017 National Economic Conditions Dow 20,000 The Trump Bump Dow Reaches New Heights Following U.S. Presidential Election
Zions Bank Economic Overview
 Zions Bank Economic Overview UAFS & NAIB Convention September 14, 2017 National Economic Conditions Dow Breaks 22,000 The Trump Bump Dow Reaches New Heights Following U.S. Presidential Election Source:
Zions Bank Municipal Conference Economic Overview August 13, 2015
 Zions Bank Municipal Conference Economic Overview August 13, 2015 Overview National Economic Conditions Utah Economic Conditions Utah is One of the Fastest Growing CA 0.9% States in the Country Percent
Zions Bank Economic Overview
 Zions Bank Economic Overview Utah Manufacturers Association & Associated General Contractors Utah Finance and Economic Summit September 26, 2017 National Economic Conditions Dow Breaks 22,000 The Trump
Zions Bank Economic Overview
 Zions Bank Economic Overview Utah Bankruptcy Lawyers Forum March 20, 2018 National Economic Conditions When Good News is Bad News Is Good News?? Dow Tops 26,000 Up 44% Since 2016 Election Source: Wall
Zions Bank Economic Overview. December 5, 2017
 Zions Bank Economic Overview December 5, 2017 National Economic Conditions Dow Breaks 24,000 The Trump Bump Dow Reaches New Heights Following U.S. Presidential Election Source: Federal Reserve Bank of
Zions Bank Economic Overview
 Zions Bank Economic Overview National Assoc of Credit Managers Member Seminar December 12, 2017 National Economic Conditions Dow Breaks 24,000 The Trump Bump Dow Reaches New Heights Following U.S. Presidential
Understanding the New Trump Economy Economic Overview. November 17, 2016
 Understanding the New Trump Economy Economic Overview November 17, 2016 Uncertainty at the Na@onal and Interna@onal Level Source: Bureau of Labor Statistics The Trump Bump Why? National Job Growth 500
Zions Bank Economic Overview
 Zions Bank Economic Overview Logan Rotary Club June 28, 2018 Dow Tops 26,000 Up 48% Since 2016 Election Jan 26, 2018 26,616 Oct 30, 2016 17,888 Source: Wall Street Journal Dow Around Correction Territory
Economic Forecast to Professional Republican Women Association. January 5, 2017
 Economic Forecast to Professional Republican Women Association January 5, 2017 Economic Headwinds National and international uncertainty Continued low energy prices Depressed business investment Unstable
More of the Same; Or now for Something Completely Different?
 More of the Same; Or now for Something Completely Different? C2ER Place cover image here Richard Wobbekind Chief Economist and Associate Dean for Business and Government Relations June 14, 2017 Real GDP
Colorado Counties Treasurers Association
 Colorado Counties Treasurers Association Place cover image here Richard Wobbekind Executive Director, Business Research Division June 21, 2016 Real GDP Growth Quarterly and Annualized Real GDP 1990-2016
Overview of the Regional Economy
 Overview of the Regional Economy Jason Bram, Research Officer Presentation to the Community Depository Institutions Advisory Council (CDIAC) October 13, 2017 The views expressed here are those of the presenter
Regional Economic Conditions
 Regional Economic Conditions Jason Bram, Research Officer Community Advisory Group Meeting June 27, 2017 The views expressed here are those of the presenter and do not necessarily represent those of the
SEASON FINAL REGISTRATION REPORTS
 Materials Included: 2015-2016 SEASON FINAL REGISTRATION REPORTS 2014-15 & 2015-16 Comparison by Group 2 2015-16 USA Hockey Member Counts 3 2015-16 8 and Under Report 4 2015-16 Players & Girls/Women by
Understanding the Regional Divergence in Adult Mortality in the United States
 Understanding the Regional Divergence in Adult Mortality in the United States Andrew Fenelon, PhD University of Maryland, College Park American Life Expectancy 77 76 75 Life Expectancy in Years 74 73 72
Cement & Construction Outlook
 Cement & Construction Outlook Minnesota Concrete Council November 17, 2011 Dave Zwicke, PCA Analytics Manager, Sr. Economist Bottom Line Economy in a slow growth period characterized by tepid job gains.
2009 National Pharmacist Workforce Study. Visual Data
 2009 National Pharmacist Workforce Study Visual Data Figure 1.1: National Aggregate g Demand Index Values http://www.pharmacymanpower.com/ 5 4 3 4.28 4.07 Shortage Surplus 4.19 4.07 4.02 3.97 3.92 4.21
The MS Economic Outlook The Fall Forum
 The Economic Outlook The Fall Forum Darrin Webb, State Economist University Research Center Mississippi Institutions of Higher Learning dwebb@mississippi.edu (601)432 6556 September 2016 University Research
Overview of the Regional Economy
 Overview of the Regional Economy Jason Bram, Research Officer Presentation to the Community Depository Institutions Advisory Council (CDIAC) March 5, 2019 The views expressed here are those of the presenter
Economic Growth in the Trump Economy
 Economic Growth in the Trump Economy Presented to State Data Center Conference William F. Fox, Director November 18, 2016 GDP Grows, Though Slowly 10.0 8.0 Percentage Change, Previous Qtr, SAAR 6.0 4.0
Anatomy of a Jackpot: Characteristics of Purchasers of Large Jackpot Lottery Tickets
 Anatomy of a Jackpot: Characteristics of Purchasers of Large Jackpot Lottery Tickets The 15 th International Conference on Gambling & Risk Taking May 27-31, 2013 Todd Maki & Don Feeney 1 Although not shown
SUMMARY MEMBERSHIP ANALYSIS FOR THE STATE OF. Trends of first-time 4 to 8 year-old male ice hockey players to
 SUMMARY MEMBERSHIP ANALYSIS FOR THE STATE OF New York Trends of first-time 4 to 8 year-old male ice hockey players 1997-98 to 27-8 p.2 -Background and Methodology p.3 -National Acquisition and Retention
CREATIVE DESTRUCTION AND THE KNOWLEDGE ECONOMY
 CREATIVE DESTRUCTION AND THE KNOWLEDGE ECONOMY Where people work and how it has changed. Creative Destruction & the Process of Change The Second Industrial Revolution & Agriculture Miracle. The Third Revolution
SUMMARY MEMBERSHIP ANALYSIS FOR THE STATE OF. Trends of first-time 4 to 8 year-old male ice hockey players to
 SUMMARY MEMBERSHIP ANALYSIS FOR THE STATE OF Rhode Island Trends of first-time 4 to 8 year-old male ice hockey players 1997-98 to 27-8 p.2 -Background and Methodology p.3 -National Acquisition and Retention
SUMMARY MEMBERSHIP ANALYSIS FOR THE STATE OF. New Hampshire. Trends of first-time 4 to 8 year-old male ice hockey players to
 SUMMARY MEMBERSHIP ANALYSIS FOR THE STATE OF New Hampshire Trends of first-time 4 to 8 year-old male ice hockey players 1997-98 to 27-8 p.2 -Background and Methodology p.3 -National Acquisition and Retention
SUMMARY MEMBERSHIP ANALYSIS FOR THE STATE OF. Trends of first-time 4 to 8 year-old male ice hockey players to
 SUMMARY MEMBERSHIP ANALYSIS FOR THE STATE OF New Mexico Trends of first-time 4 to 8 year-old male ice hockey players 1997-98 to 27-8 p.2 -Background and Methodology p.3 -National Acquisition and Retention
Wenlin Liu, Senior Economist. Stateof Wyoming. Economic Analysis Division State of Wyoming 1
 WYOMING DEMOGRAPHIC AND ECONOMIC TREND LCCC LIFE Program April 7, 2012 Cheyenne, Wyoming Wenlin Liu, Senior Economist Economic Analysis Division Stateof Wyoming Economic Analysis Division State of Wyoming
Minimum Wages By State, Municipality and County
 Compliance Alert January 21 st, 2019 Minimum Wages By State, Municipality and County AL N/A N/A AK $9.89 AZ $11.00 $12.00 - January 1, 2020 Flagstaff $12.00 $13.00 - January 1, 2020 $15.00 - January 1,
Growth in Moscow: A Study of Modest Population Growth and Rising Economic Prosperity*
 Growth in Moscow: A Study of Modest Population Growth and Rising Economic Prosperity* Jon R. Miller Professor of Economics College of Business and Economics University of Idaho Moscow, Idaho Steven Peterson
Federal Regulatory Update WTBA/WisDOT Contractor/Engineer Conference
 Federal Regulatory Update 2019 WTBA/WisDOT Contractor/Engineer Conference by Nick Goldstein ARTBA Vice President of Regulatory & Legal Issues January 17, 2019 How the Public Feels Regulations and Transportation
Kevin Thorpe Financial Economist & Principal Cassidy Turley
 Kevin Thorpe Financial Economist & Principal Cassidy Turley Economic & Commercial Real Estate Outlook Kevin Thorpe, Chief Economist 2012 Another Year Of Modest Improvement 2006Q1 2006Q3 2007Q1 2007Q3 2008Q1
MAINTAINING MOMENTUM:
 MAINTAINING MOMENTUM: 2018 National Economic Update September 12, 2018 noun mo men tum \ mō-ˈmen-təm, mə- \ 1 b : the strength or force that allows something to continue or to grow stronger or faster as
Naples, Marco Island, Everglades Convention and Visitors Bureau May 2018 Visitor Profile
 RESEARCH DATA SERVICES, INC. 777 SOUTH HARBOUR ISLAND BOULEVARD SUITE 260 TAMPA, FLORIDA 33602 TEL (813) 254-2975 FAX (813) 223-2986 Naples, Marco Island, Everglades Convention and Visitors Bureau May
Bikes Belong Survey: The Size & Impact of Road Riding Events
 Bikes Belong Survey: The Size & Impact of Road Riding Events November 2009 Recreational road bicycling events are popular all across the United States. Participants are inspired by the opportunities to
Habit Formation in Voting: Evidence from Rainy Elections Thomas Fujiwara, Kyle Meng, and Tom Vogl ONLINE APPENDIX
 Habit Formation in Voting: Evidence from Rainy Elections Thomas Fujiwara, Kyle Meng, and Tom Vogl ONLINE APPENDIX Figure A1: Share of Counties with Election-Day Rainfall by Year Share of counties with
Bob Costello Chief Economist & Vice President American Trucking Associations. Economic & Motor Carrier Industry Trends. September 10, 2013
 Bob Costello Chief Economist & Vice President American Trucking Associations Economic & Motor Carrier Industry Trends September 10, 2013 The Freight Economy Washington continues to be a headwind on economic
SHOOTING IN AMERICA. An Economic Force for Conservation 2018 EDITION
 TARGET SHOOTING IN AMERICA An Economic Force for Conservation 2018 EDITION INTRODUCTION Target shooting is enjoyed by millions of Americans each year. It is so popular, in fact: More people participate
The Burden of HPV Related Cancers in Kentucky
 The Burden of HPV Related Cancers in Kentucky Presented on November 15, 2017 by Katie Bathje, Kentucky Cancer Consortium Many thanks to: Thomas C. Tucker, PhD, MPH Jaclyn Nee, DrPH 1 % coverage Adolescent
Produce Safety Alliance Course and Trainer Totals through September 19, 2018
 Course and Trainer Totals through 19, 218 Totals: 216 218 Train-the-Trainer Courses Domestic 58 Total TTT Courses since Sept. 216 International 12 Total 7 2,27 Total Trainer Participants 1,716 (Domestic)
Walgreens Pharmacy West Fairview Ave., Boise, ID o Hours: Open 24 hours
 ADA Ada County Sheriffs Office 7200 Barrister Dr Boise, ID 83704-208-577-3000 o Bin in Evidence Room Lobby, Hours: 8-4/M-F Boise Police/City Hall West 333 North Mark Stall Pl Boise, ID 83704-208-570-6000
SECTION SEVEN. Characteristics of People with IDD and Staff in Large Public Residential Facilities
 SECTION SEVEN Characteristics of People with IDD and Staff in Large Public Residential Facilities FY Section 7: Characteristics of People with IDD and Staff in Large State-Operated IDD Facilities This
2012 Payne County Economic Outlook
 2012 Payne County Economic Outlook by Dan Rickman Regents Professor of Economics and Oklahoma Gas and Electric Services Chair in Regional Economic Analysis http://economy.okstate.edu/ 20,000 U.S. Real
Gay Gilbert, Administrator Unemployment Insurance USDOL/ETA June 22, 2016
 Gay Gilbert, Administrator Unemployment Insurance USDOL/ETA June 22, 2016 Where is Our Program Today? Most Critical Challenges A Program in Transition Using our Valuable Resources What s Important for
The 2019 Economic Outlook Forum The Outlook for MS
 The 2019 Economic Outlook Forum The Outlook for MS February 2019 Mississippi University Research Center Mississippi Institutions of Higher Learning Darrin Webb, State Economist dwebb@mississippi.edu (601)432-6556
Target Shooting by Hunters and Their Use of Shooting Ranges: 1975, 1991, and 2011
 U.S. Fish & Wildlife Service Target Shooting by Hunters and Their Use of Shooting Ranges: 1975, 1991, and 2011 Addendum to the 2011 National Survey of Fishing, Hunting, and Wildlife-Associated Recreation
2018 KENTUCKY FACT BOOK
 2018 KENTUCKY FACT BOOK A statistical guide to the Thoroughbred industry in Kentucky Prepared by The Jockey Club Preface This report has been compiled as an industry service by The Jockey Club with the
2018 Annual Economic Forecast Dragas Center for Economic Analysis and Policy
 2018 Annual Economic Forecast Dragas Center for Economic Analysis and Policy PRESENTING SPONSOR EVENT PARTNERS 2 The forecasts and commentary do not constitute an official viewpoint of Old Dominion University,
Wisconsin Concrete Pavement Association. Ed Sullivan, SVP & Chief Economist
 Wisconsin Concrete Pavement Association Ed Sullivan, SVP & Chief Economist February 2018 I Pewaukee, Wisconsin Labor Markets Net Job Creation Monthly Gain 500 7.0% Unemployment Rate U3 Measurement 400
Northwest Economic Research Center College of Urban and Public Affairs Forecast Breakfast Economic Outlook
 Northwest Economic Research Center College of Urban and Public Affairs 2019 Forecast Breakfast Economic Outlook 1/10/2019 2 U.S. ECONOMY 1/10/2019 3 1980 1982 1984 1986 1988 1990 1992 1994 1996 1998 2000
Economic Update and Prospects for 2019 Professor Robert M. McNab Dragas Center for Economic Analysis and Policy Strome College of Business
 Economic Update and Prospects for 2019 Professor Robert M. McNab Dragas Center for Economic Analysis and Policy Strome College of Business January 3, 2019 The forecasts and commentary do not constitute
Traffic Safety Facts. State Traffic Data Data. Overview
 Traffic Safety Facts 2015 Data June 2017 DOT HS 812 412 State Traffic Data Key Findings Traffic fatalities increased by 7 percent from 2014 to 2015 (32,744 to 35,092) for the United States. The fatality
Economy On The Rebound
 Economy On The Rebound Robert Johnson Associate Director of Economic Analysis November 17, 2009 robert.johnson@morningstar.com (312) 696-6103 2009, Morningstar, Inc. All rights reserved. Executive
8:00 am 5:00 pm NASRO Basic Course Music Road Resort Hotel. 8:00 am 5:00 pm NASRO Basic Course - ** Music Road Resort Hotel
 NASRO NATIONAL SCHOOL SAFETY CONFERENCE Smoky Mountains, TN June 23 28, 2019 This event has been approved for UASI reimbursement. Travel, Per Diem, Tuition reimbursement, Backfill and Overtime is at the
Babson Capital/UNC Charlotte Economic Forecast. May 13, 2014
 Babson Capital/UNC Charlotte Economic Forecast May 13, 2014 Outline for Today Myths and Realities of this Recovery Positive Economic Signs Negative Economic Signs Outlook for 2014 The Employment Picture
National and Virginia Economic Outlook Professor Robert M. McNab Dragas Center for Economic Analysis and Policy Strome College of Business
 National and Virginia Economic Outlook Professor Robert M. McNab Dragas Center for Economic Analysis and Policy Strome College of Business October 24, 2018 The forecasts and commentary do not constitute
Economic Overview. Melissa K. Peralta Senior Economist April 27, 2017
 Economic Overview Melissa K. Peralta Senior Economist April 27, 2017 TTX Overview TTX functions as the industry s railcar cooperative, operating under pooling authority granted by the Surface Transportation
2019 Economic Outlook: Will the Recovery Ever End?
 2019 Economic Outlook: Will the Recovery Ever End? Advantage Bank Place cover image here Richard Wobbekind Senior Economist and Associate Dean for Business and Government Relations November 15 th, 2018
National and Regional Economic Outlook. Central Southern CAA Conference
 National and Regional Economic Outlook Central Southern CAA Conference Dr. Mira Farka & Dr. Adrian R. Fleissig California State University, Fullerton April 13, 2011 The Painfully Slow Recovery The Painfully
Population of Puerto Rico (Millions of people)
") Dr. Mario Marazzi-Santiago Instituto de Estadísticas Executive Director August 15, 2015 Population of Puerto Rico (Millions of people) 4.5 4 3.5 3 2.5 2 1.5 1 0.5 1950 1955 1960 1965 1970 1975 1980 1985
Dr. Mario Marazzi-Santiago Instituto de Estadísticas Executive Director August 15, 2015 Population of Puerto Rico (Millions of people) 4.5 4 3.5 3 2.5 2 1.5 1 0.5 1950 1955 1960 1965 1970 1975 1980 1985
Featured Fish-Week ofjuly 16th
 Featured Fish-Week ofjuly 16th 5-6 Premium GradeKoi 25% O f,only$8.21each! 5-6 GinRinMixKoi 15% O f,only$10.41each! 6-8 StandardGradeButerflyKoi Buy1FulCount,Get1FulCount50% O f! 3-4 Yelow CometGoldfish
Larry Kessler, Ph.D. Boyd Center for Business & Economic Research University of Tennessee
 Larry Kessler, Ph.D. Boyd Center for Business & Economic Research University of Tennessee The U.S. economy has now enjoyed 7 years of economic growth since the Great Recession Real GDP grew by 1.2% in
Potential Solutions for Mercury Control in the Cement Industry Portland Cement Association Meeting
 Potential Solutions for Mercury Control in the Cement Industry Portland Cement Association Meeting August 24, 2009 Agenda Albemarle Sorbent Technologies Quick Overview Mercury Sorbents Control Options
Warm Mix Asphalt in the United States: From Evolution to Revolution
 Warm Mix Asphalt in the United States: From Evolution to Revolution Matthew Corrigan, P.E. Asphalt Pavement Engineer Mobile Asphalt Testing Trailer Technical Manager U.S. DOT Federal Highway Administration
Chapter 2: Visual Description of Data
 Chapter 2: Visual Description of Data El Mechry El Koudous Fordham University January 24, 2018 Meshry (Fordham University) Chapter 2 January 24, 2018 1 / 35 Introduction In this chapter we will cover:
From Recession to Recovery
 From Recession to Recovery Monday, April 26, 2010 8:00 AM - 9:15 AM Moderator Michael Klowden, President and CEO, Milken Institute Speakers Mohamed El-Erian, CEO and Co-Chief Investment Officer, Pacific
U.S. and Colorado Economic Outlook National Association of Industrial and Office Parks. Business Research Division Leeds School of Business
 U.S. and Colorado Economic Outlook National Association of Industrial and Office Parks Presented by the Business Research Division Leeds School of Business University of Colorado at Boulder U.S. Economic
FARS Acc_Aux Analytical Users Manual. The Tables in this Manual Contain Fatal Crash Counts
 FARS Acc_Aux Analytical Users Manual The Tables in this Manual Contain Fatal Crash Counts FARS Acc_Aux File s 2005-2014 ANCHOR Table of Contents 1 A_CRAINJ A_CT A_D15_19 A_D15_20 A_D16_19 A_D16_20 A_D16_24
2014 Economic Indicators, Trends & Observations. 51 South Main Street Janesville, WI P F RockCountyAlliance.
 2014 Economic Indicators, Trends & Observations 51 South Main Street Janesville, WI 53545 P.608.757.5598 F.608.757.5586 RockCountyAlliance.com Indicators, Trends & Observations National Level State of
Big Changes, Unknown Impacts
 Big Changes, Unknown Impacts Boulder Economic Forecast Place cover image here Richard Wobbekind Senior Economist and Associate Dean for Business and Government Relations January 17, 2018 Real GDP Growth
The Global Economy: Sustaining Momentum
 The Global Economy: Sustaining Momentum David J. Stockton Senior Fellow Peterson Institute for International Economics Chief Economist Monetary Policy Analytics October 5, 2017 What s Driving the Global
Policy Choices for a Genuine Vermont Economy
 Policy Choices for a Genuine Vermont Economy Jon D. Erickson, Zach Zimmerman, Eric Zencey Gund Institute for Ecological Economics University of Vermont www.uvm.edu/giee Vermont Act 113 An act relating
2016 River Use Statistics -by Steve Sullivan
 Grand Canyon River Office 2016 River Use Statistics -by Steve Sullivan Topics River Use Statistics Overview Commercial River Use Statistics Noncommercial River Use Statistics Noncommercial River Lottery
How Much Wind Is in the Sails?
 How Much Wind Is in the Sails? Erie Chamber of Commerce Place cover image here Richard Wobbekind Senior Economist and Associate Dean for Business and Government Relations September 20, 2017 Real GDP Growth
Your Texas Economy. Current through: Tuesday, Nov 20, 2018
 Your Texas Economy Current through: Tuesday, Nov 20, 2018 Overview of Texas Economy The Texas economy is growing robustly in 2018 2018 job growth through October is 2.9 percent annualized compared to 2.1
2018 Annual Economic Forecast Dragas Center for Economic Analysis and Policy
 2018 Annual Economic Forecast Dragas Center for Economic Analysis and Policy PRESENTING SPONSOR EVENT PARTNERS 2 The forecasts and commentary do not constitute an official viewpoint of Old Dominion University,
FARS Acc_Aux Analytical Users Manual
 FARS Acc_Aux Analytical Users Manual The s Included in the 'ACC_AUX' database are produced from definitions defined in the 'NCSA - Analytical Data Classification Manual' The Tables in this Manual Contain
Annual Data Report
 Annual Data Report 2014-2015 A Report of the Association of American Veterinary Medical Colleges 1101 Vermont Avenue, NW 20005 202-371-9195 http://www.aavmc.org As of March 11, 2015 Introduction The membership
Southern California Economic Forecast & Industry Outlook
 2016-17 Southern California Economic Forecast & Industry Outlook Robert A. Kleinhenz, Ph.D. Sr. VP/Chief Economist, LAEDC February 17, 2016 Outline U.S. Economy California Economy Southern California Economy
Utility Monitoring Central Archive
 Utility Monitoring Central Archive Note that the UMC Archive files mainly cover defunct stations. Some stations may however still be active and some of the info may still be valid. FEMA - FEDERAL EMERGENCY
U.S. Overview. Gathering Steam? Tuesday, October 1, 2013
 U.S. Overview Gathering Steam? Tuesday, October 1, 2013 Uneven global economic recovery Annual real GDP growth projections (%) Projections 2013 2014 World 3.1 3.1 3.8 United States 2.2 1.7 2.7 Euro Area
Economic Recovery Has Stalled, Recession in the Cards by Year End
 Economic Indicators to Watch for Signs of Recovery Economic Recovery Has Stalled, Recession in the Cards by Year End New York, NY Monday, June 27, 2011 Richard Yamarone Author of The Trader s Guide to
Muhlenkamp & Company. Webinar December 1, Ron Muhlenkamp, Portfolio Manager Jeff Muhlenkamp, Portfolio Manager Tony Muhlenkamp, President
 Muhlenkamp & Company Webinar December 1, 2016 Ron Muhlenkamp, Portfolio Manager Jeff Muhlenkamp, Portfolio Manager Tony Muhlenkamp, President Muhlenkamp & Company, Inc. Intelligent Investment Management
Charting a Path to Lift Off? Understanding the Shifting Economic Winds
 Charting a Path to Lift Off? Understanding the Shifting Economic Winds Thomas F. Siems, Ph.D. Assistant Vice President and Senior Economist Federal Reserve Bank of Dallas Government Finance Officers Arlington,
WORKFORCE LOCAL AREA EMPLOYMENT STATISTICS (LAUS)
") AUGUST 2018 WORKFORCE LOCAL AREA EMPLOYMENT STATISTICS (LAUS) 1,200,000 1,100,000 1,000,000 900,000 Labor Force Employment 1,152,626 1,116,938 800,000 700,000 600,000 500,000 2016 to 2017: 35957 (3.1%)
AUGUST 2018 WORKFORCE LOCAL AREA EMPLOYMENT STATISTICS (LAUS) 1,200,000 1,100,000 1,000,000 900,000 Labor Force Employment 1,152,626 1,116,938 800,000 700,000 600,000 500,000 2016 to 2017: 35957 (3.1%)
NATIONAL UNEMPLOYMENT INSURANCE PROGRAM UPDATE GAY GILBERT, ADMINISTRATOR UNEMPLOYMENT INSURANCE USDOL/ETA JUNE 27, 2018
 NATIONAL UNEMPLOYMENT INSURANCE PROGRAM UPDATE GAY GILBERT, ADMINISTRATOR UNEMPLOYMENT INSURANCE USDOL/ETA JUNE 27, 2018 UI NATIONAL UPDATE v Program Highlights v Quick Look at the Data v Strategic Investments/Initiative
Transitions: 2019 Economic Forecast for Metro Denver February 6, 2019
 Transitions: 2019 Economic Forecast for Metro Denver February 6, 2019 Prepared by: Can Stock Photo / jkirsh In Partnership with: Consumer Changes and Influences Slowing population growth Aging of the population
2018 ILLINOIS FACT BOOK
 2018 ILLINOIS FACT BOOK A statistical guide to the Thoroughbred industry in Illinois Prepared by The Jockey Club Preface This report has been compiled as an industry service by The Jockey Club with the