Volume 1 Overview and Summary. 3 Detailed Financial Information and Council Policies. 4 Growth Forecasts
|
|
|
- Samuel Stafford
- 6 years ago
- Views:
Transcription
1 1 Queenstown Lakes District Council Council Community Plan 2006/2016 Volume 1 Overview and Summary 2 Council Activities 3 Detailed Financial Information and Council Policies 4 Growth Forecasts
2 2 CONTENTS Background Overview... 3 Key Assumptions and Process... 5 Useful References... 7 Growth Forecasts Growth Forecasts for the District as a whole... 9 Growth Forecasts for Queenstown Growth Forecasts for Wanaka Growth Forecasts for Small Communities Assessments Permanent Resident Population Growth Housing Age Structure Jobs and Employment Detailed Projections Summary of Detailed Projections Wakatipu Ward Average Day Growth Projections Wanaka Ward Average Day Growth Projections Wakatipu Ward Peak Day Wanaka Ward Peak Day Residential Dwelling Projections Visitor Unit Projections Average Day Peak Day... 48
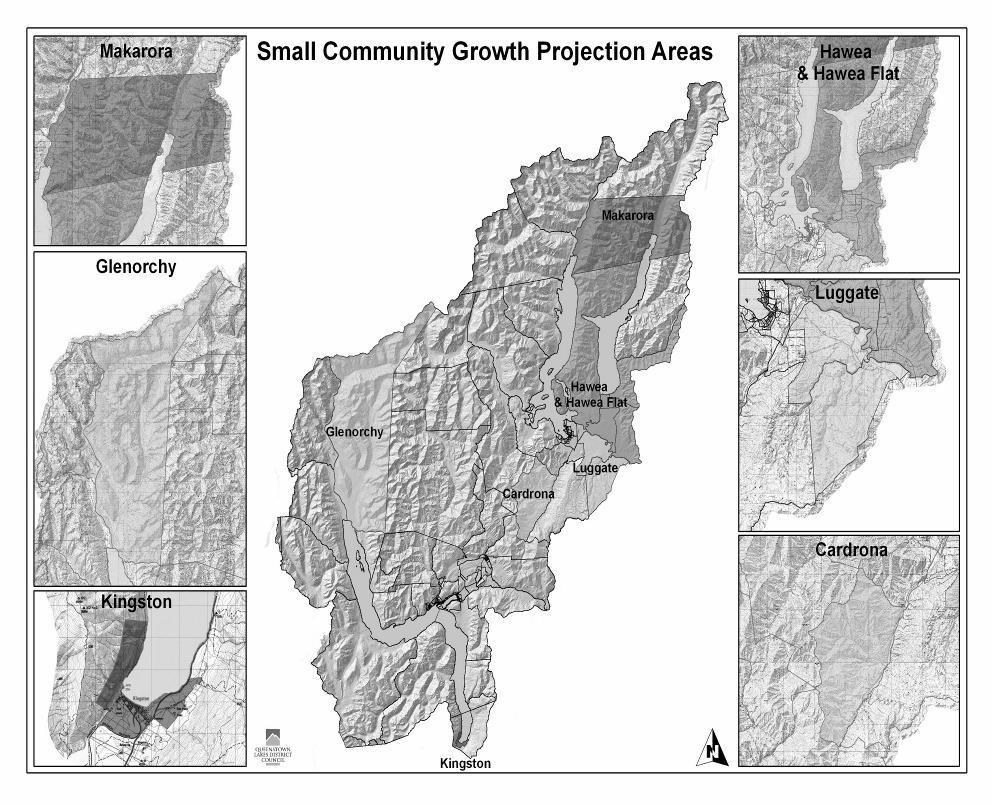
3 3 1. BACKGROUND TO GROWTH FORECASTS This volume is broken into the following sections: Overview Projections into the future, broken down into the various communities and provided for the district, as a whole What is the situation today? The detailed growth projections Overview Projections have been derived for: The resident population (which is useful when looking at some service provisions such as educational needs). The number of visitors, which is then further broken down into day visitors and those staying in private residences and in commercial accommodation. The number of occupied and unoccupied dwellings that will be required over time. The number of visitor units that will be required over time. This information is then used to give the figures for an average day and a peak day. The peak day information has been significantly influenced by the peak population survey that was held in early January The information is also broken down further in the back of this document into even more specific geographic areas, in recognition that sometimes it will be necessary and/or of interest to determine the total growth picture for certain suburbs/areas: The Wakatipu Sunshine Queenstown Bay Kelvin Heights Frankton Road Frankton Flats Arrowtown Arthur s Point Glenorchy Kingston Lake Hayes Millbrook Wakatipu Wanaka The projections are based on a business as usual model and do not assume any constraints or intervention in the market. The projections also assume the current zonings and, in the case of Wanaka, also assume that some additional zoning will be released in south Wanaka in the foreseeable future. Geographic breakdown of the information This document provides these projections for the following geographic areas: The whole district. The Queenstown area. The Wanaka area. The smaller communities of Makarora, Luggate, Lake Hawea and Hawea Flat, Cardrona Kingston and Glenorchy. Wanaka West Wanaka South Central Beacon Point Albert Town Hawea Luggate Makarora Cardrona
4 4 Maps of the Wakatipu and Wanaka study areas are included later in this volume. It is noted that due to the boundaries of the study areas small amounts of rural land (including the Gibbston area) are not included in the figures in this document. That said, it is noted that the existing and projected future populations in these areas are not significant. It is also noted that Council does intend to provide information for these areas in the next iteration. Project and plan for expanded services. Justify funding. Assist with the location of additional or improved services. Detailed information is provided at the back of this Volume and is sorted by area (so that you can view all the information about a particular area such as Kelvin Heights) and also by growth type; for example, the number of visitors, the number of dwellings. The 2006 Census information These projections rely in many instances on the 2001 census data as a starting point which is now 5-years old and extremely out of date, which means that we are forced to estimate what we have today as well as into the future. We are looking forward to receiving the data from the 2006 census (expected in early 2007). This 2006 data will enable us to gauge how accurate our projections have been over the last 5 years and we will use the 2006 census data as our new base data, from which to start our projections. What are the projections used for? These projections are useful to the council, government and non-government agencies, the general public, and people wishing to develop or invest in the area. The Council uses the information (for example): To assist central government agencies to plan for their statutory functions into the future. As performance measures to better understand how well we are working toward achieving the Community Outcome of sustainable growth management. To undertake strategic planning. To determine the need for more land to be zoned for particular purposes in a staged manner. To determine the consequences of growth on our key infrastructure (such as roading, sewage, and water systems) and to ensure that infrastructural development and improvements keep pace with projected growth. To determine the level of financial contributions we need to collect to ensure council services can keep pace with growth. To determine the projected demands for open space and community facilities. To lobby other agencies for improved services to the community (e.g. health, regional facilities, etc). Government and non-governmental agencies use the information to (for example): What further work are we planning to do to better understand growth and its consequences for the community? The council has planned to do further research into the following key areas in the coming 3 years: The employment land needs of the district; broken down by the type and location. I.e. how much industrial, business, and retail land do we need and where should it be located? Traffic generation and transportation. Extensive refinement of the dwelling capacity model and the demand side of this. Why do the figures extend out to 2026? The projections extend out 20 years (to 2026) as this enables the council to prepare a 20 year plan for infrastructure, which is considered to be best practice and essential in such a high growth area as the Queenstown Lakes District. Whist some may advocate for the need to project and plan for growth using a 50 year timeframe, the Council has taken the pragmatic view that the extent of unknowns that arise with such a long horizon start to make accurate projections extremely difficult and, as such, the 20 year timeframe is preferred. That said, the Council acknowledges that there are instances (such as in the planning of a new sewage treatment plant) where it is necessary to plan out longer than 20 years and, in such cases, the assumptions, ratios, and methodologies used in the 20 year projection can be extrapolated out to provide the long term picture. An explanation of terms used in this Volume Commercial accommodation Accommodation establishments are divided into five types for the purposes of the peak population survey. They follow the New Zealand Accommodation Classification (NZAC) system. Hotel- includes both hotels and resorts. Motel- includes motor inns and motels. Hosted- includes private hotels, guest houses, bed and breakfasts, and holiday farm (farm-stays) accommodation.
5 5 Backpackers/Hostels. Caravan Parks/Camping Grounds. Private residences (Private dwelling, Residential dwelling) A private dwelling accommodates a person or a group of people, but is not available to the public. A private dwelling may be permanent or temporary. Permanent private dwellings include houses and flats, residences attached to a business or institution; baches, cribs and huts. Caravans, cabins, tents and other makeshift dwellings that are the principal or usual residence of households are classified as temporary private dwellings. Usually resident A count of all people who usually live in a given area, and are present in New Zealand, on a given census night. Visitor A person who usually lives elsewhere. This is a statistical, not a legal, definition generally based on a person's self-identified usual address. For household surveys, this is a person who is present in a dwelling at the time of a survey but does not usually live in that dwelling. Visitors staying in: A count of visitors staying in the following breakdown of dwellings: Private Residences. Commercial Accommodation or Day Visitors (those visitors that do not stay in the area overnight). Note: for the townships the count of visitors has not been split into these categories. Visitor unit (stay unit) The term used to describe the unit of accommodation charged out to guests, e.g. a powered site, a bed in a bunk room, a motel unit. Key Assumptions and Process Process Instead of using Statistics NZ projections, which at the time of writing this document still reflected the 2001 figures, the council has produced its own growth projections based on visitor night projections from the Tourism Research Council. The process of developing the projections for Queenstown The following process was used to develop the projections for Queenstown: 1. Consideration of the existing Statistics NZ projections. 2. Establish a broad relationship between visitor growth, employment growth and population growth. 3. Using visitor growth as the main driver of employment and population growth in the area, determine likely growth in visitor numbers, based on expected annual rates of increase. 4. From the total visitor numbers, project out the number of full time equivalent (FTE s) workers, based on the current ratio between the number of visitors and the number of workers. The trend has been for the ratio between the number of visitors and the number of workers to increase over time. 5. Based on the growth of employment (FTE s), determine the likely population based on the current ratio of (FTE s) to permanent residents, maintaining the 2001 ratio between workers and permanent residents. 6. Based on the number of permanent residents, determine the number of occupied and unoccupied houses. This is achieved by first applying an assumed number of people per household to the permanent population. This figure is derived from the 2001 census. This then gives the number of permanent homes. A ratio between permanent and temporary homes is then applied to gain the total number of dwellings. 7. Based on the number of visitor nights projected by the Tourism Research Council and an assumed occupancy per stay unit, determine the additional number of stay units required. 8. Based on the total number of dwellings and the total number of stay units, determine the peak day population. This is achieved by first applying an assumed number of people per dwelling to the total number of dwellings and secondly by applying an assumed number of visitors per stay unit to the total number of stay units. These figures are derived from the 2004/05 Peak Population Survey. Please refer to Page 20 onward of the 2004 Volume 4 CCP for more detail on the base data used in this process. The process of developing the projections for Wanaka A different approach was taken to that of Queenstown, because the drivers of growth in Wanaka are different to those of Queenstown. In Wanaka the following process has been adopted: 1. Population projections as provided by Statistics New Zealand were used as the starting point. 2. From these estimates the number of dwellings was estimated (occupied and unoccupied). 3. Employment growth was based on the growth of the population. 4. Finally, growth in visitor numbers was estimated based on the growth of the population on the basis that as more people live in the area, there will be a bigger service base,
6 6 more activities and better transport links and these features will draw in more visitors to the area. 5. Based on the number of permanent residents, the number of occupied and unoccupied houses was determined. This is achieved by first applying an assumed number of people per household to the permanent population. This figure is derived from the 2001 census. This then gives the number of permanent homes. A ratio between permanent and temporary homes is then applied to gain the total number of dwellings. 6. Based on the number of visitor nights projected by the Tourism Research Council and an assumed occupancy per stay unit, the additional number of stay units required was determined. 7. Based on the total number of dwellings and the total number of stay units, determine the peak day population. This is achieved by first applying an assumed number of people per dwelling to the total number of dwellings and secondly by applying an assumed number of visitors per stay unit to the total number of stay units. These figures are derived from the 2004/05 Peak Population Survey. Please refer to Page 27 onward of the 2004 Volume 4 CCP for more detail on the base data used in this process. The Draft Wanaka Structure Plan identifies a number of growth areas which should be released over time. The figures in this volume assume that Phase 1 and part of Phase 2, as shown in the Draft Wanaka Structure Plan, are developed to some extent within the 10-year planning horizon of this CCP. The process of developing the projections for the small communities The following process was used to develop the projections for the small communities: 1. Population projections as provided by Statistics New Zealand were used as the starting point. The high projections have been used for each small community as these are considered to be the closest to current growth levels and, historically, the district s growth rates have exceeded Stats NZ s high projection. 2. From these estimates the number of dwellings was estimated (occupied and unoccupied). 3. The current visitor numbers staying in commercial accommodation was assessed. 4. Based on the total number of dwellings the peak day population was determined. This is achieved by first applying an assumed number of people per dwelling to the total number of dwellings and secondly by applying a ratio of visitors to permanent residents. These figures are derived from the 2004/05 Peak Population Survey and local assessments. So, what has changed since the projections included in the CCP (2004)? A new process for projecting the peak population The process used for determining the peak day population has changed and improved considerably. The result of the new analysis has been that the projected peak population is considerably higher than previously estimated. Whereas we had previously estimated the peak using wastewater pumping information (as an indicator of additional people in the district at those times), the Council undertook a peak population survey in December 2004 January 2005 which provided an indication of the average number of people staying in a private residence at peak times. From there, the process undertaken was to: 1. Take the projected number of dwellings and visitor units. 2. Assume that the commercial accommodation (visitor) units (as identified through the Commercial Accommodation Monitor (CAM) would be 100% full (at 2 people/unit). In this instance, any managed apartments that are captured in the CAM would be deemed to be commercial accommodation and the rest would be private residences. 3. Assume the dwellings would have the average number of occupants, as determined by the peak population survey (i.e. 3.9 people per dwelling in Queenstown and 4.9 in Wanaka). These peak occupancies have been assumed to reduce overtime as a result of the reduction in the number of holiday homes as assumed in the 2004 Growth Options Study. 4. From this information, the peak day population is estimated. The assumptions The only key assumption that has changed is that the visitor growth rate for Queenstown has been reduced. This is as a result of lower projections from the Tourism Research Council and a reduction in Destination Queenstown s own projection rates. The projections used in the 2004 CCP assumed a growth rate of 4.75% per annum reducing to 4.0% per annum. The new projections assume a growth rate of 4.1% per annum (the target set by Destination Queenstown) reducing to 3.5% per annum (as projected by the Tourism Research Council).

7 7 The Small Communities Population projections have been included for the small communities around the district, albeit at a lower level of detail than that provided for Queenstown and Wanaka. The small communities considered are Glenorchy, Kingston, Cardrona, Luggate, Hawea and Makarora. The base data The number of existing dwellings has increased since the CCP 2004 projections, with the continuation of building activity. Once the 2006 census data is available, the Council will check the accuracy of the projected annual dwelling supply with the actual number of dwellings that have been built in recent years. It is highlighted that figures and projections presented in this volume may differ somewhat from earlier work presented by the council and that this volume contains the most recent and accurate information and takes precedence over earlier work. It also needs to be noted that: The projections become less accurate in the latter periods. These recent projections rely in many instances on the 2001 census data as a starting point which is now 5-years old and extremely out of date, which means that we are required to estimate what we have today as well as into the future. We are looking forward to revising the projections once again when the 2006 census data is released (expected in early 2007), as this will provide up-to-date baseline data from which to base projections. That said, the council is confident that the previous projections prepared in 2003 and the refinements contained in this document provide very sound evidence of the actual and projected levels of growth and the need for agencies to strategically plan for this. Other Useful Sources of data This volume provides just one source of information and you are advised to also consult the following sources for a complete picture of the current and projected growth within the district: Statistics New Zealand Tourism Research Council - Business and Economic Research Limited Peak Population Survey ( ) Wanaka Structure Plan Dwelling capacity study updated 6 monthly
8 8
9 9 2. GROWTH FORECASTS Growth Forecasts for the District as a Whole The average day population Average Day Population Growth in the District Usually resident (permanent resident population) Total visitors 80,000 70,000 60,000 50,000 40,000 30,000 20,000 10, population will live in the Wakatipu area and the remainder will be in and around the Wanaka area. The peak day population 160, , , ,000 80,000 60,000 40,000 20,000 0 Peak Day Population Growth in the District Usually resident (permanent resident population) Total visitors Average day population In 2006 In 2016 In 2026 Wanaka (Wanaka study area and outlying areas) Wakatipu (Queenstown study area and outlying areas) 10,520 17,606 23,712 23,556 35,132 50,635 District 34,076 52,738 74,347 Maps of the Queenstown and Wanaka study areas are shown in the following section. For clarity, the above figures also include Wanaka outlying areas of Cardrona, Luggate, Hawea and Makarora and Queenstown s outlying areas of Glenorchy and Kingston. The average day population data for the district as a whole is expected to increase from an estimated 34,076 in 2006 to an estimated 74,347 in 2026 which is a growth rate of 4.0% per annum. This figure is comprised of residents, visitors staying in both commercial accommodation and private residences, and day visitors. 68.1% of the total average day Peak day population In 2006 By 2016 In 2026 Wanaka (Wanaka study area and outlying areas) Wakatipu (Queenstown study area and outlying areas) 29,023 44,773 58,236 46,354 64,029 86,781 District 75, , ,017 The peak day population data for the district as a whole is expected to increase from an estimated 75,377 in 2006 to an estimated 145,017 in 2026 which is a growth rate of 3.3% per annum. This figure is comprised of residents, visitors staying in both commercial accommodation and private residences, and day visitors. 59.8% of the peak population will be in the Wakatipu area and the remainder will be in and around the Wanaka area. In those peak times it is expected that visitors will out-number residents at this time throughout the district and that most visitors will be staying in residential areas. It is noted that the peak period is over the New Year period and lasts for a relatively short time. The peak population information is particularly important for Council s infrastructure

10 10 planning as the infrastructure such as roads, water, and sewage need to be designed to cope at those times. Dwelling and visitor accommodation growth projections Dwelling Growth in the District 45,000 40,000 35,000 30,000 25,000 20,000 15,000 10,000 5,000 Wakatipu Wanaka No. of dwellings and visitor accommodation units In 2006 By 2026 Wanaka (Wanaka study area and outlying areas) 6,875 13,084 Wakatipu (Queenstown study area and outlying areas) 15,304 29,381 District 22,179 42,465 The visitor accommodation units included above is based on the number of stay units (being the term used to describe the unit of accommodation charged out to guests, e.g. a powered site, a bed in a bunk room, a motel unit) as defined in the Commercial Accommodation Monitor. The number of dwellings and visitor units in the district as a whole is expected to increase from an estimated 22,179 in 2006 to an estimated 42,465 in 2026 which is a growth rate of 3.3% per annum. 69.2% of the dwellings and visitor units will be in the Wakatipu area and the remainder will be in and around the Wanaka area.

11 11 Growth forecasts for Queenstown The average day population projections for Queenstown The Queenstown Study Area is shown on the map below. All the figures in this section relate only to that area shown within the dotted line. The outlying smaller communities are dealt with in the subsequent section. 60,000 Average Day Population Growth in Queenstown Usually Resident Private Residences Commercial Accommodation Day Visitors 50,000 40,000 30,000 20,000 10, Note: where the above key refers to Private Residences and Commercial Accommodation it is referring to the number of visitors staying in the two respective types of accommodation. The number of visitors staying in Private Residences includes absentee owners staying in their holiday homes. On an average day, the population in Queenstown is made up mainly of residents. The proportion of these various components is expected to stay relatively constant over time. The areas with the most significant growth in the average day population are Frankton Flats, the Wakatipu Basin and Kelvin Heights. This is because of the relatively extensive areas of zoned land in those areas for growth and the lack of any other significant constraints on growth in these areas (in terms of roading and services).
12 12 The peak day projections for Queenstown 90,000 80,000 70,000 60,000 50,000 40,000 30,000 20,000 10,000 0 Peak Day Population Growth in Queenstown Usually Resident Private Residences Commercial Accommodation Day Visitors Note: where the above key refers to Private Residences and Commercial Accommodation it is referring to the number of visitors staying in the two respective types of accommodation. The number of visitors staying in Private Residences includes absentee owners staying in their holiday homes. On the peak day, the population in Queenstown is mainly made up of people who are not permanent residents. Essentially, around 1/3 of all people in Queenstown will be permanent residents, 1/3 will be absentee owners and visitors (who may often be friends and family) staying in private residences, and 1/3 will be staying in commercial accommodation or day visitors. That said, the greatest proportion of overnight visitors is expected to stay in private residences (i.e. in holiday homes or as guests of permanent residents). The average number of visitors and absentee owners staying in a private residence on the peak day is assumed to be 2 visitors per dwelling in 2001 reducing down to 1.74 by The number of visitors staying in commercial accommodation is based on the assumption of 100% occupancy of visitor units and 2 occupants per unit. It is considered worthwhile to make the distinction between absentee owners and those staying in private residences and those true visitors who stay in commercial accommodation. For example, it is considered that absentee owners are likely to have quite a different relationship and impact on the local community, the economy, and the use of some services and often become an integral part of the peak community year after year. Dwelling and visitor accommodation growth projections for Queenstown 30,000 25,000 20,000 15,000 10,000 5,000 0 Dwelling Growth in Queenstown Occupied Unoccupied Visitor Units The proportion of visitor units to total dwellings is estimated to be 46.8% in 2006 reducing to 36.0% by 2026, based on an expectation that as the centres grow in size, more of the second homes will be taken up by permanent residents. This means that currently there is nearly one visitor unit for every residential dwelling. By 2026 the number of residential dwellings is expected to have increased at a higher rate than visitor units meaning that there will be nearly two residential dwellings for every visitor unit. Once again the areas with the most significant growth in the number of dwellings are Frankton Flats, the Wakatipu Basin, and Kelvin Heights (for the reasons outlined on page 9). It is projected that the percentage of unoccupied homes will decrease from 27% in 2006 to 20% in 2026 as a result of the trend away from holiday homes. Note that these are average day occupancy percentages.

13 13 Growth Forecasts for Wanaka The Wanaka Study Area is shown on the map below shown within the dotted line. All the figures in this section relate only to that area. The outlying smaller communities are dealt with in the following part of this volume entitled Growth forecasts for smaller communities. The average day population projections for Wanaka Average Day Population Growth in Wanaka Usually Resident Private Residences Commercial Accommodation Day Visitors 25,000 20,000 15,000 10,000 5, Note: where the above key refers to Private Residences and Commercial Accommodation it is referring to the number of visitors staying in the two respective types of accommodation. The number of visitors staying in Private Residences includes absentee owners staying in their holiday homes. On an average day, the population in Wanaka is made up mainly of residents. The proportion of these various components is expected to stay relatively constant. The areas with the most significant growth in the average day population are Wanaka South and Beacon Point. This is because of the relatively extensive areas of land zoned and proposed for growth and the lack of any other significant constraints on growth in these areas (in terms of roading and services)..
14 14 The peak day projections for Wanaka Peak Day Population Growth in Wanaka Dwelling and visitor accommodation growth projections for Wanaka Dwelling Growth in Wanaka Usually Resident Private Residences Commercial Accommodation Day Visitors Occupied Unoccupied Visitor Units 50,000 12,000 45,000 40,000 10,000 35,000 30,000 8,000 25,000 6,000 20,000 15,000 4,000 10,000 5,000 2, Note: where the above key refers to Private Residences and Commercial Accommodation it is referring to the number of visitors staying in the two respective types of accommodation. The number of visitors staying in Private Residences includes absentee owners staying in their holiday homes. On the peak day, the population in Wanaka is made up mainly of absentee owners and visitors staying in private residences (who would often be friends and family of home owners). The greatest proportion of all visitors to Wanaka are expected to stay in private residences (i.e. in holiday homes or as guests of permanent residents). The number of visitors and absentee owners staying in a private residence is assumed to be 3.8 in 2001 reducing down to 3.3 by This high number of visitors per private residence is a result of the high number of holiday homes in Wanaka (estimated at 38% of all residential dwellings in the 2004/05 Peak Population Survey). The number of visitors staying in commercial accommodation is based on the assumption of 100% occupancy of visitor units and 2 occupants per unit. The proportion of visitor units to total dwellings is estimated to be 39.4% in 2006 reducing to 33.1% by It should be noted that the increase here is accentuated by the assumption that all future visitor units required in the Wanaka and Hawea area have been assumed to occur in Wanaka rather than its outlying areas. Once again the areas with the most significant growth in the number of dwellings are Beacon Point and Wanaka South for the reasons outlined on page 13. It is projected that the percentage of unoccupied homes will decrease from 41% in 2006 to 33% in 2026 as a result of the trend away from holiday homes. Note that these are average day occupancy percentages.

15 15 Growth Forecasts for Small Communities The small communities included in this section are: Glenorchy, Kingston, Cardrona, Luggate, Hawea and Hawea Flat and Makarora. The areas that are considered to be captured within each of these communities are shown in the map on the following page. These areas are based on the mesh block areas used by Statistics New Zealand. It is noted that the information for these townships may not be as accurate as for the main centres as the visitor information, peak population data, and the relationship between visitor and resident growth is not as well understood for the townships. In addition, the fact that the projections are being derived from a very small base also tends to reduce the accuracy. Average Day Population Growth in the Small Communities 3,000 Cardrona Makarora Luggate Hawea Glenorchy Kingston 2,500 2,000 1,500 1, All of the small communities are expected to grow over the next twenty years with the growth rates ranging from 2.6% per annum to 4.2% per annum. The small communities in the Wanaka area are showing the higher 4.2% growth with Kingston and Glenorchy down at 2.6% growth. The large population shown for Hawea is a result of the large meshblock which includes the Hawea Flat area and the land between Hawea and Wanaka, which has substantial rural residential development capacity.
16 16 Peak Day Population Growth for Small Communities Being small communities and popular holiday spots the population can increase significantly for certain events and times of the year. The highest proportion of visitors to these small communities will be staying in private residences; however Cardrona, Makarora and Glenorchy also have a high proportion staying in commercial accommodation. Dwelling Growth in Small Communities The significant dwelling growth shown for each small community has been based on the high projections produced by Statistics New Zealand. It is noted that only minimal work has been undertaken to check this unrestricted growth against the current zoned land and it is likely that further work of this nature will be required in the future in order to determine whether projected growth demands can be accommodated without additional zoning. Peak Day Population Growth in the Small Communities Dwelling Growth in the Small Communities Cardrona Makarora Luggate Hawea Glenorchy Kingston Cardrona Makarora Luggate Hawea Glenorchy Kingston 10,000 1,800 9,000 8,000 7,000 6,000 5,000 4,000 3,000 2,000 1,000 1,600 1,400 1,200 1,
17 17

18 18 3. ASSESSMENT - WHAT DO WE KNOW ABOUT TRENDS AND THE SITUATION TODAY? Introduction It is always useful when formulating projections to consider what we know about the growth that has occurred in the past and what the situation is today. Permanent resident population growth The following graph shows the actual growth of the resident population of the district, since The most recent estimate from Statistics New Zealand places the population of the district at just under 20,000 people. Whilst this estimate aligns well with the Council s estimated 2006 usually resident population, it is considered to be of only limited value in that it does not include visitors and absentee owners, which the council estimates add another 12,000 odd people to the population on an average day. We will only know the actual figure once the 2006 census results are reported. Unfortunately much of this information comes from the last census (conducted in 2001) and we do not have current information about key aspects of our community. Therefore, in this section sometimes we must rely on 2001 data as our best estimate of the situation today. The new information from the 2006 census is expected to be available in early 2007, at which time the council will start reviewing its projections using the new baseline information. It is expected that a new stand alone statistics and projections document will be prepared in mid 2007 and that this work will be incorporated into the council s 2009 CCP. You should also look on the Statistics NZ website throughout 2006 and 2007 for updates on the publication of this information. The Council is producing a series of community outcome reports in conjunction with its CCP. These Community Outcome Reports provide an indication of the state of our district in terms of the four well beings; cultural, social, environmental, and economic. This will progressively improve the value and usability of this information for the Council, the community, and other agencies. Population 18,000 16,000 14,000 12,000 10,000 8,000 6,000 4,000 2,000 0 Total Population Growth District Total Linear (Wanaka (Urban & Locality)) Linear (Queenstow n (Urban & Locality)) This more detailed information will be used by council in its strategic planning along with the projections contained in this volume of the CCP. Year What is interesting to note is that in the Wanaka area, growth has been strongest in the urban settlement, while in Queenstown, growth has been fastest in the surrounding locality 1. The share of the district s growth that is accommodated by the two main settlements of the district has remained relatively steady over the past 10 years, with around 20% of the population residing in the Wanaka urban area and 70% in the Queenstown urban area. Within the Queenstown urban area, the fastest growing areas have been the Frankton and Sunshine Bay areas; areas on the edge of the settlement. Central Queenstown has seen the slowest increase in the permanent population. While the figures show that we are essentially an urban based district, it is interesting to note that the proportion of growth that is occurring in the rural areas (including the areas zoned for rural living purposes) has increased between 1996 and The Wanaka Census Area Unit has increased in size between 1991 and 2001
19 19 This is of some concern in that it shows that market forces are running contrary to the Tomorrow s Queenstown growth management strategy, which seeks to contain growth within a defined urban area. It is noted that the Council is very clear about its objective to contain growth within the urban growth boundary and the zoned rural living areas. Housing A significant issue is the number of existing dwelling units in the district and the number that will be required in the future, in order to accommodate the projected number of residents (permanent and transient) and visitors. The six monthly dwelling capacity model keeps a running tally of the amount of existing capacity for growth within the zoned areas. Growth in total dwellings (occupied and unoccupied) The following table shows the growth in total dwellings occupied and unoccupied at the night of the 2001 census, by study area. Area Change % Change Wanaka urban 1,731 2, % Queenstown urban 3,198 4,644 1,446 45% Queenstown locality 1,293 1, % Total district 7,164 10,491 3,327 46% Source: 2001 Census Average occupancy rates have increased from 2.1 people per house to 2.39 people in Wanaka, and from 2.4 people per house to 2.5 in Queenstown. This is a desirable trend in that it means that better use is being made of the existing housing stock. However, clearly this trend will not continue forever and it is likely that occupancy rates will begin to settle down as they are now close to the national average. Occupied and unoccupied dwellings and 2001 Census Urban Area Occupied Unoccupied Wanaka urban 51% 56% 49% 44% Queenstown urban 66% 75% 34% 25% Source: 2001 Census In Wanaka proportion of unoccupied to occupied homes has changed only marginally (with slightly more occupied homes in 2001 than in In Queenstown, the proportion of unoccupied homes has dropped from around 1/3 of all the housing stock to 1/4, which is considered to be a positive trend. Types of occupied dwellings and 2001 Stand-alone housing dominates in Wanaka, while in Queenstown flats and apartments are an important part of the market. Between 1996 and 2001 attached housing types (such as apartments and flats) increased in Queenstown as a proportion of occupied dwellings. Urban Area Detached Attached Wanaka 79.2% 79.7% 10.4% 13.0% Queenstown 54.6% 51.3% 38.8% 43.0% Source: 2001 Census Household composition In both Wanaka and Queenstown, there are more households formed by singles and couples than in the district as a whole. Queenstown is notable for the number of non-family households, being households of unrelated people flatting together. This again reinforces the point that Queenstown is increasingly the home of younger people attracted by the work opportunities and lifestyle, while families are more attracted to the surrounding district. This statistic is of value in understanding housing affordability and availability issues and the possible solutions to these issues. A related issue which is of utmost importance to this district is the number of homes in the area that are not occupied all year. In Wanaka, over 40% of homes are not occupied all of the time these are holiday/ second homes.
20 20 Area One Person households Couples Families Wanaka urban 23.3% 38.0% 32.5% 6.2% Queenstown urban 25.4% 28.9% 31.3% 14.4% District 21.9% 33.2% 35.0% 9.9% Source: 2001 Census Household composition in more detail No. of residents Household composition two usual residents 77 % are couples only (with or without others) three usual residents four usual residents five usual residents six or more usual residents Households with unrelated people 39 % are a couple with dependent children (with or without others) 71% are a couple with dependent children (with or without others) 80% are a couple with dependent children (with or without others) 72% are a couple with dependent children (with or without others) Source: 2001 Census This table provides a more detailed breakdown of household composition in the Queenstown Lakes District. Whereas most compositions are fairly normal, the fact that only 39% of 3 person homes are made up of a couple and a child is unusual. Who typically makes up the three person homes in the district? The unusual composition is in the homes comprising 3 usual residents. It is noted that 3 person homes make up 18% of all homes. The norm of a couple with one child occurs only 39% of the time. The rest of the time the makeup is split between couple only (with or without others) which happens 16% of the time, couple with other children (with or without others) which happens 14% of the time, one parent with dependant children which happens 12% of the time and other multi person household (flatmates) which happens 17% of the time. Household Composition Couple only (with or without others) 16% Couple with dependent children (with or without others) 39% Couple with other children (with or without others) 14% One parent with dependent children 12% One parent with other children 2% Two family household with dependent children 0% Other multi-person household 17% Source: 2001 Census Who owns the homes and property in the district? Three Usual Residents The following table provides an indication of ownership of all rateable properties, based on the address that the rate accounts are sent to. Whilst there is clearly some margin of error in assuming that people s address for service is also their usual place of residence, it is still considered to provide a useful indication of the usual place of residence of landowners. Rateable Property numbers Total 16, % Local (QLDC) 9,029 55% Other national 6,452 39% Auckland % Wellington 258 4% Nelson 69 1% Christchurch % Dunedin 1,433 22% Invercargill % Others 1,974 31% International 1,082 7% Source: Queenstown Lakes District Council rates data January 2005.
21 21 Median household income area area family median income area personal median income couple no child one child two child three child QLDC 57,301 23,013 55,180 54,791 62,023 66,517 (2001) QLDC (2006) projected 67,329 35,152 64,837 64,379 72,877 78,157 Source: 2001 Census The above table shows median income for the Queenstown Lakes District for 2001 and 2006 (projected). The 2001 data has been inflated by 3.5% per annum to provide an estimate for the median income in These assumptions were based on the NZ Remuneration Review, September This is considered to be key information in order to better understand and address affordability issues in the district. Age Structure Changes in the age structure of the usually resident population create differing demands on social and community infrastructure, as well as for housing. Over the 10 years between 1991 and 2001, the biggest change in the age structure in Wanaka has been the growth of the age band. This implies that the settlement is attractive to people and families in their middle years. The number of younger people (0-19 age bands) has also increased indicating a growing demand for educational and recreational activities. Growth of both groups further suggests increasing demands for retail and commercial services associated with a growing home-based population. In contrast, in Queenstown the largest growth has been in the year age band, an age group often underrepresented in provincial cities and towns. This age group is more associated with entertainment and leisure-based consumption, and renting rather than home ownership. In both settlements, the number of older adults has also increased, suggesting that both settlements are still seen as a retirement destination, but more so for Wanaka than Queenstown. As a result of these trends, Queenstown s age profile has got a lot younger than it was 10 years ago. In Wanaka, the change is less dramatic, and has seen the population get a bit more middle aged. Share of population by age bands Queenstown urban Wanaka urban area Age band area % 23% 24% 22% % 26% 42% 45% % 34% 27% 25% % 17% 8% 8% Total 100% 100% 100% 100% Source: 2001 Census In the surrounding Queenstown locality which has been growing faster than the Queenstown urban area most growth has been in the age band, mirroring the trend in Wanaka. Again this highlights the growing dichotomy between the Queenstown urban area and the surrounding district. The centre is characterised by a large number of younger people and a high proportion of temporary residents, while the surrounding district has more of a family focus. Jobs and Employment It is very useful to understand the recent growth trends in the various industry sectors and the jobs that have been created in each sector. The following information provides the most up to date information in this regard. The Council is currently undertaking work to better understand what capacity exists in the existing zoned land and what additional zoning needs to be added into the future. This information is expected to available by mid That said, as a result of the Growth Options Study the council is already well aware that a considerable amount of additional industrial land will need to be developed in the foreseeable future in order to cater for demand. The 2001 census records that of the usually resident population aged 15 and over, 10,140 people were employed in full-time or part-time work. This is an increase from 8,469 people in Note that these figures are not the number of jobs in the Queenstown area as some people who live outside the district will drive to jobs in the area, although this will be a small figure. In terms of the ratio of employment to people of working age (15-65 years old), the ratio is relatively high, indicating that most adults work, and as a result most people moving into the area would appear to do so for work-related purposes.
22 22 People of working age Population aged Number of usually Ratio population Year years resident people to people employed employed ,380 8, ,267 10, % Increase % 20% Source: 2001 Census Growth Rate 100% 90% 80% 70% 60% 50% 40% 30% 20% 10% 0% Percentage Growth in each sector in Queenstown The number of jobs in each sector and the growth of each sector Retail Construction Manufacturing, transport, wholesale Business Accommodation Community Queenstown The following 2 graphs provide the most recent data relating to relative size of each employment sector and which seem to be the fastest growing sectors. This data is just for the Queenstown study area (see map page 11) and does not include the other outlying townships. As can be seen the accommodation sector remains the most dominant sector but, interestingly, has not shown significant growth in the past 5 years in the way that other sectors have. Construction and business sectors have experienced by far the highest growth rates. Sector Source: Statistics NZ Business Demographic Statistics No of jobs in each sector in Queenstown (part time and full time) No of jobs Sector Retail Construction Manufacturing, transport, wholesale Business Accommodation Community Sector Source: Statistics NZ Business Demographic Statistics
23 23 Wanaka The following 2 graphs provide the most recent data relating to relative size of each employment sector and which seem to be the fastest growing sectors. This data is just for the Wanaka study area (see map on page 13) and does not include the other outlying townships. As can be seen the accommodation sector remains the most dominant sector closely followed by retail, business and community sectors. As with Queenstown, the accommodation sector has seen little growth in this 4 year period whereas the growth in employment in the business sectors (followed by construction) is significant. Growth Rate 350% 300% 250% 200% 150% 100% 50% 0% Percantage Growth in each sector in Wanaka Construction No of jobs in each sector in Wanaka (part time and full time) No of Jobs Manufacturing, transport, wholesale Retail Business Accommodation Community Sector Source: Statistics NZ Business Demographic Statistics Retail Construction Accommodation Business Community Employment projections and the future needs for more zoned land Manufacturing, transport, wholesale The Council is currently putting resource into gathering accurate information on this aspect of growth and it is expected to be released in mid 2006 for the main centres and in 2007 for the smaller communities. Sector Source: Statistics NZ Business Demographic Statistics
24 24 4. DETAILED PROJECTIONS Detailed information is provided on the following pages of this volume. The information is sorted by area (so that you can view all the information about a particular area such as Kelvin Heights) and also by growth type; for example, the number of visitors, the number of dwellings. The following tables are a summary of the detailed growth projections beginning on page 27. Average Day Population Wakatipu Ward Visitors staying in: Private residence Commercial accommodation Day visitors Townships Total visitors Usually resident (permanent resident population) Total Average Day Population Wanaka Visitors staying in: Private residence Commercial accommodation Day visitors Townships Total visitors Usually resident (permanent resident population) Total Average Day Population District Visitors staying in: Private residence Commercial accommodation Day visitors Townships Total visitors Usually resident (permanent resident population) Total
 11771 14148 17642")
25 25 Peak Day Population Wakatipu Ward Peak Day Population District Visitors staying in: Private residence Commercial accommodation Day visitors Total visitors Usually resident (permanent resident population) Total Visitors staying in: Private residence Commercial accommodation Day visitors Total visitors Usually resident (permanent resident population) Total Peak Day Population Wanaka Ward Visitors staying in: Private residence Commercial accommodation Day visitors Total visitors Usually resident (permanent resident population) Total
WANAKA SWIMMING FACILITIES STATEMENT OF PROPOSAL
 WANAKA SWIMMING FACILITIES STATEMENT OF PROPOSAL 17 October 2014 Contents Executive Summary Background National Guidelines The Status Quo Issue One Timing Issue Two Location Issue Three Size Issue Four
Population & Demographics
 Population & Demographics Conditions and Trends When looking at trends in the total number of people living in Windham (population) and at the characteristics of the people who live here by factors such
Summary of Proposal to Upgrade Swimming Facilities for the Wanaka Ward
 Attachment B Summary of Proposal to Upgrade Swimming Facilities for the Wanaka Ward Introduction The Queenstown Lakes District Council is proposing to build an eight lane lap pool and a learners pool costing
Section 2 Strategic Alignment. Contents
 Section 2 Strategic Alignment Contents 2 Strategic Alignment... 2 2.1 General... 2 2.2 SmartGrowth Strategy and Implementation Plan... 2 2.3 Walking and Cycling Strategy... 3 2.4 Built Environment Strategy...
MANITOBA'S ABORIGINAL COMMUNITY: A 2001 TO 2026 POPULATION & DEMOGRAPHIC PROFILE
 MANITOBA'S ABORIGINAL COMMUNITY: A 2001 TO 2026 POPULATION & DEMOGRAPHIC PROFILE MBS 2005-4 JULY 2005 TABLE OF CONTENTS I. Executive Summary 3 II. Introduction.. 9 PAGE III. IV. Projected Aboriginal Identity
Active Travel Strategy Dumfries and Galloway
 Active Travel Strategy Dumfries and Galloway Our Active Travel Strategy The agreed Interventions for Dumfries and Galloway Council s Local Transport Strategy includes an action to Develop an Active Travel
Acknowledgements. Ms. Linda Banister Ms. Tracy With Mr. Hassan Shaheen Mr. Scott Johnston
 Acknowledgements The 2005 Household Travel Survey was funded by the City of Edmonton and Alberta Infrastructure and Transportation (AIT). The survey was led by a steering committee comprised of: Dr. Alan
QUEENSTOWN TOWN CENTRE TRANSPORT STRATEGY
 QUEENSTOWN TOWN CENTRE TRANSPORT STRATEGY Consultation Document April 2015 This is a summary of the Draft Strategy, which is on the Council s website at www.qldc.govt.nz The summary is designed as an introduction
REPORT OF THE ENGINEERING & PLANNING DEPARTMENT PLANNING DIVISION
 REPORT OF THE ENGINEERING & PLANNING DEPARTMENT PLANNING DIVISION 2008 09 22 TO: Mayor John Rowswell and Members of City Council SUBJECT: Official Plan Review 2008 Part 1 - Population and Household Projections
Domestic Energy Fact File (2006): Owner occupied, Local authority, Private rented and Registered social landlord homes
: Owner occupied, Local authority, Private rented and Registered social landlord homes") Domestic Energy Fact File (2006): Owner occupied, Local authority, Private rented and Registered social landlord homes Domestic Energy Fact File (2006): Owner occupied, Local authority, Private rented
Domestic Energy Fact File (2006): Owner occupied, Local authority, Private rented and Registered social landlord homes Domestic Energy Fact File (2006): Owner occupied, Local authority, Private rented
Student Population Projections By Residence. School Year 2016/2017 Report Projections 2017/ /27. Prepared by:
 Student Population Projections By Residence School Year 2016/2017 Report Projections 2017/18 2026/27 Prepared by: Revised October 31, 2016 Los Gatos Union School District TABLE OF CONTENTS Introduction
Golfers in Colorado: The Role of Golf in Recreational and Tourism Lifestyles and Expenditures
 Golfers in Colorado: The Role of Golf in Recreational and Tourism Lifestyles and Expenditures by Josh Wilson, Phil Watson, Dawn Thilmany and Steve Davies Graduate Research Assistants, Associate Professor
Determining bicycle infrastructure preferences A case study of Dublin
 *Manuscript Click here to view linked References 1 Determining bicycle infrastructure preferences A case study of Dublin Brian Caulfield 1, Elaine Brick 2, Orla Thérèse McCarthy 1 1 Department of Civil,
Rochester Area Bike Sharing Program Study
 roc bike share Rochester Area Bike Sharing Program Study Executive Summary ~ January 2015 JANUARY 2015 8484 Georgia Avenue, Suite 800 Silver Spring, MD 20910 3495 Winton Pl., Bldg E, Suite 110 Rochester,
Exhibit 1 PLANNING COMMISSION AGENDA ITEM
 Exhibit 1 PLANNING COMMISSION AGENDA ITEM Project Name: Grand Junction Circulation Plan Grand Junction Complete Streets Policy Applicant: City of Grand Junction Representative: David Thornton Address:
DRAFT for a State Policy for Healthy Spaces and Places
 DRAFT for a State Policy for Healthy Spaces and Places 1 DRAFT State Policy for Healthy spaces and Places 1. Purpose To encourage the use and development of land that builds healthy communities through
Briefing Paper #1. An Overview of Regional Demand and Mode Share
 2011 Metro Vancouver Regional Trip Diary Survey Briefing Paper #1 An Overview of Regional Demand and Mode Share Introduction The 2011 Metro Vancouver Regional Trip Diary Survey is the latest survey conducted
TRANSPORTATION TOMORROW SURVEY
 Clause No. 15 in Report No. 7 of was adopted, without amendment, by the Council of The Regional Municipality of York at its meeting held on April 17, 2014. 15 2011 TRANSPORTATION TOMORROW SURVEY recommends
Report to COUNCIL for decision
 17 152 Title: Section: Prepared by: Olympic Pool Business Case Community & Recreation Andrew White (Community & Recreation Manager) Meeting Date: 18 May 2017 Legal Financial Significance = Medium Report
Texas Housing Markets: Metropolitan vs. Border Communities. September 22, 2014
 Texas Housing Markets: Metropolitan vs. Border Communities Luis Bernardo Torres Ruiz, Ph.D. Research Economist El Paso Branch Dallas Federal Rio Grande Economic Association September 22, 2014 Contents
1999 On-Board Sacramento Regional Transit District Survey
 SACOG-00-009 1999 On-Board Sacramento Regional Transit District Survey June 2000 Sacramento Area Council of Governments 1999 On-Board Sacramento Regional Transit District Survey June 2000 Table of Contents
CENTRAL OTAGO DISTRICT COUNCIL
 CENTRAL OTAGO DISTRICT COUNCIL DATE: 1 December, 2008 SUBJECT: Blossom Festival Research Survey Report 2008 (EDT 01-02-11) Purpose The purpose of this report is to summarise the outcomes of a visitor survey
12. School travel Introduction. Part III Chapter 12. School travel
 12. School travel 12.1 Introduction This chapter presents the evidence on changes in travel patterns for the journey to school in the three towns over the period of the Sustainable Travel Town project.
Clackmannanshire Council. Housing Need and Demand Assessment. 1.0 Introduction
 Clackmannanshire Council Housing Need and Demand Assessment 1.0 Introduction Establishing a clear picture of housing need and demand in Clackmannanshire is essential to inform Council policy in relation
Wanaka Community Board 16 November Report for Agenda Item: 1. Temporary Road Closure - Challenge Wanaka Triathlon Event 2017
 Wanaka Community Board 16 November 2016 Department: Property & Infrastructure Report for Agenda Item: 1 Temporary Road Closure - Challenge Wanaka Triathlon Event 2017 Purpose 1 The purpose of this report
TARANAKI VISITOR STATISTICS SEPTEMBER 2017
 TARANAKI VISITOR STATISTICS SEPTEMBER 217 Taranaki Visitor Statistics At a Glance: Year ending September 217 For the 12 months ending September 217 there were 38,288 visitors who stayed in commercial accommodation
Compression Study: City, State. City Convention & Visitors Bureau. Prepared for
 : City, State Prepared for City Convention & Visitors Bureau Table of Contents City Convention & Visitors Bureau... 1 Executive Summary... 3 Introduction... 4 Approach and Methodology... 4 General Characteristics
ANNEX1 The investment required to achieve the Government s ambition to double cycling activity by 2025
 ANNEX1 The investment required to achieve the Government s ambition to double cycling activity by 2025 May 2016 About Sustrans Sustrans makes smarter travel choices possible, desirable and inevitable.
Nevada County Population Projections 2013 to 2032 Based On The Last Estimate Year of 2012
 Nevada County Population Projections 2013 to 2032 Based On The Last Estimate Year of 2012 Prepared By: The Nevada State Demographer s Office Jeff Hardcastle, AICP NV State Demographer University of NV
Modal Shift in the Boulder Valley 1990 to 2009
 Modal Shift in the Boulder Valley 1990 to 2009 May 2010 Prepared for the City of Boulder by National Research Center, Inc. 3005 30th Street Boulder, CO 80301 (303) 444-7863 www.n-r-c.com Table of Contents
GD 0043/18 ACTIVE TRAVEL STRATEGY
 GD 0043/18 ACTIVE TRAVEL STRATEGY 2018-2021 May 2018 Minister s Introduction There is strong evidence that regular physical activity reduces the risk of a range of health conditions. The best way to increase
Transportation Master Plan Advisory Task Force
 Transportation Master Plan Advisory Task Force Network Alternatives & Phasing Strategy February 2016 BACKGROUND Table of Contents BACKGROUND Purpose & Introduction 2 Linking the TMP to Key Council Approved
Appendix 22 Sea angling from a private or chartered boat
 Appendix 22 Sea angling from a private or chartered boat LUC SMRTS2015 Final Report 359 March 2016 Appendix 22 Sea angling from a private or chartered boat Table A22.1: Summary of sample confidence levels
Active Travel Towns Funding Scheme Project Proposal. Sligo. Sligo Local Authorities
 Active Travel Towns Funding Scheme 2014-2016 Project Proposal for Sligo by Sligo Local Authorities Introduction Over the last two years, Sligo Local Authorities have implemented years 1 & 2 of their 5
Walkable Retail: When Old Becomes New Again Part 1
 Walkable Retail: When Old Becomes New Again Part 1 By Erin Talkington, Vice President, and Jacob Ross, Associate You have probably read the following headline thousands of times, perhaps this year alone:
WILMAPCO Public Opinion Survey Summary of Results
 Wilmington Area Planning Council WILMAPCO Public Opinion Survey Summary of Results Prepared by: 2955 Valmont Road, Suite 300 Boulder, Colorado 80301 t: 303-444-7863 f: 303-444-1145 www.n-r-c.com Table
Appendix 1 Transit Network Analysis
 Appendix 1 Transit Network Analysis APPENDIX 1 TRANSIT NETWORK ANALYSIS The purpose of this appendix is to provide an update on the transit network analysis as it pertains to: i. SmartTrack ii. Scarborough
Proportion (%) of Total UK Adult Population (16+)s. Participating in any Watersports Activity
 of Total UK Adult Population (16+)s. Participating in any Watersports Activity") Proportion (%) of Total UK Adult Population (16+)s Participating in any Watersports Activity Headlines Participation in any activities up 2.1% point 14.3m UK adults participating Highest volume recorded
Proportion (%) of Total UK Adult Population (16+)s Participating in any Watersports Activity Headlines Participation in any activities up 2.1% point 14.3m UK adults participating Highest volume recorded
CRICKET VICTORIA-CRICKET AUSTRALIA SUBMISSION TO INFRASTRUCTURE VICTORIA LAYING THE FOUNDATIONS DRAFT PLAN 10 MARCH 2016
 CRICKET VICTORIA-CRICKET AUSTRALIA SUBMISSION TO INFRASTRUCTURE VICTORIA LAYING THE FOUNDATIONS DRAFT PLAN 1. INTRODUCTION 10 MARCH 2016 Thank you for the opportunity to provide a submission in response
Oakmont: Who are we?
 Oakmont: Who are we? A Snapshot of our community from the April 2010 US Census Contents Age and Gender... 1 Marital Status... 2 Home Ownership and Tenure... 3 Past Demographic Characteristics... 5 Income
TOUR DE FRANCE GRAND DÉPART YORKSHIRE
 TOUR DE FRANCE GRAND DÉPART YORKSHIRE Economic Impact Assessment Report for Calderdale Metropolitan Borough Council New Economy www.neweconomymanchester.com 28 September 2012 New Economy 1 1 Introduction
Appendix 21 Sea angling from the shore
 Appendix 21 Sea angling from the shore LUC SMRTS2015 Final Report 342 March 2016 Appendix 21 Sea angling from the shore Table A21.1: Summary of sample confidence levels Responses Spatial data Questionnaire
Aspen Snowmass Transient Lodging Inventory Study as of July 1, 2012
 INTRODUCTION A benchmark transient lodging inventory study was conducted by MTRiP on behalf of Aspen Skiing Company during the summer of 2008 for inventory in the City of Aspen and the Town of Snowmass
City of Perth Cycle Plan 2029
 Bicycling Western Australia s response City of Perth Cycle Plan 2029 2012-2021 More People Cycling More Often ABOUT BICYCLING WESTERN AUSTRALIA Bicycling Western Australia is a community based, not-for-profit
QLDC Council 29 October Report for Agenda Item: 3
 QLDC Council 29 October 2015 Department: Infrastructure Beach Street Pedestrianisation Purpose Report for Agenda Item: 3 1 The purpose of this report is to obtain Council approval to consult over options
City of Elizabeth City Neighborhood Traffic Calming Policy and Guidelines
 City of Elizabeth City Neighborhood Traffic Calming Policy and Guidelines I. Purpose: The City of Elizabeth City is committed to ensure the overall safety and livability of residential neighborhoods. One
PERSONALISED TRAVEL PLANNING IN MIDLETON, COUNTY CORK
 PERSONALISED TRAVEL PLANNING IN MIDLETON, COUNTY CORK Elaine Brick Principal Transport Planner AECOM Abstract Smarter Travel funding was awarded to the Chartered Institute of Highways and Transportation
Shotover Country. Proposed Private Plan Change. Transportation Assessment Report. February 2010
 Shotover Country Proposed Private Plan Change February 2010 PO Box 13 835, Armagh Christchurch 8141 P: +64 3 379 2404 www.tdg.co.nz New Zealand Shotover Country Proposed Private Plan Change Quality Assurance
Cork to Limerick Route Pre-Feasibility Study Update
 Cork to Limerick Route Pre-Feasibility Study Update November 2008 Document Title: Cork to Limerick Route Pre-Feasibility Study Update Document Ref(s). : Date Rev Status Originator Checked Approved 01/12/08
AS91430: Cycleways Waiopehu College Year 13 Geography Matt Reeves
 AS91430: Cycleways Waiopehu College Year 13 Geography Matt Reeves December 2017 AS91430: Cycleways Cycling is an activity that a large proportion of our national population decides to enjoy and participate
Cycle journeys on the Anderston-Argyle Street footbridge: a descriptive analysis. Karen McPherson. Glasgow Centre for Population Health
 Cycle journeys on the Anderston-Argyle Street footbridge: a descriptive analysis Karen McPherson Glasgow Centre for Population Health March 2017 Key points: There were 116,334 cycle journeys made using
Update June 2018 OUR 2017 PUBLIC ENGAGEMENT
 Update June 2018 Hi, Let s Get Wellington Moving (LGWM) is developing a Recommended Programme of Investment (RPI) that meets our programme objectives and supports the city s and region s growth. As part
2011 Origin-Destination Survey Bicycle Profile
 TRANS Committee 2011 Origin-Destination Survey National Capital Region December 2012 TRANS Committee Members: City of Ottawa, including OC Transpo Ville de Gatineau Société de transport de l Outaouais
Fixed Guideway Transit Outcomes on Rents, Jobs, and People and Housing
 Fixed Guideway Transit Outcomes on Rents, Jobs, and People and Housing Arthur C. Nelson, Ph.D., ASCE, FAICP Professor of Planning and Real Estate Development University of Arizona 1 Changing Transportation
Heaphy Track Mountain Bike Trial
 Heaphy Track Mountain Bike Trial 2011-2013 September 2013 Report prepared by Jane Roberts, Eric de Boer, Ian Wightwick photo: Stephen Roberts 1 INTRODUCTION In December 2010 the Department of Conservation
TRIP GENERATION RATES FOR SOUTH AFRICAN GOLF CLUBS AND ESTATES
 TRIP GENERATION RATES FOR SOUTH AFRICAN GOLF CLUBS AND ESTATES M M Withers and C J Bester Department of Civil Engineering University of Stellenbosch, Private Bag X1, Matieland, 7602 ABSTRACT There has
ECONOMIC DEVELOPMENT ELEMENT
 ECONOMIC DEVELOPMENT ELEMENT Background The Economic Development Element considers labor force and labor force characteristics, employment by place of work and residence, and analysis of the community
Mobility and Congestion
 Technical Memorandum Mobility and Congestion Prepared for: Prepared by: September 25, 2013 1 Table of Contents 1. Introduction... 1 2. Congestion Forecasting Process... 1 2.1 Mobility and Congestion Terms...
A Threatened Bay: Challenges to the Future of the Penobscot Bay Region and its Communities
 A Threatened Bay: Challenges to the Future of the Penobscot Bay Region and its Communities 1 A A Threatened Bay: Challenges to the Future of the Penobscot Bay Region and its Communities In 1996 the Island
Baseline Survey of New Zealanders' Attitudes and Behaviours towards Cycling in Urban Settings
 Baseline Survey of New Zealanders' Attitudes and Behaviours towards Cycling in Urban Settings Highlights 67% of urban New Zealanders, 18 years of age or more own or have access to a bicycle that is in
Making Dublin More Accessible: The dublinbikes Scheme. Martin Rogers Colm Keenan 13th November 2012
 : The dublinbikes Scheme Martin Rogers Colm Keenan 13th November 2012 Modal Splits for Dublin 2001-2011 Dublin Mode Share Summary - Persons Crossing Canal Cordon 07.00-10.00 Year Total All PT % Car % Walk
Webinar: The Association Between Light Rail Transit, Streetcars and Bus Rapid Transit on Jobs, People and Rents
 Portland State University PDXScholar TREC Webinar Series Transportation Research and Education Center (TREC) 11-15-2016 Webinar: The Association Between Light Rail Transit, Streetcars and Bus Rapid Transit
Life Transitions and Travel Behaviour Study. Job changes and home moves disrupt established commuting patterns
 Life Transitions and Travel Behaviour Study Evidence Summary 2 Drivers of change to commuting mode Job changes and home moves disrupt established commuting patterns This leaflet summarises new analysis
Wellington Transport Strategy Model (WTSM) Update 2006
 Update 2006") Wellington Transport Strategy Model (WTSM) Update 2006 Final BASELINE FORECASTING REPORT February 2008 WTSM Update Baseline Forecasting Report Wellington Transport Strategy Model (WTSM) Update 2006 BASELINE
Wellington Transport Strategy Model (WTSM) Update 2006 Final BASELINE FORECASTING REPORT February 2008 WTSM Update Baseline Forecasting Report Wellington Transport Strategy Model (WTSM) Update 2006 BASELINE
Nebraska Births Report: A look at births, fertility rates, and natural change
 University of Nebraska Omaha DigitalCommons@UNO Publications since 2000 Center for Public Affairs Research 7-2008 Nebraska Births Report: A look at births, fertility rates, and natural change David J.
Draft Greater Sydney Region Plan
 Powered by TCPDF (www.tcpdf.org) Draft Greater Sydney Region Plan Submission_id: 31452 Date of Lodgment: 15 Dec 2017 Origin of Submission: Online Organisation name: UNSW Sydney Organisation type: Other
Coolest Cities Results Summary
 Coolest Cities Results Summary About Coolest Cities Canada s six largest urban areas provide homes and jobs for almost 15 million people, nearly half of our population. Transporting these citizens to and
THE PLANNING AND. Transport and the law Integrated transport planning Strategies Responsibilities of local government and road controlling authorities
 The planning and policy context Transport and the law Integrated transport planning Strategies Responsibilities of local government and road controlling authorities THE PLANNING AND POLICY CONTEXT Providing
Evaluating the Influence of R3 Treatments on Fishing License Sales in Pennsylvania
 Evaluating the Influence of R3 Treatments on Fishing License Sales in Pennsylvania Prepared for the: Pennsylvania Fish and Boat Commission Produced by: PO Box 6435 Fernandina Beach, FL 32035 Tel (904)
Exceeding expectations: The growth of walking in Vancouver and creating a more walkable city in the future through EcoDensity
 Exceeding expectations: The growth of walking in Vancouver and creating a more walkable city in the future through EcoDensity Melina Scholefield, P. Eng. Manager, Sustainability Group, City of Vancouver
Rural Ontario s Hidden Sector: The Economic Importance of the Horse Industry Final Report
 Rural Ontario s Hidden Sector: The Economic Importance of the Horse Industry Final Report - 2009 Photo Credit: J.W. Wilton Dr. Bronwynne Wilton and Dr. Wayne Caldwell University of Guelph 1 Executive Summary
2. Context. Existing framework. The context. The challenge. Transport Strategy
 Transport Strategy Providing quality connections Contents 1. Introduction 2. Context 3. Long-term direction 4. Three-year priorities 5. Strategy tree Wellington City Council July 2006 1. Introduction Wellington
COOPERATIVE EXTENSION Bringing the University to You
 COOPERATIVE EXTENSION Bringing the University to You Special Publication - 06-16 ECONOMIC IMPACT OF TOURISM ON COLORADO RIVER COMMUNITIES INCLUDING: LAUGHLIN BULLHEAD CITY FORT MOHAVE MOHAVE VALLEY GOLDEN
2009 Master Plan & Reexamination Report Verona, New Jersey
 2009 Master Plan & Reexamination Report Verona, New Jersey MASTER PLAN TOWNSHIP OF VERONA, NEW JERSEY PREPARED FOR THE PLANNING BOARD OF THE TOWNSHIP OF VERONA, NJ PREPARED BY KASLER ASSOCIATES, PA 34
Walking the Talk: Sustainable Transport and Urban Design in Four New Zealand Cities
 Walking the Talk: Sustainable Transport and Urban Design in Four New Zealand Cities INTRODUCTION Pilot study on sustainable transport and urban design at local government level Giving focus to further
WANAKA TRANSPORT - STRATEGIC CASE
 WANAKA TRANSPORT - STRATEGIC CASE PREPARED FOR QUEENSTOWN LAKES DISTRICT COUNCIL August 2018 This document has been prepared for the benefit of Queenstown Lake District Council. No liability is accepted
NORTH ADELAIDE LOCAL AREA TRAFFIC AND PARKING MANAGEMENT ENGAGEMENT OUTCOMES EXECUTIVE SUMMARY PREPARED FOR THE CITY OF ADELAIDE
 NORTH ADELAIDE LOCAL AREA TRAFFIC AND PARKING MANAGEMENT OUTCOMES EXECUTIVE SUMMARY PREPARED FOR THE CITY OF ADELAIDE 2 MAY 2017 NORTH ADELAIDE LATPM EXECUTIVE SUMMARY PAGE 1 OF 8 PROJECT BACKGROUND The
Dunedin One Way System (SH1) Cycle Survey Report
 Cycle Survey Report") Dunedin One Way System (SH1) Cycle Survey Report Report produced March 2014 (based on traffic surveys undertaken December 2013, and January & February 2014) 1 Preamble This report provides cycle count
Dunedin One Way System (SH1) Cycle Survey Report Report produced March 2014 (based on traffic surveys undertaken December 2013, and January & February 2014) 1 Preamble This report provides cycle count
Chapter 4 Traffic Analysis
 Chapter 4 Traffic Analysis PURPOSE The traffic analysis component of the K-68 Corridor Management Plan incorporates information on the existing transportation network, such as traffic volumes and intersection
Regional Profile Ebbw Vale & Blaenau Gwent
 Regional Profile Ebbw Vale & Blaenau Gwent Content Overview of Ebbw Vale Economy of Ebbw Vale & Blaenau Gwent Workforce Skills Addressing Youth Unemployment Summary Ebbw Vale & Blaenau Gwent Overview of
To: The results of these surveys have been analysed and are summarised within this Technical Note.
 Technical Note Project: Histon Road / Milton Road, Cambridge Parking Surveys To: Andy Harrison Subject: Survey Report v1.6 From: Jonathan Barlow Date: 18 th February 2016 cc: Richard Jones / Dave Boddy
Appendix 9 SCUBA diving in the sea
 Appendix 9 SCUBA diving in the sea Firth of Clyde Forum SMRTS2015 Final Report 195 March 2016 Appendix 9 SCUBA diving in the sea Table A9.1: Summary of sample confidence levels Responses Spatial data Questionnaire
FEASIBILITY ASSESSMENT OF TOURISM SUBPROJECTS
 FEASIBILITY ASSESSMENT OF TOURISM SUBPROJECTS A. Overview 1. The proposed investment support for community based tourism was reviewed during an ADB mission from 17 th to 23 rd September 2016. The selected
March Maidstone Integrated Transport Strategy Boxley Parish Council Briefing Note. Context. Author: Parish Clerk 2 March 2016
 Context. Author: Parish Clerk 2 The Draft Integrated Transport Policy (DITS) sets out a vision and objectives, and identifies a detailed programme of interventions to support the Maidstone Borough Local
Crash Patterns in Western Australia. Kidd B., Main Roads Western Australia Willett P., Traffic Research Services
 Crash Patterns in Western Australia Kidd B., Main Roads Western Australia Willett P., Traffic Research Services Abstract Examination of crash patterns is one way of identifying key factors on which focus
2017 Nebraska Profile
 2017 Nebraska Profile State, 9 NEW Regions, 93 Counties, plus 31 Cities Three Volumes Demographic Change in the State Economic Influences at Work Housing Statistics and Trends Summary of Findings Discuss
Appendix A. Road Classification Review of Outstanding Issues and Proposed Classifications (All Wards) Staff Report Road Classification System
 Staff Report Road Classification System") Appendix A Road Classification Review of Outstanding Issues and Proposed Classifications (All Wards) Staff Report 2000 A.1 of A.10 A.2 of A.10 STAFF REPORT January 26, 2000 To: From: Works Committee Barry
Appendix A Road Classification Review of Outstanding Issues and Proposed Classifications (All Wards) Staff Report 2000 A.1 of A.10 A.2 of A.10 STAFF REPORT January 26, 2000 To: From: Works Committee Barry
ABERDEEN: CITY OF THE FUTURE
 ABERDEEN: CITY OF THE FUTURE A contribution towards discussions on a future transport strategy for Aberdeen and its Region Prepared by the Centre for Transport Research University of Aberdeen June 2010
Transport Poverty in Scotland. August 2016
 Transport Poverty in Scotland August 2016 About Sustrans Sustrans makes smarter travel choices possible, desirable and inevitable. We re a leading UK charity enabling people to travel by foot, bike or
Walking in New Zealand May 2013
 May 2013 Walking makes up 13 percent of total time travelled and 16 percent of the number of trip legs. On average women spend more time walking than men, walking 57 minutes per person per week, compared
Factors Associated with the Bicycle Commute Use of Newcomers: An analysis of the 70 largest U.S. Cities
 : An analysis of the 70 largest U.S. Cities Ryan J. Dann PhD Student, Urban Studies Portland State University May 2014 Newcomers and Bicycles Photo Credit: Daveena Tauber 2 Presentation Outline Introduction
Growth Trends in Hampton Roads
 Presentation to the Isle of Wight County Board of Supervisors Growth Trends in Hampton Roads Hampton Roads Planning District Commission Greg Grootendorst Chief Economist September 19, 2014 Looking to 2040
ONE SIZE DOESN T FIT ALL RECONCILING OVERLAPPING TRANSPORT NETWORKS IN A CONSTRAINED URBAN ENVIRONMENT
 One Size Doesn t Fit All S Corbett, C Chenery Page 1 ONE SIZE DOESN T FIT ALL RECONCILING OVERLAPPING TRANSPORT NETWORKS IN A CONSTRAINED URBAN ENVIRONMENT Authors/Presenters: Sam Corbett, Principal Transport
TARANAKI VISITOR STATISTICS JUNE 2018
 TARANAKI VISITOR STATISTICS JUNE 2018 Taranaki Visitor Statistics At a Glance: Year ending June 2018 For the 12 months ending June 2018 there were 316,657 visitors who stayed in commercial accommodation
Americans in Transit A Profile of Public Transit Passengers
 Americans in Transit A Profile of Public Transit Passengers published by American Public Transit Association December 1992 Louis J. Gambacclnl, Chairman Rod Diridon, Vice Chairman Fred M. Gilliam, Secretary-Treasurer
The University of Georgia
 The University of Georgia Center for Agribusiness and Economic Development College of Agricultural and Environmental Sciences Economic Impacts of Alabama Quail Hunting Prepared by: Archie Flanders and
APPENDIX 3: EAGLECREST MASTER PLAN PUBLIC OPINION SURVEYS
 APPENDIX 3: EAGLECREST MASTER PLAN PUBLIC OPINION SURVEYS Eaglecrest Master Plan Public Opinion Surveys Prepared for Eaglecrest Ski Area Board of Directors Prepared by McDowell Group Inc. Eaglecrest Master
Ministry of Education Flat Bush School Notice of Requirement. Integrated Transportation Assessment Report. February 2016
 Ministry of Education Flat Bush School Notice of Requirement Integrated Transportation Assessment Report February 2016 TDG Ref: 12988-2 151105 ita flat bush.docx Ministry of Education Flat Bush School
REPORT. RECOMMENDATION: 1. That the report on Pilot Results Free Transit for Seniors, dated October 25, 2012, from Oakville Transit be received.
 REPORT MEETING DATE: NOVEMBER 15, 2012 FROM: Oakville Transit DATE: October 25, 2012 SUBJECT: Pilot Results - Free Transit for Seniors LOCATION: Town Wide WARD: Town wide Page 1 RECOMMENDATION: 1. That
Guidelines for Providing Access to Public Transportation Stations APPENDIX C TRANSIT STATION ACCESS PLANNING TOOL INSTRUCTIONS
 APPENDIX C TRANSIT STATION ACCESS PLANNING TOOL INSTRUCTIONS Transit Station Access Planning Tool Instructions Page C-1 Revised Final Report September 2011 TRANSIT STATION ACCESS PLANNING TOOL INSTRUCTIONS