Antitrust Reminder. August 25, Solar Energy Industries Association 1
|
|
|
- Sharleen Cobb
- 5 years ago
- Views:
Transcription
1 Antitrust Reminder As a trade association of competitors, SEIA must comply with federal and D.C. antitrust laws. Competitively sensitive matters cannot be discussed on this webinar, including product prices; sales terms or conditions; production levels; sales territories; marketing plans; industry forecasts; or bid terms. If any such topic is raised, SEIA will stop the conversation and, if necessary, end the webinar. For more information, SEIA s antitrust policy is available on its website: August 25, Solar Energy Industries Association 1


2 The Impact of Carbon Fee and Dividend on Solar Scott Nystrom, Senior Economic Associate, Regional Economic Models, Inc. Katherine Stainken, Manager, Government Affairs, SEIA Rick Umoff, Counsel and Regulatory Affairs Manager of State Affairs, SEIA
3 THE ECONOMIC, CLIMATE, FISCAL, POWER, AND DEMOGRAPHIC IMPACT OF A NATIONAL FEE-AND- DIVIDEND CARBON TAX Regional Economic Models, Inc.
4 Study Authors Scott Nystrom, M.A. Regional Economic Models, Inc. (REMI) Senior Economic Associate (202) Patrick Luckow, M.S. Synapse Energy Economics (Synapse) Associate (617) energy.com>
5 About REMI Regional Modeling Founded as an offshoot of research performed at the University of Massachusetts-Amherst in the late 1970s Software, data, consulting services, and issue expertise involving regional economic and demographic analysis Clients and Research Public sector: 47/50 states, federal agencies, regional authorities, cities, universities, international groups Private sector: consultants, Big 4 accounting firms, Fortune 500 companies, trade associations (AGA, NEA, NFIB, etc.) Recent projects on immigration reform and Medicaid expansion <

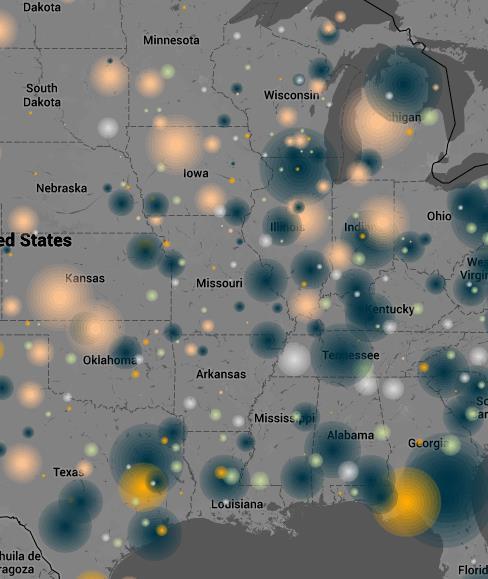
6 Client Base <
7 Policy Design Carbon tax Starts in 2016 at $10 per metric ton of CO 2 (and only CO 2 ) Escalates at $10 per year through at least the 2030s Point of extraction the well or the mine Fee-and-dividend (F&D) 100% of carbon tax revenues refunded to all American households in monthly checks or deposits Refund size based on number of adults (full share) and children (under 18, half share, and a maximum of two) Border adjustment Minimize carbon leakage and preserves competitiveness Goods imported to the United States charged a carbon tax on the emissions during their production process overseas Revenues used to compensate American exports for the higher costs <


8 Changing Incentives The Sun Capital The Earth Fossil Fuels Fee-and-Dividend Light, Wind Renewable Energy Fossil Energy Households Labor Air Quality Emissions Border Adjustment Industries
9 Three Models Regional Energy Deployment System (ReEDS) National Renewable Energy Laboratory (NREL) Long-term capacity and generation of electrical power by technology type (coal, gas, nuclear, wind, solar, etc.) Carbon Analysis Tool (CAT) Built off the Annual Energy Outlook (AEO) from EIA with adjustments based on price elasticity Models carbon emissions and carbon tax revenues REMI PI + Dynamic, multiregional economic and demographic model of subnational units of the United States
 Mountain (MNT) South Atlantic (SA) West South Central (WSC) East South Central")
10 Nine Regions Pacific (PAC) West North Central (WNC) East North Central (ENC) New England (NE) AK and HI are in the PAC region Mid-Atlantic (MA) Mountain (MNT) South Atlantic (SA) West South Central (WSC) East South Central (ESC)

11 The ReEDS Model <
, NO X and SO X, multiple regions, and integrates with REMI PI + Price on carbon emissions Changes end-use energy prices Reduces demand for energy Change from AEO")
12 Carbon Analysis Tool Overhaul of the CTAM model by Keibun Mori Baseline comes from the AEO reference case Simulations of carbon taxes make adjustments based on price elasticity CAT adds internal power switching (from ReEDS), NO X and SO X, multiple regions, and integrates with REMI PI + Price on carbon emissions Changes end-use energy prices Reduces demand for energy Change from AEO reference case Tax revenues = price*emissions
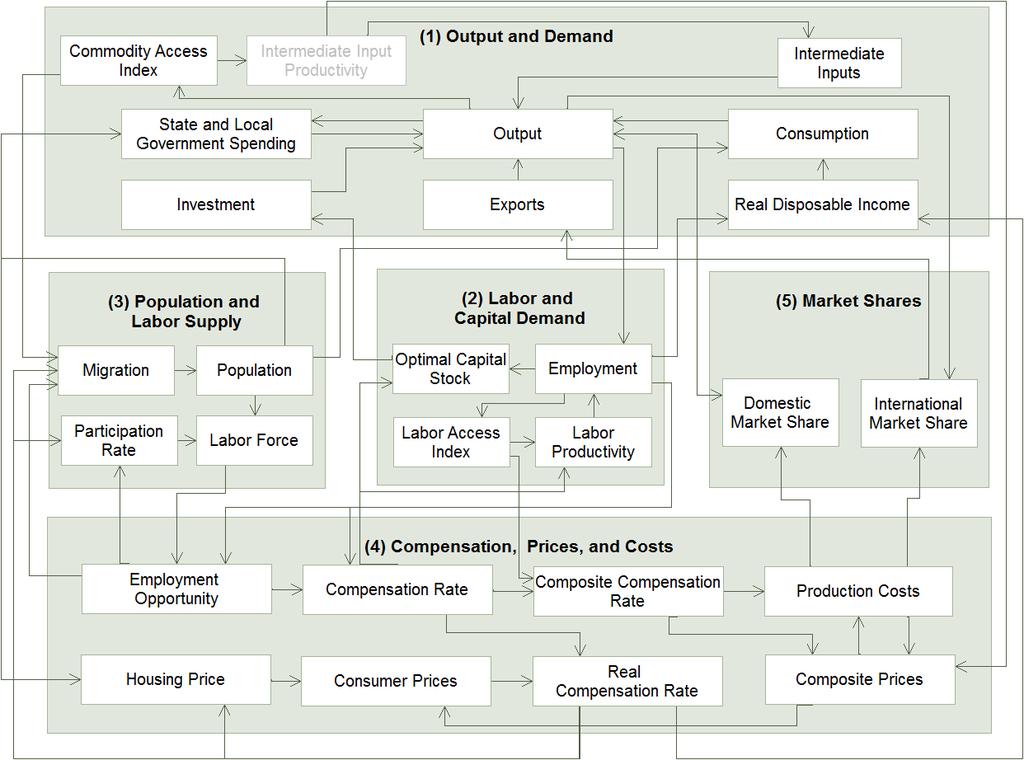
13 REMI PI +
14 Model Integrations
15 Economic or demographic indicator Against the Baseline 20,000 18,000 16,000 14,000 12,000 10,000 8,000 6,000 4,000 2,000 0 Baseline Alternative


16 Results Overview Economic Jobs and GDP Personal Income Prices By Region By Industry Climate Carbon Emissions NO X, SO X Emissions Savings from the Baseline Fiscal Carbon Tax Revenues Border Adjustment Size of Monthly Dividend Electricity Generation, Capacity by Technology Investment in Power Technology By Region Demographic Population Economic Migration Saved Premature Deaths
17 Thousands of jobs over baseline Regional Employment NE MA ENC WNC SA ESC WSC MNT PAC
18 Thousands of jobs over baseline National Employment 3,000 2,500 2,000 1,500 1,
19 Billions of 2012 dollars Gross Regional Product $40 $30 $20 $10 $0 -$10 -$20 -$30 -$40 -$50 -$60 -$70 NE MA ENC WNC SA ESC WSC MNT PAC
20 Billions of 2012 dollars Gross Domestic Product $90 $80 $70 $60 $50 $40 $30 $20 $10 $0
21 Percentage from baseline Employment (%) 2.0% 1.5% 1.0% 0.5% 0.0% -0.5% USA NE MA ENC WNC SA ESC WSC MNT PAC
22 Percentage from baseline GRP and GDP (%) 1.0% 0.5% 0.0% -0.5% -1.0% -1.5% -2.0% USA NE MA ENC WNC SA ESC WSC MNT PAC
23 Trillions of 2012 dollars Trillions of 2012 dollars Baseline v. Alternative GDP (USA) GRP (WSC) $35 $4.0 $30 $25 $20 $15 $10 $5 $3.5 $3.0 $2.5 $2.0 $1.5 $1.0 $0.5 $0 $0.0 Baseline Alternative Baseline Alternative
24 GDP by Industry Health Care and Social Assistance Finance and Insurance Retail Trade Real Estate and Rental and Leasing Information Other Services, except Public Administration Accommodation and Food Services Wholesale Trade Construction State and Local Government Administrative and Waste Management Services Arts, Entertainment, and Recreation Educational Services Professional, Scientific, and Technical Services Forestry, Fishing, and Related Activities Management of Companies and Enterprises Utilities Transportation and Warehousing Mining Manufacturing -$40 -$30 -$20 -$10 $0 $10 $20 $30 $40 Billions of 2012 dollars (annual average, ) National level results
25 GDP by MFG Industry Motor vehicles, bodies and trailers, and parts Food Beverage and tobacco Printing and related support activities Fabricated metal Furniture and related Nonmetallic mineral Wood Machinery Apparel; Leather and allied Paper Textile mills; Textile mills Miscellaneous Other transportation equipment Plastics and rubber Electrical equipment and appliance Primary metal Computer and electronic Chemical Petroleum and coals -$20 -$15 -$10 -$5 $0 $5 Billions of 2012 dollars (annual average, ) National level results
26 Jobs by Industry Health Care and Social Assistance Retail Trade Other Services, except Public Administration Accommodation and Food Services Administrative and Waste Management Services Construction Finance and Insurance Real Estate and Rental and Leasing Educational Services Arts, Entertainment, and Recreation State and Local Government Wholesale Trade Professional, Scientific, and Technical Services Information Manufacturing Transportation and Warehousing Forestry, Fishing, and Related Activities Management of Companies and Enterprises Utilities Mining Thousands of jobs (annual average, ) National level results
27 CO 2 Emissions 6,000 Millions of metric tons of CO 2 5,000 4,000 3,000 2,000 1,000 0 NEMS/ReEDS Baseline CAT/ReEDS Alternative National level results
28 Billions of 2012 dollars Carbon Tax Revenues $700 $600 $500 $400 $300 $200 $100 $0 Carbon Tax Revenues Border Adjustment Revenues National level results
29 Monthly dividend for a family of four (two adults and two dependent children) in 2012 dollars Monthly Dividend $450 $400 $350 $300 $250 $200 $150 $100 $50 $0 National level results
30 Percentage from baseline Cost of Living 3.0% 2.5% 2.0% 1.5% 1.0% 0.5% 0.0% NE MA ENC WNC SA ESC WSC MNT PAC
31 Per capita 2012 dollars Real Income Per Capita $900 $800 $700 $600 $500 $400 $300 $200 $100 $0 National level results
32 Generation (TWh) Power Generation Baseline ($0/year) Alternative ($10/year) 5,000 5,000 Solar 4,500 4,500 Wind 4,000 4,000 Biopower Geothermal 3,500 3,500 Hydro 3,000 3,000 Nuclear Oil-Gas-Steam 2,500 2,500 Gas-CC-CCS Gas-CT 2,000 2,000 Gas-CC 1,500 1,500 Coal-CCS Coal-IGCC 1,000 1,000 Coal-New Cofiring Coal-Old Scrubbed 0 0 Coal-Old Unscrubbed National level results
33 Billions of 2012 dollars Air Quality $100 $90 $80 $70 $60 $50 $40 $30 $20 $10 $0 PAC MNT WSC ESC SA WNC ENC MA NE 1 g of NO X = $0.005; 1 g of SO X = $0.025
34 Thousands (cumulative) Saved Premature Deaths PAC MNT WSC ESC SA WNC ENC MA NE Air quality benefit / $6.2 million = 1 saved premature death
35 Thousands over baseline Regional Population 1,200 1, NE MA ENC WNC SA ESC WSC MNT PAC

36 Results Summary Economic Climate Fiscal Electricity Demographic 2.0 to 3.0 million more jobs than in the baseline $70 to $90 billion in additional annual GDP Significant reduction in carbon dioxide emissions -33% from baseline by 2025, -52% by 2035 Up to $600 billion in revenues by the 2030s Familial rebate of $200 per month by 2025 Retirement of coal fleet by the mid-2020s Replaced by wind, nuclear, solar, and geothermal 11,000 to 13,000 annual saved premature deaths Larger population, mostly in the Midwest
37 Main Takeaways A strong economy and environmental quality are not mutually exclusive propositions from each other In fact, when understood as tax reform, environmental policies can have positive effects on the economy Removes the infernal tradeoff between two priorities Makes actions by foreign nations less relevant if it is good for our economy on its own, who cares about others? These results do not depend on a motive for why we might want to reduce carbon dioxide emissions Climate policy regarded as mundane budget reform Reducing the level of emissions is a secondary effect This policy makes no other changes to taxes or to spending No tax-and-spend, no change for the general tax code, no changes to Social Security, Medicare, Medicaid, etc.
38 Thank you. Regional Economic Models, Inc. (REMI) 1776 I St. NW Suite 750 Washington, DC (202)
39 Questions Please type your questions into the lower left corner of the window. Click the send button to submit. August 25, Solar Energy Industries Association 39
THE ECONOMIC, CLIMATE, FISCAL, POWER, AND DEMOGRAPHIC IMPACT OF A NATIONAL FEE-AND- DIVIDEND CARBON TAX
 THE ECONOMIC, CLIMATE, FISCAL, POWER, AND DEMOGRAPHIC IMPACT OF A NATIONAL FEE-AND- DIVIDEND CARBON TAX Regional Economic Models, Inc. Study Authors Scott Nystrom, M.A. Regional Economic Models, Inc. (REMI)
colorado.edu/business/brd
 colorado.edu/business/brd Big Changes, Unknown Impacts Southwest Business Forum Place cover image here Richard Wobbekind Senior Economist and Associate Dean for Business and Government Relations January
Nevada County Population Projections 2015 to 2034
 Nevada County Population Projections 2015 to 2034 Prepared By: Jeff Hardcastle, AICP Nevada State Demographer Nevada Department of Taxation Reno Office: 4600 Kietzke Lane, Building L Suite 235 Reno, NV
Economy-wide (general equilibrium) analysis of Philippines mitigation potential
 analysis of Philippines mitigation potential") Global Trade Analysis Project Economy-wide (general equilibrium) analysis of Philippines mitigation potential Erwin Corong Center for Global Trade Analysis, Purdue University Crowne Plaza Hotel, Manila
Global Trade Analysis Project Economy-wide (general equilibrium) analysis of Philippines mitigation potential Erwin Corong Center for Global Trade Analysis, Purdue University Crowne Plaza Hotel, Manila
PROVINCE OF SASKATCHEWAN INVESTOR PRESENTATION
 PROVINCE OF SASKATCHEWAN INVESTOR PRESENTATION May 2018 THE SASKATCHEWAN DIFFERENCE Economic Stability Diversified economy balances cyclicality of resources Growing population Majority government with
Big Changes, Unknown Impacts
 Big Changes, Unknown Impacts Boulder Economic Forecast Place cover image here Richard Wobbekind Senior Economist and Associate Dean for Business and Government Relations January 17, 2018 Real GDP Growth
EFFECTS OF EXTENDING AND EXPANDING ENERGY-EFFICIENCY TAX DEDUCTION FOR COMMERCIAL BUILDINGS
 EFFECTS OF EXTENDING AND EXPANDING ENERGY-EFFICIENCY TAX DEDUCTION FOR COMMERCIAL BUILDINGS Prepared by Regional Economic Models, Inc. (REMI) Agenda Overview of 179D tax provision Energy efficiency and
The Wisconsin and Minnesota Economies: What can we learn from each other? Noah Williams
 The Economies: What can we learn from each other? Noah University of Wisconsin - Madison Future Wisconsin Summit 2016 Economies Location, size, demographics, and history make Wisconsin and Minnesota natural
2018 Economic Outlook Forum Daraius Irani, Ph.D. Chief Economist, Regional Economic Studies Institute VP, Division of Strategic Partnerships and
 2018 Economic Outlook Forum Daraius Irani, Ph.D. Chief Economist, Regional Economic Studies Institute VP, Division of Strategic Partnerships and Applied Research Towson University November 29, 2018 $19,000
2019 Economic Outlook: Will the Recovery Ever End?
 2019 Economic Outlook: Will the Recovery Ever End? Advantage Bank Place cover image here Richard Wobbekind Senior Economist and Associate Dean for Business and Government Relations November 15 th, 2018
By making use of SAFRIM (South African Inter-Industry Macro-Economic Model) By Jeaunes Viljoen, Conningarth Economists, 1
 By Jeaunes Viljoen, Conningarth Economists, 1") By making use of SAFRIM (South African Inter-Industry Macro-Economic Model) By Jeaunes Viljoen, Conningarth Economists, South Africa 10/13/2011 1 1960: The economy experienced high growth rates mining
By making use of SAFRIM (South African Inter-Industry Macro-Economic Model) By Jeaunes Viljoen, Conningarth Economists, South Africa 10/13/2011 1 1960: The economy experienced high growth rates mining
Job Creation Survey, 4 th Quarter 2015 and 1 st Quarter 2016
 Job Creation Survey, 4 th Quarter 2015 and 1 st Quarter 2016 Summary Finding and Selected Tables National Bureau of Statistics June, 2016. Summary Findings and Tables of the Quarterly Job Creation 4 th
Telling Canada s story in numbers Elizabeth Richards Analytical Studies Branch April 20, 2017
 Recent Developments in the Canadian Economy: How have the decline in oil prices and a weaker Canadian dollar affected Canada s economy? www.statcan.gc.ca Telling Canada s story in numbers Elizabeth Richards
Nevada County Population Projections 2013 to 2032 Based On The Last Estimate Year of 2012
 Nevada County Population Projections 2013 to 2032 Based On The Last Estimate Year of 2012 Prepared By: The Nevada State Demographer s Office Jeff Hardcastle, AICP NV State Demographer University of NV
Bob Costello Chief Economist & Vice President American Trucking Associations. Economic & Motor Carrier Industry Update.
 Bob Costello Chief Economist & Vice President American Trucking Associations Economic & Motor Carrier Industry Update February 26, 2013 The Worst Recession Since the Great Depression 0% Loss from Peak
North American Forging Shipment Forecast (Using FIA bookings information through December 2013)
") North American Forging Shipment Forecast 2014-2018 (Using FIA bookings information through December 2013) Percent Change Year Ago Best leading indicator combination for impression die bookings used to
North American Forging Shipment Forecast 2014-2018 (Using FIA bookings information through December 2013) Percent Change Year Ago Best leading indicator combination for impression die bookings used to
China s Industrial Capabilities and Trade
 China s Industrial Capabilities and Trade Loren Brandt Thomas Rawski June 16, 2005 Key Facts: China, 2003 Population: 1.3 billion (1 st ) GNP: $US 1.4 trillion (3 rd ) Foreign Trade: $US 850.1 (3rd) GNP
Economic Growth in the Trump Economy
 Economic Growth in the Trump Economy Presented to State Data Center Conference William F. Fox, Director November 18, 2016 GDP Grows, Though Slowly 10.0 8.0 Percentage Change, Previous Qtr, SAAR 6.0 4.0
Powered Lawn Mower Market in United Kingdom to Market Size, Development, and Forecasts
 Powered Lawn Mower Market in United Kingdom to 2019 - Market Size, Development, and Forecasts Published: 5/2015 Global Research & Data Services Table of Contents List of Tables Table 1 Demand for powered
Inland Empire International Trade Economic Forecast
 Inland Empire International Trade Economic Forecast Mira Farka Adrian Fleissig Institute for Economic and Environmental Studies Orange County / Inland Empire Regional SBDC Network California State University,
Montana Manufacturing: 2015 Outlook. Todd A. Morgan, CF
 Montana Manufacturing: 2015 Outlook Todd A. Morgan, CF Montana & U.S. Manufacturing Employment 1990-2014 MT workers 28,000 US workers 21,000,000 24,000 18,000,000 20,000 15,000,000 Montana U.S. 16,000
INDUSTRY IN FIGURES July/2018
 INDUSTRY IN FIGURES July/2018 1. Industry performance (short-term indicators) Main industrial indicators Variable May18/Apr18 (%) seasonally adjusted May18/May17 (%) Accumulated rate in the last 12 months;
The Economic Value of Federal Public Lands
 The Economic Value of Federal Public Lands Ver. 5-15-18 Outline Federal Lands Have Many Values Context: The U.S. Economy Context: The West s Economy A Theory of Rural Development The Role of Federal Lands
Louisiana Energy Workforce Outlook. Stephen R. Barnes, PhD
 Louisiana Energy Workforce Outlook Stephen R. Barnes, PhD US Employment by Industry Education & Health Services 14% Professional & Business Services 14% Leisure & Hospitality 10% Manufacturing 7% Government
INDUSTRY IN FIGURES June/2018
 INDUSTRY IN FIGURES June/2018 1. Industry performance (short-term indicators) Main industrial indicators Variable Apr18/Mar18 (%) seasonally adjusted Apr18/Apr17 (%) Accumulated rate in the last 12 months;
INDUSTRY IN FIGURES November/2018
 INDUSTRY IN FIGURES November/2018 1. Industry performance (short-term indicators) Main industrial indicators Variable Sep18/Aug18 (%) seasonally adjusted Sep18/Sep17 (%) Accumulated rate in the last 12
2015 Economic Forecast & Industry Outlook. Robert A. Kleinhenz, Ph.D. Chief Economist, Kyser Center for Economic Research, LAEDC October 8, 2014
 2015 Economic Forecast & Industry Outlook Robert A. Kleinhenz, Ph.D. Chief Economist,, LAEDC October 8, 2014 Outline U.S. Economy California Economy Southern California Economy & Industries Five-Year Outlook
Texas Housing Markets: Metropolitan vs. Border Communities. September 22, 2014
 Texas Housing Markets: Metropolitan vs. Border Communities Luis Bernardo Torres Ruiz, Ph.D. Research Economist El Paso Branch Dallas Federal Rio Grande Economic Association September 22, 2014 Contents
U.S. and Colorado Economic Outlook National Association of Industrial and Office Parks. Business Research Division Leeds School of Business
 U.S. and Colorado Economic Outlook National Association of Industrial and Office Parks Presented by the Business Research Division Leeds School of Business University of Colorado at Boulder U.S. Economic
Puget Sound Regional Forecast Chris Mefford Community Attributes
 2015 Puget Sound Regional Forecast Chris Mefford Community Attributes 3 1,000s The Regional Economy has added jobs consistently for nearly 5 full years. In a few months, this will be the longest streak
Mexico Stands to Benefit From. With Relative Ease. Jesus Cañas Federal Reserve Bank of Dallas Laredo, Texas May 2014
 Mexico Stands to Benefit From With Relative Ease Jesus Cañas Federal Reserve Bank of Dallas Laredo, Texas May 2014 Outline 2013 worst than expected Economy back on growth track in 2014 Why we care about
INDUSTRY IN FIGURES January/2019
 INDUSTRY IN FIGURES January/2019 1. Industry performance (short-term indicators) Main industrial indicators Variable Nov18/Oct18 (%) seasonally adjusted Nov18/Nov17 (%) Accumulated rate in the last 12
More of the Same; Or now for Something Completely Different?
 More of the Same; Or now for Something Completely Different? C2ER Place cover image here Richard Wobbekind Chief Economist and Associate Dean for Business and Government Relations June 14, 2017 Real GDP
The US Economic Outlook
 IHS ECONOMICS US Outlook The US Economic Outlook November 2014 ihs.com Rafael Amiel, Director latin America Economics +1 215 789 7405, rafael.amiel.ihs.com 2014 IHS The US economy is gaining momentum Growth
The U.S. Economy How Serious A Downturn? Nigel Gault Group Managing Director North American Macroeconomic Services
 The U.S. Economy How Serious A Downturn? Nigel Gault Group Managing Director North American Macroeconomic Services Growth Is Cooling; But a Soft Landing Is Likely (Real GDP, annualized rate of growth)
The University of Georgia
 The University of Georgia Center for Agribusiness and Economic Development College of Agricultural and Environmental Sciences Economic Impacts of Alabama Quail Hunting Prepared by: Archie Flanders and
The U.S. Economic Outlook
 The U.S. Economic Outlook Presented to: Maquiladora Industry Outlook Conference September 29 2006 Presented by: Patrick Newport Principal, U.S. Macroeconomic Service 781-301-9125 patrick.newport@globalinsight.com
Effects of Common Economic Space Creation
 Effects of Common Economic Space Creation Институт Institute of народнохозяйственного Economic Forecasting прогнозирования Florence September, 2012 20 years of independent economic development 1990 1991
Estimating balanced detailed SUT using benchmark SUT
 Estimating balanced detailed SUT using benchmark SUT Martins Ferreira, Pedro European Commission, Eurostat E-mails: Pedro-Jorge.MARTINS-FERREIRA@ec.europa.eu Abstract Given an aggregate set of balanced
The transition to sustainable energy
 ATSE Symposium The transition to sustainable energy Peter Littlewood 8 Nov 2016 The changing world economy Index 180 170 160 150 140 130 120 110 100 90 Economies less energy intensive Electricity less
The Nevada 1st Congressional District
 The Nevada st Area (square miles) Navigable Waterbody (square miles) Population (007) Population Density (per square mile) (007) Persons 8+ (007) Households (007) Table. Owned by Residents Residing in
Energy Outlook Global and Domestic Trends and Challenges. Dr. John Caldwell Director of Economics, EEI 1
 Energy Outlook Global and Domestic Trends and Challenges Dr. John Caldwell Director of Economics, EEI 1 World GDP Growth Other Economies are Outpacing the U.S. Other, 7996.16, 11% Africa, 3962.51, 6% Latin
International Trade Economic Forecasts An Overview of Orange County and Southern California Exports
 International Trade Economic Forecasts An Overview of Orange County and Southern California Exports Mira Farka Adrian R. Fleissig Institute for Economic and Environmental Studies Orange County / Inland
A comment on recent events, and...
 A comment on recent events, and... where we are in the current economic cycle November 15, 2016 Mark Schniepp Director Likely Trump Policies $4 to $5 Trillion in tax cuts over 10 years to corporations,
THE FUTURE OF SALES TAX REVENUE
 THE FUTURE OF SALES TAX REVENUE Presented by Adam Fulton, Senior Economic Associate The Outlook for Sales Taxes State governments rely on state sales taxes for more than a fifth of their revenue Economic
University of Groningen & The Conference Board Asia s Productivity Performance and Potential: A Sectoral Perspective
 University of Groningen & The Conference Board Asia s Productivity Performance and Potential: A Sectoral Perspective Bart van Ark and Marcel Timmer Groningen Growth and Development Centre May 2003 Dynamics
Energy, Economy and Policy: A Glimpse at the 21 st Century
 Gas Well Deliquification Workshop Denver, Colorado February, 2009 Energy, Economy and Policy: A Glimpse at the 21 st Century Scott W. Tinker Bureau of Economic Geology Jackson School of Geosciences The
How Much Wind Is in the Sails?
 How Much Wind Is in the Sails? Erie Chamber of Commerce Place cover image here Richard Wobbekind Senior Economist and Associate Dean for Business and Government Relations September 20, 2017 Real GDP Growth
Railroads and the Economy
 Railroads and the Economy North East Association of Rail Shippers April 27, 2016 Railroads Help Keep Coal- Based Electricity A cynic is a man who, when he smells flowers, looks around for a coffin. -H.L.
Not For Sale. An American Profile: The United States and Its People
 An American Profile: The United States and Its People Not For Sale 1 759_EM_AmPro_ptg1.indd 1 Not For Sale 759_EM_AmPro_ptg1.indd 2 An American Profile: The United States and Its People 3 Table 1 Population,
CSAPR & MATS: Is Coal Doomed? Dallas Burtraw, Karen Palmer, Anthony Paul, Blair Beasley, and Matt Woerman
 CSAPR & MATS: Is Coal Doomed? Dallas Burtraw, Karen Palmer, Anthony Paul, Blair Beasley, and Matt Woerman Introduction Haiku Electricity Market Model Overview of results Large effect on SO 2 and mercury,
The Erie Economy: Performance, Opportunities, and Challenges
 The Erie Economy: Performance, Opportunities, and Challenges Eggs n Issues Manufacturer and Business Association December 2015 Dr. Kenneth Louie The Economic Research Institute of Erie Sam and Irene Black
Lawrence J. Lau 刘遵义. CSIS Forum Washington, D.C., 22nd May 2013
 U.S.-China Economic Relations in the Next Ten Years: Towards Deeper Engagement and Mutual Benefit Lawrence J. Lau 刘遵义 Ralph and Claire Landau Professor of Economics, The Chinese Univ. of Hong Kong and
Wenlin Liu, Senior Economist. Stateof Wyoming. Economic Analysis Division State of Wyoming 1
 WYOMING DEMOGRAPHIC AND ECONOMIC TREND LCCC LIFE Program April 7, 2012 Cheyenne, Wyoming Wenlin Liu, Senior Economist Economic Analysis Division Stateof Wyoming Economic Analysis Division State of Wyoming
Colorado Economic Update
 Colorado Economic Update Steamboat Economic Summit Place cover image here Brian Lewandowski Associate Director, Business Research Division October 21, 2016 Recession 8 Months Recession 18 Months Real GDP
THE ECONOMIC IMPACT OF RECREATIONAL SALTWATER FISHING ON THE LOUISIANA ECONOMY
 THE ECONOMIC IMPACT OF RECREATIONAL SALTWATER FISHING ON THE LOUISIANA ECONOMY By Loren C. Scott & Associates, Inc. 743 Woodview Court Baton Rouge, LA 70810 225-751-1707 lorencscott@aol.com for The Coastal
An American Profile: The United States and Its People
 An American Profile: The United States and Its People 1 153641_EM_AmPro.indd 1 12/16/8 11:1:32 PM An American Profile: The United States and Its People 3 Table 1 Population, Percentage Change, and Racial
Avoiding the Blind Alley China s Economic Overhaul and its Global Implications
 Avoiding the Blind Alley China s Economic Overhaul and its Global Implications Daniel Rosen Partner dhrosen@rhg.com NYU Stern China Research Luncheon New York December 1, 2014 10 East 40 th Street, Suite
CBO s January Baseline Sets the Stage. CRFB.org
 CBO s January Baseline Sets the Stage 1 Trillion-Dollar Deficits Are Returning $1,600 Billions $1,400 $1,200 $1,000 $800 Deficits Increased Almost 800% Deficits Fell 69% Deficits Triple to Nearly $1.4
Bob Costello Chief Economist & Vice President American Trucking Associations. Economic & Motor Carrier Industry Trends. September 10, 2013
 Bob Costello Chief Economist & Vice President American Trucking Associations Economic & Motor Carrier Industry Trends September 10, 2013 The Freight Economy Washington continues to be a headwind on economic
School of international and Public Affairs. Columbia University Manuel Pinho
 School of international and Public Affairs Columbia University Manuel Pinho SPHERE WITH CORE What matters to China matters to the world Do not give lessons to China: Europe and the US The challenges: Growth
The Economic Outlook. Economic Policy Division
 The Economic Outlook Economic Policy Division Glass Half Full Six plus years of moderate growth Real GDP Outlook Percent Change, Annual Rate 10 5 0-5 -10 1980 1985 1990 1995 2000 2005 2010 2015 Glass Half
Impacts of the Global Economy on Asia Pacific Travel. 29 June 2007 John Walker
 Impacts of the Global Economy on Asia Pacific Travel 29 June 2007 John Walker jwalker@oxfordeconomics.com Oxford Economics Founded in 1981 Over 300 clients including blue chip companies and government
Canadian Teleconference: Can the Canadian Economy Survive the Turmoil in the United States?
 Canadian Teleconference: Can the Canadian Economy Survive the Turmoil in the United States? Nigel Gault Chief U.S. Economist Dale Orr Canadian Macroeconomic Services Copyright 2008 Global Insight, Inc.
United Nations Conference on Trade and Development
 United Nations Conference on Trade and Development 11 th MULTI-YEAR EXPERT MEETING ON COMMODITIES AND DEVELOPMENT 15-16 April 2019, Geneva Saudi economic growth strategy on the face of oil price uncertainty
Economic Outlook March Economic Policy Division
 Economic Outlook March 212 Economic Policy Division Real GDP Outlook Percent Change, Annual Rate 2 1 1 - -1 197 197 198 198 199 199 2 2 21 U.S. GDP Actual and Potential Quarterly, Q1 197 to Q4 211 Real
Economic Overview. Melissa K. Peralta Senior Economist April 27, 2017
 Economic Overview Melissa K. Peralta Senior Economist April 27, 2017 TTX Overview TTX functions as the industry s railcar cooperative, operating under pooling authority granted by the Surface Transportation
The Australia US FTA: implications for international education
 The Australia US FTA: implications for international education Prepared for The Path to Cultural Understanding and Development 18th IDP Australian International Education Conference, Sydney 5-8 October
Impacts of CO2 Restrictions on Indiana Electricity Prices
 Impacts of CO2 Restrictions on Indiana Electricity Prices presented by: Douglas J. Gotham State Utility Forecasting Group presented to: Indiana Utility Regulatory Commission April 9, 2008 Outline Background
Your Texas Economy. Current through: Tuesday, Nov 20, 2018
 Your Texas Economy Current through: Tuesday, Nov 20, 2018 Overview of Texas Economy The Texas economy is growing robustly in 2018 2018 job growth through October is 2.9 percent annualized compared to 2.1
Vision - Britain's Ocean City One of Europe's most vibrant waterfront cities where an outstanding quality of life is enjoyed by everyone
 PLYMOUTH Economy Nina Sarlaka, Enterprise & Inward Investment Manager Vision - Britain's Ocean City One of Europe's most vibrant waterfront cities where an outstanding quality of life is enjoyed by everyone
The 2015 Mid-Year Economic Update
 Download slides here at www.mdm.com/slides or email info@mdm.com The 2015 Mid-Year Economic Update Brian Lewandowski and Thomas P. Gale June 18, 2015 Produced by: Sponsored by: Download slides here at
Noah Williams. University of Wisconsin-Madison Center for Research On the Wisconsin Economy (CROWE) Outlook for the Wisconsin Economy
 Outlook for the Wisconsin Economy") An Noah University of Wisconsin-Madison Center for Research On the Wisconsin Economy (CROWE) CROWE: Brief Introduction Center for Research on the Wisconsin Economy (CROWE) recently established in the Department
An Noah University of Wisconsin-Madison Center for Research On the Wisconsin Economy (CROWE) CROWE: Brief Introduction Center for Research on the Wisconsin Economy (CROWE) recently established in the Department
Energy Trends and Emissions in the Former Soviet Union
 Energy Trends and Emissions in the Former Soviet Union GTSP Annual Meeting May 29, 2008 Presented by M. Evans Looking back Overview Economic and demographic trends Energy trends and energy intensity Toward
nipigon.net Township of Nipigon 2018 Community Profile
 nipigon.net Township of Nipigon V 1.0 February 2018 2018 Nipigon nipigon.net nipigon.net Township of Nipigon nipigon.net Township of Nipigon nipigon.net Township of Nipigon nipigon.net Township of Nipigon
Northwest Economic Research Center College of Urban and Public Affairs Forecast Breakfast Economic Outlook
 Northwest Economic Research Center College of Urban and Public Affairs 2019 Forecast Breakfast Economic Outlook 1/10/2019 2 U.S. ECONOMY 1/10/2019 3 1980 1982 1984 1986 1988 1990 1992 1994 1996 1998 2000
THE SANTA TERESA, NEW MEXICO REGION DATA, INDICATORS, AND MAPS
 THE SANTA TERESA, NEW MEXICO REGION DATA, INDICATORS, AND MAPS AUGUST 2018 Table of Contents I. Community and Business Profile... 1 Map 1. General Overview of the Santa Teresa, New Mexico Region... 1 A.
Estimating Economic Impacts of Multi-Hazards in USGS HayWired Scenario Using REMI
 Estimating Economic Impacts of Multi-Hazards in USGS HayWired Scenario Using REMI PRELIMINARY RESULTS Presented by: Cynthia Kroll, Bobby Lu, ABAG and MTC REMI User s Conference, Charleston, South Carolina
Economic & Financial Market Outlook
 Economic & Financial Market Outlook BC Pension Forum March 1, 2013 Chris Lawless, Chief Economist Overview Global forces Recent economic performance ~ US, Europe, Japan, China ~ Other emerging markets
Building on Kyoto: Towards a Realistic Global Climate Change Agreement and What Australia Should Do
 Building on Kyoto: Towards a Realistic Global Climate Change Agreement and What Australia Should Do Warwick J. McKibbin & Peter J. Wilcoxen ANU Public Lecture, 3 July 2008 Overview Climate Science Lessons
The Houston Economy Jesse Thompson Regional Business Economist The Federal Reserve Bank of Dallas, Houston Branch January 2017
 The Houston Economy Jesse Thompson Regional Business Economist The Federal Reserve Bank of Dallas, Houston Branch January 2017 Image from http://peoplesguidetohouston.wordpress.com/category/uncategorized/
Your Texas Economy. Last updated: January 30, 2018
 Your Texas Economy Last updated: January 30, 2018 Texas economy strong in 2017 2017 job growth was 2.4% Overview 2015/2016 job growth was much weaker due to the oil bust (1.3% and 1.2%, respectively) 2014
WHERE ARE ARIZONA DEMOGRAPHICS TAKING US? HOW GROWING SLOWER, OLDER AND MORE DIVERSE AFFECTS REAL ESTATE
 WHERE ARE ARIZONA DEMOGRAPHICS TAKING US? HOW GROWING SLOWER, OLDER AND MORE DIVERSE AFFECTS REAL ESTATE March 2017 Tom Rex Office of the University Economist and Center for Competitiveness and Prosperity
The 2010 Economic Contribution of Tourism to the Meadowlands Liberty Region
 The 2010 Economic Contribution of Tourism to the Meadowlands Liberty Region Key Metrics & Evaluation 93 MAIN STREET :: ANNAPOLIS, MD 21401 WWW.VANTAGESTRATEGY.COM :: 202-449- 9708 1 Vantage Strategy ::.
RESEARCH Massachusetts Recreational Boater Survey. Project Summary
 Coastal and Marine Spatial Planning RESEARCH Project Summary 2010 Massachusetts Recreational Boater Survey The 2010 Massachusetts Recreational Boater Survey gathered spatial and economic data relating
2018 Annual Economic Forecast Dragas Center for Economic Analysis and Policy
 2018 Annual Economic Forecast Dragas Center for Economic Analysis and Policy PRESENTING SPONSOR EVENT PARTNERS 2 The forecasts and commentary do not constitute an official viewpoint of Old Dominion University,
The Economic Outlook. Economic Policy Division
 The Economic Outlook Economic Policy Division Glass Half Full Six years of steady growth Real GDP Outlook Percent Change, Annual Rate 10 5 0-5 -10 1980 1985 1990 1995 2000 2005 2010 2015 Glass Half Full
Electricity Price Impacts from CO2 Restrictions
 Electricity Price Impacts from CO2 Restrictions presented by: Douglas J. Gotham State Utility Forecasting Group presented to: Indiana Center for Coal Technology Research March 6, 2008 Outline Background
University Of Maryland
 2000 Census Census Data 200 Census Change 2000 to 200 SUBJECT Number Percent SUBJECT Number Percent Number Percent TOTAL POPULATION 437 TOTAL POPULATION 246-9 -43.7 White 283 64.8 White 65 67. -8-4.7 Black
Zions Bank Economic Overview
 Zions Bank Economic Overview Kenworth National Dealers Conference November 8, 2018 1 National Economic Conditions 2 Volatility Returns to the Stock Market 27,000 Dow Jones Industrial Average October 10,
Babson Capital/UNC Charlotte Economic Forecast. May 13, 2014
 Babson Capital/UNC Charlotte Economic Forecast May 13, 2014 Outline for Today Myths and Realities of this Recovery Positive Economic Signs Negative Economic Signs Outlook for 2014 The Employment Picture
COMMENTS ON THE INDUSTRIAL POLICY: THE CASE OF TURKEY
 MINISTRY OF DEVELOPMENT, REPUBLIC OF TURKEY COMMENTS ON THE INDUSTRIAL POLICY: THE CASE OF TURKEY Umut GÜR Head of Department of Industry 10 May 2013 Panel on Industrial Policies, TEPAV, Ankara 1 1923
The Economic Impact of Golf In South Carolina
 The Economic Impact of Golf In South Carolina By Dudley Jackson Research Director South Carolina Department of Parks, Recreation and Tourism For South Carolina Golf Course Owners Association April 2016
Virginia. Wholesale Trade Profile
 Virginia Wholesale Trade Profile July 2016 For additional information or explanation of the contents of this document, you may contact the Economic/Operations Research section at (804) 786-7497 or James.Wilson@vec.virginia.gov.
THE PERRYMAN GROUP. The Economic Benefits of the Precision Dance Industry Inspired by the Kilgore College Rangerettes
 The Economic Benefits of the Precision Dance Industry Inspired by the Kilgore College Rangerettes THE PERRYMAN GROUP 510 N. Valley Mills Dr. Suite 300 Waco, TX 76710 ph. 254.751.9595 fax 254.751.7855 info@perrymangroup.com
Indian Economy in Graphs. Arvind Panagariya Columbia University
 Indian Economy in Graphs Growth in GDP and Per-capita GDP 9 8.3 8 7 6.7 6 5.8 5 4 3 2 4.1 2.2 3.2 4.6 2.2 3.7 1 0.8 0 Phase I (1951-64) Phase II (1965-81) Phase III (1981-88) Phase IV (1988-03) Phase V
Zions Bank Economic Overview
 Zions Bank Economic Overview Intermountain Credit Education League May 10, 2018 Dow Tops 26,000 Up 48% Since 2016 Election Jan 26, 2018 26,616 Oct 30, 2016 17,888 Source: Wall Street Journal Dow Around
Dr. Richard Wobbekind Executive Director, Business Research Division and Senior Associate Dean for Academic Programs University of Colorado Boulder
 Dr. Richard Wobbekind Executive Director, Business Research Division and Senior Associate Dean for Academic Programs University of Colorado Boulder Member FDIC VectraBank.com Economic Outlook 2015 Richard
Labour Market Segmentation in Poland. Artur Gajdos Department of Spatial Econometrics University of Lodz
 Labour Market Segmentation in Poland Artur Gajdos Department of Spatial Econometrics University of Lodz gajdos@uni.lodz.pl Lisbon, 24 November 2016 Agenda Introduction Labour market facts Policy reforms
Total Retail Electric Customers
 Model Inputs New Resource Cost and Production Characteristics Integration and Ancillary Services Costs Historical Weather and Retail Load Forecast Carbon Costs GenTrader PowerSimm Cost and Energy Contribution