Percent
|
|
|
- Myron Heath
- 5 years ago
- Views:
Transcription

1
2 Outline
3 Outline

4 Growth is picking up Percent 6 Advanced economies Emerging and developing economies E 2018F 2019F 2020F Source: World Bank, Global Economic Prospects Notes: E denotes estimate and F denotes forecast as of January 2018.
5 Most commodity prices are recovering, albeit very slowly Index, nominal terms, 2010 = Post-recession peak 2011:Q1 Post-recession trough 2016:Q1 150 Energy Agriculture Metals Jan-07 Jan-08 Jan-09 Jan-10 Jan-11 Jan-12 Jan-13 Jan-14 Jan-15 Jan-16 Jan-17 Jan-18 Source: World Bank Note: Last observation is April 2018.

 in real prices to 2017")


6 Prices are much higher than the average Index, constant US$ (2010 = 100) Agriculture Changes (%) in real prices to 2017 from: Agriculture: Energy: Metals: Metals 40 Energy Source: World Bank.
7 Outline

8 The equilibrium of the oil price changed after 2004 US$/bbl January August 2014 Average price: $104/bbl Volatility: 2.95 December 2014 March 2018 Average price: $50.24/bbl Volatility: Jan-11 Jul-11 Jan-12 Jul-12 Jan-13 Jul-13 Jan-14 Jul-14 Jan-15 Jul-15 Jan-16 Jul-16 Jan-17 Jul-17 Jan-18 Source: World Bank. Note: Weekly data. Volatility is defined as standard deviation of logarithmic changes times 100. Last observation is March 16, 2018.
9 Oil prices are just above their long-term average US$/bbl, deflated by U.S. CPI (Jan 2017 terms) Two price cycles after WWII 1972 to 1986: Supply driven-cycle associated with oil supply disruption and major downturn in the global economy. High prices induced production from unconventional sources, including Alaska, Gulf of Mexico, and North Sea to 2014: Demand-driven cycle with no disruption in the global economy (during the spike) or boost to the global economy (during the collapse). High prices induced production from unconventional sources, including US shale, Canadian oil sands, and biofuels average: $56/bbl Source: World Bank. Note: World Bank average. Last observation is March 2018.

10 The costs of shale oil have gone down US$/bbl Range across regions Average Q1 2013Q3 2014Q1 2014Q3 2015Q1 2015Q3 2016Q1 2016Q3 2017Q1 Source: Rystad Energy NASWellCube Premium. Note: Does not include test activity, where well was shut-down after completion. Last observation is 2017Q2.
. Last observation is March 2018.")
11 U.S. shale well productivity has increased b/d per well 1,800 1,500 1,200 Range across regions Median Jan-07 Jan-08 Jan-09 Jan-10 Jan-11 Jan-12 Jan-13 Jan-14 Jan-15 Jan-16 Jan-17 Source: U.S. Energy Information Agency. Notes: Range and median are based on five regions (Bakken, Eagle Ford, Niobrara, and Permian). Last observation is March 2018.


12 Cumulative change in oil production since September 2016 mb/d 5 Agreement countries Non-Agreement countries Net change Agreed cuts Sep-16 Nov-16 Jan-17 Mar-17 May-17 Jul-17 Sep-17 Nov-17 Jan-18 Source: International Energy Agency Note: Bars denote change in oil production relative to September 2016, when the OPEC/non-OPEC cuts were first discussed. The cuts of 1.8 mb/d became effective in January Last observation is February 2018.
13 Energy prices are closer together US$/mmbtu Crude oil (World Bank average) Natural gas (U.S.) 0 Jan-00 Jul-01 Jan-03 Jul-04 Jan-06 Jul-07 Jan-09 Jul-10 Jan-12 Jul-13 Jan-15 Jul-16 Jan-18 Source: World Bank. Note: Last observation is March Coal (Australia)
14 Natural gas prices are closer US$/mmbtu 20 Japan (LNG) 15 Europe 10 5 U.S. 0 Jan-00 Jul-01 Jan-03 Jul-04 Jan-06 Jul-07 Jan-09 Jul-10 Jan-12 Jul-13 Jan-15 Jul-16 Jan-18 Source: World Bank. Note: Last observation is March 2018.
15 Outline
16 Some metals prices are picking up $/mt 10,000 $/mt $/mt 200 2,800 $/mt 30,000 Copper [left] Iron ore [right] Aluminum [LHS] 25,000 8, ,400 20,000 6, ,000 15,000 4, ,600 10,000 2,000 Jan-10 Jan-11 Jan-12 Jan-13 Jan-14 Jan-15 Jan-16 Jan-17 Jan ,200 Jan-10 Jan-11 Jan-12 Jan-13 Jan-14 Jan-15 Jan-16 Jan-17 Jan-18 5,000 Source: World Bank Note: Last observation is March 2018.
17 China dominates metal consumption Million metric tons 6 5 Rest of the world China 1 0 Jan-95 Jan-97 Jan-99 Jan-01 Jan-03 Jan-05 Jan-07 Jan-09 Jan-11 Jan-13 Jan-15 Jan-17 Source: World Bank and World Bureau of Metal Statistics Notes: Last observation is December 2017.
18 Outline
19 Agricultural prices have been stable for more than 3 years Index, nominal terms, 2010 = Food Remarkably stable agricultural commodity prices 100 Raw materials 80 Beverages 60 Jan-07 Jan-08 Jan-09 Jan-10 Jan-11 Jan-12 Jan-13 Jan-14 Jan-15 Jan-16 Jan-17 Jan-18 Source: World Bank. Note: Last observation is March 2018.
20 Stock-to-use ratios of key grains have recovered Ratio 0.40 Maize Rice Wheat Source: U.S. Department of Agriculture. Notes: Update based on the U.S. Department of Agriculture March 8, 2018 data release.
21 Outline
22 Where are commodity prices heading? Index, real (2010 = 100) Agriculture Forecasts as of April Metals 40 Energy Source: World Bank. Note: The period refers to forecasts, as of April 2018.
23 History of oil consumption and prospects as envisaged in 2005 mb/d OECD, actual Non-OECD, actual OECD, projected in 2005 Non-OECD, projected in Source: International Energy Agency and World Bank. Note: The projection was taken from the 2005 IEA World Energy Outlook.
24 China has reversed the global metals intensity Index, 1995= World World excl. China Source: World Bureau of Metal Statistics.
25 Oil and energy intensity of GDP have been declining Oil Energy Barrels of oil per $10,000 of GDP Barrels of oil equivalent per $10,000 of GDP 12 World OECD Non-OECD 30 World OECD Non-OECD Source: BP Statistical Review and World Bank
26 Consumption against income in per capita terms Oil Natural gas tons of oil per capita tons of oil equivalent per capita EM7 ex China China 0.5 EM7 ex China China 0 G7 South Korea 0 10,000 20,000 30,000 40,000 50, G7 South Korea 0 10,000 20,000 30,000 40,000 50,000 GDP per capita GDP per capita Source: BP Statistical Review and World Bank. Note: Consumption per capita vs. GDP per capita ( ).
27 Consumption against income in per capita terms Coal Aluminum ton of oil equivalent per capita kg per capita EM7 ex China China 10 EM7 ex China China 0.0 G7 South Korea 0 10,000 20,000 30,000 40,000 50, G7 South Korea 0 10,000 20,000 30,000 40,000 50,000 GDP per capita GDP per capita Source: BP Statistical Review and World Bank. Note: Consumption per capita vs. GDP per capita ( ).
28 Consumption against income in per capita terms Copper Zinc kg per capita kg per capita 25 EM7 ex China China 14 EM7 ex China China 20 G7 South Korea G7 South Korea ,000 20,000 30,000 40,000 50, ,000 20,000 30,000 40,000 50,000 GDP per capita GDP per capita Source: BP Statistical Review and World Bank. Note: Consumption per capita vs. GDP per capita ( ).


29 mb/d 7 Iran s oil production Consumption Net Exports Source: BP Statistical Review, International Energy Agency. Note: Production includes crude oil and liquids.

30 mb/d 4 Venezuela s oil production Consumption Net Exports Source: BP Statistical Review. Note: Production includes crude oil and liquids.


31 Conflict-driven oil supply reductions in historical context -0.9 Nov 2011 Oct 2012 Sanctions on Iran -1.5 Feb Oct 2011 Libyan civil war -2.3 Mar Dec 2003 Iraq war -4.3 Aug 1990 Jan 1991 Kuwait invasion -4.1 Oct 1980 Jan 1981 Iran-Iraq war -5.6 Nov 1978 Apr 1979 Iranian revolution -4.3 Oct 1973 Mar 1974 Arab oil embargo mb/d Source: International Energy Agency and World Bank
32 US oil production exceeded its 1970 record of 10 mb/d Mb/d 11.0 U.S. shale boom Jan-70 Jan-73 Jan-76 Jan-79 Jan-82 Jan-85 Jan-88 Jan-91 Jan-94 Jan-97 Jan-00 Jan-03 Jan-06 Jan-09 Jan-12 Jan-15 Jan-18 Source: U.S. Energy Information Administration

33 OPEC s role in the global oil market Shares of global oil production 70% 60% 50% 40% 30% 20% 49% Non-OPEC oil producers that agreed to cuts OPEC oil producers Source: BP Statistical Review and International Energy Agency Notes: Columns denote 5-year averages, except the last which refers to OPEC today POWER: It It is is less less powerful compared to to the the 1970s. It It asked for for assistance from key key non-opec producers to to make the the cuts effective. COHERENCE: It It appears to to be be less less coherent compared to to the the past because of: of: (i) (i) political fractions within and (ii) (ii) some members cannot afford supply cuts. COMPETITION: Commodity agreements have a a poor record. They are are successful initially, but but non-members gain market share and eventually become efficient suppliers. A A case in in point is is the the U.S. shale oil oil industry, now acting as as a a counterweight to to OPEC. A A historical example is is the the International Coffee Agreement. SUBSTITUTION: Agreement-induced supply cuts make substitute (natural or or synthetic) products more competitive. A A historical example is is the the International Tin Tin Agreement whose supply cuts made aluminum competitive.


34 Signs of slowdown in China s metal consumption mmt, year-on-year change OECD China ROW Jan-16 Mar-16 May-16 Jul-16 Sep-16 Nov-16 Jan-17 Mar-17 May-17 Jul-17 Sep-17 Nov-17 Source: World Metal Statistics Notes: Last observation is December 2017
35 Agricultural prices show little correlation with weather cycles Index, deflated by U.S. CPI, January 2010 = Agriculture price index ENSO Index peaks The strongest El Niño on record, 1997/ % -19.6% % -2.9% -0.9% -2.2% -6.5% -7.3% Source: World Bank and National Oceanic Atmospheric Administration. Note: The numbers denote percent changes of the six-month average leading to the ENSO peak compared to the previous six-month period (bold) and the corresponding six-month period of the previous year (italic). The last observation is February % 9.8% 3.8% -3.5% -7.1% -14.8%


 Source: World Bank, BP Statistical Review of World Energy, World Bureau of")
36 Could India become the next China? China India Crude oil Crude oil Coal Coal Iron ore Iron ore Base metals Base metals Grains Grains Edible oils Edible oils Population GDP Population GDP Share of world total (percent) Share of world total (percent) Source: World Bank, BP Statistical Review of World Energy, World Bureau of Metals Statistics, U.S. Department of Agriculture
37

38
Global growth prospects
 Global growth prospects Percent 6 Advanced Economies Emerging Markets and Developing Economies 5 4.9 5.0 4.7 4.7 4.5 4 4.3 4.3 3.7 3.7 3 2 2.3 2.3 2.2 2.0 2.0 1.7 1.7 1 1.1 1.3 0 2012 2013 2014 2015 2016
Index, nominal terms, 2010 = Energy. Agriculture Metals
 Outline Broad commodity price trends Index, nominal terms, 2010 = 100 180 150 Energy 120 90 60 Agriculture Metals 30 Jan-07 Jan-08 Jan-09 Jan-10 Jan-11 Jan-12 Jan-13 Jan-14 Jan-15 Jan-16 Jan-17 Source:
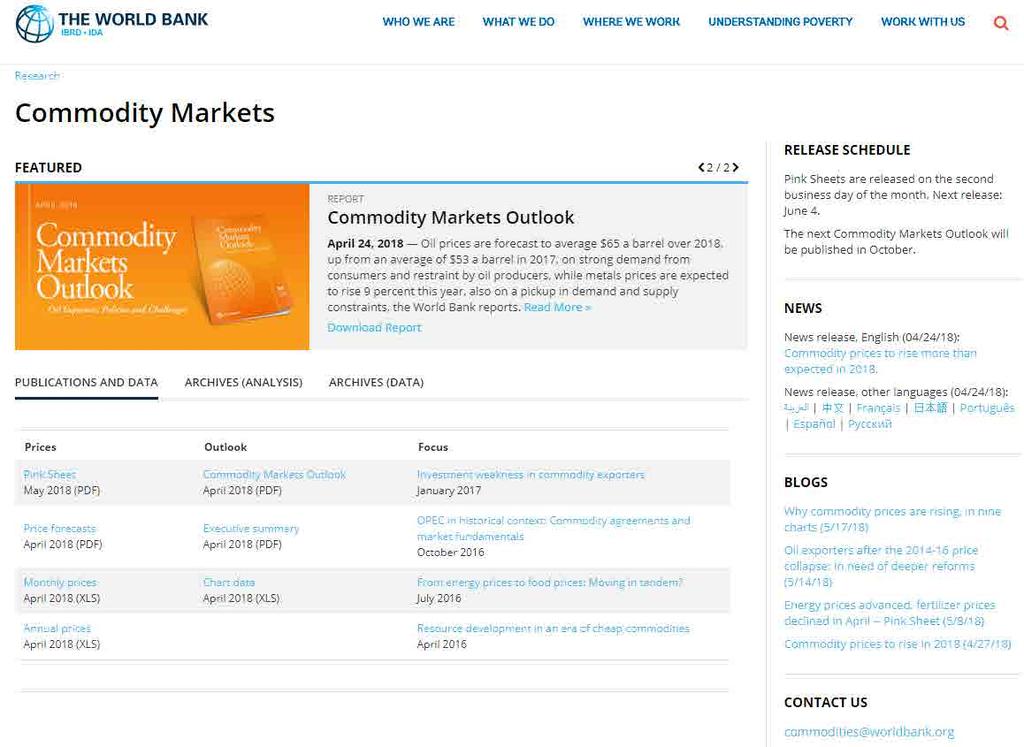
Commodity prices ( pink sheet ) are updated on the third business day of each month (the next update will be posted on May 4, 2016).
 are updated on the third business day of each month (the next update will be posted on May 4, 2016).") The latest edition of the World Bank s Commodity Markets Outlook was published on January 26, 2016. The next edition will be published tomorrow at 3:00 pm EST! Commodity prices ( pink sheet ) are updated
The latest edition of the World Bank s Commodity Markets Outlook was published on January 26, 2016. The next edition will be published tomorrow at 3:00 pm EST! Commodity prices ( pink sheet ) are updated
Oil Prices: Past, Present, & Future
 Oil Prices: Past, Present, & Future Gulf Research Center November 23, 2005 A. F. Alhajji*, PhD Gulf Energy Program - Moderator Gulf Research Center Dubai, UAE *A. F. Alhajji, PhD is also George Patten
The Changing Global Economy Impacts on Seaports and Trade Dr. Walter Kemmsies
 The Changing Global Economy Impacts on Seaports and Trade Dr. Walter Kemmsies Chief Economist, PAGI Group, JLL (Port, Airport & Global Infrastructure) Agenda Where are we in the cycle? What are the barriers
Opening address for dinner-debate
 Opening address for dinner-debate Mohammed Barkindo Acting for the OPEC Secretary General European Parliament Strasbourg, France 4 July 2006 1 Outline Importance of EU-OPEC Energy Dialogue Current oil
DECLINE IN COMMODITY PRICES GCC OUTLOOK NOVEMBER 22 ND, 2015
 DECLINE IN COMMODITY PRICES GCC OUTLOOK NOVEMBER 22 ND, 2015 1 EVERYONE HAS A PLAN UNTIL THEY GET PUNCHED IN THE FACE 2 HE WHO IS NOT COURAGEOUS ENOUGH TO TAKE RISKS WILL ACCOMPLISH NOTHING IN LIFE 3 IT
Market Report Series Oil 2017
 Market Report Series Oil 2017 Neil Atkinson, Head Oil Industry & Markets Division, IEA International Institute for Strategic Studies, Bahrain, 17 September 2017 Oil demand continues to grow but at a slower
Energy Security: Markets and Policy
 Energy Security: Markets and Policy Pierre Noël EPRG, University of Cambridge Critical Infrastructure Conference, London, 20 April 2011 Contents Global Oil and the Middle East European Gas and Russia Japan
Short and Medium-Term Oil Market Outlook. 13 th Shanghai Derivatives Market Forum - 25 May 2016
 Short and Medium-Term Oil Market Outlook 13 th Shanghai Derivatives Market Forum - 25 May 2016 Oil world changed on Nov. 27 th 2014 $/bbl 120 Brent crude oil 100 80 60 40 Copyright 2016 Argus Media 20
Outline. Overview of globalization. Global outlook for real economic activity & inflation. Risks to the outlook
 2017 International Economic Outlook Everett Grant Research Economist Globalization & Monetary Policy Institute Federal Reserve Bank of Dallas October 2017 The views expressed are those of the author and
18 th May Global Steel Industry Trends: Is the perception the reality?
 18 th May 2004 Global Steel Industry Trends: Is the perception the reality? Investors have perceived the steel industry negatively Poor returns over the long term, high volatility, relatively small size
U.S. Oil & Gas Industry Chartbook
 U.S. Oil & Gas Industry Chartbook BBVA Research USA Houston, TX July 2015 DISCLAIMER This document was prepared by Banco Bilbao Vizcaya Argentaria s (BBVA) BBVA Research U.S. on behalf of itself and its
4 th IEA-IEF-OPEC Symposium on Energy Outlooks. Riyadh, 22 January 2014
 4 th IEA-IEF-OPEC Symposium on Energy Outlooks Riyadh, 22 January 2014 Spare or stranded?* mb/d 7.0 Medium-Term Oil Market Balance 6.0 5.0 4.0 3.0 2.0 1.0 0.0-1.0 2004 2005 2006 2007 2008 2009 2010 2011
Rebalancing Global Crude Flows
 Rebalancing Global Crude Flows John R. Auers Executive Vice President AIChE Dallas Chapter April Section Meeting April 28, 2015 Page 1 TM&C North American Crude & Condensate Outlook TM&C began publishing
Analyzing the Energy Economy Michael Plante Senior Research Economist
 Federal Reserve Bank of Dallas Analyzing the Energy Economy Michael Plante Senior Research Economist Disclaimer Disclaimer: The statements in this presentation do not represent the official views of the
OIL MARKET REPORT DECEMBER 2016
 18 January 217 OIL MARKET REPORT DECEMBER EXECUTIVE SUMMARY Since OPEC end-november meeting the price has been trading above $5 per bbl. Implementation of the deal and new promises from Saudi Arabia will
United Nations Conference on Trade and Development
 United Nations Conference on Trade and Development 11 th MULTI-YEAR EXPERT MEETING ON COMMODITIES AND DEVELOPMENT 15-16 April 2019, Geneva Saudi economic growth strategy on the face of oil price uncertainty
Rebalancing Global Crude Flows
 Rebalancing Global Crude Flows John Mayes Director of Special Studies AFPM Annual Meeting San Antonio, Texas March 24, 2015 TM&C North American Crude & Condensate Outlook TM&C publishes North American
World Vegetable Oil Themes in 2018/19
 World Vegetable Oil Themes in 2018/19 Ben Buckner AgResource Company World Veg Oil Themes in 2018 POLITICS Disorder, Trade Barriers (India More than China?) HUGE difference between world soybean supply
Impacts of the Global Economy on Asia Pacific Travel. 29 June 2007 John Walker
 Impacts of the Global Economy on Asia Pacific Travel 29 June 2007 John Walker jwalker@oxfordeconomics.com Oxford Economics Founded in 1981 Over 300 clients including blue chip companies and government
The Texas Gulf Coast Overview and Outlook
 The Texas Gulf Coast Overview and Outlook Jesse Thompson Federal Reserve Bank of Dallas Houston Branch 06/2018 The views expressed in this presentation are strictly those of the presenter and do not necessarily
Global Economic Outlook
 Global Economic Outlook Mark A. Wynne Vice President & Associate Director of Research Director, Globalization & Monetary Policy Institute Federal Reserve Bank of Dallas Presentation to Vistas Conference
Alaska s Natural Resource Commodities: A 10-Year Outlook
 Alaska Resources Development Council November 14-15, 2018 Alaska s Natural Resource Commodities: A 10-Year Outlook David R. Hammond, Ph.D. Principal Mineral Economist Hammond International Group Commodities
2016 Grains & Oilseeds Outlook. The global outlook remains positive. 12/7/2015. Matthew C. Roberts
 12/7/215 216 Grains & Oilseeds Outlook Matthew C. Roberts Roberts.628@osu.edu The global outlook remains positive. www.matthewcroberts.com 2 www.matthewcroberts.com 3 www.matthewcroberts.com 4 www.matthewcroberts.com
Agricultural Outlook: Rebalancing U.S. Agriculture
 Agricultural Outlook: Rebalancing U.S. Agriculture Michael J. Swanson Ph.D. Agricultural Economist January 2018 2018 Wells Fargo Bank, N.A. All rights reserved. For public use. The U.S. Ag Sector renormalizes!
U.S. Oil & Gas Industry Chartbook
 U.S. Oil & Gas Industry Chartbook BBVA Research USA Houston, TX August 2015 DISCLAIMER This document was prepared by Banco Bilbao Vizcaya (BBVA) BBVA Research U.S. on behalf of itself and its affiliated
FAPRI agricultural commodity outlook
 FAPRI agricultural commodity outlook By William H. Meyers Howard Cowden Professor of Agricultural and Applied Economics FAPRI at MU UN DESA Expert Group Meeting on the World Economy 21 October 2013 New
Market Insights. June 30, 2018
 June 30, 2018 Economic Overview 2 Global & Regional Growth Forecasts IMF GDP Forecasts (% change YoY) 2010 2011 2012 2013 2014 2015 2016 2017 2018 Advanced Economies 1.7% 1.2% 1.3% 2.1% 2.3% 1.7% 2.3%
Steel: A Buyer s Market for the Worst of Reasons. John Anton Director, IHS Global Insight Steel Service August 2009
 Steel: A Buyer s Market for the Worst of Reasons John Anton Director, IHS Global Insight Steel Service August 2009 The U.S. Recession Is Bottoming Out This recession has been the most severe of the postwar
Market Insights. March 29, 2019
 March 29, 2019 Economic Overview 2 Global & Regional Growth Forecasts IMF GDP Forecasts (% change YoY) 2010 2011 2012 2013 2014 2015 2016 2017 2018 Advanced Economies 1.2% 1.4% 2.1% 2.3% 1.7% 2.4% 2.3%
Current Hawaii Economic Conditions. Eugene Tian
 Current Hawaii Economic Conditions Eugene Tian Department of Business, Economic Development & Tourism At the PATA/TTRA 2016 Annual Outlook & Economic Forecast Forum February 3, 2016 Positive Signs in the
Oil Markets. Kevin Lindemer Executive Managing Director, Energy Markets Group
 Oil Markets Kevin Lindemer Executive Managing Director, Energy Markets Group 2008 Outlook Downside risks in demand are increasing due to weaker economic outlook Upside supply risks still present but balance
President and Chief Executive Officer Federal Reserve Bank of New York Washington and Lee University H. Parker Willis Lecture in Political Economics
 The U.S. Economic Outlook Chartspresented by WilliamC Dudley Charts presented by William C. Dudley President and Chief Executive Officer Federal Reserve Bank of New York Washington and Lee University H.
U.S. Oil & Gas Industry Chartbook
 U.S. Oil & Gas Industry Chartbook BBVA Research USA Houston, TX September 2015 DISCLAIMER This document was prepared by Banco Bilbao Vizcaya Argentaria s (BBVA) BBVA Research U.S. on behalf of itself and
Sulphur Market Outlook
 Sulphur Market Outlook Meena Chauhan Head of Sulphur and Sulphuric Acid Integer Research The Fertilizer Institute Outlook and Technology conference Fort Lauderdale, Florida Founded in 2002, Integer Research
Global Outlook for Agriculture Trend versus Cycle
 Global Outlook for Agriculture Trend versus Cycle Michael Swanson Ph.D. Wells Fargo October 2017 Everything is connected we just don t see how. Connection corollary: Nothing natural moves in a straight
The U.S. Economic Outlook
 The U.S. Economic Outlook Presented to: Maquiladora Industry Outlook Conference September 29 2006 Presented by: Patrick Newport Principal, U.S. Macroeconomic Service 781-301-9125 patrick.newport@globalinsight.com
Commodity Market Outlook: Corn, Forage, Wheat & Cattle
 Commodity Market Outlook: Corn, Forage, Wheat & Cattle Stephen R. Koontz Professor & extension economist Department of Agricultural & Resource Economics Colorado State University Stephen.Koontz@ColoState.Edu
MIDDLE EAST ENERGY SITUATION AND OUTLOOK IRAQ ENERGY FORUM 2017
 MIDDLE EAST ENERGY SITUATION AND OUTLOOK IRAQ ENERGY FORUM 2017 2017 1 OVERVIEW OF GLOBAL ENERGY MARKETS 2 Energy exports/imports (million tonnes) 1990 1995 2000 2005 2010 2014 2015 2020 2025 2030 2035
OIL MARKET REPORT OCTOBER 2018
 16 November OIL MARKET REPORT OCTOBER EXECUTIVE SUMMARY In October crude oil market caught a bear flu after almost gripping the $90 per barrel price level (Brent). In the beginning of October the market
Market Report Series Oil SIEW 2017 launch - 28 March 2017
 Market Report Series Oil 2017 SIEW 2017 launch - 28 March 2017 Oil demand continues to grow but at a slower pace 2.0 Global oil demand growth 2014-2022 1.5 1.0 0.5 0.0 2014 2015 2016 2017 2018 2019 2020
2017/18 Corn Outlook
 217/18 Corn Outlook 217 Ag Econ In service Training Dr. S. Aaron Smith, Assistant Professor, Department of Agricultural and Resource Economics, University of Tennessee https://ag.tennessee.edu/arec/pages/cropeconomics.aspx
Presentation from the USDA Agricultural Outlook Forum 2017
 Presentation from the USDA Agricultural Outlook Forum 2017 United States Department of Agriculture 93 rd Annual Agricultural Outlook Forum A New Horizon: The Future of Agriculture February 23-24, 2017
Energy Outlook Global and Domestic Trends and Challenges. Dr. John Caldwell Director of Economics, EEI 1
 Energy Outlook Global and Domestic Trends and Challenges Dr. John Caldwell Director of Economics, EEI 1 World GDP Growth Other Economies are Outpacing the U.S. Other, 7996.16, 11% Africa, 3962.51, 6% Latin
Beef Cattle Market Update
 Beef Cattle Market Update August 8, 2017 Dr. Scott Brown Agricultural Markets and Policy Division of Applied Social Sciences University of Missouri brownsc@missouri.edu http://amap.missouri.edu Twitter
The Great Convergence: China, India and the new global economy. Mark Thirlwell Program Director, International Economy July 2006
 The Great Convergence: China, India and the new global economy Mark Thirlwell Program Director, International Economy July 2006 India Two views of the largest economies in 2005 Top 12 economies by GDP,
GLOBAL ECONOMICS, REAL ESTATE PRICING & OUTLOOK FOR 2017 RICHARD BARKHAM GLOBAL CHIEF ECONOMIST
 GLOBAL ECONOMICS, REAL ESTATE PRICING & OUTLOOK FOR 2017 RICHARD BARKHAM GLOBAL CHIEF ECONOMIST BREXIT TRUMPISM EURO-TRUMPISM 4 ECONOMICS, PRICING & OUTLOOK FOR 2017 LET S GET GEOPOLITICS IN PERSPECTIVE
TABLE 1. REAL GDP AND GROWTH RATES IN THE ESCWA REGION AT CONSTANT 1995 PRICES, (Millions of US dollars and percentages) Percentage change
 Percentage change") TABLE 1. REAL GDP AND GROWTH RATES IN THE ESCWA REGION AT CONSTANT 1995 PRICES, 2001-2004 (Millions of US dollars and percentages) Percentage change Country/area 2000 2001 2002 2003 a/ 2004 b/ 2001 2002
TABLE 1. REAL GDP AND GROWTH RATES IN THE ESCWA REGION AT CONSTANT 1995 PRICES, 2001-2004 (Millions of US dollars and percentages) Percentage change Country/area 2000 2001 2002 2003 a/ 2004 b/ 2001 2002
Economy On The Rebound
 Economy On The Rebound Robert Johnson Associate Director of Economic Analysis November 17, 2009 robert.johnson@morningstar.com (312) 696-6103 2009, Morningstar, Inc. All rights reserved. Executive
Steel Market Outlook. AM/NS Calvert
 Steel Market Outlook AM/NS Calvert Agenda Economic indicators Key steel consuming markets and forecasted demand Steel consumptions trends Global steel markets and raw materials Comments on trade 1 U.S.
Economic & Financial Market Outlook
 Economic & Financial Market Outlook BC Pension Forum March 1, 2013 Chris Lawless, Chief Economist Overview Global forces Recent economic performance ~ US, Europe, Japan, China ~ Other emerging markets
UNIVERSITY OF CALIFORNIA Economics 134 DEPARTMENT OF ECONOMICS Spring 2018 Professor David Romer
 UNIVERSITY OF CALIFORNIA Economics 134 DEPARTMENT OF ECONOMICS Spring 2018 Professor David Romer LECTURE 2 OVERVIEW OF THE GREAT DEPRESSION January 22, 2018 I. THE 1920S A. GDP growth and inflation B.
SEB Commodities Research
 SEB Commodities Research Nasdaq OMX Stockholm Nov 5-2014 Bjarne Schieldrop Head of SEB Commodities Research Bjarne.schieldrop@seb.no +47 9248 9230 2005 2006 2007 2008 2009 2010 2011 2012 2013 2014 Aug-13
Cattle Market Outlook & Important Profit Factors for Cattle Producers
 Cattle Market Outlook & Important Profit Factors for Cattle Producers Dr. Scott Brown Agricultural Markets and Policy Division of Applied Social Sciences brownsc@missouri.edu http://amap.missouri.edu $
OIL MARKET OUTLOOK, MAIN UNCERTAINTY FACTORS & PRICE INDICATIONS TO Symposium Energieinnovation
 OIL MARKET OUTLOOK, MAIN UNCERTAINTY FACTORS & PRICE INDICATIONS TO 2020 11. Symposium Energieinnovation 23 February 2010 Johannes Benigni JBC Energy GmbH 10. Februar 2010 Research Energy Studies Consulting
The Houston Economy Jesse Thompson Regional Business Economist The Federal Reserve Bank of Dallas, Houston Branch January 2017
 The Houston Economy Jesse Thompson Regional Business Economist The Federal Reserve Bank of Dallas, Houston Branch January 2017 Image from http://peoplesguidetohouston.wordpress.com/category/uncategorized/
Outlook for U.S. Retail Food Prices and Inflation in 2009
 Outlook for U.S. Retail Food Prices and Inflation in 2009 Ephraim Leibtag, PhD Food Markets Branch, Food Economics Division ERS-USDA Presented at the 2009 Agricultural Outlook Forum Global Agriculture
The Houston Economy Jesse Thompson Regional Business Economist The Federal Reserve Bank of Dallas, Houston Branch February 2017
 The Houston Economy Jesse Thompson Regional Business Economist The Federal Reserve Bank of Dallas, Houston Branch February 2017 Image from http://peoplesguidetohouston.wordpress.com/category/uncategorized/
Canadian Teleconference: Can the Canadian Economy Survive the Turmoil in the United States?
 Canadian Teleconference: Can the Canadian Economy Survive the Turmoil in the United States? Nigel Gault Chief U.S. Economist Dale Orr Canadian Macroeconomic Services Copyright 2008 Global Insight, Inc.
Market Outlook January,
 Market Outlook 2004 January, 2004 www.teekay.com Forward Looking Statements This document contains forward-looking statements (as defined in Section 21E of the Securities Exchange Act of 1934, as amended)
Beef Outlook. Regional Dealer Event. February 9, Dr. Scott Brown Agricultural Markets and Policy Division of Applied Social Sciences
 Beef Outlook Regional Dealer Event February 9, 2018 Dr. Scott Brown Agricultural Markets and Policy Division of Applied Social Sciences brownsc@missouri.edu http://amap.missouri.edu $ Per Cwt. MED. & LRG.
US imports from emerging economies have grown rapidly
 US imports from emerging economies have grown rapidly Ratio to GDP (current dollars) 0.07 US merchandise imports, 1978 2008 0.06 0.05 0.04 0.03 0.02 Industrial Non-OPEC other 0.01 0 OPEC = Organization
MUSTAFA MOHATAREM Chief Economist, General Motors
 MUSTAFA MOHATAREM Chief Economist, General Motors INTRODUCTION The U.S. economy continues to grow at a gradual but also erratic pace The current recovery is one of the slowest in the post-wwii U.S. history.
FREIGHT AND LOWER COMMODITY PRICES METAL BULLETIN INTERNATIONAL IRON ORE SYMPOSIUM
 FREIGHT AND LOWER COMMODITY PRICES METAL BULLETIN INTERNATIONAL IRON ORE SYMPOSIUM JUNE 215 PRESENTATION STRUCTURE current situation acutely depressed actual & expected earnings China slowdown more severe
Oil for Heating and Transportation Maine Per Capita Use is High A 2017 Perspective Presented by Jamie Py
 Oil for Heating and Transportation Maine Per Capita Use is High A 2017 Perspective Presented by Jamie Py October 2017 Perspectives Maine Fuel Marketer Background 2017 Reducing Oil Use. The Why and How
Dry Bulk Shipping in Indonesia Opportunities & Outlook
 Dry Bulk Shipping in Indonesia Opportunities & Outlook Mare Forum, Jakarta 27 Peter Malpas 29 th November 27 Introduction Indonesia Key Facts Land Area 1,919,44 km2 = World s s 16 th Largest Population
The New Drivers for Black Sea and World Grain Copyright AgResource Company. All Rights Reserved.
 The New Driers for Black Sea and World Grain - 2014 Copyright 2014 2013 AgResource Company. All Rights Resered. Ag Market Driers for 2014? World Food inflation to rise 3.2% in 2013 (s 2.7% in 2012) drien
Global Oil Supplies: Is Supply Constrained? Kevin Lindemer
 Global Oil Supplies: Is Supply Constrained? Kevin Lindemer Is Supply Constrained? Signposts continue to indicate a supply constrained world is possible and could emerge, not-with-standing short-term easing.
2018 Annual Economic Forecast Dragas Center for Economic Analysis and Policy
 2018 Annual Economic Forecast Dragas Center for Economic Analysis and Policy PRESENTING SPONSOR EVENT PARTNERS 2 The forecasts and commentary do not constitute an official viewpoint of Old Dominion University,
RISI LATIN AMERICAN CONFERENCE. (São Paulo, 16 August 2016) The Latin American Economy: Some Successes, Many Disappointments
 The Latin American Economy: Some Successes, Many Disappointments") RISI LATIN AMERICAN CONFERENCE (São Paulo, 16 August 2016) The Latin American Economy: Some Successes, Many Disappointments Andrea Boltho Magdalen College University of Oxford and Oxford Economics GDP
RISI LATIN AMERICAN CONFERENCE (São Paulo, 16 August 2016) The Latin American Economy: Some Successes, Many Disappointments Andrea Boltho Magdalen College University of Oxford and Oxford Economics GDP
Status and futures in the fishmeal industry
 Status and futures in the fishmeal industry By Gunn Strandheim Irish Pelagic Seminar Killybegs, Ireland 11th of November - 211 Global fishmeal production Subject. Resource situation in the fishmeal industry
Shifts in the Geopolitical Landscape and Their Impact on Petroleum Sector Capex Strategies
 Shifts in the Geopolitical Landscape and Their Impact on Petroleum Sector Capex Strategies Golden, CO April 14, 2016 Thomas A. Petrie, CFA Chairman, Petrie Partners Figure 1 Chaos Prevails Russia Wins
Living with limits: growth, resources and climate change Martin Wolf, Associate Editor & Chief Economics Commentator, Financial Times
 Living with limits: growth, resources and climate change Martin Wolf, Associate Editor & Chief Economics Commentator, Financial Times Grantham Institute for Climate Change Annual Lecture 2011 3 rd November
Pressure building in the tin market?
 Pressure building in the tin market? DATE: 25 May 2017 PREPARED BY: Cui Lin PREPARED FOR: SHFE Conference Presentation overview 2016 in review Recent market trends The outlook for supply and demand Summary
Global Economic & Truck-Market Overview: The Next Five Years
 AUTOMOTIVE Global Economic & Truck-Market Overview: The Next Five Years 22 September 2016 Hannover, Germany Andrej Divis, Director, IHS Automotive +1 703 346 2331, Andrej.Divis@ihsmarkit.com 2 Index, over
Perspectives on the long-term outlook for iron ore
 Perspectives on the long-term outlook for iron ore John Barkas john.barkas@metalytics.com.au Iron Ore 2015 Perth WA, 13 July 2015 Disclaimer Metalytics is a consultancy based in Sydney, Australia that
Babson Capital/UNC Charlotte Economic Forecast. May 13, 2014
 Babson Capital/UNC Charlotte Economic Forecast May 13, 2014 Outline for Today Myths and Realities of this Recovery Positive Economic Signs Negative Economic Signs Outlook for 2014 The Employment Picture
Main Outlook update results and drivers Wildcards and Emerging Issues
 The outlook for agricultural markets in the next decade: focus on price variability Jacinto Fabiosa Co-Director, FAPRI (515) 294-6183 jfabiosa@iastate.edu FAPRI Food and Agricultural Policy Research Institute
BC Pension Forum. Economic Outlook. Presented by: Ben Homsy, CFA Portfolio Manager
 BC Pension Forum Economic Outlook Presented by: Ben Homsy, CFA Portfolio Manager 1694 1704 1713 1723 1732 1741 1751 1760 1770 1779 1788 1798 1807 1817 1826 1836 1845 1854 1864 1873 1883 1892 1901 1911
Statisticians Firouz Azarnia Monica Psenner Gertrud Schmidl Hannes Windholz Pantelis Christodoulides. Editor Jerry Haylins. Art Designer Alaa Al-Saigh
 Data supply Head, Data Services Department Fuad Al-Zayer Statistical Systems Analyst Denie Tampubolon Statisticians Firouz Azarnia Monica Psenner Gertrud Schmidl Hannes Windholz Pantelis Christodoulides
Global Containerboard Outlook
 Global Containerboard Outlook European Conference March 2018 Gleb Sinavskis Economist, European Paper Packaging Copyright 2018 RISI, Inc. Proprietary Information Gleb Sinavskis Economist, European Paper
Presentation outline The recent history of price volatility? Drivers of price volatility? Prospects for future price volatility? Why does price volati
 Oil price volatility: how can it be managed? Professor Paul Stevens Distinguished Fellow, Chatham House Professor Emeritus, University of Dundee Visiting Professor, University College London (Australia)
Impact of the Global Economic Crisis on the Energy Industries and Economy
 ILO Tripartite Caribbean Conference Promoting Human Prosperity beyond the Global Financial Crisis Kingston Jamaica 1-2 April 2009 Impact of the Global Economic Crisis on the Energy Industries and Economy
Current situation and prospects for copper, nickel, lead and zinc
 Global Commodities Forum Palais des Nations, Geneva 22-23 March 2010 Current situation and prospects for copper, nickel, lead and zinc by Mr. Don Smale, Secretary General, International Lead and Zinc Study
SUMMARY. Natural Gas In The World 2017 Edition
 CEDIGAZ, the International Association for Natural Gas SUMMARY Natural Gas In The World 217 Edition CEDIGAZ, October 217 NATURAL GAS IN THE WORLD 217 SUMMARY Worldwide proven natural gas reserves grew
FREIGHT DYNAMICS IN THE LOW PRICE CLIMATE METAL BULLETIN INTERNATIONAL IRON ORE SYMPOSIUM
 FREIGHT DYNAMICS IN THE LOW PRICE CLIMATE METAL BULLETIN INTERNATIONAL IRON ORE SYMPOSIUM JUNE 216 PRESENTATION STRUCTURE year-to-date freight market in perspective 1q16 sees vessel earnings sink to historic
Alistair Wallace. Director, Senior Consultant and Nitrogen Team Lead CRU Group. Nitrogen Outlook
 Alistair Wallace Director, Senior Consultant and Nitrogen Team Lead CRU Group Nitrogen Outlook Strong demand fundamentals underpin nitrogen market, but... Presentation Structure...producers have overcooked
Zions Bank Economic Overview
 Zions Bank Economic Overview Kenworth National Dealers Conference November 8, 2018 1 National Economic Conditions 2 Volatility Returns to the Stock Market 27,000 Dow Jones Industrial Average October 10,
U.S Cement Outlook IEEE. Ed Sullivan Group VP, Chief Economist
 U.S Cement Outlook IEEE Ed Sullivan Group VP, Chief Economist 1 Construction Activity Billion Real $ 1,400 1,200 1,000 2014 = 2.5% 2015 = 5.6% 800 600 400 200 0 12 Year Peak-to- Peak Recovery 1998 2000
OPEC MARKET SHARE 60% 50% 40% 30% 20% 10% ACTUAL DOE IEA PEL PIRA DBAB DRI-WEFA
 2025 2030 OPEC MARKET SHARE 60% 50% 40% 30% 20% 10% 0% 22 1970 1975 1980 1985 1990 1995 2000 2005 2010 2015 2020 ACTUAL DOE IEA PEL PIRA DBAB DRI-WEFA PRICE OUTLOOK $60 $50 $40 1999$/BBL $30 $20 $10 $0
Bob Costello Chief Economist & Vice President American Trucking Associations. Economic & Motor Carrier Industry Trends. September 10, 2013
 Bob Costello Chief Economist & Vice President American Trucking Associations Economic & Motor Carrier Industry Trends September 10, 2013 The Freight Economy Washington continues to be a headwind on economic
Have You Ever Heard the Phrase
 Setting the Stage with Dairy Outlook Mark Stephenson Director of Dairy Policy Analysis Have You Ever Heard the Phrase! 3M Money Makes Milk! 5M More Money Makes More Milk! 7M Much More Money Makes Much
Cattle Market Situation and Outlook: 2015 and Beyond
 Cattle Market Situation and Outlook: 2015 and Beyond Derrell S. Peel Breedlove Professor of Agribusiness and Extension Livestock Marketing Specialist Oklahoma State University 2015 Market Setting Global
Southwest Ohio Regional Economy in Context. Richard Stock, PhD. Business Research Group
 Southwest Ohio Regional Economy in Context Richard Stock, PhD. Business Research Group State of the Metro Area (in January Each Year) Total Employment has slowly increased in the last three years after
The Long-term Perspective: IHS Scenarios to 2030 applied to Automotive. Presented by: Nigel Griffiths Chief Automotive Economist IHS Automotive
 The Long-term Perspective: IHS Scenarios to 2030 applied to Automotive Presented by: Nigel Griffiths Chief Automotive Economist IHS Automotive Millions Global Light Vehicle Sales: A Growth Industry Once
How Global Trade Is Driving Demand For Ports
 How Global Trade Is Driving Demand For Ports 17 April, 2018 Dr. Walter Kemmsies Chief Strategist JLL Ports Airports and Global Infrastructure JLL Ports Airports and Global Infrastructure Capital Markets
Energy and commodity price benchmarking and market insights
 DeWitt Energy and commodity price benchmarking and market insights London, Houston, Washington, New York, Portland, Calgary, Santiago, Bogota, Rio de Janeiro, Singapore, Beijing, Tokyo, Sydney, Dubai,
2017/18 Soybean Outlook
 217/18 Soybean Outlook 217 Ag Econ In service Training Dr. S. Aaron Smith, Assistant Professor, Department of Agricultural and Resource Economics, University of Tennessee https://ag.tennessee.edu/arec/pages/cropeconomics.aspx
2018 Soybean, Corn, & Wheat Outlook KY and TN Grain Conference
 2018 Soybean, Corn, & Wheat Outlook KY and TN Grain Conference S. Aaron Smith, Crop Marketing Specialist, Assistant Professor, Department of Agricultural and Resource Economics, University of Tennessee