The transition to sustainable energy
|
|
|
- Charity Craig
- 5 years ago
- Views:
Transcription
1 ATSE Symposium The transition to sustainable energy Peter Littlewood 8 Nov 2016
2 The changing world economy Index Economies less energy intensive Electricity less carbon intensive GDP Electricity Carbon dioxide Population Data from World Bank, BP GDP is 2011 international $ at PPP
3 International cooperation Greenhouse gas emissions (Gt CO 2 ) Historical emissions Projections Data from CAIT/WRI, BNEF Total GHG emissions including land change expressed as Gt CO2 equivalent
4 International cooperation Greenhouse gas emissions (Gt CO 2 ) Historical emissions International meeting in Dec countries (95% of global emissions) Committed reductions in emissions Agreed target of well below 2 C Improve commitments every five years Projections Commitments in 2015 Data from CAIT/WRI, BNEF Total GHG emissions including land change expressed as Gt CO2 equivalent
5 International cooperation Greenhouse gas emissions (Gt CO 2 ) Historical emissions Transition to a low carbon economy: Renewable energy, low carbon energy Integration of supply and demand markets Energy efficiency, storage, advanced metering Demand response, dynamic pricing Projections Commitments in 2015 Required for 2 C Data from CAIT/WRI, BNEF Total GHG emissions including land change expressed as Gt CO2 equivalent
6 Global greenhouse gas emissions Global greenhouse gases (%) 100% 90% 80% 70% 60% 50% 40% 30% 20% 10% 0% 5.2% 3.0% 2.3% 2.0% 1.7% 1.6% 1.6% 1.6% 1.5% 1.4% 1.2% 1.2% 1.0% 1.0% 1.0% 6.7% 13.9% 24.5% Data from WRI/CAIT
7 Temperature anomaly : 0.90 C above 20 th century average 2016: 0.99 C for January to September Temperature anomaly ( C) Data from National Oceanic and atmospheric Administration (NOAA) Temperature relative to the 20 th century average
 2004 2005 2006 2007 2008")

8 Global investment in electricity generation (US$ billion) US$ 348 billion invested in clean energy in 2015 (highest ever) (US$ billion) Declining investment in fossil fuel technologies


9 Investment in renewable energy by region (US$ billion) USA Rest of Americas Europe Africa, Middle East China Rest of Asia Pacific Data from UNEP, Bloomberg New Energy Finance
10 Investment in renewable energy by technology (2015) Solar Wind Biomass % of renewable energy investment is in wind and solar power Hydro 4 Biofuels 3 Geothermal 2 Marine investment (US$ billion) Half a million solar panels installed per day around the world Two wind turbines installed per hour in China Data from UNEP, Bloomberg New Energy Finance, IEA
11 Wind power leaders (end 2015) Wind power capacity (MW) 0 50, , ,000 China USA Germany India Spain UK Canada France Italy 23,025 25,088 13,603 11,205 10,358 8,958 44,947 74,471 China s target was 200,000 MW by 2020 Now increased to 250,000 MW by ,362 GWEC figures, 2015
12 Solar power leaders (end 2015) Solar power capacity (MW) 0 10,000 20,000 30,000 40,000 50,000 China Germany Japan USA Italy UK France Spain Australia India 8,780 6,580 5,440 5,070 5,050 18,920 25,620 34,410 39,700 China s target was 100,000 MW by 2020 Now increased to 150,000 MW by 2020 India s target was 20,000 MW Increased to 100,000 MW by ,530 Data from BP, EPIA, IEA, PVPS (some estimated) Utility and distributed; PV and CSP
13 Feed in tariffs ( ) and auctions ( ) USD/MWh Solar PV USD/MWh Onshore wind Data from BNEF
14 Solar module costs 100 US$ 77.0 / Watt Silicon PV cells cost (US$/Watt) Exponential experience curve Cost falls by 25% when the installed capacity doubles US$ 0.4/W ,000 10, ,000 1,000,000 Cumulative installations (MW) BNEF and other sources Module cost only; total installation cost varies with site
15 Wind farm capacity factors Capacity factor (%) 50% 45% 40% 35% 30% 25% 20% 15% 10% 5% 0% Increasing hub heights Longer blades Improved blade designs Better control systems Australia Europe, USA China India Various sources Typical capacity factors against turbine installation date
16 Levelised costs (global range) Levelised cost (USD/MWh) Imported coal Local coal Low wind speed High wind speed Low irradiance High irradiance New Old Coal Wind Solar Nuclear Wind and solar costs: do not include intermittency Coal costs: do not include carbon Data from various publicly available sources
17 Comparison with Australian wholesale market prices AUD/MWh Wind Solar Queensland Victoria Tasmania New South Wales South Australia Snowy Converted at 1 AUD = 0.76 USD
18 Comparison with Australian wholesale market prices AUD/MWh New coal fired generation New gas fired generation Wind Solar Queensland Victoria Tasmania New South Wales South Australia Snowy Converted at 1 AUD = 0.76 USD
19 The growth of renewable energy Urgency Climate data Air quality Policy support in some countries Economics Lower capital costs Improved performance More competition
20 Global electricity generation 10.8% Nuclear 39.4% Coal Total 24,098 TWh 16.8% Hydro 21.6% Gas 4.4% Oil 2.1% Biomass 3.5% Wind 1.1% Solar 0.3% Geothermal Data from IEA, BP, Shift Project, World Biomass Association
21 Australia electricity generation 61.2% Coal 7.4% Hydro Total 248 TWh 1.4% Biomass 4.1% Wind 2.0% Oil 2.0% Solar 21.9% Gas Data from Australian Government, Chief Economist
22 New South Wales electricity generation 81.1% Coal Total 67 TWh 8.2% Gas 6.3% Hydro 1.3% Biomass 1.3% Wind 1.6% Solar Data from Australian Government, Chief Economist
 0 2 4 6 8 10 12 Average wind speed")
23 Average wind speeds by latitude Latitude Data from 3 Tier, NASA Average wind speed (m/s) Average wind speed (m/s)

24 Australia s weather CSDMS, University of Colorado


")
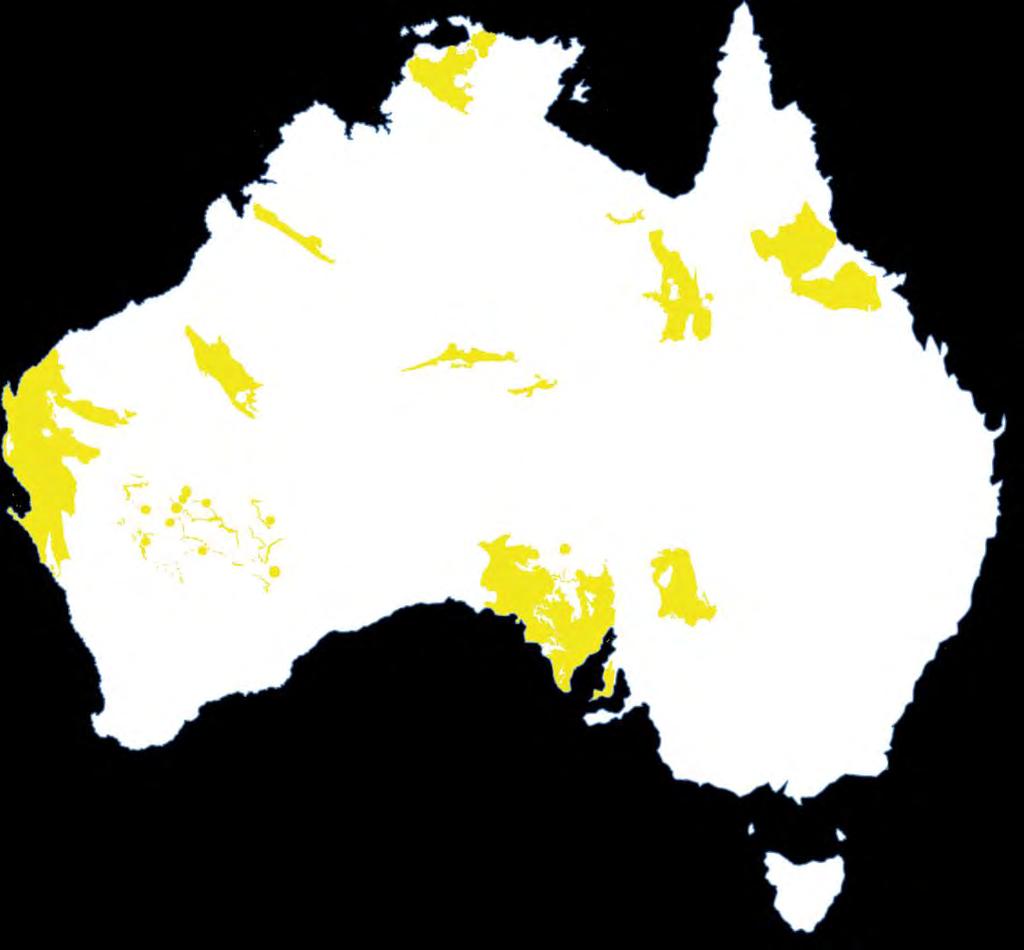
25 China 145,400MW India 23,000MW USA 74,500MW Wind energy resources Good (6 7m/s) Excellent (>7m/s) Germany 45,000MW

26 Wind energy resources Good (6 7m/s) Excellent (>7m/s) Data from Australian Government, Geoscience Australia, Windlab Systems

27 World leaders in solar photovoltaic power (end 2015) USA 25,600MW Germany 39,700MW China 43,500MW Japan 34,400MW 800 1,000 1,200 1,400 1,600 1,800 2,000 2,200 Solar intensity kwh/m 2 /year
 Solar intensity in Germany (39,700MW of solar power) Solar intensity in Japan (34,400MW of solar")
28 Australia s sunlight intensity on a world scale Solar intensity in USA (25,600MW of solar power) Solar intensity in China (43,500MW of solar power) Solar intensity in Germany (39,700MW of solar power) Solar intensity in Japan (34,400MW of solar power)
29 Wind speed Germany India China USA Australia Solar intensity Germany Japan China USA Australia

30 How much land do we need?
31 How much land do we need?
32 Country scale renewable energy Japan India USA China Land areas to generate all electricity from wind or solar

33 Tidal energy Tides of greater than 1m average range


34 Tidal range Areas with the highest tidal range equivalent to around 100W/m 2 Comparable to the highest tidal ranges worldwide Tidal range (m)
35 Wave power (kw/m) South coast of Australia has some of the best wave resources in the world


36 Wave energy Wave power (kw/m) 50TWh/year Data from Geoscience Australia
37 20% of electrical demand from marine power by 2050? Australia (South coast) Wave power (kw/m) Australia (Northwest) Tidal range (m)
 Data from Australian Government,")
38 Australia s geothermal heat Temperature at 5km depth ( C) Data from Australian Government, Geoscience Australia
39 Uranium
 Data from World Nuclear")
40 Known uranium deposits Main users USA France Russia China South Korea Ukraine UK Main suppliers Kazakhstan Canada Australia Niger Namibia Russia Uzbekistan Australia has by far the largest uranium reserves (29% of the World total) Data from World Nuclear Association
41 Coal Million tonnes Million tonnes ,200 1, Composite data from various sources UK coal consumption USA coal consumption No coal fired power generation after 2025
42 -4,000-2, ,000 4,000 6,000 8,000 10,000 12, Energy (PJ) Australia s coal Export Domestic
43 Energy (PJ) Coal markets 2000 to ,000 80,000 70,000 60,000 50,000 40,000 30,000 20,000 10,000 0 Up to 90% of Australian coal exports go to these five countries Domestically produced coal Imported coal China China India Japan Korea Taiwan Data from BP Reducing coal consumption Imported coal will drop first Increasing domestic coal Imported coal will decline Starting to reduce coal consumption to meet climate obligations China may increase coal exports as it reduces its domestic consumption
44 Energy supply and use is in transition Coal and oil were 20 th century fuels Big decisions needed for 21 st century Government policy support Private sector investment and innovation Australia needs an economy without coal Australia has almost every source of primary energy Low carbon technology is an opportunity Australia as a leader in clean energy markets?
FINANCING THE ENERGY TRANSITION
 FINANCING THE ENERGY TRANSITION CLEAN ENERGY INVESTMENT TRENDS: HISTORY AND PROSPECTS GUY TURNER CHIEF ECONOMIST PRESENTATION TITLE, DAY MONTH YEAR 1 CONTENTS 1. Global investment patterns to date 2. UK
Energy Trends and Emissions in the Former Soviet Union
 Energy Trends and Emissions in the Former Soviet Union GTSP Annual Meeting May 29, 2008 Presented by M. Evans Looking back Overview Economic and demographic trends Energy trends and energy intensity Toward
Energy Outlook Global and Domestic Trends and Challenges. Dr. John Caldwell Director of Economics, EEI 1
 Energy Outlook Global and Domestic Trends and Challenges Dr. John Caldwell Director of Economics, EEI 1 World GDP Growth Other Economies are Outpacing the U.S. Other, 7996.16, 11% Africa, 3962.51, 6% Latin
BLOOMBERG NEW ENERGY FINANCE SUMMIT
 BLOOMBERG NEW ENERGY FINANCE SUMMIT NEW YORK 23 APRIL 2013 Michael Liebreich, Chief Executive Bloomberg New Energy Finance Twitter: @miebreich // / / / 1 AGENDA 1. Clean energy investment update 2. Four
An update on Grid parity
 2010 2011 2012 2013 2014 2015 2016 2017 2018 2019 2020 2021 2022 2023 2024 2025 2026 2027 2028 2029 2030 market volume [TWh] 35.000 30.000 25.000 20.000 15.000 10.000 5.000 - RES COM IND An update on Grid
IN THE MIDST OF A PHASE CHANGE
 IN THE MIDST OF A PHASE CHANGE NEW ZEALAND WIND ENERGY ASSOCIATION CONFERENCE, WELLINGTON 2014 KOBAD BHAVNAGRI TWITTER: @KOBADB / / // / Kobad Bhavnagri NZ Wind Energy Association Conference, April 2014
UK Energy Futures. Richard Smith Head of Energy Strategy & Policy
 UK Energy Futures Richard Smith Head of Energy Strategy & Policy September 2012 Our 2012 scenario development Jan. Feb. Mar. Apr. May Jun. Jul. Aug. Sep. Oct. Nov. Dec. Stakeholder workshops (London &
Pacific Rim Coal Marketing
 Wyoming Infrastructure Authority Spring Energy Conference June 11-12, 2015 Cheyanne Pacific Rim Coal Marketing Michael Mewing MC2 Company Pty Limited Pacific Rim Coal Marketing * Asia s reliance on coal
Energy, Economy and Policy: A Glimpse at the 21 st Century
 Gas Well Deliquification Workshop Denver, Colorado February, 2009 Energy, Economy and Policy: A Glimpse at the 21 st Century Scott W. Tinker Bureau of Economic Geology Jackson School of Geosciences The
Living with limits: growth, resources and climate change Martin Wolf, Associate Editor & Chief Economics Commentator, Financial Times
 Living with limits: growth, resources and climate change Martin Wolf, Associate Editor & Chief Economics Commentator, Financial Times Grantham Institute for Climate Change Annual Lecture 2011 3 rd November
Climate Change & India
 Climate Change & India New Delhi How has India warmed over the past 117 years? How the temperatures have increased seasonally? How far away we are from 1.5 degree C target? Methodology 117 years (1901-1916)
Renewable Energy Market Outlook The 5th Northeast Asia Energy Security Forum
 Renewable Energy Market Outlook The 5th Northeast Asia Energy Security Forum Ali Izadi December 12, 2017 Analysis to help you understand the future of energy Solar Wind Power and Utilities Gas Carbon Markets
ENERGY TRANSITION PATHWAYS FOR THE 2030 AGENDA IN ASIA AND THE PACIFIC
 ENERGY TRANSITION PATHWAYS FOR THE 2030 AGENDA IN ASIA AND THE PACIFIC Hongpeng Liu Director, Energy Division, UNESCAP Objectives and progress of Energy Transition Asia-Pacific policy-makers face three
Dr Neil J. Bristow. 8 th WSD Steel Success Strategies European Steel Conference London, 30 th November H & W Worldwide Consulting
 Dr Neil J. Bristow 8 th WSD Steel Success Strategies European Steel Conference London, 30 th November 2010 neil.j.bristow@hwworldwideconsult.com +61240286268 H & W Worldwide Consulting 1. Brief comparison
Vestas Wind Systems A/S
 Vestas Wind Systems A/S Jakob Warnecke, Specialist, Investor Relations 22 September 2016 Vestas Wind Systems A/S Disclaimer and cautionary statement This document contains forward-looking statements concerning
United Nations Conference on Trade and Development
 United Nations Conference on Trade and Development 11 th MULTI-YEAR EXPERT MEETING ON COMMODITIES AND DEVELOPMENT 15-16 April 2019, Geneva Saudi economic growth strategy on the face of oil price uncertainty
Resource use in the World Economy A preliminary assessment
 Resource use in the World Economy 196-25 A preliminary assessment Marina Fischer-Kowalski, Nina Eisenmenger, Fridolin Krausmann Institute of Social Ecology, Vienna Now for the first time it is possible
FutureMetrics. Global Pellet Market Outlook
 FutureMetrics Global Pellet Market Outlook Canadian Bioeconomy Conference June 7, 2018 Seth Walker sethwalker@futuremetrics.com www.futuremetrics.com @Bioeconomist FutureMetrics Intelligent Analysis, Market
ENERGY TRANSITION PATHWAYS FOR THE 2030 AGENDA IN ASIA AND THE PACIFIC
 ENERGY TRANSITION PATHWAYS FOR THE 2030 AGENDA IN ASIA AND THE PACIFIC Mr Hongpeng Liu Director, Energy Division, Economic and Social Commission for Asia and the Pacific Objectives and progress of the
Techno-economic assessment of potential CCS deployment in the Southern African region
 Techno-economic assessment of potential CCS deployment in the Southern African region, ERC in conjunction with World Bank Dubrovnik, Croatia, 4th May 2011 Techno-economic assessment of potential CCS deployment
School of international and Public Affairs. Columbia University Manuel Pinho
 School of international and Public Affairs Columbia University Manuel Pinho SPHERE WITH CORE What matters to China matters to the world Do not give lessons to China: Europe and the US The challenges: Growth
The best design acknowledges that you can't disconnect the form from the material.
 Sir Jonathan Ive Senior Vice President of Design, Apple Inc. The best design acknowledges that you can't disconnect the form from the material. The material informs the form. The only way to make the MacBook
Brazil Baseline and Mitigation Scenarios
 Brazil Baseline and Mitigation Scenarios The 12 th AIM International Workshop William Wills ww@ufrj.br Tsukuba, Japan 19-21, February 2007 CCAP (Center for Clean Air Policy): Dialogue on Future International
ENERGIEWENDE THE GERMAN ENERGY TRANSITION SUCCESSES & CHALLENGES
 Source: thebreakthrough.org ENERGIEWENDE THE GERMAN ENERGY TRANSITION SUCCESSES & CHALLENGES FJERNVARMEINDUSTRIENS ENERGIPOLITISKE KONFERENCE 31. MARTS 2016 AGENDA 1. German energy supply - facts & figures
Cheese (American, Italian, Hard, Soft, Fresh and Others) Market - Global Industry Analysis, Size, Share, Growth, Trends and Forecast,
 Market - Global Industry Analysis, Size, Share, Growth, Trends and Forecast,") Cheese (American, Italian, Hard, Soft, Fresh and Others) Market - Global Industry Analysis, Size, Share, Growth, Trends and Forecast, 2013-2019 ResearchMoz include new market research report" Cheese (American,
Cheese (American, Italian, Hard, Soft, Fresh and Others) Market - Global Industry Analysis, Size, Share, Growth, Trends and Forecast, 2013-2019 ResearchMoz include new market research report" Cheese (American,
Session 4. Growth. The World Economy Share of Global GDP Year 2011 (PPP)
") Session 4. Growth Stylized Facts on Standards of Living across Countries Characterizing Growth over 1 Years: The US Economy Growth Dynamics of the G7 Countries and the OECD Economies Characterizing Growth
Session 4. Growth Stylized Facts on Standards of Living across Countries Characterizing Growth over 1 Years: The US Economy Growth Dynamics of the G7 Countries and the OECD Economies Characterizing Growth
Multidimensional Analysis
 Multidimensional Analysis of Macro Sustainability of Russia: New Methods for Measuring Progress Dr Stanislav Shmelev, Senior Research Fellow, Oxford University, UK E-mail: s.shmelev@ouce.ox.ac.uk Tel:
Market Insights. March 29, 2019
 March 29, 2019 Economic Overview 2 Global & Regional Growth Forecasts IMF GDP Forecasts (% change YoY) 2010 2011 2012 2013 2014 2015 2016 2017 2018 Advanced Economies 1.2% 1.4% 2.1% 2.3% 1.7% 2.4% 2.3%
Market Insights. June 30, 2018
 June 30, 2018 Economic Overview 2 Global & Regional Growth Forecasts IMF GDP Forecasts (% change YoY) 2010 2011 2012 2013 2014 2015 2016 2017 2018 Advanced Economies 1.7% 1.2% 1.3% 2.1% 2.3% 1.7% 2.3%
Opening address for dinner-debate
 Opening address for dinner-debate Mohammed Barkindo Acting for the OPEC Secretary General European Parliament Strasbourg, France 4 July 2006 1 Outline Importance of EU-OPEC Energy Dialogue Current oil
Why is it so challenging being the world s most competitive energy technology?
 Christian Kjaer CEO, Danish Wind Turbine Owners Association 6. February 2018 Why is it so challenging being the world s most competitive energy technology? WINTERWIND, Åre, Sweden The onshore and offshore
Car Production. Brazil Mexico. Production in thousands. Source: AMIA Asociacion Mexicana de la industria automotriz.
 Car Production Production in thousands 4000 3000 2000 1000 Brazil Mexico 0 2013 2014 2015 Source: AMIA Asociacion Mexicana de la industria automotriz. Mexico s Expanding Middle Class Percent of population
The Changing Global Economy Impacts on Seaports and Trade Dr. Walter Kemmsies
 The Changing Global Economy Impacts on Seaports and Trade Dr. Walter Kemmsies Chief Economist, PAGI Group, JLL (Port, Airport & Global Infrastructure) Agenda Where are we in the cycle? What are the barriers
Impacts of the Global Economy on Asia Pacific Travel. 29 June 2007 John Walker
 Impacts of the Global Economy on Asia Pacific Travel 29 June 2007 John Walker jwalker@oxfordeconomics.com Oxford Economics Founded in 1981 Over 300 clients including blue chip companies and government
The World Nuclear Industry Status Report
 The World Nuclear Industry Status Report 1 st International Conference on Nuclear Risks International Nuclear Risk Assessment Group (INRAG) Antony Froggatt Independent Consultant and Senior Research Fellow
Comparison of urban energy use and carbon emission in Tokyo, Beijing, Seoul and Shanghai
 International Workshop on Urban Energy and Carbon Modeling, February 5-6, 28, AIT Centre, Asian Institute of Technology, Pathumthani, Thailand Comparison of urban energy use and carbon emission in Tokyo,
What can we expect from the energy markets in 2017?
 What can we expect from the energy markets in 2017? Luc De Leersnyder & Jens Lievens E&C Consultants 23/11/2016 What do we do? ENERGY PROCUREMENT CONSULTANCY Gas & electricity Focused on price, not on
The power of the wind
 The Vestas profile The power of the wind The wind has been a key factor in world economy for thousands of years. However, the fundamental principle remains the same transforming wind energy into motion.
ROLE OF COPPER IN CHILEAN ECONOMY
 ROLE OF COPPER IN CHILEAN ECONOMY Patricio Meller, Bernardo Lara & Gonzalo Valdés January 2010 1 Basic Data: Chile 2009 Population (millions) 17 Yn/cap (US$ PPP) 14,299 GDP (billions US$) 243 Territory
Global Construction Outlook: Laura Hanlon Product Manager, Global Construction Outlook May 21, 2009
 Global Construction Outlook: Short-term term Pain, Long-term Gain Laura Hanlon Product Manager, Global Construction Outlook May 21, 2009 What This Means for You The world is set to be hit this year with
Challenges, Prospects & Opportunities. Seychelles Fisheries Sector
 Challenges, Prospects & Opportunities Seychelles Fisheries Sector Geographical Location General information Total population: 94,000 people Total territory: 1,374,000 km 2 Land/Ocean territory:459 km 2
Global economic cycle has slowed
 Year-on-year % change Confidence index, 50= no change Global economic cycle has slowed 25% 70 20% International trade growth 65 15% 10% Industrial production growth 60 5% 55 0% 50-5% Business confidence
THE ECONOMIC, CLIMATE, FISCAL, POWER, AND DEMOGRAPHIC IMPACT OF A NATIONAL FEE-AND- DIVIDEND CARBON TAX
 THE ECONOMIC, CLIMATE, FISCAL, POWER, AND DEMOGRAPHIC IMPACT OF A NATIONAL FEE-AND- DIVIDEND CARBON TAX Regional Economic Models, Inc. Study Authors Scott Nystrom, M.A. Regional Economic Models, Inc. (REMI)
Percent
 Outline Outline Growth is picking up Percent 6 Advanced economies Emerging and developing economies 5 4 4.9 5.0 4.3 4.4 4.6 4.7 4.7 3.7 3.7 3 2 2.0 2.3 1.6 2.2 2.3 1.9 1.7 1 1.1 1.3 0 2012 2013 2014 2015
Market Opportunities for Irish Dairy 2025
 Market Opportunities for Irish Dairy 2025 National Dairy Conference 2014 Red Cow Moran Hotel, Dublin Aidan Cotter Chief Executive Wednesday, 19 th November, 2014 AIDAN COTTER BORD BIA CHIEF EXECUTIVE 28
International Trade Economic Forecasts An Overview of Orange County and Southern California Exports
 International Trade Economic Forecasts An Overview of Orange County and Southern California Exports Mira Farka Adrian R. Fleissig Institute for Economic and Environmental Studies Orange County / Inland
PHASE CHANGE AND THE GLOBAL ENERGY SYSTEM SMITH SCHOOL, UNIVERSITY OF OXFORD. Oxford, 28 November 2014
 Oxford, 28 November 2014 PHASE CHANGE AND THE GLOBAL ENERGY SYSTEM SMITH SCHOOL, UNIVERSITY OF OXFORD Michael Liebreich, Chairman of the Advisory Board Twitter: @mliebreich PHASE CHANGE Phase Change (n):
The Nordic countries in figures
 The Nordic countries in figures 2010 Order your Nordic Statistica Yearbook 2010 on www.norden.org Nordic countries in figures 2010 ANP 2010:773 T RY K S A G N R. 541-618 Nordic countries in figures 2010
China s Industrial Capabilities and Trade
 China s Industrial Capabilities and Trade Loren Brandt Thomas Rawski June 16, 2005 Key Facts: China, 2003 Population: 1.3 billion (1 st ) GNP: $US 1.4 trillion (3 rd ) Foreign Trade: $US 850.1 (3rd) GNP
Building on Kyoto: Towards a Realistic Global Climate Change Agreement and What Australia Should Do
 Building on Kyoto: Towards a Realistic Global Climate Change Agreement and What Australia Should Do Warwick J. McKibbin & Peter J. Wilcoxen ANU Public Lecture, 3 July 2008 Overview Climate Science Lessons
US imports from emerging economies have grown rapidly
 US imports from emerging economies have grown rapidly Ratio to GDP (current dollars) 0.07 US merchandise imports, 1978 2008 0.06 0.05 0.04 0.03 0.02 Industrial Non-OPEC other 0.01 0 OPEC = Organization
Mexican Light Vehicle Outlook
 Mexican Light Vehicle Outlook LXXXIII Junta Automotriz CIEMEX March 2008 George M. Magliano Director of Auto Industry Americas Guido Vildozo Senior Market Analyst South America Pascual Francisco Senior
Airlines, the economy and air transport demand
 Airlines, the economy and air transport demand Brian Pearce, Chief Economist, IATA www.iata.org/economics Airline Industry Economics Advisory Workshop 2016 1 Returns for airlines investors lower this year;
International Economic Outlook: Shifting International Trade Routes
 International Economic Outlook: Shifting International Trade Routes Larry Boorstein, Project Manager, AECOM Prepared for Shifting International Trade Routes, January 29-30, 2015, Tampa, presented by AAPA
Dry Bulk Shipping in Indonesia Opportunities & Outlook
 Dry Bulk Shipping in Indonesia Opportunities & Outlook Mare Forum, Jakarta 27 Peter Malpas 29 th November 27 Introduction Indonesia Key Facts Land Area 1,919,44 km2 = World s s 16 th Largest Population
The Great Convergence: China, India and the new global economy. Mark Thirlwell Program Director, International Economy July 2006
 The Great Convergence: China, India and the new global economy Mark Thirlwell Program Director, International Economy July 2006 India Two views of the largest economies in 2005 Top 12 economies by GDP,
22 November 2016 OFFSHORE WIND EUROPE. Offshore wind smashes $100/MWh. Tom Harries
 22 November 2016 OFFSHORE WIND EUROPE Offshore wind smashes $100/MWh Tom Harries A full version is available to BNEF subscribers. If you are not a BNEF subscriber but would like to know more about the
The Australia US FTA: implications for international education
 The Australia US FTA: implications for international education Prepared for The Path to Cultural Understanding and Development 18th IDP Australian International Education Conference, Sydney 5-8 October
Lawrence J. Lau 刘遵义. CSIS Forum Washington, D.C., 22nd May 2013
 U.S.-China Economic Relations in the Next Ten Years: Towards Deeper Engagement and Mutual Benefit Lawrence J. Lau 刘遵义 Ralph and Claire Landau Professor of Economics, The Chinese Univ. of Hong Kong and
Oil Crises and Climate Challenges 30 Years of Energy Use in IEA Countries
 Crises and 30 Years of Energy Use in IEA Countries Fridtjof Unander, International Energy Agency ISED Meeting, UN, 13 September 2004 Aim of the Study Review of trends in energy use and CO 2 emissions since
Electricity Price Impacts from CO2 Restrictions
 Electricity Price Impacts from CO2 Restrictions presented by: Douglas J. Gotham State Utility Forecasting Group presented to: Indiana Center for Coal Technology Research March 6, 2008 Outline Background
Sulphur Market Outlook
 Sulphur Market Outlook Meena Chauhan Head of Sulphur and Sulphuric Acid Integer Research The Fertilizer Institute Outlook and Technology conference Fort Lauderdale, Florida Founded in 2002, Integer Research
Impacts of CO2 Restrictions on Indiana Electricity Prices
 Impacts of CO2 Restrictions on Indiana Electricity Prices presented by: Douglas J. Gotham State Utility Forecasting Group presented to: Indiana Utility Regulatory Commission April 9, 2008 Outline Background
Indiana Electricity Projections and Renewable Energy
 Indiana Electricity Projections and Renewable Energy Presented by: Douglas J. Gotham, Director State Utility Forecasting Group Purdue University Presented to: 2012 Energy & Water Education Conference Indianapolis,
Webinar: Trends in renewable energy support
 Webinar: Trends in renewable energy support Is the Spanish case a forerunner for the rest of the EU? Matthew Jones Senior Analyst EU Power & Carbon Anise Ganbold Senior Analyst EU Power & Carbon 12 July
Assessing Australia s Innovative Capacity in the 21 st Century
 Assessing Australia s Innovative Capacity in the 21 st Century Professor Joshua Gans MBS & IPRIA University of Melbourne November, 2003 This presentation is based on the National Innovative Capacity Project,
SUMMARY. Natural Gas In The World 2017 Edition
 CEDIGAZ, the International Association for Natural Gas SUMMARY Natural Gas In The World 217 Edition CEDIGAZ, October 217 NATURAL GAS IN THE WORLD 217 SUMMARY Worldwide proven natural gas reserves grew
Israel Innovation Authority
 Israel Innovation Authority Danny Biran VP, International Division innovationisrael.org.il Hi-Tech - Major Impact on the Israeli Economy of Employees Of Business Sector GDP of Exports 4.3 Global Leadership
18 th May Global Steel Industry Trends: Is the perception the reality?
 18 th May 2004 Global Steel Industry Trends: Is the perception the reality? Investors have perceived the steel industry negatively Poor returns over the long term, high volatility, relatively small size
2017 Major Projects Pipeline Report Adrian Hart, Senior Manager Infrastructure & Mining
 2017 Major Projects Pipeline Report Adrian Hart, Senior Manager Infrastructure & Mining Major Projects Pipeline Report - 2017 Presentation Outline Key findings of the 2017 Pipeline Report The outlook for
Opportunities in a Challenging Global Business Environment: Can the World Avoid a Double-Dip?
 Opportunities in a Challenging Global Business Environment: Can the World Avoid a Double-Dip? Ross DeVol Chief Research Officer (310) 570 4615 rdevol@milkeninstitute.org www.milkeninstitute.org Presentation
Global trade: how does it look?
 Edmonton, December 2018 Global trade: how does it look? Marie-France Paquet The Office of the Chief Economist Global Affairs Canada Overview 1. Canadian economy at a glance 2. Provincial economy at a glance
Economy-wide (general equilibrium) analysis of Philippines mitigation potential
 analysis of Philippines mitigation potential") Global Trade Analysis Project Economy-wide (general equilibrium) analysis of Philippines mitigation potential Erwin Corong Center for Global Trade Analysis, Purdue University Crowne Plaza Hotel, Manila
Global Trade Analysis Project Economy-wide (general equilibrium) analysis of Philippines mitigation potential Erwin Corong Center for Global Trade Analysis, Purdue University Crowne Plaza Hotel, Manila
India: Can the Tiger Economy Continue to Run?
 India: Can the Tiger Economy Continue to Run? India s GDP is on the rise US$ trillions Nominal GDP (left axis) GDP growth (right axis) 3.0 2.5 2.0 1.5 1.0 0.5 0.0 1990 1992 1994 1996 1998 2000 2002 2004
Maximizing Tourism Marketing Investments A Canadian Perspective
 Maximizing Tourism Marketing Investments A Canadian Perspective Understanding the potential of markets Economics: GDP; Inflation; Unemployment; Employment; Disposable Income; Private Consumption; Consumer
Trade Growth - Fundamental Driver of Port Operations and Development Strategies
 Trade Growth - Fundamental Driver of Port Operations and Development Strategies Marine Terminal Management Training Program October 15, 2007 Long Beach, CA Paul Bingham Global Insight, Inc. 1 Agenda Economic
Sustainable Energy Innovation: Kosovo and The Clean Energy Transition NOAH KITTNER, DANIEL KAMMEN PHD, MS, ENERGY AND RESOURCES, UC BERKELEY
 Sustainable Energy Innovation: Kosovo and The Clean Energy Transition NOAH KITTNER, DANIEL KAMMEN PHD, MS, ENERGY AND RESOURCES, UC BERKELEY 1 Clean Energy Transition Research Agenda 1. Replacing aging
Some Facts About Output
 Some Facts About Output GNP as a Percentage of GDP in 2009 Country % Kuwait 110,38 United Kingdom 102 Japan 103,14 United States 99,24 China 100,87 Germany 101,41 Mexico 98,34 Poland 96,76 Ireland 81,19
Global growth forecasts Key countries/regions,
 Global growth forecasts Key countries/regions, 2014-2018 Percent 7 6 5 4 3 2 1 0 Developing Asia Sub-Saharan Africa Middle East and North Africa Latin America and the Caribbean United States Euro area
Financial annexes
 2019-2021 Financial annexes Agenda Macro scenario Thermal generation Renewables Infrastructure & Networks Retail Enel Group 62 2019-2021 Macro scenario Macro scenario GDP, CPI, FX GDP (%) CPI (%) FX against
Marine Energy industry in Scotland. April 2013
 Marine Energy industry in Scotland April 2013 Policy- Government Targets Scottish Targets 50% of electricity demand to be met by Renewables by 2015 100% of Scottish demand by 2020 Currently at 39% 30%
Michael Cramer MEP. Closing Plenary Velo-City Global. Cycling in Europe. Presentation by Michael Cramer Taipei, March 1 st 2016
 Michael Cramer MEP Closing Plenary Velo-City Global Cycling in Europe Presentation by Michael Cramer Taipei, March 1 st 2016 The fundamental problem in Europe without a change of mobility we will not stop
Evolution of the Projected World Nuclear Capacity for the Year 2000 and of the Installed Capacity, , in GWe
 NUCLEAR ENERGY World GWe 45 4 35 Evolution of the Projected World Nuclear Capacity for the Year 2 and of the Installed Capacity, 196-22, in GWe Projected world nuclear capacity for the year 2 World installed
Wind and Tidal - Benefits and Opportunities in Australia
 Wind and Tidal - Benefits and Opportunities in Australia Presented by MR MATTHEW KEYS, BEng (Civil) Lead Analysis Engineer Carnegie Corporation Ltd 2007 Carnegie Corporation Ltd Outline Ocean Energy Introduction
ITALIAN PV MARKET WORKSHOP ON PV INCENTIVE PROGRAMS
 ITALIAN PV MARKET WORKSHOP ON PV INCENTIVE PROGRAMS Rome, March 8 th 2004 THE ITALIAN PV MARKET A Young Market Net Metering permitted only since Dec. 2000 Subsidy Programme launched in 2001 Managed by
The outlook: what we know, the known unknowns and the unknown unknowns
 The outlook: what we know, the known unknowns and the unknown unknowns 24 April 2017 Seoul Brian Pearce, Chief Economist, IATA www.iata.org/economics Airline Industry Economics Advisory Workshop 2016 1
COMMENTS ON THE INDUSTRIAL POLICY: THE CASE OF TURKEY
 MINISTRY OF DEVELOPMENT, REPUBLIC OF TURKEY COMMENTS ON THE INDUSTRIAL POLICY: THE CASE OF TURKEY Umut GÜR Head of Department of Industry 10 May 2013 Panel on Industrial Policies, TEPAV, Ankara 1 1923
SPM 9541 November 2010 Aad Correljé
 Gas system & actor description: The case of the Dutch gas system June 29, 2011 SPM 9541 November 2010 Aad Correljé 1 The Natural Gas Market Value chain Set up of regulatory and market system in the Netherlands
Economic & Financial Market Outlook
 Economic & Financial Market Outlook BC Pension Forum March 1, 2013 Chris Lawless, Chief Economist Overview Global forces Recent economic performance ~ US, Europe, Japan, China ~ Other emerging markets
USJI Event Is the TPP a Source of Cooperation or Conflict?: Japan s Perspective
 USJI Event Is the TPP a Source of Cooperation or Conflict?: Japan s Perspective May 17, 2012 Shujiro URATA Waseda University 1.TPP: Trans Pacific Partnership Agreement Origin: P4 (Chile, New Zealand, Singapore,
International and Niche Markets for Wave and Tidal Energy. Neil Ferguson
 International and Niche Markets for Wave and Tidal Energy Neil Ferguson Scottish Enterprise Scottish Enterprise aims to deliver a significant, lasting effect on the Scottish economy. Our four interconnected
Feeding fish to fish is this a responsible practice?
 Feeding fish to fish is this a responsible practice? Andrew Jackson Technical Director International Fishmeal & Fish Oil Organisation Humber Seafood Summit 15 July 2010 IFFO International Fishmeal and
Agricultural Outlook: Rebalancing U.S. Agriculture
 Agricultural Outlook: Rebalancing U.S. Agriculture Michael J. Swanson Ph.D. Agricultural Economist January 2018 2018 Wells Fargo Bank, N.A. All rights reserved. For public use. The U.S. Ag Sector renormalizes!
Three-speed economic recovery
 Three-speed economic recovery Projection after 2012 GDP growth, percent 10 8 6 4 2 0-2 Euro area -4-6 1992 1996 2000 2004 2008 2012 2016 Source: IMF WEO, April 2013. Emerging market and developing economies
Future Global Trade Trends - Risks & Opportunities. Pulse of the Ports: Peak Season Forecast March 21, 2013
 1 Future Global Trade Trends - Risks & Opportunities Pulse of the Ports: Peak Season Forecast March 21, 2013 June 2012 Dr. Walter Kemmsies Chief Economist Summary Higher economic growth in 2013, possible
Ensuring Reliability in ERCOT
 Ensuring Reliability in ERCOT Beth Garza Director, ERCOT IMM bgarza@potomaceconomics.com 512-225-7077 February 27, 2018 2 Data Comparisons ERCOT Population (million) 24 80 Germany Annual electricity consumption
The Power Generation Mix and 3E Consequence: The Implications for Taiwan. Yi-Hua Wu, Chia Hao Liu, Hancheng Dai and Toshihiko Masui
 The Power Generation Mix and 3E Consequence: The Implications for Taiwan Yi-Hua Wu, Chia Hao Liu, Hancheng Dai and Toshihiko Masui 1 Introductions Purpose Investigate the impacts of various power generation
Annual Stockholders Meeting May 12, President s Report 2013 Results of Operations
 Annual Stockholders Meeting May 12, 2014 President s Report 2013 Results of Operations 1 2013 GDP Growth Philippines +7.2% Thailand +2.9% Malaysia +4.7% Singapore +4.1% Indonesia +5.8% Source: Bangko Sentral
Geothermal Utilization in Iceland
 Geothermal Utilization in Iceland 85 Years of Experience ICEF 2014 Tokyo Bjarni Bjarnason CEO The Geothermal Resource 30 C/km The total amount of heat stored in the crust of the Earth is of the order of
The History of the Future Price of Oil
 The History of the Future Price of Oil JJ Dooley, MA Wise and PJ Runci Joint Global Change Research Institute May 28, 2008 PNNL-SA-60763 Climate change is a long-term strategic problem with implications