Germany, the Euro and a new economic theory Prof. Dr. Heiner Flassbeck
|
|
|
- Gabriel Burns
- 5 years ago
- Views:
Transcription
1 Kopenhagen, October 5, 2018 Germany, the Euro and a new economic theory Prof. Dr. Heiner Flassbeck
2 Redistribution favouring high employment? Unemployment and wage share 2) in the western world 3) 56% 10 55% 9 54% 8 53% 7 52% 6 51% Unemployment (right axis) Compensation 5 50% 4 49% 3 Unemployment rate in percent of active population; 2) Compensation of employees in percent of nominal GDP; 3) GDP-weighted average figures of Germany, France, Italy, Spain, UK, Sweden, Denmark, Finland, USA and Canada Source: AMECO
3 In the US: No change in the pattern of unemployment but lower wage share Unemployment and compensation 2) in the US 59% Compensation 12 56% 10 53% 8 50% 47% Unemployment (right axis) % 2 Unemployment rate in percent of active population; 2) Compensation of employees in percent of nominal GDP Source: AMECO
4 In Europe: A much lower wage share but very high unemployment Unemployment and wage share 2) in Europe 3) 59% 56% Unemployment (right axis) % 8 50% 6 47% Compensation 4 44% 2 Unemployment rate in percent of active population; 2) Compensation of employees in percent of nominal GDP; 3) GDP-weighted average figures of Germany, France, Italy, Spain, UK Source: AMECO
5 in percent of active population Why did Europe fail so miserably? Unemployment Europe 2) United States 0 Unemployment rate in percent of active population; 2) GDP-weighted average of Germany, France, Italy, Spain, UK Source: AMECO
6 Ratio in % of working population With an unchanged wage share the US performs much better than Europe Unemployment in different countries 14 EMU 2) Japan USA Ratio of unemployed to working population, saisonally adjusted, harmonized. 2) 18 EMU-countries. Source: Eurostat
7 Ratio in % of working population But Germany seems to refute Unemplyoment in the EMU EMU 2) Italy 9 France 7 Germany Ratio of unemployed to working population, saisonally adjusted, harmonized. 2) 18 EMU-countries. Source: Eurostat
8 Index 2000 = 100 Are real wages lagging behind productivity the recipe for success? 120 Real wages and productivity 2) per hour in Germany Productivity Real wages Gross income from employed labour, price-adjusted with GDP deflator, per hour worked by employees, 2000 = 100; Value for 2016 of the average number of hours worked by employees has been estimated 2) Real gross domestic product in national currency per hour of employment, 2000 = 100 Source: AMECO, OECD
9 Index 2000 = 100 Did France miss the right economic theory? 120 Real wages and productivity 2) per hour in France Real wages Productivity Gross income from employed labour, price-adjusted with GDP deflator, per hour worked by employees, 2000 = 100; Value for 2016 of the average number of hours worked by employees has been estimated 2) Real gross domestic product in national currency per hour of employment, 2000 = 100 Source: AMECO, OECD
10 Muss man wie Deutschland zugunsten der Reichen umverteilen, um die Arbeitslosigkeit zu bekämpfen?
11 Lag Frankreich mit einer Politik des Ausgleichs ganz falsch? Income Inequality (share of pre-tax national income) 50% 45% Middle 40% 40% 35% Top 10% 30% 25% Bottom 50% 20% 15% Source: WID
12 Arbeitslosenrate in % Reallohn pro Stunde (in 2005er Preisen) Warum war Griechenland nicht erfolgreich mit seiner drastischen Reallohnsenkung? Reallohn pro Stunde (Produzentenlohn) 2) Arbeitslosenrate Reallohn pro Stunde (Konsumentenlohn) 3) Arbeitslose in %, im Verhätlnis von beschäftigten zu unbeschäftigten Personen; Definitiert von Eurostat, linke Skala 2) Vergütung von Angestellten pro tatsächlich gearbeiteter Stunde; BIP-Deflator einbezogen, rechte Skala 3) Vergütung von Angestellten pro tatsächlich gearbeiteter Stunde; Deflator für privaten Verbrauch einbezogen, rechte Skala Quelle: Ameco (Mai 2013), Werte für 2013 sind Schätzungen der EU-Kommission.
13 Index 1999 = In particular not since the Beginning of EMU Productivity France 110 Germany Real gross domestic product in national currency per hour of employment, 1999 = 100 Source: AMECO
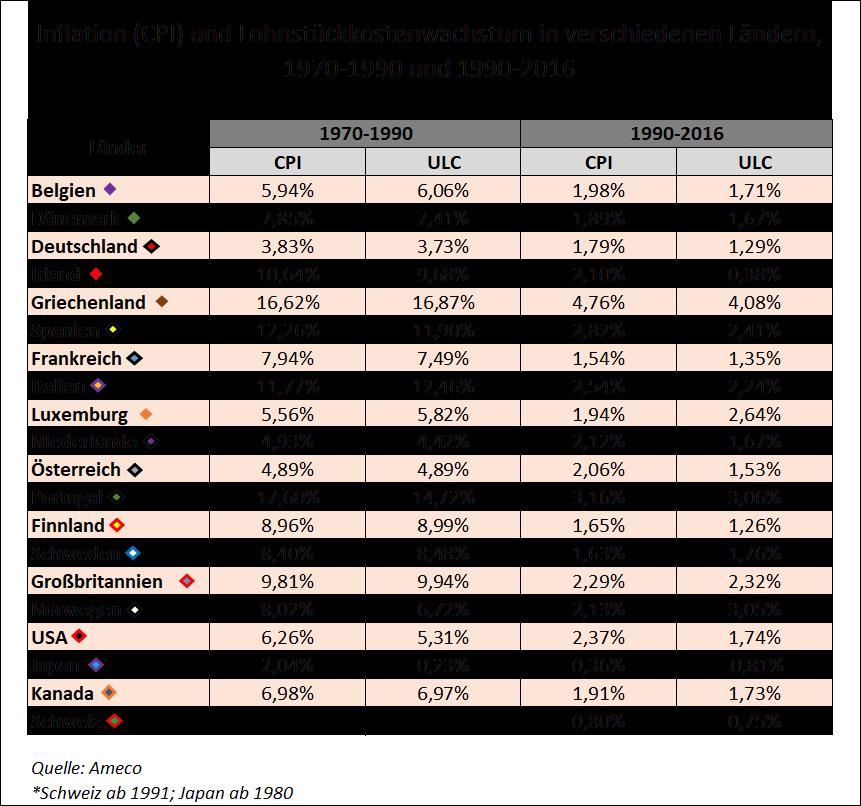
14 Ø annual rate of change of ULC in % The relevant relationship: Wages determine prices not employment 18% Inflation (CPI) und ULC Growth in different countries, and % 14% 12% R² = 0, % 8% 6% 4% 2% 0% -2% 0% 2% 4% 6% 8% 10% 12% 14% 16% 18% 20% Ø annual rate of change of CPI in % Source: Ameco; Apart from Switzerland all countries are marked with two dots for the given period of time. Japan ab CPI stands for consumer price inflation.
15 Ø annual rate of change of ULC in % Even better by using the GDP-Deflator 18% Inflation (GDP) und ULC Growth in different countries, and % 14% 12% R² = 0, % 8% 6% 4% 2% 0% -2% -2% 0% 2% 4% 6% 8% 10% 12% 14% 16% 18% Ø annual rate of change of GDP in % Source: Ameco; Apart from Switzerland all countries are marked with two dots for the given period of time. Japan ab 1980.
16 Index 1999 = 100 But Germany is cheaper 135 ULC France Germany Gross income from employed labour in national currency (euro) per employee in relation to real gross domestic product per employee; 1999 = 100 Source: AMECO
17 Index 2000 = 100 Real effective exchange rates 130 Italy France Germany = 100, based on unit labour costs (total economy); Performance relative to the rest of the former EU-15: double export weights Source: AMECO
18 Index 2000 = 100 World Export Shares (Goods) Germany Italy France = 100 Source: IMF, Direction of Trade Statistics
19 Index 1999 = Germany is too cheap in comparison to the inflation target 150 Greece Italy Spain France 120 ECB target: 1.9% Germany 90 Ratio of compensation per employee to real GDP per person employed; Index 1999 = 100 Source: AMECO. Geneva and Zurich, February 2015
20 Index 1999 = 100 and absurdly forces the others to deflationary adjustment ULC in Euro Inflation EMU (CPI) EMU w/o Germany 2) Inflation target 1.9% Germany Gross income from salaried employment in national currency per employee in relation to real gross domestic product per employee; Index 1999 = 100; 2) ULC growth rates of member countries weighted with GDP Source: AMECO
21 In % of GDP... Germany s success is of a mercantilist nature Current account balance of Germany and France 10% 8% 6% 4% Germany 2% 0% -2% France -4% In % of GDP; 2017: Estimates of the commission Source: AMECO
22 in % of GDP Its financial balances are unsustainable Currenct account balance of economic sectors In Germany 8 6 Private households 4 2 Companies Government -6-8 Foreign countries 2) -10 In % of nominal GDP; 2) Negative values mean foreign debt Source: AMECO
23 in % of GDP... once upon a time Germany has been a true market economy 10 8 West Germany Private households Foreign countries 2) Government -4-6 Companies As a percentage of nominal gross domestic product 2) Negative values mean foreign debt Geneva and Zurich, February 2015 Source: Deutsche Bundesbank, Ameco.

24 Critical Analyses on Politics and Economics Visit us at Publisher: Prof. Dr. Heiner Flassbeck & Dr. Paul

25
The structure of the euro area recovery
 The structure of the euro area recovery Rolf Strauch, Chief Economist JPMorgan Investor Seminar, IMF Annual Meetings Washington, October 2017 The euro area: a systemic player in global trade Trade openness
sector: recent developments VÍTOR CONSTÂNCIO
 The economy and the banking sector: recent developments VÍTOR CONSTÂNCIO January 2006 Recent performance of the economy and prospects Factors behind the period of slow growth Challenges to the Banking
Seven Lean Years Explaining Persistent Global Economic Weakness
 Seven Lean Years Explaining Persistent Global Economic Weakness 9 June 2015 Bank of Canada and European Central Bank Conference Tim Lane Deputy Governor Bank of Canada The global economy remains weak and
The Herzliya Indices. National Security Balance The Civilian Quantitative Dimension. Herzliya Conference Prof. Rafi Melnick, IDC Herzliya
 The Herzliya Indices National Security Balance The Civilian Quantitative Dimension Herzliya Conference 2015 Prof. Rafi Melnick, IDC Herzliya 1990 1991 1992 1993 1994 1995 1996 1997 1998 1999 2000 2001
Austria: Key Economic Features
 Austria: Key Economic Features and EU Guanghua School of Management Josef Christl, Macro-Consult 16. Oktober 2017 Austria: a small, but rich country Population, mn. GDP per capita PPP, USD 1600 60000 1400
Comment on: Productivity Growth, Wage Growth and Unions by Kügler, Schönberg and Schreiner
 Comment on: Productivity Growth, Wage Growth and Unions by Kügler, Schönberg and Schreiner Michael C. Burda Humboldt-Universität zu Berlin, CEPR and IZA ECB Forum Sintra, 20 June 2018 What this paper does
Lithuanian export: is it time to prepare for changes? Aleksandr Izgorodin Expert
 Lithuanian export: is it time to prepare for changes? Aleksandr Izgorodin Expert Export is the main locomotive behind growth in LT economy Lithuania: change in real GDP and its components, % 78,2 71,8
RISI EUROPEAN CONFERENCE. (Barcelona, 6 March 2018) The European Economy Things look good just now. Can this last?
 The European Economy Things look good just now. Can this last?") RISI EUROPEAN CONFERENCE (Barcelona, 6 March 2018) The European Economy Things look good just now. Can this last? Andrea Boltho Magdalen College University of Oxford and Oxford Economics CONCLUSIONS OF
RISI EUROPEAN CONFERENCE (Barcelona, 6 March 2018) The European Economy Things look good just now. Can this last? Andrea Boltho Magdalen College University of Oxford and Oxford Economics CONCLUSIONS OF
The Baltic economies: Current situation and future trends, possibilities and pitfalls
 The Baltic economies: Current situation and future trends, possibilities and pitfalls Riga, 15 October 2015 Morten Hansen Head of Economics Department, Stockholm School of Economics in Riga Member of the
Economic Outlook March Economic Policy Division
 Economic Outlook March 212 Economic Policy Division Real GDP Outlook Percent Change, Annual Rate 2 1 1 - -1 197 197 198 198 199 199 2 2 21 U.S. GDP Actual and Potential Quarterly, Q1 197 to Q4 211 Real
THE ICELANDIC ECONOMY AN IMPRESSIVE RECOVERY BUT WHAT CHALLENGES LIE AHEAD?
 THE ICELANDIC ECONOMY AN IMPRESSIVE RECOVERY BUT WHAT CHALLENGES LIE AHEAD? FROM BUST TO BOOM. AN EPIC BUST After 16 years of growth with a short pause for breath in 2002, the Icelandic economy entered
Emerging from the euro debt crisis Making the single currency work
 Emerging from the euro debt crisis Making the single currency work Dr. Michael Heise, Allianz SE American Institute for Contemporary German Studies Johns Hopkins University Washington D.C., August 20,
Lecture 3 The Lisbon Strategy
 Lecture 3 The Lisbon Strategy Outline The Lisbon European Council held in March 2000 recognized the need of reforming labour,, product, and financial markets in order the performance of the EU economy
Better in than out? Economic performance inside and outside the European monetary union. Roma, Rapporto Europa 2015
 Better in than out? Economic performance inside and outside the European monetary union Rapporto Europa 2015 Roma, 9.7.2015 1 Table of Content I. The political threat Why European monetary union? II. Europe
After the British referendum
 Future of Europe After the British referendum Broader issues for the UK and the EU David Marsh, Managing Director, OMFIF 27 October 2016 Nicosia 1 European politics moves against integration A new phase
National Responses to the Eurozone Crisis
 National Responses to the Eurozone Crisis Which Labour Market Reform Strategy? Germany, Netherlands, Spain and Ireland Introduction What has been the policy response of European and national actors to
The Eurozone integration, des-integration and possible future developments
 The Eurozone integration, des-integration and possible future developments 18 th Monetary Policy Workshop at the Berlin School of Economcs and Law, 12 13 October 2017 Overview Position 1: The euro itself
URBAN LAND INSTITUTE
 URBAN LAND INSTITUTE 2012 ULI FALL MEETING (Denver, 18 October 2012) The Global Economic Outlook Dark clouds on the horizon Andrea Boltho Magdalen College University of Oxford Oxford Economics and REAG
Poland: Europe s economic outperformer. Piotr Bujak Chief Economist at Nordea Bank Polska PKO Bank Polski Group. Copenhagen, 29 April 2014
 Poland: Europe s economic outperformer Piotr Bujak Chief Economist at Nordea Bank Polska PKO Bank Polski Group Copenhagen, 29 April 2014 Poland crisis-proof economic front-runner 300 250 200 % Cumulated
U.S. Overview. Gathering Steam? Tuesday, October 1, 2013
 U.S. Overview Gathering Steam? Tuesday, October 1, 2013 Uneven global economic recovery Annual real GDP growth projections (%) Projections 2013 2014 World 3.1 3.1 3.8 United States 2.2 1.7 2.7 Euro Area
Macroeconomic Imbalances in
 Macroeconomic Imbalances in the Euro Area Jürgen von Hagen Rome, 21 May 2011 Europe: Growing imbalances within, balanced without 8 6 4 2 0-2 -4-6 10 Figure 1A: Current Account Balances IE EL FR FI IT SE
Outline. Overview of globalization. Global outlook for real economic activity & inflation. Risks to the outlook
 2017 International Economic Outlook Everett Grant Research Economist Globalization & Monetary Policy Institute Federal Reserve Bank of Dallas October 2017 The views expressed are those of the author and
World real GDP growth in 2010 Annual percent change
 World real GDP growth in 2010 Annual percent change 1 or more 6-1 3-6% 0-3% Less than No data Source: International Monetary Fund. World real GDP growth in 2011 Annual percent change 1 or more 6-1 3-6%
IRELAND: EUROPE S FASTEST GROWING ECONOMY
 IRELAND: EUROPE S FASTEST GROWING ECONOMY Remarkable turnaround story continues to get better S&P Capital IQ June 9 th, 2015 Index Page 3: Macroeconomy Page 13: Fiscal & NTMA Funding Page 23: Rebalancing
The economic value of the EU shipping industry. Andrew P Goodwin
 The economic value of the EU shipping industry Andrew P Goodwin 2 nd April 2014 Introduction Shipping is a vital facilitator of world trade 135 % Increase in world GDP in the last two decades 180 % Increase
Grasshoppers, Ants and Locusts: the future of the world economy
 Ralph Miliband Series on the Restructuring of World Power Grasshoppers, Ants and Locusts: the future of the world economy Martin Wolf Associate editor and chief economics commentator, Financial Times Professor
Western Health Care Systems: Under Pressure from Demography
 Western Health Care Systems: Under Pressure from Demography Nicholas Eberstadt Henry Wendt Chair in Political Economy American Enterprise Institute eberstadt@aei.org Presentation at Panel on Health Care
Global Economic Outlook
 Global Economic Outlook Mark A. Wynne Vice President & Associate Director of Research Director, Globalization & Monetary Policy Institute Federal Reserve Bank of Dallas Presentation to Vistas Conference
Global Economic Outlook: From Fiscal Cliff to Rushcliffe in 15 minutes. Tom Rogers. Lead Economist, Oxford Economics.
 Global Economic Outlook: From Fiscal Cliff to Rushcliffe in 15 minutes Tom Rogers Lead Economist, Oxford Economics trogers@oxfordeconomics.com 16 th January 2013 Overview External environment showing signs
GENDER INEQUALITY IN THE LABOR MARKET
 Table 1.1 Four Measures of Gender Equality, Country Rankings, Mid-1990s Full-Time Occupational Wage Employment Work Integration Equality (1 to 21) (1 to 15) (1 to 18) (1 to 12) Sweden 1 14 6 8 Finland
RBC Economics Financial Update Dawn Desjardins
 RBC Economics Financial Update Dawn Desjardins CICA/RBC Q4 2011 Business Monitor Economic Results Overview Business and Economic Optimism Begin to Stablize 100 % 80 % 60 % 40 % 20 % 0 % National Optimism
Panel on Post-Crisis Growth Performance Determinants, Effects and Policy Implications
 Panel on Post-Crisis Growth Performance Determinants, Effects and Policy Implications Carmen M. Harvard University Bank of Canada and European Central Bank Conference Ottawa, June 8-9, 2015 1 Outline (i)
BC Pension Forum. Economic Outlook. Presented by: Ben Homsy, CFA Portfolio Manager
 BC Pension Forum Economic Outlook Presented by: Ben Homsy, CFA Portfolio Manager 1694 1704 1713 1723 1732 1741 1751 1760 1770 1779 1788 1798 1807 1817 1826 1836 1845 1854 1864 1873 1883 1892 1901 1911
O F C E N M JANUARY 1998
 O F C E SIMULATION PROPERTIES OF MIMOSA, A MULTI-COUNTRY MACROECONOMIC MODEL N M-98-01 JANUARY 1998 HERVÉ LE BIHAN FRÉDÉRIC LERAIS * * The current version of the MIMOSA model was estimated by a CEPII-OFCE
Dick Vos Senior Manager Research & Strategy
 Dick Vos Senior Manager Research & Strategy! House prices now falling at fastest rate since early 1990s House prices will fall 7% in 'uncertain' market IMF warns on global house prices House prices Through
MONETARY AND FISCAL POLICIES DURING THE NEXT RECESSION
 OXYGEN EVENTS CONFERENCE GALA PERFORMANCE 2017 MONETARY AND FISCAL POLICIES DURING THE NEXT RECESSION - THE CASE OF ROMANIA - Ph.D. Andrei RĂDULESCU Senior Economist, Banca Transilvania Researcher, Institute
Retrenchment or Stagnation: Lessons from Japan s Lost Decades. Andrew Smithers. UK-Japan 21 st Century Group Conference 3 rd May, 2013
 Retrenchment or Stagnation: Lessons from Japan s Lost Decades. Andrew Smithers UK-Japan 21 st Century Group Conference 3 rd May, 2013 Slide 1. The Conventional Wisdom. Japan has suffered from two lost
France : Economic developments and reforms, where are we heading?
 France : Economic developments and reforms, where are we heading? The Economic Club of New York : 18 April 2018 François VILLEROY de GALHAU, Governor of the Banque de France 1 WHERE ARE WE STARTING FROM?
Latvia: Experience from the internal devaluation process and the road to EMU
 Latvia: Experience from the internal devaluation process and the road to EMU Bayreuth, 11 January 2012 Morten Hansen Head of Economics Department Stockholm School of Economics in Riga morten.hansen@sseriga.edu
Facing the Crisis in Southern Europe: Demographic, Political and Social Service Dilemmas
 Facing the Crisis in Southern Europe: Demographic, Political and Social Service Dilemmas Manuel Aguilar Hendrickson Universitat de Barcelona manuel.aguilar.hendrickson@ub.edu The Roatch Lecture The Roatch-Haskell
National Transfer Accounts in Mexico
 National Transfer Accounts in Mexico Policy implications: labor market Iván Mejía Guevara imejiag@stanford.edu Stanford University 12th Global Meeting of the NTA Network, Mexico City, July 23-27, 2018
U.S. Economic Activity. Federal Reserve Bank of Dallas
 U.S. Economic Activity Federal Reserve Bank of Dallas 2019 Contents 1 Economic Activity 2 Wages and Prices 3 Financial Activity Economic Activity Economic Activity Index 160 Consumer Confidence and Sentiment
U.S. Economic Activity. Federal Reserve Bank of Dallas
 U.S. Economic Activity Federal Reserve Bank of Dallas 2019 Contents 1 Economic Activity 2 Wages and Prices 3 Financial Activity Economic Activity Economic Activity New Orders for Durable Goods Billions
U.S. Economic Activity. Federal Reserve Bank of Dallas
 U.S. Economic Activity Federal Reserve Bank of Dallas 2019 Contents 1 Economic Activity 2 Wages and Prices 3 Financial Activity Economic Activity Economic Activity Index 160 Consumer Confidence and Sentiment
The Economy of Finland
 The Economy of Finland Aug 30st 2013, Finnish Ministry of Foreign Affairs Presentation for the American Fulbright Grantees Petteri Rautaporras, Economist at the Federation of Finnish Technology Industries
Financial Stability Implications of Changing Global Finance: Policy Panel Global Finance in Transition
 Financial Stability Implications of Changing Global Finance: Policy Panel Global Finance in Transition May 7 and 8, 2013 İstanbul, Turkey Outline 1 The Financial System 2 Weak Growth 3 4 5 Unprecedented
Puget Sound Regional Forecast Chris Mefford Community Attributes
 2015 Puget Sound Regional Forecast Chris Mefford Community Attributes 3 1,000s The Regional Economy has added jobs consistently for nearly 5 full years. In a few months, this will be the longest streak
European Stagnation: Private sector structural balance + fiscal policy
 European Stagnation: Private sector structural balance + fiscal policy Jesper Jespersen, Jesperj@ruc. dk Roskilde University & Aalborg University 21 st April 2017 Secular(?) stagnation in EU 1. Persistently
The future of the Euro Area and Its Enlargement. André Sapir
 The future of the Euro Area and Its Enlargement André Sapir Outline EMU: lessons from the crisis When should Romania join EMU? Lessons from the crisis: What was wrong with EMU 1.0? Impact of EMU on financial
The U.S. Economic Recovery: Why so weak and what should be done? William J. Crowder Ph.D.
 The U.S. Economic Recovery: Why so weak and what should be done? William J. Crowder Ph.D. Weak Recovery? It s no secret that the U.S. economy has still not fully recovered from the financial crisis and
The Nordic countries in figures
 The Nordic countries in figures 2010 Order your Nordic Statistica Yearbook 2010 on www.norden.org Nordic countries in figures 2010 ANP 2010:773 T RY K S A G N R. 541-618 Nordic countries in figures 2010
Figure 1a. Top 1% income share: China vs USA vs France
 22% 20% 18% 16% Figure 1a. Top 1% income share: China vs USA vs China USA 14% 12% 10% 8% 6% 4% 1978 1982 1986 1990 1994 1998 2002 2006 2010 2014 Distribution of pretax national income (before taxes and
Social Convergence, Development Failures and Industrial Relations: The Case of Portugal
 Social Convergence, Development Failures and Industrial Relations: The Case of Pilar González Faculty of Economics, University of Porto António Figueiredo Quaternaire Context joined the EU with very low
Prowess Investment Managers
 gathering clouds: South Africa's economic situation and how it affects you Kelebogile Moloko Prowess Investment Managers what to expect ~ how to identify a recession ~ what are the implications for South
Opportunities in a Challenging Global Business Environment: Can the World Avoid a Double-Dip?
 Opportunities in a Challenging Global Business Environment: Can the World Avoid a Double-Dip? Ross DeVol Chief Research Officer (310) 570 4615 rdevol@milkeninstitute.org www.milkeninstitute.org Presentation
Economic potential of Agriculture and Pig production in Baltic region. Mindaugas Jurgelis, analyst 30 May, 2012
 Economic potential of Agriculture and Pig production in Baltic region Mindaugas Jurgelis, analyst 30 May, 2012 1 Global tendencies of food production 2 Food prices near historical peak level FAO food price
Turkey: Recent Developments and Future Prospects. ISBANK Economic Research Division November 2018
 Turkey: Recent Developments and Future Prospects ISBANK Economic Research Division November 2018 Macroeconomic Outlook Strong Economic Growth Cycle GDP of 851 bn USD (2017), 10.6k USD (2017) per capita
College/high school median annual earnings gap,
 College/high school median annual earnings gap, 1979 2012 In constant 2012 dollars 70,000 dollars Household gap $30,298 to $58,249 60,000 50,000 40,000 Male gap $17,411 to $34,969 30,000 20,000 10,000
Peter Ch. Löschl, ABA Invest in Austria June Austria Investment Climate Reasons to Invest in Austria - Perspectives
 Peter Ch. Löschl, ABA Invest in Austria June 2016 Austria Investment Climate Reasons to Invest in Austria - Perspectives Strong Economy in the Heart of Europe Area: 83,872 km² People: 8.5 m. GDP growth:
India: Can the Tiger Economy Continue to Run?
 India: Can the Tiger Economy Continue to Run? India s GDP is on the rise US$ trillions Nominal GDP (left axis) GDP growth (right axis) 3.0 2.5 2.0 1.5 1.0 0.5 0.0 1990 1992 1994 1996 1998 2000 2002 2004
Economic & Financial Market Outlook
 Economic & Financial Market Outlook BC Pension Forum March 1, 2013 Chris Lawless, Chief Economist Overview Global forces Recent economic performance ~ US, Europe, Japan, China ~ Other emerging markets
Market Insights. March 29, 2019
 March 29, 2019 Economic Overview 2 Global & Regional Growth Forecasts IMF GDP Forecasts (% change YoY) 2010 2011 2012 2013 2014 2015 2016 2017 2018 Advanced Economies 1.2% 1.4% 2.1% 2.3% 1.7% 2.4% 2.3%
Market Insights. June 30, 2018
 June 30, 2018 Economic Overview 2 Global & Regional Growth Forecasts IMF GDP Forecasts (% change YoY) 2010 2011 2012 2013 2014 2015 2016 2017 2018 Advanced Economies 1.7% 1.2% 1.3% 2.1% 2.3% 1.7% 2.3%
Telling Canada s story in numbers Elizabeth Richards Analytical Studies Branch April 20, 2017
 Recent Developments in the Canadian Economy: How have the decline in oil prices and a weaker Canadian dollar affected Canada s economy? www.statcan.gc.ca Telling Canada s story in numbers Elizabeth Richards
Universities and the Education Revolution. Professor Richard Larkins Chair, Universities Australia VC and President Monash University
 Universities and the Education Revolution Professor Richard Larkins Chair, Universities Australia VC and President Monash University Role of Universities in Prosperity Third largest earner of export dollars
By making use of SAFRIM (South African Inter-Industry Macro-Economic Model) By Jeaunes Viljoen, Conningarth Economists, 1
 By Jeaunes Viljoen, Conningarth Economists, 1") By making use of SAFRIM (South African Inter-Industry Macro-Economic Model) By Jeaunes Viljoen, Conningarth Economists, South Africa 10/13/2011 1 1960: The economy experienced high growth rates mining
By making use of SAFRIM (South African Inter-Industry Macro-Economic Model) By Jeaunes Viljoen, Conningarth Economists, South Africa 10/13/2011 1 1960: The economy experienced high growth rates mining
Multidimensional Analysis
 Multidimensional Analysis of Macro Sustainability of Russia: New Methods for Measuring Progress Dr Stanislav Shmelev, Senior Research Fellow, Oxford University, UK E-mail: s.shmelev@ouce.ox.ac.uk Tel:
Global economy maintaining solid growth momentum. Canada leading the pack
 Global economy maintaining solid growth momentum Canada leading the pack Dawn Desjardins (Deputy Chief Economist) (416) 974-6919 dawn.desjardins@rbc.com September 2017 Brighter global outlook gains traction
U.S. and Colorado Economic Outlook National Association of Industrial and Office Parks. Business Research Division Leeds School of Business
 U.S. and Colorado Economic Outlook National Association of Industrial and Office Parks Presented by the Business Research Division Leeds School of Business University of Colorado at Boulder U.S. Economic
Future of Collective Bargaining in Germany and the Importance of the recently introduced Minimum Wage Regulations
 Future of Collective Bargaining in Germany and the Importance of the recently introduced Minimum Wage Regulations Thorsten Schulten Council of Nordic Trade Unions (NFS) & Friedrich Ebert Foundation (FES)
Current Account Imbalances in the Euro Area Discussion by
 Current Account Imbalances in the Euro Area Discussion by Agnès Bénassy-Quéré May 25, 2007 1 International financial integration 6 Avg abs. value of current account in % of GDP 5 4 3 2 1 0 1870-74 1880-84
Some Facts About Output
 Some Facts About Output GNP as a Percentage of GDP in 2009 Country % Kuwait 110,38 United Kingdom 102 Japan 103,14 United States 99,24 China 100,87 Germany 101,41 Mexico 98,34 Poland 96,76 Ireland 81,19
Despite geopolitical woes Lithuania s economy enjoys balanced growth
 Lithuanian Economic Outlook Despite geopolitical woes Lithuania s economy enjoys balanced growth Indrė Genytė-Pikčienė Chief analyst Economic Research Department DNB Markets 30 th of May, 2014 2000 I 2000
Deficit Reduction and Economic Growth: Are They Mutually Exclusive Goals? Tuesday, May 1, 2012; 2:30 PM - 3:45 PM
 Deficit Reduction and Economic Growth: Are They Mutually Exclusive Goals? Tuesday, May 1, 2012; 2:30 PM - 3:45 PM Moderator: Gillian Tett, U.S. Managing Editor, Financial Times Speakers: Jared Bernstein,
Abel M. Mateus Universidade Nova de Lisboa
 Abel M. Mateus Universidade Nova de Lisboa It is widely known the success of Asian Tigers But is less known that Portugal was one of the few countries, similar to the Asian Tigers, that changed from a
Babson Capital/UNC Charlotte Economic Forecast. May 13, 2014
 Babson Capital/UNC Charlotte Economic Forecast May 13, 2014 Outline for Today Myths and Realities of this Recovery Positive Economic Signs Negative Economic Signs Outlook for 2014 The Employment Picture
OECD employment rate increases to 68.4% in the third quarter of 2018
 Paris, 17th January 2019 News Release: 3rd Quarter 2018 OECD employment rate increases to 68.4% in the third quarter of 2018 The OECD area employment rate the share of the working-age population with jobs
The U.S. & Global Economic Outlook Greg Ip, U.S. Economics Editor, The Economist Remarks to The American Sportfishing Association
 The U.S. & Global Economic Outlook Greg Ip, U.S. Economics Editor, The Economist Remarks to The American Sportfishing Association Hilton Head, S.C. Oct. 9, 2012 How We Got Here Great Moderation = More
The Israeli Economy 2009 The Caesarea Center Conference
 The Israeli Economy 2009 The Caesarea Center Conference Provost, Interdisciplinary Center (IDC) Herzliya The Big Issues The broken crystal ball A crisis that happens once in 100 years From a country oriented
16. Key Facts about Long Run Economic Growth
 Fletcher School, Tufts University 16. Key Facts about Long Run Economic Growth E212 Macroeconomics Prof. George Alogoskoufis How we Measure and Compare Living Standards Living standards are usually measured
Labor Markets. Chris Edmond NYU Stern. Spring 2007
 Labor Markets Chris Edmond NYU Stern Spring 2007 1 Today Labor market indicators employment, unemployment, participation Labor supply and demand Cross-country comparisons of labor market outcomes Labor
Muhlenkamp & Company. Webinar December 1, Ron Muhlenkamp, Portfolio Manager Jeff Muhlenkamp, Portfolio Manager Tony Muhlenkamp, President
 Muhlenkamp & Company Webinar December 1, 2016 Ron Muhlenkamp, Portfolio Manager Jeff Muhlenkamp, Portfolio Manager Tony Muhlenkamp, President Muhlenkamp & Company, Inc. Intelligent Investment Management
L emploi des seniors en Allemagne : la mobilisation de plusieurs leviers
 L emploi des seniors en Allemagne : la mobilisation de plusieurs leviers 15 e colloque du COR Emploi des seniors et vieillissement actif en Europe Prof. Axel Börsch-Supan, Ph.D. Munich Center for the Economics
ROYAL MONETARY AUTHORITY OF BHUTAN MONTHLY STATISTICAL BULLETIN
 ROYAL MONETARY AUTHORITY OF BHUTAN MONTHLY STATISTICAL BULLETIN Macroeconomic Research and Statistics Department Vol. XVIl, No.3 March 2018 CONTENTS Preface....01 Bhutan s Key Economic Indicators..02 Table
ROYAL MONETARY AUTHORITY OF BHUTAN MONTHLY STATISTICAL BULLETIN
 ROYAL MONETARY AUTHORITY OF BHUTAN MONTHLY STATISTICAL BULLETIN Department of Macroeconomic Research and Statistics Vol. XVIl, No.9 September 2018 CONTENTS Preface....01 Bhutan s Key Economic Indicators..02
Outlook 2008/09 Life In the Aftermath of the Great Global Credit Crisis. May 8 th, Presented by:
 Outlook 2008/09 Life In the Aftermath of the Great Global Credit Crisis May 8 th, 2008 Presented by: Patricia Croft, Vice President & Chief Economist Phillips, Hager & North Investment Management Limited
The Auction Market In 2015 & 2016 Review & Forecast. Dr. Ira Silver NAAA Economist
 The Auction Market In 2015 & 2016 Review & Forecast Dr. Ira Silver NAAA Economist silver@naaa.com Agenda Economic conditions Economic outlook Light vehicle sales Light vehicle sales outlook NAAA 2015 Annual
The Great Convergence: China, India and the new global economy. Mark Thirlwell Program Director, International Economy July 2006
 The Great Convergence: China, India and the new global economy Mark Thirlwell Program Director, International Economy July 2006 India Two views of the largest economies in 2005 Top 12 economies by GDP,
ROYAL MONETARY AUTHORITY OF BHUTAN MONTHLY STATISTICAL BULLETIN
 ROYAL MONETARY AUTHORITY OF BHUTAN MONTHLY STATISTICAL BULLETIN Department of Macroeconomic Research and Statistics Vol. XVIl, No.11 November 2018 CONTENTS Preface....01 Bhutan s Key Economic Indicators..02
Faroe Islands and Greenland. Faroe Islands. Syssel -border. Municipal border. Danish Geodata Agency
 Faroe Islands Syssel -border Municipal border Danish Geodata Agency (does not belong to a municipality) Municipal border Danish Geodata Agency Faroe Islands and The populations The economy The populations
Forecast evaluation report Robert Chote Chairman
 Forecast evaluation report 2017 Robert Chote Chairman Background to the FER The FER is an annual report looking at the performance of past EFO forecasts against the latest outturn data Rationale Accountability
Maximizing Tourism Marketing Investments A Canadian Perspective
 Maximizing Tourism Marketing Investments A Canadian Perspective Understanding the potential of markets Economics: GDP; Inflation; Unemployment; Employment; Disposable Income; Private Consumption; Consumer
The Shifts and the Shocks Martin Wolf, Associate Editor & Chief Economics Commentator, Financial Times
 The Shifts and the Shocks Martin Wolf, Associate Editor & Chief Economics Commentator, Financial Times Peterson Institute for International Economics 9 th October 2014 Washington DC The Shifts and the
Global trade: how does it look?
 Edmonton, December 2018 Global trade: how does it look? Marie-France Paquet The Office of the Chief Economist Global Affairs Canada Overview 1. Canadian economy at a glance 2. Provincial economy at a glance
POST-KEYNESIAN ECONOMICS
 PERSONAL DISTRIBUTION IN POST-KEYNESIAN ECONOMICS Miriam Rehm, AK Wien and WU Wien FMM Summer School Berlin, 1.8.2017 OVERVIEW Empirics Functional income distribution Personal income distribution Wealth
US imports from emerging economies have grown rapidly
 US imports from emerging economies have grown rapidly Ratio to GDP (current dollars) 0.07 US merchandise imports, 1978 2008 0.06 0.05 0.04 0.03 0.02 Industrial Non-OPEC other 0.01 0 OPEC = Organization
Monetary policy in a fixedexchange-rate. Presentation by Anders Møller Christensen Assistant Governor, Danmarks Nationalbank May 2006
 Monetary policy in a fixedexchange-rate regime Presentation by Anders Møller Christensen Assistant Governor, Danmarks Nationalbank May 2006 MONETARY-POLICY STRATEGIES 24-05-2006 DANMARKS NATIONALBANK 2
Figures & facts around Austrian Government Bonds. Quarterly Report
 Figures & facts around Austrian Government Bonds Quarterly Report September 2018 Primary Market for Government Bonds Auction Calendar 2018 Auction date 09 Jan 2018 06 Feb 2018 06 Mar 2018 10 Apr 2018 08
SA economic review Kevin Lings. August 2018
 SA economic review Kevin Lings August 2018 South Africa real GDP growth year-on-year %y/y 8 7 6 5 Ave 4.3% 4 Ave 2.5% 3 2 Ave 0.9% 1 0-1 -2-3 00 01 02 03 04 05 06 07 08 09 10 11 12 13 14 15 16 17 18 2
Impacts of the Global Economy on Asia Pacific Travel. 29 June 2007 John Walker
 Impacts of the Global Economy on Asia Pacific Travel 29 June 2007 John Walker jwalker@oxfordeconomics.com Oxford Economics Founded in 1981 Over 300 clients including blue chip companies and government