41th meeting of the Advisory Committee
|
|
|
- Oscar Foster
- 5 years ago
- Views:
Transcription

1 41th meeting of the Advisory Committee Marseille, France 8 July 213


2
3 OLIVE OIL BALANCES 211/12-212/13 OLIVE OIL 211/12 (final) (thousand tonnes) 212/13 (prov.) Starting stocks Production Imports Consumption Exports Ending stocks Stocks changes These balances will not be approved until the November 213 session. The figures presented here are likely to change. June 213

4 OLIVE OIL PRODUCTION (thousand tonnes)

5 OLIVE OIL CONSUMPTION (thousand tonnes)
")
6 OLIVE OIL EXPORTS (thousand tonnes)
7 4., 3.5, 3., prod 2.5, 2., auto conso 1.5, 1., export. 5,,
8 2.5, 2., +/- 85 t 1.5, auto conso 1., export 5, +/- 5 t,
9 TREND OF OWN CONSUMPTION 2., 1.8, 1.6, 1.4, 1.2, 1., 8, auto conso UE auto conso otros COI auto conso non COI 6, 4, 2,,
10 1, t OLIVE OIL IMPORTS INTRA EUROPEAN UNION 12 INTRA-EU / 1 21/ 2 22/ 3 23/ 4 24/ 5 25/ 6 26/ 7 27/ 8 28/ 9 29/ 1 21/ 11(est.) 211/ 12(est.) Source: Eurostat
11 OLIVE OIL EXPORTS EU/27 INTRA EUROPEAN UNION (t) EU/27 OLIVE OIL AND OLIVE POMACE OIL EXPORTS 211/12 PARTNER (BUYER) OLIVE OIL OLIVE POMACE TOTAL ITALY 39, , , ,838.7 FRANCE 18,93.4 2, ,721. PORTUGAL 61, , , ,583.7 GERMANY 58, , , ,74.6 UNITED KINGDOM 33, , , ,797.2 SPAIN 26,19.3 8, , ,572.9 BELGIUM 14, , ,529.3 NETHERLANDS 1, ,39.5 2, ,1.4 AUSTRIA 7, , ,866.4 POLAND 6, ,857. 8,572.2 SWEDEN 5, , ,417.3 CZECH REPUBLIC 3, , ,365. GREECE 2, , ,863.5 IRELAND 2, , ,858.8 ROMANIA 2, , ,647.4 DENMARK 3, ,413.1 BULGARIA 1, , ,191. FINLAND 1, ,86.3 LATVIA , ,553.1 HUNGARY 1, ,257.2 LITHUANIA ,152.4 SLOVAKIA 1, ,698.2 LUXEMBOURG 1, ,634.3 SLOVENIA 1, ,571.3 ESTONIA ,189.2 CYPRUS MALTA NOT SPECIFIED INTRA-EU TOTAL 75, , , ,799.4 INTRA-EU OLIVE OIL (t) Source: Eurostat
12 OLIVE OIL IMPORTS EU/27 INTRA EUROPEAN UNION EU/27 OLIVE OIL AND OLIVE POMACE OIL IMPORTS 211/12 IMPORTS INTRA-UE OLIVE POMACE OIL PARTNER OLIVE OIL (SELLER) TOTAL SPAIN 564, , , ,491.3 ITALY 125, , , ,851.1 GREECE 95, , , ,656.7 PORTUGAL 38, , ,275.2 FRANCE 5, , ,965.4 GERMANY 6,75.7 3, ,6.2 BELGIUM 7, , ,3.4 NETHERLANDS 1, ,968.3 UNITED KINGDOM ,492.9 BULGARIA 1, ,341.8 CZECH REPUBLIC ,177.5 AUSTRIA LITHUANIA DENMARK SWEDEN ESTONIA SLOVAKIA LATVIA ROMANIA POLAND CYPRUS HUNGARY IRELAND MALTA FINLAND COUNTRIES INTRA-COM LUXEMBOURG SLOVENIA TOTAL 848, , , ,71,415.1 Source: Eurostat INTRA-EU OLIVE OIL (t)

13


14 OLIVE OIL IMPORTS 211/12 Japan 6% USA 39% EU/27 13% Australia 4% Brazil 9% China 5% Canada 5% Others 19%
 8, OLIVE POMACE OIL OLIVE")

15 WORLD TREND - OLIVE OIL IMPORTS BY CATEGORY (t) 8, OLIVE POMACE OIL OLIVE OIL VIRGIN OLIVE OIL 7, 6, 5, 4, 3, 2, 1, 22/3 23/4 24/5 25/6 26/7 27/8 28/9 29/1 21/11 211/12
16 1, t 35 OLIVE OIL IMPORTS * 199/91 212/ USA / / / / / 9 2/ 1 22/ 3 24/ 5 26/ 7 28/ 9 21/ / 13 tonnes 35. Monthly imports 21/11, 211/12 and 212/13 crop years 3. 21/11 211/12 212/ Including olive-pomace oils October November December January February March April May June July August September Source: United States Department of Agriculture Foreign Agricultural Service
17 Trend of USA. Olive oil* imports by country over the last five crop years (t) Origin 27/8 28/9 29/1 21/11 211/12 t % t % t % t % t % Spain 57, , , , , France Greece 4, , , , , Italy 15, , , , , Portugal 2, , ,61.8 1,89.6 1,875.6 Others EU 1_/ Algeria..... Egypt Morocco 3, , , , , Tunisia 27, , , , , Argentina 8, , , , , Australia 2,65.8 2, ,5.8 1,94.7 1,985.6 Canada Turkey 3, , , ,59.4 3, Others 3, , , , , Total 264, , , , ,95 1. EU 215, , , , , Extra-EU 48, , , , , Including olive-pomace oils Source: United States Department of Agriculture Foreign Agricultural Service
 25. 2. 15. 1. 5.")
 6 Containers < 18 kg Containers > 18 kg 4 2 93/94 94/95 95/96 96/97")
18 USA OLIVE OIL IMPORTS BY CONTAINER Containers > 18 kg Containers < 18 kg CUMULATIVE IMPORTS (tonnes) /94 94/95 95/96 96/97 97/98 98/99 99/ /1 1/2 2/3 3/4 4/5 5/6 6/7 7/8 8/9 9/1 1/11 11/ IMPORTS BY CONTAINER (%) 6 Containers < 18 kg Containers > 18 kg /94 94/95 95/96 96/97 97/98 98/99 99/ /1 1/2 2/3 3/4 4/5 5/6 6/7 7/8 8/9 9/1 1/11 11/12
19 USA - OLIVE OIL IMPORTS BY CATEGORY (t) 35, 3, 25, VIRGIN OLIVE OIL OLIVE OIL OLIVE POMACE OIL TOTAL 2, 15, 1, 5, 22/3 23/4 24/5 25/6 26/7 27/8 28/9 29/1 21/11 211/12

20 Olive Oil Type History
21 1, t 25 OLIVE OIL IMPORTS EUROPEAN UNION 2 Extra-EU tonnes / / 21/ 2 23/ 4 25/ 6 27/ 8 29/ 1 211/ 12 21/11 211/12 212/13 Monthly imports 2111 and 212/13 crop years October November December January February March April May June July August September Source: Eurostat
22 211/12 OLIVE OIL IMPORTS EXTRA-EUROPEAN UNION EXTRA-EU DECLARANT: UE/27 OLIVE OIL IMPORTS (t) EU/27 OLIVE OIL AND OLIVE POMACE OIL IMPORTS 211/12 PARTNER (SELLER) OLIVE OIL OLIVE POMACE OIL TOTAL TUNISIA 85,235. 1, , ,171.1 MOROCCO 1, ,87.6 3,79.4 CHILE 2, ,913.6 AUSTRALIA 1, ,77.6 ARGENTINA 1, ,173.7 EGYPT TURKEY CHINA (PEOPLE'S REPUBLIC OF) PALESTINIAN UNITED STATES ISRAEL LEBANON SWITZERLAND CANADA JAPAN CROATIA SOUTH AFRICA PERU IRAQ JORDAN SYRIAN ARAB REPUBLIC (SYRIA) UNITED ARAB EMIRATES OTHERS TOTAL 94,47.3 2, , ,814.5
23 EUROPEAN UNION - OLIVE OIL IMPORTS BY CATEGORY (t) VIRGIN OLIVE OIL VIRGIN LAMPANTE OLIVE OIL OLIVE OIL OLIVE POMACE OIL /3 23/4 24/5 25/6 26/7 27/8 28/9 29/1 21/11 211/12
24 EUROPEAN UNION - VIRGIN LAMPANTE OLIVE OIL IMPORTS BY COUNTRY (t) VIRGIN LAMPANTE OLIVE OIL OBTAINED FROM THE FRUIT OF THE TUNISIA SYRIA 8 6 MOROCCO TURKEY /3 23/4 24/5 25/6 26/7 27/8 28/9 29/1 21/11 211/12
25 EUROPEAN UNION - OLIVE OIL IMPORTS BY COUNTRY (t) VIRGIN OLIVE OIL OBTAINED FROM THE FRUIT OF THE OLIVE TREE SOLEL TUNISIA SYRIA MOROCCO TURKEY /3 23/4 24/5 25/6 26/7 27/8 28/9 29/1 21/11 211/12
26 1, t 8 OLIVE OIL IMPORTS * 199/91 212/ BRAZIL / / / / / 9 2/ 1 22/ 3 24/ 5 26/ 7 28/ 9 21/ / 13(est.) tonnes 12. Monthly imports 21/11 and 212/13 crop years 21/11 211/12 212/ October November December January February March April May June July August September * Including olive-pomace oils Source: Ministerio do Desenvolvimento, Industria e Comercio Exterior, Brasil

27 BRAZIL OLIVE OIL IMPORTS (t)
28 BRAZIL - OLIVE OIL IMPORTS BY CATEGORY (t) 8, 7, 6, VIRGIN OLIVE OIL OLIVE OIL OLIVE POMACE OIL TOTAL 5, 4, 3, 2, 1, 22/3 23/4 24/5 25/6 26/7 27/8 28/9 29/1 21/11 211/12
29 1, t 5 45 CHINA OLIVE OIL IMPORTS * 1997/98 212/ tonnes / / 21/ 2 23/ 4 25/ 6 27/ 8 29/ 1 211/ 12 21/11 211/12 212/13 Monthly imports 21/11 and 212/13 crop years October November December January February M arch April M ay June July August September Including olive-pomace oils Source: Global Trade International

30 CHINA OLIVE OIL IMPORTS (t)
31 CHINA - VIRGIN OLIVE OIL IMPORTS BY COUNTRY (t) 5, 45, 4, VIRGIN OLIVE OIL OLIVE OIL OLIVE POMACE OIL Total 35, 3, 25, 2, 15, 1, 5, 22/3 23/4 24/5 25/6 26/7 27/8 28/9 29/1 21/11 211/12
32 1, t 5 OLIVE OIL IMPORTS * 199/91 211/ JAPAN / / / / / 9 2/ 1 22/ 3 24/ 5 26/ 7 28/ 9 21/ / 13(est.) tonnes /11 211/12 212/13 Monthly imports 21/11 and 212/13 crop years October November December January February March April May June July August September * Including olive-pomace oils Source: Trade Statistics of Japan Ministry of Finance
33 JAPAN: Olive oil and olive-pomace oil IMPORTS (tonnes) 211/12 CROP YEAR (October September 212) 12 months OLIVE OIL OLIVE POMACE OIL TOTAL TOTAL 1-9- O.O. OO + OPO JAPAN OLIVE OIL IMPORTS (t) Spain 13, , , ,51.7 France Greece Italy 14,491. 6, , , ,268.1 Netherlands Portugal United Kingdom S/Total EU 28, ,23.1 4, , ,382.4 Chile Argentina United States Peru Croatia Turkey 1, , ,84.8 Egypt..... Israel Jordan Lebanon Morocco Syria Tunisia Australia New Zealand Other countries TOTAL 3, , ,14. 2, ,57.9
34 JAPAN- VIRGIN OLIVE OIL IMPORTS BY COUNTRY (t) 5, 45, 4, VIRGIN OLIVE OIL OLIVE OIL OLIVE POMACE OIL Total 35, 3, 25, 2, 15, 1, 5, 22/3 23/4 24/5 25/6 26/7 27/8 28/9 29/1 21/11 211/12
35 1, t 45 4 OLIVE OIL IMPORTS * 199/91 212/ CANADA tonnes 199/ / / / / 9 2/ 1 22/ 3 24/ 5 26/ 7 28/ 9 21/ / 13(est.) 8 Monthly imports 21/11 and 212/13 crop years 7 21/11 211/12 212/ * Including olive pomace oils October November December January February M arch April M ay June July August September Source: Statistics Canada International Trade Division
36 CANADA : Olive oil and olive-pomace oil IMPORTS (tonnes 211/12 CROP YEAR (October September 212) 12 months CANADA OLIVE OILS OPO T O T A L COUNTRY s/total. < 18kg < 18kg > 18kg < 18kg > 18kg OLIVE OIL IMPORTS (t) Germany Austria Belgium Spain , ,97.7 France Greece , , ,219.2 Italy 2, , ,17.7 6, , ,674.9 Irland Luxembourg Portugal United Kingdom s/total EU 3, , ,17.8 7, , ,919.9 Croatia Algeria Egypt Israel Jordan Lebanon Morocco Syria Tunisia , ,997.7 Turkey Argentina Brazil Chile Colombia United States , ,837.1 India Australia Others TOTAL 3, , ,338. 8, , , ,637.4
37 CANADA - VIRGIN OLIVE OIL IMPORTS BY COUNTRY (t) 5, 4, VIRGIN OLIVE OIL OLIVE OIL OLIVE POMACE OIL TOTAL 3, 2, 1, 22/3 23/4 26/7 27/8 28/9 29/1 21/11 211/12
38 1, t 45 4 OLIVE OIL IMPORTS * 199/91 212/ AUSTRALIA tonnes 4 199/ / / / / 9 2/ 1 22/ 3 24/ 5 26/ 7 28/ 9 21/ 11 Monthly imports 21/11 and 212/13 crop years 21/11 211/12 212/ October November December January February M arch April M ay June July August September Including olive-pomace oils Source: Australian Bureau of Statistics
39 AUSTRALIA OLIVE OIL IMPORTS (t)
40 AUSTRALIA : EVOLUCIÓN DE LAS IMPORTACIONES DE ACEITE DE OLIVA POR CATEGORÍA DEL PRODUCTO 45, 4, 35, ACEITE DE OLIVA VIRGEN ACEITE DE OLIVA ACEITE DE ORUJO DE OLIVA TOTAL 3, 25, 2, 15, 1, 5, 22/3 23/4 24/5 25/6 26/7 27/8 28/9 29/1 21/11 211/12
41 OLIVE OIL PRICES versus other oils
42 oct-7 N-7 D-7 E-8 F-8 M-8 A-8 M-8 J-8 J-8 A-8 S-8 oct-8 N-8 D8 E9 F9 M9 A9 M9 J9 J9 A9 S9 oct-9 N9 D9 J1 F1 M1 A1 M1 J1 J1 A-1 S-1 O-1 N-1 D-1 J-11 F-11 M-11 A-11 M-11 J-11 J-11 A-11 S-11 O-11 N-11 D-11 J-12 F-12 M-12 A-12 M-12 J-12 J-12 A-12 S-12 O-12 N-12 D-12 J-13 F-13 M-13 A-13 M-13 PRICES FOR SEED OILS vs VIRGIN OLIVE OIL since Oct 27 US $/tm Extra Virgin Olive Oil (Spain) 27 Corn Oil (FOB Gulf) Cotton Oil (FOB Gulf) Groundnut Oil (CIF Rott.) Soybean Oil (US. FOB Gulf) Sun. Oil (FOB Rape Oil Argentina) (Fob Hamburg) Palm Oil, crude (CIF N.W. Eur.) Source: Oil World Annual
43 PRICE INDICES FOR SEED OILS vs VIRGIN OLIVE OIL 2 Soybean oil, US. (Fob Gulf) Groundnut oil Corn oil (Fob Gulf) virgin olive oil (Spain) Cotton oil (Fob Gulf) Sun oil (Fob Argentina) Palm oil crude (CIF N.W.Eur.) O- 7 O- 8 O- 9 O- 1 O- 11 O- 12 F- 13 M- 13
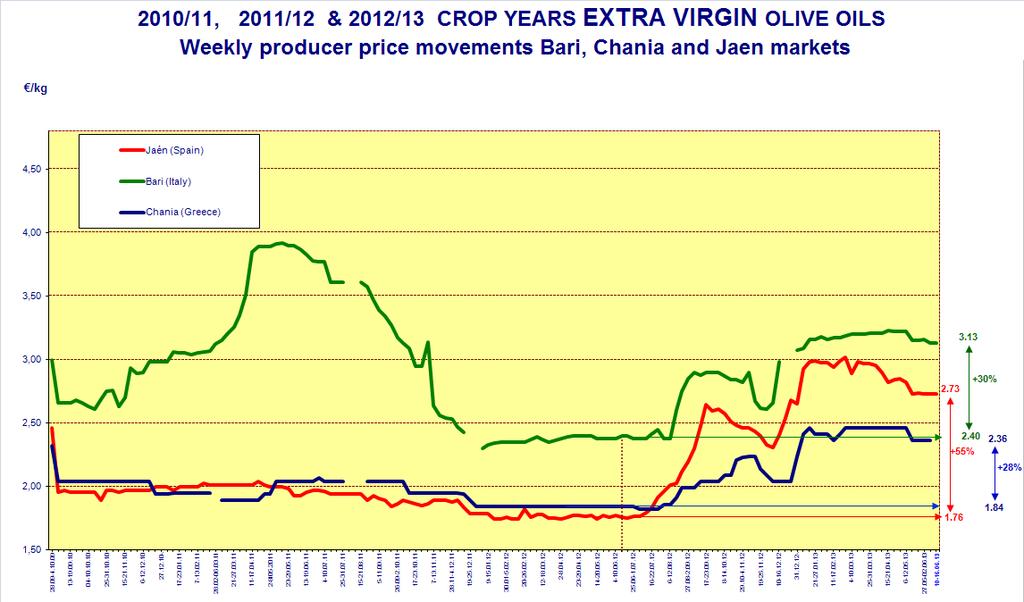
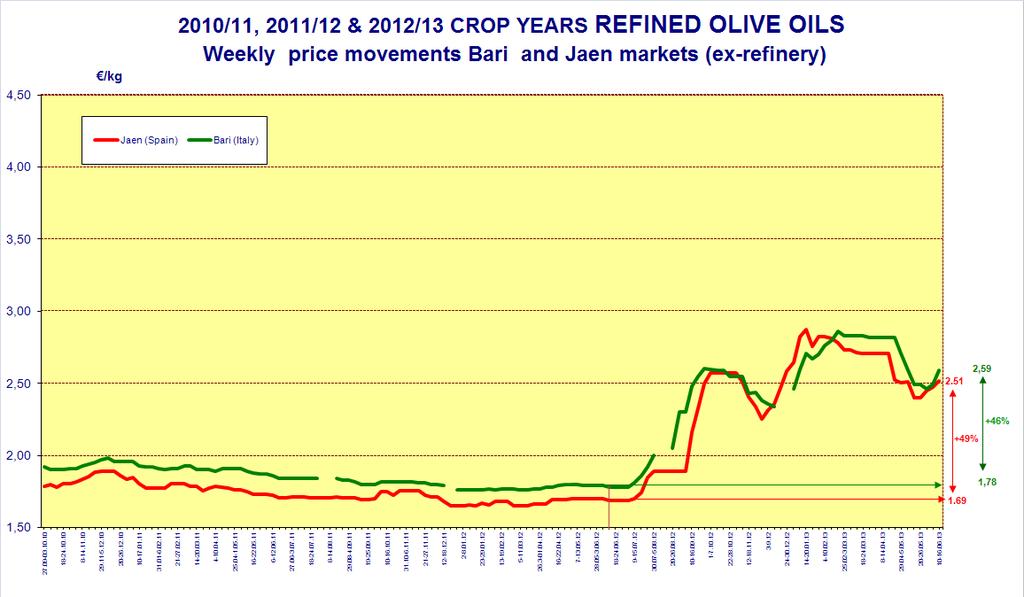
44 OLIVE OIL PRICES producer prices
45 Euros/1 kg 4, 38, 36, 34, 32, Monthly prices Extra Virgin Olive Oil Bari (Italy) Monthly prices Extra Virgin Olive Oil Jaén (Spain) Monthly prices Extra Virgin Olive Oil Iraklion/Messinia (Greece) Monthly prices Extra Virgin Olive Oil Sfax (Tunisia) Monthly prices Extra Virgin Olive Oil Tras os Montes (Portugal) MOVEMENTS IN PRODUCER PRICES EXTRA VIRGIN OLIVE OIL Average monthly prices 3, 28, 26, 24, 22, 2, 18, 16, O-9 N D J F M A M J J A S O-1 N D J F M A M J J A S O-11 N D J F M A M J J A S-12 O N D J F M A M 29 / 1 21 / / / 13
46
47
48 O-8 N D J F M A M J J A S O-9 N D J F M A M J J A S O-1 N D J F M A M J J A S O-11 N D J F M A M J J A S O-12 N D J F M A M-13 Extra virgin olive oil vs refined and vs olive pomace oil in Spain 28/9-212/13 /1kg 35, SPAIN Monthly prices EVOO Jaén 3, SPAIN Monthly prices Refined Cordoba/Sevilla SPAIN Monthly prices OPO Córdoba 25, 2, 15, 1, 5,,
49 J F M A M J J A S O-9 N D J F M A M J J A S O-1 N D J F M A M J J A S O-11 N D J F M A M J J A S O-12 N D J F M A M-13 Extra virgin vs refined and vs pomace in Italy 28/9-212/13 /1kg 45, 4, 35, ITALY Monthly prices EVOO Bari ITALY Monthly prices Refined Bari ITALY Monthly prices OPO Bari 3, 25, 2, 15, 1, 5,,
50 OLIVE OIL PRICES on world market
51 Movements in virgin olive oil * export prices (euros/kg) (FOB euros/kg) since October 28 4,5 Spain to USA Italy to USA 4 Spain to rest world Italy to rest world 3,5 3 2,5 2 * Heading: 1591
52 Movements in virgin olive oil * export prices (euros/kg) (FOB euros/kg) since October 28 4,5 4 Spain to USA Italy to USA 3,5 3 2,5 2 * Heading: 1591
53 6 5,5 5 $/kg Prices and volumes > 18 kg for virgin OO on US market by origin 3 Series4 Series5 25 SPAIN VOO > 18KG ITALY VOO > 18KG 4, , , ,5 28/9 29/1 21/11 211/12
54 Oct. 28 Dec. 28 Feb. 29 Apr. 29 Jun. 29 Aug. 29 Oct. 29 Dec. 29 Feb. 21 Apr. 21 Jun. 21 Aug. 21 Oct. 21 Dec. 21 Feb. 211 Apr. 211 Jun. 211 Aug. 211 Oct. 211 Dec. 211 Feb. 212 Apr. 212 Jun. 212 Aug. 212 Oct. 212 Dec. 212 Feb. 213 April 213 Prices and volumes < 18 kg for Virgin OO on US market by origin $/kg (t) 5,5 12., Spain - VOO < 18KG Italy VOO < 18KG ITALY- VOO < 18KG SPAIN - VOO < 18KG 5 1., 8., 4,5 6., 4 4., 3,5 2., 3,
55 $/kg USA CIF prices for Olive Oil by origin and size 7 SPAIN OO > 18KG 6 SPAIN OO < 18KG 6 ITALY OO > 18KG 5 ITALY OO < 18 KG
56 Movements in olive oil* export prices (euros/kg) 4,5 Italy to rest world Italy to USA 4 Spain to rest world Spain to USA 3,5 3 2,5 2 1,5 * Heading: 1599
57 Oct. 28 Nov. 28 Dec. 28 Jan. 29 Feb. 29 Mar. 29 Apr. 29 May. 29 Jun. 29 Jul. 29 Aug. 29 Sep. 29 Oct. 29 Nov. 29 Dec. 29 Jan. 21 Feb. 21 Mar. 21 Apr. 21 May. 21 Jun. 21 Jul. 21 Aug. 21 Sep. 21 Oct. 21 Nov. 21 Dec. 21 Jan. 211 Feb. 211 Mar. 211 Apr. 211 May.211 Jun. 211 Jul. 211 Aug. 211 Sep. 211 Oct. 211 Nov. 211 Dec. 211 Jan. 212 Feb. 212 Mar. 212 Apr. 212 May. 212 Jun. 212 Jul. 212 Aug. 212 Sep. 212 Oct. 212 Nov. 212 Dec. 212 Jan. 213 Feb. 213 Mar. 213 April 213 CIF virgin olive oil prices on US market 28/9-212/13 from Spain $/kg for sales < 18 kg and > 18 kg OLV OL VRG <18KG CT OLVOL VRG >18KG CT
58 Oct. 28 Nov. 28 Dec. 28 Jan. 29 Feb. 29 Mar. 29 Apr. 29 May. 29 Jun. 29 Jul. 29 Aug. 29 Sep. 29 Oct. 29 Nov. 29 Dec. 29 Jan. 21 Feb. 21 Mar. 21 Apr. 21 May. 21 Jun. 21 Jul. 21 Aug. 21 Sep. 21 Oct. 21 Nov. 21 Dec. 21 Jan. 211 Feb. 211 Mar. 211 Apr. 211 May.211 Jun. 211 Jul. 211 Aug. 211 Sep. 211 Oct. 211 Nov. 211 Dec. 211 Jan. 212 Feb. 212 Mar. 212 Apr. 212 May. 212 Jun. 212 Jul. 212 Aug. 212 Sep. 212 Oct. 212 Nov. 212 Dec. 212 Jan. 213 Feb. 213 Mar. 213 April 213 CIF virgin olive oil prices on US market 28/9-212/13 from Italy $/kg for sales < 18 kg and > 18 kg OLV OL VRG <18KCT OLVOL VRG >18KCT
59 Prix /KG ,5 1 1,5 2 2,5 3 3,5 Oct. 29 Nov. 29 Dec. 29 Jan. 21 Feb. 21 Mar. 21 Apr. 21 May. 21 Jun. 21 Jul. 21 Aug. 21 Sep. 21 Oct. 21 Nov. 21 Dec. 21 Jan. 211 Feb. 211 Mar. 211 Apr. 211 May. 211 Jun. 211 Jul. 211 Aug. 211 Sep. 211 Oct. 211 Nov. 211 Dec. 211 Jan. 212 Feb. 212 Mar. 212 Apr. 212 May. 212 Jun. 212 Jul. 212 Aug. 212 Sep. 212 Oct. 212 Nov. 212 Dec. 212 Jan. 213 Feb. 213 Mar. 213 Apr. 213 PRIX VOO and volumes from Tunisia to EU/27 VOLUMES (t)

60
61 BALANCES TABLE OLIVES TABLE OLIVES 211/12 (final) 212/13 (prov.) (thousand tonnes) Starting stocks Production Imports Consumption Exports Ending stocks June 213 These balances will not be approved until the November 213 session. The figures presented here are likely to change.
62 TABLE OLIVES PRODUCTION (1, t) production - Table Olives 28/9 29/1 21/11 211/12 212/13 UE, of which: 676,7 675,4 828,5 74,4 729, Spain 485,7 492,6 68,6 521,5 482, Greece 15, 17, 135, 13, 16, Italy 68,5 58,6 69,7 76,2 74, Portugal 13, 12,3 1,3 9, 9,1 Other IOC countries, of which 1289,8 1534,1 144, 1512,6 1461, Egypt 44, 49, 35, 384,5 375, Turkey 3, 39, 33, 4, 41, Syria 12, 135, 147, 172, 172, Morocco 1, 9, 11, 1, 1, Argentina 95, 22, 9, 15, 6, Algeria 98, 136, 192,5 145,5 175, Iran 3,5 47,5 47, 35, 39, Jordan 27, 34, 54, 26, 28, Non-IOC producers, of which 116, 159,5 294,5 181, 232, Peru 9, 75, 72,5 81, 8, USA 47,5 24, 154, 26, 78, Chile 2, 25, 26, 34, 34, Palestine 9, 2,5 11, 9, 9, Mexico 9, 1, 8, 8, 8, Saudi Arabia 4,5 4,5 4,5 4,5 4,5 Australia 3, 3,5 3,5 3,5 3,5 TOTAL 282,5 2369, , 2422,
63 TABLE OLIVES CONSUMPTION (1, t) (1, t) Consumption 28/9 29/1 21/11 211/12 212/13 EU, of which: Spain Italy France Greece Other producers Non-producers Other IOC countries, of which Egypt Turkey Syria Algeria Iran Morocco Israel Lebanon Jordan Tunisia Non-IOC producers, of which USA Peru Saudi Arabia Chile Australia Mexico Palestine Non-producers, of which: Russsia Brazil Canada Switzerland Japan TOTAL
64 TABLE OLIVES EXPORTS (1, t) Exportation 28/9 29/1 21/11 211/12 212/13 EU, of which: 239, 299,8 29,5 317, 283, Spain 165,2 225,1 211,3 229,9 185,9 Greece 53, 49, 53, 55,3 67, Portugal 11,4 15,2 15,6 16,6 16,5 Other IOC countries, of which: 321, 35,2 337,5 363, 35,5 Egypt 88, 71,5 78, 93,5 95, Argentina 73, 11, 72, 89,5 65, Morocco 57, 68, 77, 68, 7, Syria 24, 24, 3, 35, 35, Turkey 65, 65,5 72, 6, 7, Non-IOC producers, of which: 24,5 43, 31, 42, 41,5 Peru 16, 2, 21,5 32, 32, USA 4,5 4, 4, 4, 3,5 Chile 3, 4, 4,5 6, 6, TOTAL 584,5 693, 659, 722, 675,
65 TABLE OLIVE IMPORTS (1, t) WORLD TREND 199/91 212/13 1, t / / / / / / / / /9 1999/ 2/1 21/2 22/3 23/4 24/5 25/6 26/7 27/8 28/9 29/1 21/11 211/12(prov 212/13(est.).) IMPORTS ,5 211, ,8 282,5 35, , , , , ,5 USA+CANADA ,5 85, ,5 111,5 131, , ,5 165,5 159,5 162,5
66 TABLE OLIVE IMPORTS (1, t) WORLD TREND 199/91 212/ / / / / / / / / /9 1999/ 2/1 21/2 22/3 23/4 24/5 25/6 26/7 27/8 28/9 29/1 21/11 EU/27 41, , , , , ,5 14, , ,5 USA+CANADA ,5 85, ,5 111,5 131, , ,5 165,5 159,5 162,5 BRAZIL 4, ,5 33,5 46,5 45, , , ,5 12 RUSSIA 3 2 2,5 2, ,5 3 3,5 3,5 3, , , OTHERS ,5 56, ,5 11,5 121, , ,5 138, ,5 211/12(pro v.) 212/13(est.)
67 TABLE OLIVE IMPORTS tonnes 1, t /91 212/13 Country 211/12 TOTAL OLIVES USA Spain ,8 France 79,9 Greece ,3 Italy 3.89,4 Portugal 2.373,9 United Kingdom 28, Netherlands 1,6 Others 2,3 S/Total EU 1.23,2 tonnes / / / / / 9 2/ 1 22/ 3 24/ 5 26/ 7 28/ 9 21/ / 13 21/11 211/12 212/13 Monthly imports 21/11, 211/12 and 212/13 crop year October November December January February March April May June July August September Source: United States Department of Agriculture Foreign Agricultural Service +1% Egypt 2.84,7 Israel 76,8 Jordan 47,8 Lebanon 289,2 Morocco ,7 Syria 37,5 Tunisia 7,9 Argentina 7.172,3 Brazil 2,1 Canada 257,4 Chile 216,4 Guatemala 33,9 Mexico 52,2 Peru 1.112,1 Bangladesh 1,4 China 7,6 Inde,4 Turkey 3.815,5 Thailand 6,8 TOTAL ,9
68 1, t TABLE OLIVE IMPORTS tonnes 14 EXTRA-EU COUNTRY 211/12 CROP YEAR TOTAL tonnes Source: Eurostat 2/1 22/3 24/5 26/7 28/9 21/11 212/ % Monthly imports 21/11, 211/12 and 212/13 crop year 21/11 211/12 212/13 October November December January February M arch April M ay June July August September MOROCCO , TURKEY , EGYPT 3.293,5 ALBANIA 1.54,3 REPUBLIC OF MACEDONIA 719,5 ARGENTINA 73,2 CHILE 638,8 SYRIA 597,5 CHINA 244,8 TUNISIA 241,9 UNITED STATES 24,4 LEBANON 238,5 ISRAEL 228, PERU 142,3 SWITZERLAND 72,6 SERBIA 3,5 AUSTRALIA 22,8 JAPAN 22,2 JORDAN 19,5 CANADA 19,4 CROATIA 18,5 QATAR 16,4 SOUTH KOREA 12,6 Others 36,1 TOTAL ,3
69 TABLE OLIVE IMPORTS INTRA-EU Monthly imports INTRA-EU 21/11, 211/12 and 212/13 crop years -4% 4 21/11 211/12 212/ October November December January February M arch April M ay June July August September Source: Eurostat
")
")
70 TABLE OLIVES EXPORTS (t) Declarant: EU/27 TABLE OLIVES IMPORTS (t) INTRA-EU
71 1, t 12 1 BRAZIL TABLE OLIVE IMPORTS 199/91 212/13 COUNTRY tonnes 211/12 T O T A L OLIVES / / / / / 9 2/ 1 22/ 3 24/ 5 26/ 7 28/ 9 21/ / 13(est.) Spain 9.825,9 France 1,5 Greece 46, Italy 1.267,3 Portugal 1.372,7 United Kingdom 3,4 Austria,6 tonnes Monthly imports 21/11, 211/12 and 212/13 crop year s/total EU , /11 211/12 212/13 +5% Argentina 75.37, Chile 44,5 United States 389,9 Peru 13.24, Israel,2 Japan 2,5 Lebanon 2,4 Taiwan (Formos, October November December January February March April May June July August September n.d.,1 Source: Ministerio do Desenvolvimento, Industria e Comercio Exterior, Brasil TOTAL ,6
72 1, t 1 RUSSIA TABLE OLIVE IMPORTS 2/1 212/13 tonnes 211/12 COUNTRY T O T A L 5 tonnes / 1 21/ 2 22/ 3 23/ 4 24/ 5 25/ 6 26/ 7 27/ 8 28/ 9 29/ 1 21/ / / 13 21/11 211/12 212/13 October November December January February M arch April M ay June July August September Source: Global Trade International Monthly imports 21/11, 211/12 and 212/13 crop year +16% (est.) Germany 16,6 Austria 5,2 Spain ,2 France 11,5 Greece 3.292,6 Italy 555,1 Portugal 17,4 Poland 3,7 United Kingdom 1,1 s/total UE ,2 Egypt 1,7 Israel 1,3 Lebanon 2,5 Morocco 28,6 Serbia 7,8 Syria 14,8 Tunisia 83,1 Turkey 999,8 United States,4 Peru 2,2 Armenia 474,5 Azerbajian 3,7 TOTAL ,8
73 tonnes , t CANADA 199/91 212/13 199/ / / / / 9 2/ 1 22/ 3 24/ 5 26/ 7 28/ 9 21/ / 13(est.) 21/11 211/12 212/13 October November December January February M arch April M ay June July August September Source: Statistics Canada International Trade Division TABLE OLIVE IMPORTS Monthly imports 21/11, 211/12 and 212/13 crop year +13% tonnes 211/12 COUNTRY T O T A L Bulgaria,4 Spain ,6 France 66,1 Greece 6.973, Italy 872,8 Netherlands, Portugal 194,9 United Kingdom 1,9 s/total EU ,7 Switzerland 2,7 Algeria,3 Egypt 672,9 Iran 5,6 Israel 61,3 Jordan,7 Lebanon 341,8 Morocco 1.471,6 Syria 55,6 Tunisia 11,7 Argentina 442, Brazil,3 Canada 1,2 Chile 28,4 Ecuador, United States 1.97,6 Mexico 24,7 Peru 159,8 Bangladesh 1,5 China 32,1 Hong-Kong,6 Macau,4 Taiwan 11,3 Thailande,2 Turkey 562,2 Australia,2 Other countries 7,7 TOTAL ,1
 21/11 211/12 212/13 Monthly imports 21/11, 211/12 and 212/13 crop year +6% 15 1 5 October November December January February M arch April M ay June July August September Source: Australian")
74 25 1, t TABLE OLIVE IMPORTS 199/91 212/13 tonnes 2 AUSTRALIA tonnes / / / / / 9 2/ 1 22/ 3 24/ 5 26/ 7 28/ 9 21/ / 13(est.) 21/11 211/12 212/13 Monthly imports 21/11, 211/12 and 212/13 crop year +6% October November December January February M arch April M ay June July August September Source: Australian Bureau of Statistics

75
76 ECONOMIC AFFAIRS: Production costs survey Harmonisation of customs nomenclature TECHNICAL ASSISTANCE: Call for grant applications: deadline 9 July Panel leader course and marketing seminar CO 2 footprint PROMOTION Call for grant applications: deadline 9 July Brazil campaign Mario Solinas Award CHEMISTRY & STANDARDISATION
77 CHEMISTRY & STANDARDISATION Research workshop 1-11 June Changes to chemical criteria Waxes Ethyl esters Stigmastadienes Myristic acid Decision trees Methods Global for detection of extraneous oils Sterols and triterpene dialcohols Alkyl esters and waxes (silica) Organoleptic assessment


78 For more information visit:
European Values Study & World Values Study - Participating Countries ( )
") GESIS Data Archive for the Social Sciences http://www.gesis.org/en/home/ ASEP/JD Data Archive http://www.jdsurvey.net/jds/jdsurvey.jsp European Values Study & World Values Study - Participating Countries
GESIS Data Archive for the Social Sciences http://www.gesis.org/en/home/ ASEP/JD Data Archive http://www.jdsurvey.net/jds/jdsurvey.jsp European Values Study & World Values Study - Participating Countries
THE WORLD COMPETITIVENESS SCOREBOARD 2011
 THE WORLD COMPETITIVENESS SCOREBOARD 2011 98.557 94.063 92.588 92.011 90.782 90.219 89.259 87.824 86.475 86.418 86.313 85.707 84.380 84.120 81.629 81.619 81.100 80.278 79.799 78.499 77.599 77.101 76.827
I. World trade in Overview
 I. Table I.1 Growth in the volume of world merchandise exports and production by major product group, 1995-3 ( change) 1995-21 22 23 World merchandise exports 7. -.5 3. 4.5 Agricultural products 3.5 2.5
USTA Player Development 2017 Excellence Grant Criteria Jr Girls, Collegiate & Professional Players
 USTA Player Development 2017 Excellence Grant Criteria Jr Girls, Collegiate & Professional Players In order to encourage the development of U.S. players we have designed USTA Player Development Excellence
Desalination From theory to practice People, Papers, Publications. Miriam Balaban EDS Secretary General
 Desalination From theory to practice People, Papers, Publications Gulf WSTA Europe EDS Miriam Balaban EDS Secretary General Europe and the Gulf Region The collaboration between our regions has had significant
IBSA Goalball World Rankings 31 December 2017 Men's Division
 IBSA Goalball World Rankings 31 December 2017 Men's Division Rank No v Oc t Se p Au g Ju l Team Region Score Goal Diff Results Gol p Gme Last Plyd Weight 1st 5 6 6 1 2 Brazil Americas 661.802 4.564 0.872
Max Sort Sortation Option - Letters
 Max Sort Sortation Option - Letters Western Europe Prices Product Code PS5 PS6 Austria* 0.330 7.550 0.330 7.400 Belgium* 0.370 3.700 0.370 3.540 Denmark* 0.620 5.350 0.620 4.215 Finland* 0.385 4.400 0.385
DG AGRI DASHBOARD: CITRUS FRUIT Last update:
 8.000 7.000 6.000 5.000 4.000 3.000 2.000 1.000 0 1996 1997 1998 1999 2000 2001 2002 2003 2004 2005 2006 2007 2008 2009 2010 2011 2012 2013 2014 2015 2016 2017 Small citrus (group mandarines): clementines,
KINGDOM OF CAMBODIA NATION RELIGION KING 3
 KINGDOM OF CAMBODIA NATION RELIGION KING 3 TOURISM STATISTICS REPORT February 2018 MINISTRY OF TOURISM Statistics and Tourism Information Department No. A3, Street 169, Sangkat Veal Vong, Khan 7 Makara,
Introductions, Middle East, Israel, Jordan, Yemen, Oman Week 1: Aug Sept. 1
 Introductions, Middle East, Israel, Jordan, Yemen, Oman Week 1: Aug. 28 - Sept. 1 ASSIGNMENT Monday Tuesday Wednesday Thursday Friday Due Wednesday pgs. 6-11 Do not start the workbook or study sheet assignments
Production, trade and supply of natural gas Terajoules
 Terajoules Table Notes Production includes quantities from other sources, which would include any quantities of biogas, LPG or manufactured gas blended with natural gas. Please refer to the Definitions
IR-Pay Go Rates. There are three pricing groups for Pay Go rates for International Roaming as follows:
 IR-Pay Go Rates A. IR Pay Go Rate Summary There are three pricing groups for Pay Go rates for International Roaming as follows: Sr IR Pay Go Rate Group 1 Rs 2 2 2 2 Rs 10 10 10 3 Rs 50 600 25 Applicable
January Deadline Analysis: Domicile
 January Deadline Analysis: Domicile Applicants by domicile at the 15 January deadline D.1.1 Applicants by domicile group UK EU (excluding UK) Not EU All domiciles 20% 10% -0% -10% -20% -30% -40% -50% 2009
June Deadline Analysis: Domicile
 June Deadline Analysis: Domicile Applicants by domicile at the 30 June deadline I.1.1 Applicants by domicile group Difference between cycle and 2017 cycle UK EU (excluding UK) Not EU All domiciles 10%
Portuguese, English, and. Bulgarian, English, French, or
 Country Language Fiber Content Algeria Arabic Angola Portuguese, English, and French (optional) Optional Argentina Spanish Armenia Armenian Optional Australia English Austria German Bahrain Arabic or English
Student Nationality Mix for BAT Bath
 Student Nationality Mix for BAT Bath Country Total Saudi Arabia 16. Oman 11.8% Spain 10. China 10. Libya 7. Thailand 6. Korea (South) 6. France 3.9% Venezuela 3. Italy 2.9% Brazil 2. Turkey 2. Switzerland
AREA TOTALS OECD Composite Leading Indicators. OECD Total. OECD + Major 6 Non Member Countries. Major Five Asia. Major Seven.
 Reference series Composite leading indicators OECD Composite Leading Indicators AREA TOTALS 7-03- 19 OECD Total 19 OECD + Major 6 Non Member Countries 19 Major Seven 19 Major Five Asia 19 Euro area 19
Table 34 Production of heat by type Terajoules
 Table 34 Production of heat by type Table Notes geo represents heat used directly for district heating, agriculture etc. without a commercial transaction taking place. represents heat used for the production
Full-Time Visa Enrolment by Countries
 Page 1 of 32 All Students Afghanistan Albania Algeria Andorra Antigua Argentina Armenia Australia Austria Azerbaidjan Bahamas Bahrain Bangladesh Barbados Belarus Belgium Belize Benin (Dahomey) Bermuda
Commemorative Books Coverage List
 Commemorative Books Coverage List England International Football 2018 Date of Paper Pages Event Covered (Daily Mirror ) 3 Apr 1905 Pages 8 and 14 England 1 Scotland 0 (Home Championship) 5 Apr 1909 Page
October 23, 2015 FINAL STATISTICAL REPORT 2014/15
 C A L I F O R N I A D R I E D P L U M B O A R D 3840 Rosin Court Phone (916) 565-6232 Suite 170 Fax (916) 565-6237 Sacramento, CA 95834 www.californiadriedplums.org October 23, 2015 FINAL STATISTICAL REPORT
Table I. NET CALORIFIC VALUES OF ENERGY PRODUCTS GJ/ton
 Table I PRODUCTION, EXPORTS AND CHANGES IN STOCKS HARD COAL 2011 2012 2013 2014 Standard factor 25.8 25.8 25.8 25.8 Argentina 24.7 24.7 24.7 24.7 Australia 27.1 27.0 26.9 26.9 Bangladesh 20.9 20.9 20.9
DG AGRI DASHBOARD: CITRUS FRUIT Last update:
 14 000 12 000 10 000 8 000 6 000 4 000 2 000 0 1996 1997 1998 1999 2000 2001 2002 2003 2004 2005 2006 2007 2008 2009 2010 2011 2012 2013 2014 2015 2016 Small citrus (group mandarines): clementines, satsumas
Table I. NET CALORIFIC VALUES OF ENERGY PRODUCTS GJ/ton
 Table I PRODUCTION, EXPORTS AND CHANGES IN STOCKS HARD COAL 2009 2010 2011 2012 Standard factor 25.8 25.8 25.8 25.8 Argentina 24.7 24.7 24.7 24.7 Australia 28.7 27.2 27.1 27.0 Bangladesh 20.9 20.9 20.9
Ministry of Economy and Sustainable Development of Georgia
 Ministry of Economy and Sustainable Development of Georgia Economic Growth 42,000.0 36,000.0 30,000.0 24,000.0 18,000.0 12,000.0 6,000.0 0.0 GDP AND ECONOMIC GROWTH 7.2% 6.2% 6.4% 4.6% 4.8% 3.4% 2.9% 2.8%
STATISTICS
 DGAGRI-G2 23 Novembre 2017 W O R K I N G D O C U M E N T Horticultural Products FLOWERS AND ORNAMENTAL PLANTS STATISTICS 2006-2016 This statistical document has been prepared by Unit G.2 of DG AGRI, in
CMMI Maturity Profile Report. 30 June 2017
 CMMI Maturity Profile Report 30 June 2017 Executive Summary Appraisals increased 14% 1 Jan 30 Jun 17 Companies who reappraise continue to increase, currently at 74% 10% of reported appraisals are high
TEGMA Fall Transportation Symposium
 TEGMA 2017 Fall Transportation Symposium John Wilson Senior Vice President Dairy industry trends 1997 1998 1999 2000 2001 2002 2003 2004 2005 2006 2007 2008 2009 2010 2011 2012 2013 2014 2015 2016 Million
INTERNATIONAL STUDENT STATISTICAL SUMMARY Spring 2017 (Final)
") INTERNATIONAL STUDENT STATISTICAL SUMMARY Spring 2017 (Final) Prepared By: Mr. Jay Ward, Associate Director Office of International Programs San Francisco State University Non-Matriculated SP 17 SP 16
INTERNATIONAL STUDENT STATISTICAL SUMMARY Spring 2017 (Final) Prepared By: Mr. Jay Ward, Associate Director Office of International Programs San Francisco State University Non-Matriculated SP 17 SP 16
Selection statistics
 Selection statistics ERASMUS+ Sport Call for proposals EAC-A05-2017 Selection year 2018 Collaborative Partnerships Small Collaborative Partnerships Not-for-profit European Sport Events Applications received
Total points. Nation Men kayak Women kayak Men canoe Women canoe Total 600 BELARUS KAZAKHSTAN 54. Page 1 of 4. powered by memórias
 Total points Nation Men kayak Women kayak Men canoe Women canoe Total HUN HUNGARY 80 4 37 6 803 RUS RUSSIA 5 7 03 8 77 3 GER GERMANY 5 9 8 09 644 4 ESP SPAIN 06 76 0 98 600 5 BLR BELARUS 5 30 6 70 587
OECD employment rate increases to 68.4% in the third quarter of 2018
 Paris, 17th January 2019 News Release: 3rd Quarter 2018 OECD employment rate increases to 68.4% in the third quarter of 2018 The OECD area employment rate the share of the working-age population with jobs
Stockholm s tourism industry. November 2016
 Stockholm s tourism dustry. November 2016 Durg the month of November ca 1.1 million guest were recorded at commercial accommodations the county of Stockholm. This was an crease of 5 compared to November
Stockholm s tourism industry. December 2016
 Stockholm s tourism dustry. December 2016 Durg the month of December ca 0.9 million guest were recorded at commercial accommodations the county of Stockholm. This was an crease of 12 compared to December
CONTRIBUTING OIL RECEIVED IN THE CALENDAR YEAR 2016
 CONTRIBUTING OIL RECEIVED IN THE CALENDAR YEAR 2016 (as reported by ) INTRODUCTION The 1992 Fund Convention and the Supplementary Fund Protocol require that all s report each year to the Director of the
AWARDED PROJECTS 2015, 2016, 2017, Countries awarded through the Sport Grant Programme
 AWARDED PROJECTS,,, Countries awarded through the Sport Grant Programme AWARDED PROJECTS BARBADOS Improving rally safety BELGIUM Purchase of officials safety equipment COLOMBIA Officials and drivers safety
Update of trade weights data underlying the EERs and HCIs
 August 2017 Update of trade weights data underlying the EERs and HCIs The trade weights underlying the calculation of the effective exchange rates (EERs) of the euro and the harmonised competitiveness
Composition of the UNICEF Executive Board
 The dates reflect years of membership in the Executive Board and not necessarily terms of office. 1 Afghanistan 1960 1963; 1965 1967; 1977 1980 Albania 2012 2014 Algeria 1971 1974; 1982 1985; 2004 2006
Common Market Organisation (CMO) Fruit and vegetables sector Evolution of EU prices of certain F&V
 Fruit and vegetables sector Evolution of EU prices of certain F&V") Common Market Organisation (CMO) Fruit and vegetables sector Evolution of EU prices of certain F&V Unit C.2. - Wine, spirits, horticultural products, specialised crops DG Agriculture and Rural Development
Common Market Organisation (CMO) Fruit and vegetables sector Evolution of EU prices of certain F&V Unit C.2. - Wine, spirits, horticultural products, specialised crops DG Agriculture and Rural Development
Firearms & parts firearms & parts firearms & parts rocket launcher components
 Table 3 Exports of Military Goods by Component Categories Export Period 01 January to 31 December 1997 Destination ECL Andorra 2001 5 434 2 058 Firearms & parts Argentina 2001 54 498 468 firearms & parts
Selection statistics
 Selection statistics ERASMUS+ Sport Call for proposals EAC-A03-2016 Selection year 2017 Collaborative Partnerships Small Collaborative Partnerships Not-for-profit European Sport Events Erasmus+ Applications
Global Construction Outlook: Laura Hanlon Product Manager, Global Construction Outlook May 21, 2009
 Global Construction Outlook: Short-term term Pain, Long-term Gain Laura Hanlon Product Manager, Global Construction Outlook May 21, 2009 What This Means for You The world is set to be hit this year with
Big data analytics for enrichment of rural area content tourism in Okhotsk sub-prefecture of Japan
 Big data analytics for enrichment of rural area content tourism in Okhotsk sub-prefecture of Japan Ali Bakdur, Fumito Masui, Michal Ptaszynski Kitami Institute of Technology, Dept. of Computer Science,
2016 River Use Statistics -by Steve Sullivan
 Grand Canyon River Office 2016 River Use Statistics -by Steve Sullivan Topics River Use Statistics Overview Commercial River Use Statistics Noncommercial River Use Statistics Noncommercial River Lottery
FIL Qualifying Event Proposal. Problem Statement. Proposal for voting at GA
 Problem Statement FIL World Events The FIL currently holds five World Events which take place in a 4-year cycle: Men s Lacrosse o Under-19 World Championship o World Championship o World Indoor Championship
2016/17 UEFA European Under-17 and Under-19 Championships Qualifying round draws. 3 December 2015, Nyon, Switzerland
 2016/17 UEFA European Under-17 and Under-19 Championships Qualifying round draws 3 December 2015, Nyon, Switzerland DRAW PROCEDURE Qualifying rounds 16th UEFA European Under-17 and Under-19 Championships,
2018 Hearthstone Wild Open. Official Competition Rules
 2018 Hearthstone Wild Official Competition Rules 1 TABLE OF CONTENTS INTRODUCTION 3 APPLICABILITY OF RULES 3 PLAYER ELIGIBILITY 4 TOURNAMENT STRUCTURE 4 PRIZING 9 PLAYER CONDUCT 9 MISCELLANEOUS 9 2 1.
The 11th Korea Prime Minister Cup International Amateur Baduk Championship
 The 11th Korea Prime Minister Cup International Amateur Baduk Championship Buan County, South Korea We are pleased to announce that the 11 th Korea Prime Minister Cup (KPMC) will be held on the 3rd-9th
STATISTICAL INFORMATION BOOKLET 2017 As compiled by the Secretariat to the International Stud Book Committee
 isbc stat booklet _42833_Layout 1 21/09/2017 12:09 Page 1 THE INTERNATIONAL STUD BOOK COMMITTEE STATISTICAL INFORMATION BOOKLET 2017 As compiled by the Secretariat to the International Stud Book Committee
Small Arms Survey 2015 Annexe 4.4 Authorized transfers of small arms and light weapons to Egypt, Libya, and Syria,
 Small Arms Survey 2015 Annexe 4.4 Authorized transfers of small arms and light weapons to Egypt, Libya, and Syria, 2001 13 Contents 2 Table 4.6a Reported deliveries of small arms to Egypt, 2001 13 6 Table
The globalisation of sporting events: Myth or reality?
 Khalifa Stadium, Qatar. Photo: Igor Magic The globalisation of sporting events: Myth or reality? Søren Bang, Play the Game 203, 30 October 203 The globalisation of sporting events: Myth or reality? Photo:
GLOBAL BAROMETER OF HOPE AND DESPAIR FOR 2011
 GLOBAL BAROMETER OF HOPE AND DESPAIR FOR 2011 Volume 1: Statistical Report Findings based on responses from more than 64,000 scientifically selected cross-section of Men and Women from all socioeconomic
NEW COMMERCIAL VEHICLE REGISTRATIONS EUROPEAN UNION 1. July and August 2017
 PRESS EMBARGO: NEW COMMERCIAL VEHICLE REGISTRATIONS EUROPEAN UNION 1 July and August 2017 Next press release: Tuesday 24 October 2017 1 Data for Malta unavailable Page 1 of 12 Commercial vehicle registrations:
European Research Council
 European Research Council ERC Starting Grants 217 Outcome: Indicative statistics Reproduction is authorised provided the source 'ERC' is acknowledged. NB: In these graphs, 'grantee' refers to a candidate
Global Cable: Market trends & business models
 Global Cable: Market trends & business models Guy Bisson, Ampere Analysis January 2018 1 Cable TV penetration 2005: Cable TV drove market with multiple high penetration/low ARPU markets 90 80 70 Netherlands
Post Show Report April 2015, Moscow, Russia. #ipheb
 Post Show Report 2015 27-29 April 2015, Moscow, Russia Join the pharma community @cphiww #cphirussia #ipheb Contents 1. Show Profile 3 2. Visitor: 2015 Facts & Figures 4 2.1 Top visitor countries 4 2.2
Welcome to KNX Scientific Conference 2012 Las Palmas Gran Canaria Watch how international KNX has become!
 Welcome to KNX Scientific Conference 2012 Las Palmas Gran Canaria Watch how international KNX has become! KNX Association International 22 National Groups in Europe KNX Association International KNX: The
FINAL REPORT for Sports Tourism Report For the Year 2013
 FINAL REPORT for Sports Tourism Report For the Year 2013 Prepared for The Cyprus Tourism Orgaization September 201 CONTENTS Page 1. Main Findings 2 2. Appointment and Methodology 3. General Indicators:
Value Exported (CDN$) Support Systems ,165 firearms ,389 firearms ,465 firearms ,500 rocket launchers
 Support Systems ,165 firearms ,389 firearms ,465 firearms ,500 rocket launchers") Table 3 Exports of Military Goods by Component Categories Export Period 01 January to 31 December 1998 Value Exported (CDN$) Andorra Argentina Australia Austria Bahrain 2001 2,165 firearms 2001 137,389
Table 3 Exports of Military Goods by Component Categories Export Period 01 January to 31 December 1998 Value Exported (CDN$) Andorra Argentina Australia Austria Bahrain 2001 2,165 firearms 2001 137,389
2018 Daily Prayer for Peace Country Cycle
 2018 Daily Prayer for Peace Country Cycle Monday January 1, 2018 All Nations Tuesday January 2, 2018 Ghana Wednesday January 3, 2018 Nigeria Thursday January 4, 2018 Costa Rica Friday January 5, 2018 Turkmenistan
CURRENT DEMOGRAPHIC SITUATION IN LATVIA
 CURRENT DEMOGRAPHIC SITUATION IN LATVIA Peteris Zvidrins University of Latvia Workshop Very old people s housing and housing and health situation in Latvia 21 May, 2013 Population and its change in 10
DEVELOPMENT AID AT A GLANCE
 DEVELOPMENT AID AT A GLANCE STATISTICS BY REGION 5. EUROPE 2018 edition All the data in this report are available at: http://www.oecd.org/dac/financing-sustainable-development/ 5.1. ODA TO EUROPE - SUMMARY
23 November 2018, Nyon, Switzerland. 2019/20 UEFA European Women s Under-17 and Women s Under-19 Championships. Qualifying round draws
 23 November 208, Nyon, Switzerland 209/20 UEFA European Women s Under-7 and Women s Under-9 Championships Qualifying round draws DRAW PROCEDURE Qualifying rounds 3th UEFA European Women s Under-7 and 9th
2016/17 UEFA European Women s Under 17 and Women s Under 19 Championships Qualifying draws
 2016/17 UEFA European Women s Under 17 and Women s Under 19 Championships Qualifying draws 13 November 2015, Nyon, Switzerland DRAW PROCEDURE Qualifying rounds UEFA European Women s Under-17 and Women
Relative age effect: a serious problem in football
 CIES Football Observatory Monthly Report Issue no. 10 - December 2015 Relative age effect: a serious problem in football Drs Raffaele Poli, Loïc Ravenel and Roger Besson 1. Introduction Numerous studies
Office of Institutional Research
 ri a l C ty Consistency Sim p li c it y Office of Institutional Research Place of Residence for International Students by Gender: Published October 2012 OIR Staff: Peggy Johnson - Associate Director Miriam
HydroCOM: High energy savings and excellent controllability
 HydroCOM: High energy savings and excellent controllability Almost all applications require efficient capacity control systems Most of them simply waste energy, are slow and inaccurate. HydroCOM, however,
Freshwater fish. Carp, Perch, Pike, Burbot, Barb, Milkfish. Extract from GLOBEFISH Databank Prices - Exports - Imports - Production
 Commodity Update Freshwater fish Carp, Perch, Pike, Burbot, Barb, Milkfish Extract from GLOBEFISH Databank Prices - Exports - Imports - Production November 2012 Freshwater fish - Carp, Perch, Pike, Burbot,
GRUPO CORTEFIEL is one of Europe s top fashion
 GRUPO CORTEFIEL is one of Europe s top fashion names operating in the specialised chain sector. Founded in Madrid in 1880, today it is present in 89* countries and has 1,982* points of sale. Cortefiel,
NUMBER OF UTILITY PATENT APPLICATIONS FILED IN THE UNITED STATES, BY COUNTRY OF ORIGIN CALENDAR YEAR 1965 TO PRESENT
 NUMBER OF UTILITY PATENT APPLICATIONS FILED IN THE UNITED STATES, BY COUNTRY OF ORIGIN CALENDAR YEAR 1965 TO PRESENT July 1999 OFFICE FOR PATENT AND TRADEMARK INFORMATION U.S. PATENT AND TRADEMARK OFFICE
1.2. Barite Market Overview
 1.2. Barite Market Overview In 2010 primary barite production estimated 000 thousand metric tons, a 12,5% increase from that of. Table 1. World mine production of barite, 2004-2010 (thousand metric tons)
Political stability and absence of violence/terrorism index* 2010
 Data Tables II 321 This appendix provides tables for each of the 84 indicators that make up the Global Innovation Index 2012 (GII). Structure Each table is identified by indicator number, with the first
UEFA Nations League 2018/19 League Phase Draw Procedure
 Date and time: Wednesday, 24 January 2018 Place: Duration: Regulations: Participants: Objective: Seeding: Lausanne, Switzerland approx. 40 minutes for technical part Art. 12-13 of the competition regulations
Predicting the Markets: Chapter 12 Charts: Predicting Currencies
 Predicting the Markets: Chapter 12 Charts: October 5, 218 Dr. Edward Yardeni Chief Investment Strategist Mali Quintana Senior Economist info@yardenibook.com Please visit our sites at www. blog. thinking
NITROGEN CHARGING KIT type PC 11.1 E 04-11
 NITROGEN CHARGING KIT type PC 11.1 E 04-11 11.1.1 TECHNICAL DATA MAX OPERATING PRESSURE (PS): 600 BAR PRESSURE TEST (PT): 1.43 PS SCALE OF PRESSURE GAUGE: 4-10 - 16-25 - 60-100 - 250 (std.) - 400-600 bar
NITROGEN CHARGING KIT type PC 11.1 E 01-12
 NITROGEN CHARGING KIT type PC 11.1 E 01-12 11.1.1 TECHNICAL DATA MAX OPERATING PRESSURE (PS): 600 BAR PRESSURE TEST (PT): 1.43 PS SCALE OF PRESSURE GAUGE: 4-10 - 16-25 - 60-100 - 250 (std.) - 400-600 bar
German Machine Tool Industry - Key Figures
 German Machine Tool Industry - Key Figures Mill. EUR %-Change 1-2Q 1-2Q 1-2Q 2014 2015 2016 2017 2017 2018 2016 2017 2018 Production total 14.486 15.087 15.007 16.006 7.062 7.820-1 +7 +11 Metal working
ESSA 2018 ANNUAL INTEGRITY REPORT
 ESSA 208 ANNUAL INTEGRITY REPORT EDITORIAL In 208, ESSA s monitoring and alert platform reported 267 alerts to the relevant sporting and/or regulatory authorities for investigation. As has been the trend
Lithuanian export: is it time to prepare for changes? Aleksandr Izgorodin Expert
 Lithuanian export: is it time to prepare for changes? Aleksandr Izgorodin Expert Export is the main locomotive behind growth in LT economy Lithuania: change in real GDP and its components, % 78,2 71,8
Monthly Digest February 2016 No. 2016/04. Copyrights Statistics Botswana 2016
 STATISTICS BOTSWANA BOTSWANA INTERNATIONAL MERCHANDISE TRADE STATISTICS Monthly Digest February 2016 No. 2016/04 Copyrights Statistics Botswana 2016 Contact Statistician: Malebogo Rakgantswana Email: mrakgantswana@gov.bw
Table 2. ARD Mortality Rate by Country and Disease (from GBD Study 2016)*
*") Lung cancer Asbestosis United Kingdom 4.34 21.50 0.32 1.43 27.59 0.04 27.63 Netherlands 3.73 22.43 0.07 0.97 27.21 0.04 27.25 Italy 2.81 21.17 0.17 1.30 25.44 0.05 25.49 Belgium 2.45 21.04 0.22 0.87 24.58
Lung cancer Asbestosis United Kingdom 4.34 21.50 0.32 1.43 27.59 0.04 27.63 Netherlands 3.73 22.43 0.07 0.97 27.21 0.04 27.25 Italy 2.81 21.17 0.17 1.30 25.44 0.05 25.49 Belgium 2.45 21.04 0.22 0.87 24.58
Confidence through experience. Track record as of 30 June 2012
 Confidence through experience Track record as of 30 June 2012 Harvesting the full potential of wind Confidence is built through experience. During more than 30 years in the wind industry we have installed
Predicting the Markets: Chapter 15 Charts: Predicting Currencies
 Predicting the Markets: Chapter 15 Charts: March 3, 217 Dr. Edward Yardeni 516-972-7683 eyardeni@ Mali Quintana 48-664-1333 aquintana@ Please visit our sites at www. blog. thinking outside the box Table
INVITATION WORLD 9 BALL CHAMPIONSHIP 2017 (W9BC)
") INVITATION WORLD 9 BALL CHAMPIONSHIP 2017 (W9BC) 5 th 14 th December 2017 We are pleased to inform you that the Qatar Billiards & Snooker Federation in Cooperation with the Qatar Olympic Committee, is
INVITATION WORLD 9 BALL CHAMPIONSHIP 2017 (W9BC) 5 th 14 th December 2017 We are pleased to inform you that the Qatar Billiards & Snooker Federation in Cooperation with the Qatar Olympic Committee, is
EUROPEAN RIDERS, HORSES AND SHOWS AT THE FEI 2012
 EUROPEAN RIDERS, HORSES AND SHOWS AT THE FEI 2012 Presentation to the EEF Sports Forum Essen, 21 st March 2013 1 Introduction In 2010 the Small Nations Working Group started this study, to know exactly
Fact sheet on elections and membership
 Commission on Narcotic Drugs Commission on Crime Prevention and Criminal Justice Fact sheet on elections and membership States members of the CCPCJ and CND (and other functional commissions of the Economic
Invitation to. The 36th World Amateur Go Championship in Bangkok. Outline
 Invitation to The 36th World Amateur Go Championship in Bangkok Outline 1. Tournament name : The 36th World Amateur Go Championship in Bangkok 2. Main Sponsor : CP ALL PUBLIC COMPANY LIMITED 3. Co-organizers
New rules, new opportunities: a potential for growth
 #TV year New rules, new opportunities: a potential for growth June 19th, 2015 Jacques Balducci Eurodata TV Worldwide Deputy Sales Director Worldwide TV viewing remains strong World daily viewing time Average
Chart Collection for Morning Briefing
 Chart Collection for Morning Briefing September 11, 2017 Dr. Edward Yardeni 516-972-7683 eyardeni@ Mali Quintana 4-664-1333 aquintana@ Please visit our sites at blog. thinking outside the box 4.6 4.4 4.2
Business opportunities in Turkish Maritime Industry Marco Rensma Director MEYS Emerging Markets Research Istanbul, 24 May 2012
 Business opportunities in Turkish Maritime Industry Marco Rensma Director MEYS Emerging Markets Research Istanbul, 24 May 2012 Content presentation 1. Introduction MEYS Emerging Markets Research 2. Global
2014/15 UEFA European Under-17 and Under-19 Championships Elite round draws. 3 December 2014, Nyon, Switzerland
 0/5 UEFA European Under-7 and Under-9 Championships Elite round draws December 0, Nyon, Switzerland DRAW PROCEDURE Elite rounds th UEFA European Under-7 and Under-9 Championships, 0/5 TEAMS QUALIFYING
Selection statistics
 Selection statistics ERASMUS+ Sport Call for proposals EAC/S11/13 Selection year 2014 Collaborative Partnerships: Selection round 1 Not-for-profit European Sport Events: Selection rounds 1 and 2 Applications
Selection statistics
 Selection statistics ERASMUS+ Sport Call for proposals EAC-A04-2015 Selection year 2016 Collaborative Partnerships: Selection round 2 Small Collaborative Partnerships: Selection round 1 Not-for-profit
Guy Bisson, Ampere Analysis
 Global Cable Trends: Poland s place in the world of cable Guy Bisson, Ampere Analysis October 2017 1 Multi-play RGUs (m) Globally, cable leads in multi-play subscriptions with over 800m multi-play RGUs
ISO is the world s largest developer of voluntary international standards
 The ISO Survey ISO and The ISO Survey ISO is the world s largest developer of voluntary international standards for business, government and society. Its portfolio in October 2007 comprised more than 16
Market Value of Israel s Listed Companies in World Exchanges
 Market Value of Israel s Listed Companies in World Exchanges Exchange Tel-Aviv Stock Exchange US and London Exchanges Number of Company 650 83 Market Value (US$ Billions) 77 42 Index 2003=100 250 200 150
STATISTICS BOTSWANA INTERNATIONAL MERCHANDISE TRADE STATISTICS. Monthly Digest February 2018
 STATISTICS BOTSWANA INTERNATIONAL MERCHANDISE TRADE STATISTICS Monthly Digest February 2018 Contact Statistician: Malebogo Rakgantswana Email: mrakgantswana@statsbots.org.bw Tel: (+267) 367 1300 Statistics
STORM FORECASTS: The only independent source of animal health and animal agriculture historical market data and forecasts
 The only independent source of animal health and animal agriculture historical market data and forecasts June 2016 1 What is STORM FORECASTS? STORM FORECASTS is the only independent source of animal health
Selection statistics
 Selection statistics ERASMUS+ Sport Call for proposals EAC-A04-2014 Selection year 2015 Collaborative Partnerships: Selection round 2 Not-for-profit European Sport Events: Selection round 2 Applications
2019 Hearthstone Wild Open Official Competition Rules
 2019 Hearthstone Wild Open Official Competition Rules Version 1.2 1 Introduction 3 2019 Hearthstone Wild Open 3 Player Eligibility Requirements 3 Tournament Structure 4 Prizes 7 Player Conduct 8 Rule Infractions