Metro Atlanta. Cleve s 10-Year Market Projections SF Detached. GoGaddis.com 89,002 83,829 78,958 74,369 70,047 65,976 62,142 58,531 55,129 51,926
|
|
|
- Lorraine Booth
- 5 years ago
- Views:
Transcription


1
2 $231,000 $221,760 $228,413 $235,265 $242,323 Metro Atlanta Cleve s 10-Year Market Projections SF Detached $252,016 $262,097 $275,909 $290,450 $305,756 $321,870 Total Single Family Detached Closings Average Sales Price Actual Closings ,908 51,926 55,129 58,531 62,142 65,976 70,047 74,369 78,958 83,829 89,002 Actual Average Sales Price Source: First Multiple Listing Service
3 FMLS Market Charts
4 80,000 Single Family Detached - Closings Metro Atlanta 2016 vs , % 60,000 50,000 40,000 47,826 51,743 57,726 65,803 68,256 57,218 45,992 44,752 41,740 49,092 54,174 53,965 54,857 62,552 68,984 30,000 20,000 10, Source: First Multiple Listing Service
5 $300,000 Single Family Detached - Average Sale Price Metro Atlanta $265, vs % $250,000 $200,000 $150,000 $225,022 $231,846$240,312 $255,168 $260,723 $230,617 $197,562 $200,252 $176,326 $183,829 $230,762 $251,509 $277,922 $267,098 $100,000 $50,000 Up 57.6% since 2011 Up 4.6% since 2007 $ Source: First Multiple Listing Service
6 16,000 Single Family Attached Closings Metro Atlanta 2016 vs % 14,000 14,728 12,000 10,000 8,000 6,000 4,000 5,514 6,185 8,181 10,562 12,052 10,771 7,794 7,722 7,648 8,758 11,398 9,843 10,462 13,129 2, Source: First Multiple Listing Service
7 $250,000 Single Family Attached - Average Sales Price Metro Atlanta 2016 vs % $200,000 $150,000 $180,365 $187,073$186,042 $192,495 $195,446 $186,324 $177,318 $175,157 $195,334 $224,391 $211,685 $100,000 $150,811 $143,386 $139,328 $125,126 $50,000 Up 79.33% since 2011 Up 14.88% since 2007 $ Source: First Multiple Listing Service
8 90,000 80,000 70,000 60,000 50,000 40,000 30,000 20,000 10, to 2015 Total SFD and SFA Closings Metro Atlanta 82,314 83,712 75,651 69,936 66,255 64,008 64,427 57,850 55,794 54,483 51,128 68,984 68,256 57,218 54,857 62,522 54,174 45,992 49,092 53,965 44,752 41,470 14,725 12,052 10,711 7,794 7,722 7,648 8,758 9,834 11,398 13,129 10, vs % Total Single Family Single Family Detached Single Family Attached
9 180 Single Family Detached Total Days on Market Metro Atlanta Source: First Multiple Listing Service
10 80,000 Single Family Detached - Total Expired Listings Metro Atlanta 70,000 60,000 63,922 71,676 50,000 51,695 40,000 40,845 42,939 39,050 45,847 43,966 30,000 34,829 35,169 20,000 10,000 20,529 15,114 18,806 18,371 17, Source: First Multiple Listing Service
11 35,000 Single Family Detached - Total Withdrawn Listings Metro Atlanta 30,000 25,000 29,186 27,713 20,000 15,000 10,000 5,000 18,959 15,192 14,377 13,022 10,643 19,094 16,254 14,420 11,563 12,503 13,191 10,223 9, Source: First Multiple Listing Service


12 Average Days on Market and Percentage of Homes that Sell by Price Band % 64% 48% 38% 31% <$250,000 $250,000-$500,000 $500,000-$750,000 $750,000-$1,000,000 >$1,000,000 Percentage of listings that sell Avg Total Days on Market
13 80,000 70,000 Total Listing Inventory as of 12/31 Metro Atlanta All Property Types 75,622 60,000 68,431 50,000 59,425 54,121 54,070 40,000 30,000 20,000 34,190 39,326 41,311 44,544 36,659 23,564 27,043 30,605 30,204 31,518 10, Source: First Multiple Listing Service
14 Months of Supply Months of Supply Metro Atlanta Seller s Market Less than 4 months inventory Balanced Market 4 to 5 months inventory Buyer s Market More than 5 months inventory New - Residential Detached New - Residential Attached Resale - Residential Detached Resale - Residential Attached Balanced Market Source: First Multiple Listing Service
15 Sales Price to List Price Ratios Single Family Detached in Metro Atlanta 100.0% 98.0% 96.0% 94.0% 92.0% 90.0% 88.0% 86.0% 84.0% 82.0% 80.0% 97.6% 96.7% 97.0% 95.6% 94.7% 88.4% 93.6% 93.9% 94.0% 86.6% 86.8% 88.5% 95.1% 90.2% 98.4% 96.8% 96.9% 97.1% 96.5% 95.6% 95.6% 94.9% OLP/SP LP/SP Source: First Multiple Listing Service
16 Price Change Effect on Sales Price to Original List Price Ratio Metro Atlanta - Detached and Attached SF Homes % 98.0% 96.0% 97.9% Sales Price as % of Original List Price 94.0% 92.0% 90.0% 88.0% 86.0% 84.0% 82.0% 85.3% 80.0% 78.0% Days on Market No Price Change Days on Market With Price Change
17 100.0% New Construction and Re-Sale Closings in Metro Atlanta 90.0% 80.0% 70.0% 60.0% 79.3% 82.7% 85.8% 90.0% 93.0% 92.9% 91.1% 90.8% 89.8% 87.6% 50.0% 40.0% 30.0% 20.0% 10.0% 0.0% 20.7% 17.3% 14.2% 10.0% 7.0% 7.1% 8.9% 9.2% 10.2% 12.4% % New % Re-Sale Source: First Multiple Listing Service
18 Average Sales Prices of New and Re-Sale Homes Metro Atlanta $400,000 $350,000 $300,000 $250,000 $200,000 $150,000 $340,782 $244,744 $330,504 $207,495 $298,396 $297,603 $179,866 $187,610 $275,583 $166,367 $283,724 $176,206 $318,037 $220,529 $341,598 $241,914 $353,852 $256,607 $360,119 $264,619 Avg. Sales Price New Avg. Sales Price Re-Sale $100,000 $50,000 Resale Price as % of New Price $ % 62.8% 60.3% 63.0% 60.4% 62.1% 69.3% 70.8% 72.5% 73.5% Source: First Multiple Listing Service
19 Price Ranges of Single Family Detached Closings in Metro Atlanta 100% 90% 80% 70% 60% 50% 40% 30% 20% 10% 0% $1,000,000+ $750,000-$999,999 $500,000-$749,999 $250,000-$499,999 $100,000-$249,999 <$99,999 Source: First Multiple Listing Service

20 50.00% 45.00% Cash Purchases as Percentage of Total Closings Single Family Detached - Priced Under $200,000 - Metro Atlanta 45.09% 44.21% 40.00% 39.91% 35.00% 36.42% 30.00% 25.00% 20.00% 19.15% 26.41% 31.24% 28.00% 22.80% Cash % 15.00% Source: First Multiple Listing Service
21 S&P/Case-Shiller Home Price Index August of Each Year AZ-Phoenix CA-Los Angeles DC-Washington FL-Miami GA-Atlanta IL-Chicago NC-Charlotte NV-Las Vegas NY-New York TX-Dallas Atlanta up 49.4% since 2011 Source: S&P/Case-Shiller Home Price Index
22 Metro Atlanta County Charts
23 Gwinnett County Source: First Multiple Listing Service 14,000 12,250 12,000 10,000 8,000 10,328 7,682 7,922 7,397 9,586 10,599 9,083 9,480 11, % Total SFD Closings 6,000 Total SFD Distressed Closings 4,000 2, ,464 4,002 1,302 1,961 2, ,272 1, , % of total Gwinnett County $300,000 $250,000 $200,000 $150,000 $100,000 $50,000 $241,070 $222,523 $181,840 $175,846 $162,363 $167,827 $157,777$157,421 $142,857 $149,831 $244,750 $228,269 $210,383 $191,910 $137,288$142,827 $108,892 $112,857 $176,543 $183, % Avg. Total SP Avg. Distressed SP $
24 North Fulton County Source: First Multiple Listing Service 5,000 4,500 4,000 3,500 3,000 2,500 2,000 1,500 1, % Total SFD Closings Total SFD Distressed Closings.95% of total North Fulton County $600,000 $500,000 $400,000 $300,000 $200,000 $456,854 $455,335 $482,556 $513,419 $410,690 $402,114 $447,929 $426,788 $389,994$386,012 $383,752 $405,978$413,358 $375,060 $370,340 $353,993 $320,845 $323,695 $299,325 $305, % Avg. Total SP Avg. Distressed SP $100,000 $
25 5,000 4,500 4,000 3,500 3,000 2,500 2,000 1,500 1, South Fulton County 4,536 4,061 3,621 3,331 3,089 3,043 3,174 2,949 2,845 3, % Total SFD Closings Total SFD Distressed Closings 7.51 % of total Source: First Multiple Listing Service South Fulton County $180,000 $160,000 $140,000 $120,000 $100,000 $80,000 $60,000 $40,000 $20,000 $0 $167,136 $160,820 $150,325 $134,238 $114,672 $103,409 $88,055 $90,854 $92,571 $82,401 $104,444 $96,860 $97,838 $90,850 $85,105 $71,116 $73,737 $71,821 $73,367 $66, % Avg. Total SP Avg. Distressed SP
26 Source: First Multiple Listing Service City of Atlanta 3,500 3,000 2,500 2,807 2,757 2,451 2,065 2,160 2,383 2,647 2,715 2,861 2, % 2,000 Total SFD Closings 1,500 Total SFD Distressed Closings 1, % of total City of Atlanta $700,000 $600,000 $500,000 $400,000 $300,000 $200,000 $100,000 $493,966 $405,309 $436,008$437,094 $379,459 $340,748 $180,614 $201,625$234,815 $130,691 $83,972 $109,480 $546,741 $577,266$611,799 $499,724 $270,059 $171,747$177,049 $190, % Avg. Total SP Avg. Distressed SP $
27 Source: First Multiple Listing Service Cobb County 12,000 10,000 8,237 8,088 8,625 8,548 9,467 9, % 8,000 7,074 6,218 6,042 6,015 6,000 Total SFD Closings Total SFD Distressed Closings 4,000 2, % of total $350,000 $300,000 $250,000 Cobb County $279,716 $266,196 $277,203$292,198 $255,680 $244,681 $225,609 $221,052 $192,030 $201, % $200,000 $150,000 $100,000 $163,889$161,281$157,841$155,673 $149,099 $156,858 $171,199 $126,269$126,016 $131,088 Avg. Total SP Avg. Distressed SP $50,000 $
28 Dekalb County Source: First Multiple Listing Service 9,000 8,000 7,341 7, % 7,000 6,000 6,533 6,028 5,745 5,177 5,748 6,588 6,575 6,556 5,000 Total SFD Closings 4,000 Total SFD Distressed Closings 3,000 2,000 1,191 1,741 1,776 1,449 1,708 1,795 1, % of total 1, Dekalb County $350,000 $300,000 $250,000 $265,498 $223,738 $301,107 $283,567 $263,921 $244, % $200,000 $150,000 $100,000 $50,000 $131,504 $179,288 $183,848 $167,111 $177,476 $106,131 $88,295 $95,410 $102,535$105,463$103,438$100,528 $86,068 $82,895 Avg. Total SP Avg. Distressed SP $
29 Forsyth County Source: First Multiple Listing Service 5,000 4,500 4,000 3,500 3,000 2,500 2,000 3,283 2,386 2,098 2,199 2,609 2,939 3,557 3,769 4,186 4, % Total SFD Closings Total SFD Distressed Closings 1,500 1, % of total $400,000 $350,000 $300,000 $250,000 Forsyth County $335,646 $324,568 $320,302 $332,829$345,034 $291,135 $292,673 $276,842 $256,451 $263,533 $200,000 $150,000 $232,633 $279,964 $264, % $231,184 $190,018 $185,018 $211,885 $225,418 $209,898 $241,164 Avg. Total SP Avg. Distressed SP $100,000 $50,000 $
30 5,000 4,500 4,000 3,500 3,000 2,500 2,000 3,489 2,344 2,410 2,342 2,813 Cherokee County 3,794 3,609 3,186 4,281 4, % Total SFD Closings Total SFD Distressed Closings Source: First Multiple Listing Service 1,500 1, % of total Cherokee County $300,000 $250,000 $200,000 $150,000 $100,000 $253,453 $232,227 $212,939 $203,365 $180,959$184,197 $266,329 $249,778 $231,250 $211,269 $198,066 $182,532$182,441 $178,867 $167,875 $173,671 $136,053$139,641 $150,575$156, % Avg. Total SP Avg. Distressed SP $50,000 $
31 Source: First Multiple Listing Service Hall County 3,000 2,500 2,202 2, % 2,000 1,779 1,635 1,789 1,834 1,851 1,500 1,216 1,216 1,351 Total SFD Closings Total SFD Distressed Closings 1, % of total , , , , ,000 50,000 $254,701 $226,630 $203,069 $181,318 $158,714$157,078 Hall County $192,096 $251,436 $221,224 $235,302 $174,053 $156,681 $149,894 $138,768 $125,328 $137,655 $140,473 $109,630$106,598$106, % Avg. Total SP Avg. Distressed SP
32 Source: First Multiple Listing Service Clayton County 1,600 1,400 1,200 1,033 1,225 1,436 1,156 1,301 1,145 1,019 1, % 1, Total SFD Closings Total SFD Distressed Closings 8.7% of total , , ,000 80,000 60,000 40,000 Clayton County $123,158 $119,544 $101,679 $83,315 $80,889 $92,228 $59,797 $62,828 $55,992 $46,994 $48,685 $66,792 $64,681 $62,450 $64,201 $55,956 $56,816 $50,542 $42,515 $44, % Avg. Total SP Avg. Distressed SP 20,
33 Fayette County Source: First Multiple Listing Service % Total SFD Closings Total SFD Distressed Closings % of total Fayette County $400,000 $350,000 $300,000 $250,000 $200,000 $150,000 $100,000 $308,783 $294,128$277,505 $265,777 $226,325 $236,627$255,151 $282,152 $356,478 $335,379 $230,856 $204,486 $194,453 $182,617 $171,285$168,818$167,273$166,851$159,196 $137, % Avg. Total SP Avg. Distressed SP $50,000 $
34 1,200 Henry County 1,064 Source: First Multiple Listing Service 1, % Total SFD Closings Total SFD Distressed Closings 2.91% of total $250,000 Henry County $200,000 $193,611 $172,714 $180,414 $202,749 $205, % $150,000 $100,000 $50,000 $140,540 $142,569 $134,030 $122,936 $155,128 $115,198 $144,584 $130,525 $130,428 $130,454 $111,110 $96,457 $100,809 $106,548 $109,857 Avg. Total SP Avg. Distressed SP $
35 Rockdale County Source: First Multiple Listing Service % Total SFD Closings Total SFD Distressed Closings 8.10% of total $250,000 Rockdale County +7.18% $210,530 $200,000 $150,000 $100,000 $50,000 $169,542 $172,777 $152,726 $149,421 $143,675 $136,289 $141,007 $174,119 $156,880 $162,453 $139,831 $121,904 $113,566 $115,355 $94,918 $103,225 $135,012 $127,770 $98,398 Avg. Total SP Avg. Distressed SP $
36 The Effect of Distressed Property Sales on Single Family Sales Prices in 2012 in Metro Atlanta Average Sales Price (Non-Distressed) $220,930 Single Family Detached Average Sales Price (Distressed Closings) $110,676 Single Family Detached -16.7% Average Sales Price (All Closings) $183,827 Single Family Detached Average Sales Price (Non-Distressed) $166,180 Single Family Attached Average Sales Price (Distressed Closings) $82,250 Single Family Attached -15.9% Average Sales Price (All Closings) $139,729 Single Family Attached Source: First Multiple Listing Service
37 The Effect of Distressed Property Sales on Single Family Sales Prices in 2013 in Metro Atlanta Average Sales Price (Non-Distressed) $258,683 Single Family Detached Average Sales Price (Distressed Closings) $120,509 Single Family Detached -10.8% Average Sales Price (All Closings) $230,731 Single Family Detached Average Sales Price (Non-Distressed) $194,596 Single Family Attached Average Sales Price (Distressed Closings) $92,310 Single Family Attached -10.0% Average Sales Price (All Closings) $175,189 Single Family Attached Source: First Multiple Listing Service
38 The Effect of Distressed Property Sales on Single Family Sales Prices in 2014 in Metro Atlanta Average Sales Price (Non-Distressed) $266,056 Single Family Detached Average Sales Price (Distressed Closings) $142,924 Single Family Detached -5.5% Average Sales Price (All Closings) $251,349 Single Family Detached Average Sales Price (Non-Distressed) $204,098 Single Family Attached Average Sales Price (Distressed Closings) $95,553 Single Family Attached -4.3% Average Sales Price (All Closings) $195,314 Single Family Attached Source: First Multiple Listing Service
39 The Effect of Distressed Property Sales on Single Family Sales Prices in 2015 in Metro Atlanta Average Sales Price (Non-Distressed) $276,138 Single Family Detached Average Sales Price (Distressed Closings) $125,887 Single Family Detached -3.3% Average Sales Price (All Closings) $266,949 Single Family Detached Average Sales Price (Non-Distressed) $216,560 Single Family Attached Average Sales Price (Distressed Closings) $98,221 Single Family Attached -2.3% Average Sales Price (All Closings) $211,674 Single Family Attached Source: First Multiple Listing Service
40 The Effect of Distressed Property Sales on Single Family Sales Prices in 2016 in Metro Atlanta Average Sales Price (Non-Distressed) $281,222 Single Family Detached Average Sales Price (Distressed Closings) $133,480 Single Family Detached -1.9% Average Sales Price (All Closings) $275,821 Single Family Detached Average Sales Price (Non-Distressed) $226,777 Single Family Attached Average Sales Price (Distressed Closings) $108,760 Single Family Attached -1.1% Average Sales Price (All Closings) $224,125 Single Family Attached Source: First Multiple Listing Service
41 Savings on Short Sales and Foreclosures vs. Market Sales Metro Atlanta 2016 Single Family Detached Non Distressed Avg. Sales Price $281,222 Short Sales Avg. Sales Price $166,5122 (41% less) Foreclosures Avg. Sales Price $132,560 (53% less) Single Family Attached Non Distressed Avg. Sales Price $226,777 Short Sales Avg. Sales Price $112,805 (50% less) Foreclosures Avg. Sales Price $114,834 (49% less) Source: First Multiple Listing Service
42 Mortgage Delinquencies
43 Source: Mortgage Bankers Association & caculatedriskblog.com

44 2016 National Foreclosure Rate:.8% 2015 National Foreclosure Rate: 1.2% 2016 Georgia Foreclosure Rate:.5% 2015 Georgia Foreclosure Rate:.67% As a percentage of all homes with a mortgage Source: Mortgage Bankers Association & calculatedriskblog.com, RealtyTrac.com
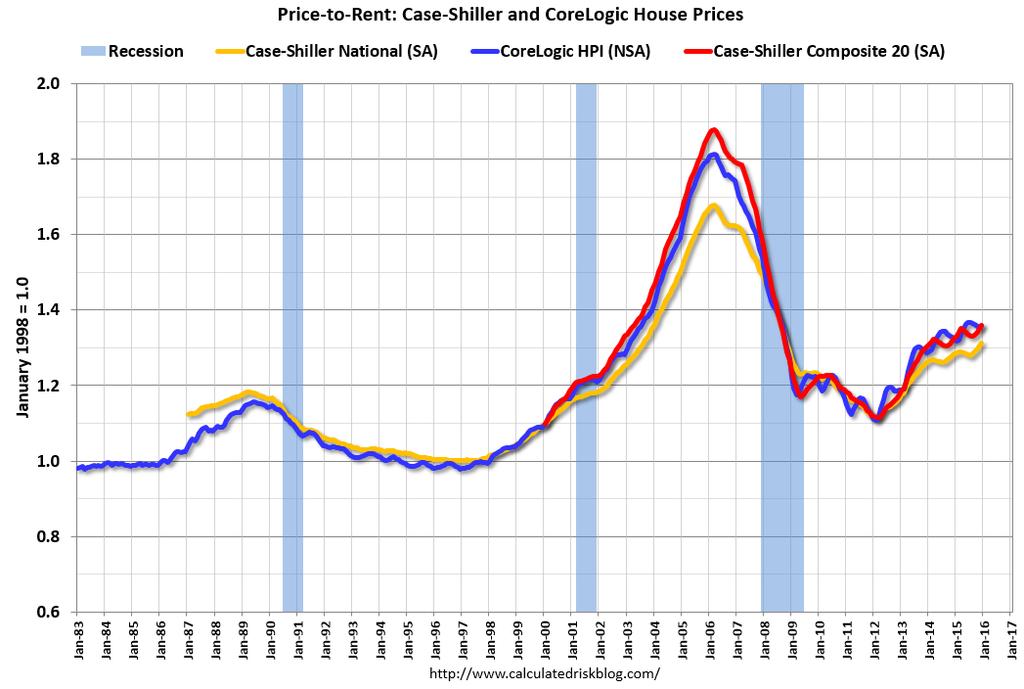
45 Price-to-Rent Ratios
46
47
48 Cost to Purchase vs. Rent Analysis Metro Atlanta, GA 2016 Average Monthly Cost to Rent Metro Atlanta Home: $1,729 Average Monthly Cost to Purchase Metro Atlanta Home: Effective Monthly Cost to Purchase with Tax Advantages: $1,474 (17% less) $1,236 (29% less)
49 Looking Ahead
50 2017 Atlanta Real Estate Market Projections: Prices will rise 2.5-4%. Sales will rise 3-6%. Buyer urgency increasing at lower price ranges. Downward pressure on commissions. Regulatory uncertainty. Credit standards ease and more creative loan products introduced. Mortgage rates increase. Builders offer more incentives (to buyers and to brokers/agents) and face continued cost pressure. Smart Data plays more important role in real estate. On the Fence sellers decide it s time to move. Sellers in higher prices need to be more tactical when pricing. Buyer s remorse increases in lower price ranges. The next downturn is coming. Will you be ready?
51 Mortgage Rates Freddie Mac 30 year Fixed Rate Decrease in borrowing power as rates increase: 4.30% $3, % $6, % $9, Projected Rates /1/2015 4/1/2015 5/1/2015 6/1/2015 7/1/2015 8/1/2015 9/1/ /1/ /1/ /1/2015 1/1/2016 2/1/2016 3/1/2016 4/1/2016 5/1/2016 6/1/2016 7/1/2016 8/1/2016 9/1/ /1/ /1/ /1/2016 1/1/2017 2/1/2017 3/1/2017 4/1/2017 5/1/2017 6/1/2017 7/1/2017 8/1/2017 9/1/ /1/ /1/ /1/2017 Source: Average or NAR, MBA and Fannie Mae Projections
52
53 $350,000 Median U.S. Home Price $300,000 $313,600 $250,000 $200,000 $196,871 $150,000 $100, % $50, % $0 Average US Home Sales Price US Average Home Sales Price - Adjusted for Interest Rate Source: US Census

54 Millennial* Myths: live in parent s basement too much student debt to buy homes prefer to rent Live Urban *
55

56 Homeownership Rates Q Q Q Q4 Source: Census

57


58 The Call Cleve Atlanta Real Estate Show Sundays at Noon & Tuesdays at 2 EXPERT REAL ESTATE ADVISOR on THE MORNING RIDE WITH LARRY LARSON TUESDAYS AT 9:30 AM
59 Sure Home Selling System Sure Home Buying System
60 3100 Apples to Apples 100-based Index Value Year US Median Home Sales Price Dow Jones Industrial Average S&P 500 Average Source: US Census, DJIA, S&P 500
61 Mortgage Rates - 10-Year Treasury Yield - Fed Funds Rate Historic: 15-year spread: 1.18% 30-year spread: 1.77% Currently: 15-year spread: 0.94% 30-year spread: 1.70% Jan-00 Apr-00 Jul-00 Oct-00 Jan-01 Apr-01 Jul-01 Oct-01 Jan-02 Apr-02 Jul-02 Oct-02 Jan-03 Apr-03 Jul-03 Oct-03 Jan-04 Apr-04 Jul-04 Oct-04 Jan-05 Apr-05 Jul-05 Oct-05 Jan-06 Apr-06 Jul-06 Oct-06 Jan-07 Apr-07 Jul-07 Oct-07 Jan-08 Apr-08 Jul-08 Oct-08 Jan-09 Apr-09 Jul-09 Oct-09 Jan-10 Apr-10 Jul-10 Oct-10 Jan-11 Apr-11 Jul-11 Oct-11 Jan-12 Apr-12 Jul-12 Oct-12 Jan-13 Apr-13 Jul-13 Oct-13 Jan-14 Apr-14 Jul-14 Oct-14 Jan-15 Apr-15 Jul-15 Oct-15 Jan-16 Apr-16 Jul-16 Oct-16 Jan year Mortgage Rate 15-year Mortgae Rate 10-year Treasury Yield Federal Funds Rate Source: Freddie Mac & US Federal Reserve
62 Atlanta Will Continue to Grow By 2040 Year Population Employment ,473,846 2,699, ,256,323 4,472,563 Source: Atlanta Regional Commission
63 New Housing Units Required in Metro Atlanta based on Population Growth , , , ,537 4-Year Total 142,685 Source: Atlanta Regional Commission and US Census
64 Where Will Growth Take Place in Metro Atlanta? For 20 Counties NNW NNE ENE WNW The Core is not depicted by a growth bar, but increases by 77,024 persons and 65,562 jobs between 2000 and 2030 ESE WSW SSW SSE Source: Atlanta Regional Commission
65 Metro Atlanta Employment Density percent of 20-county jobs is inside the blue outline 1.32 = median jobs per acre for census tracts Source: Atlanta Regional Commission
66 Feel free to contact me with any questions. Cleve Gaddis Gaddis Partners, RE/MAX Center Sure Realty, Inc. (a boutique residential property management company) Medlock Bridge Road, Suite 119 Johns Creek, GA www
Cleve Gaddis Gaddis Partners, RE/MAX Center & USA Management
 Cleve Gaddis Gaddis Partners, RE/MAX Center & USA Management (a boutique residential property management company) 10475 Medlock Bridge Road, Suite 119 Johns Creek, GA 30097 www. 770-497-0000 All information
2016 Texas Prosperity Conference The Barnhill Center Brenham, Texas August 26, Dr. James P. Gaines Chief Economist. recenter.tamu.
 2016 Texas Prosperity Conference The Barnhill Center Brenham, Texas August 26, 2016 Dr. James P. Gaines Chief Economist recenter.tamu.edu Housing and People 2 Texas Population 1910-2050 60,000,000 50,000,000
U.S. REITs have rebounded strongly Dow Jones Equity REIT Total Return Index
 U.S. REITs have rebounded strongly Dow Jones Equity REIT Total Return Index Index, 2005 = 100 250 200 150 100 50 0 2005 2006 2007 2008 2009 2010 2011 2012 2013 2014 Sources: Bloomberg, Dow Jones. Affordability
National Housing Trends
 National Housing Trends 34% America s Choice of Best Long Term Investment 26% 17% 15% 6% Real Estate Stocks / Mutual Funds Gold Savings Accounts / CDs Bonds Gallup 2018 Housing Affordability 197 Index
National Housing Trends
 National Housing Trends 34% America s Choice of Best Long Term Investment 26% 17% 15% 6% Real Estate Stocks / Mutual Funds Gold Savings Accounts / CDs Bonds Gallup 2018 Home Sales in thousands 2017 2018P
National Housing Trends
 National Housing Trends 34% America s Choice of Best Long Term Investment 26% 17% 15% 6% Real Estate Stocks / Mutual Funds Gold Savings Accounts / CDs Bonds Gallup 2018 Housing Affordability 197 Index
U.S. Economic and Apartment Market Overview and Outlook. July 15, 2014
 2014 U.S. Economic and Apartment Market Overview and Outlook July 15, 2014 U.S. Economic Overview U.S. GDP Growth Persistent Despite 1Q Polar Vortex Annualized Quarterly Percent Change 10% 5% 0% -5% -10%
National Housing Trends
 National Housing Trends 34% America s Choice of Best Long Term Investment 26% 17% 15% 6% Real Estate Stocks / Mutual Funds Gold Savings Accounts / CDs Bonds Gallup 2018 Housing Affordability 197 Index
MBA Economic and Mortgage Finance Outlook
 MBA Economic and Mortgage Finance Outlook MBA of Alabama Annual Conference June 7, 2017 Presented by Lynn Fisher Mortgage Bankers Association 1 Summary of the MBA Outlook 2016 2017 2018 2019 GDP Growth
Real Estate and Economic Outlook
 Real Estate and Economic Outlook Lawrence Yun, Ph.D. Chief Economist NATIONAL ASSOCIATION OF REALTORS Presentation at Inforum Outlook Conference University of Maryland College Park, MD December 12, 2013
Investing in Real Estate. The smart choice for today s investor
 Investing in Real Estate The smart choice for today s investor Real Estate is preferred over stocks Real estate out performs stocks http://blog.863katy.com/category/national-housing-news/page/2/ Real Estate
Kevin Thorpe Financial Economist & Principal Cassidy Turley
 Kevin Thorpe Financial Economist & Principal Cassidy Turley Economic & Commercial Real Estate Outlook Kevin Thorpe, Chief Economist 2012 Another Year Of Modest Improvement 2006Q1 2006Q3 2007Q1 2007Q3 2008Q1
2009 California & Bay Area Real Estate Market Outlook
 2009 California & Bay Area Real Estate Market Outlook November 24, 2008 Fairmont Hotel Leslie Appleton-Young C.A.R. Vice President and Chief Economist California Real Estate Market: 2008 California s Housing
Carol Tomé CFO and Executive Vice President, Corporate Services
 Carol Tomé CFO and Executive Vice President, Corporate Services Financial Overview December 6, 2017 1 Discussion Overview Fiscal 2017 Financial Guidance Our View of the Economy and State of the U.S. Housing
Future of Housing Trends and the Housing Market Demographic Waves in the Region and Future of Housing. Illinois Finance Forum January 25, 2019
 Future of Housing Trends and the Housing Market Demographic Waves in the Region and Future of Housing Illinois Finance Forum January 25, 2019 Millions OUR STATE S POPULATION 2000-2017 13.0 12.4 M 12.9
Partnerships with Purpose: Housing for Texans
 Partnerships with Purpose: Housing for Texans 25th Annual TALHFA Educational Conference October 25-27, 2017 Fort Worth, Texas Dr. James P. Gaines Chief Economist 2 Outlook Since November 10, 2017: Rising
Real Estate: Investing for the Future. Sponsored By:
 Real Estate: Investing for the Future Sponsored By: Percent Change, Year Ago 6 5 4 3 2 1 Real GDP Growth United States, 2000 Prices 0 1994 1995 1996 1997 1998 1999 2000 2001 2002 2003 2004 U.S. Employment
President and Chief Executive Officer Federal Reserve Bank of New York Washington and Lee University H. Parker Willis Lecture in Political Economics
 The U.S. Economic Outlook Chartspresented by WilliamC Dudley Charts presented by William C. Dudley President and Chief Executive Officer Federal Reserve Bank of New York Washington and Lee University H.
Economic and Real Estate Outlook
 Economic and Real Estate Outlook By Lawrence Yun, Ph.D. Chief Economist, National Association of REALTORS Presentation at Charlottesville Area Association of REALTORS October 13, 2016 1990 1991 1992 1993
recenter.tamu.edu Dr. James P. Gaines Research Economist Real Estate Center at Texas A&M University
 recenter.tamu.edu Dr. James P. Gaines Research Economist Real Estate Center at Texas A&M University Area Market Reports RECENTER.TAMU.EDU Tierra Grande Economic Review Videos, Audios & Presentations Data,
Dr. James P. Gaines Research Economist recenter.tamu.edu
 Texas Uncertain Economy in a World of Uncertain Oil Prices Dr. James P. Gaines Research Economist recenter.tamu.edu National Economic Recovery still Going 2 U.S. Outlook Expected GDP growth still modest:
Monthly Indicators - 6.4% + 8.0% - 5.3% Market Overview New Listings Pending Sales. Closed Sales. Days on Market Until Sale. Median Sales Price
 Monthly Indicators 2018 The booming U.S. economy continues to prop up home sales and new listings in much of the nation, although housing affordability remains a concern. Historically, housing is still
The U.S. Economy How Serious A Downturn? Nigel Gault Group Managing Director North American Macroeconomic Services
 The U.S. Economy How Serious A Downturn? Nigel Gault Group Managing Director North American Macroeconomic Services Growth Is Cooling; But a Soft Landing Is Likely (Real GDP, annualized rate of growth)
Iowa Farmland Market Update: What s Ahead?
 Iowa Farmland Market Update: What s Ahead? Wendong Zhang Assistant Professor of Economics and Extension Economist wdzhang@iastate.edu 515-294-2536 Ag Credit School, June 14 th, 2017 The new Mike Duffy
Friday, May 22, NAR Convention
 NAR Convention 5-14-09 NAR Convention 5-14-09 Lawrence Yun, NAR Chief Economist NAR Marketing Tips!Provide Market Data to buyers!forbes Buyer Survey: Now good time to buy home!best Banner Ads: 1. Has Market
Dr. James P. Gaines Research Economist. recenter.tamu.edu
 Dr. James P. Gaines Research Economist recenter.tamu.edu National Economic Recovery still Going 2 National Issues Expected GDP growth still modest: 2015 2.5%; personal consumption 2.5% Inflation not worrisome:
2007 Real Estate Market Forecast. October 18, 2006 Leslie Appleton-Young C.A.R. Vice President and Chief Economist
 2007 Real Estate Market Forecast October 18, 2006 Leslie Appleton-Young C.A.R. Vice President and Chief Economist Overview California Real Estate Market What happened in 2006? Tipping Points/Market Psychology
DFW MULTIFAMILY TRENDS & OBSERVATIONS Q2 2017
 DFW MULTIFAMILY TRENDS & OBSERVATIONS Q2 2017 DALLAS / FORT WORTH The Top US Demand Driven Apartment Market DFW MULTIFAMILY STARTS A HISTORY LESSON!!! The challenge boom or bust perception vs recent history
Texas Economic Outlook: Recovery in 2010 Keith Phillips Federal Reserve Bank of Dallas San Antonio Office
 Texas Economic Outlook: Recovery in 2010 Keith Phillips Federal Reserve Bank of Dallas San Antonio Office The views expressed in this presentation are strictly those of the author and do not necessarily
2012 Raleigh-Durham Market Forecast Investment Sales. Jeff Glenn CBRE Wednesday, March 21, 2012
 2012 Raleigh-Durham Market Forecast Investment Sales Jeff Glenn CBRE Wednesday, March 21, 2012 What s Wrong with this Picture? TOPICS I. National Perspective II. Raleigh-Durham Spotlight III. A Closer
MARKET AND CAPACITY UPDATE. Matthew Marsh September 2016
 MARKET AND CAPACITY UPDATE Matthew Marsh September 2016 1980 1981 1982 1983 1984 1985 1986 1987 1988 1989 1990 1991 1992 1993 1994 1995 1996 1997 1998 1999 2000 2001 2002 2003 2004 2005 2006 2007 2008
Spring Time for Housing
 Spring Time for Housing Arizona State University December 2 nd, 2015 Presented By: Elliott D. Pollack CEO, IN PHOENIX 1 2 The World has Changed Pre-2007 Post-2007 3 Employment Growth From Bottom of Recession
Economic Recovery Has Stalled, Recession in the Cards by Year End
 Economic Indicators to Watch for Signs of Recovery Economic Recovery Has Stalled, Recession in the Cards by Year End New York, NY Monday, June 27, 2011 Richard Yamarone Author of The Trader s Guide to
PHILADELPHIA HOUSE PRICE INDICES
 PHILADELPHIA HOUSE PRICE INDICES February 13, 2017 KEVIN C. GILLEN, Ph.D. Kevin.C.Gillen@Drexel.edu Disclaimers and Acknowledgments: The Lindy Institute for Urban Innovation at Drexel University provides
Frederick Ross. Real Estate Market Overview. Presented by: Kevin Thomas Senior Vice President. Frederick Ross. Company.
 Frederick Ross Real Estate Market Overview Presented by: Kevin Thomas Senior Vice President Frederick Ross Company January 2003 Business Consumers Source: BEA, Ross Research Housing...Bust or Rust? 2001
Iowa Farmland Market Update: What s Ahead?
 Iowa Farmland Market Update: What s Ahead? Wendong Zhang Assistant Professor of Economics and Extension Economist wdzhang@iastate.edu 515-294-2536 April 4 th, 2017 The new Mike Duffy since Aug 2015 30
Bob Costello Chief Economist & Vice President American Trucking Associations. Economic & Motor Carrier Industry Trends. September 10, 2013
 Bob Costello Chief Economist & Vice President American Trucking Associations Economic & Motor Carrier Industry Trends September 10, 2013 The Freight Economy Washington continues to be a headwind on economic
Riverside Rising Economic Outlook for the Region April 2015
 Analysis. Answers Riverside Rising Economic Outlook for the Region April 2015 Beacon Economics, LLC California fact versus fiction Looking back a few years (2009 / 2010) everyone was saying that CA would
Houston and Tomball Economic and. Housing Outlook. recenter.tamu.edu. Dr. James P. Gaines Research Economist
 Houston and Tomball Economic and Dr. James P. Gaines Research Economist Housing Outlook recenter.tamu.edu THE CURRENT SITUATION The Future Just Ain t What It Used to Be! Yogi Berra National Economic Recovery
10 County Conference. Richard Wobbekind. Executive Director Business Research Division & Senior Associate Dean Leeds School of Business
 10 County Conference Richard Wobbekind Executive Director Business Research Division & Senior Associate Dean Leeds School of Business Hmm... (http://myfallsemester.blogspot.com) Real GDP Growth Percent
THE MOST INFORMATIVE EVENT COVERING REAL ESTATE INVESTMENTS
 THE MOST INFORMATIVE EVENT COVERING REAL ESTATE INVESTMENTS 2014 U.S. Economic, Capital Markets, and Retail Market Overview and Outlook Retail Trends 2014 U.S. Economic Overview and Outlook Total Employment
PHILADELPHIA HOUSE PRICE INDICES
 PHILADELPHIA HOUSE PRICE INDICES July 20, 2017 KEVIN C. GILLEN, Ph.D. Kevin.C.Gillen@Drexel.edu Disclaimers and Acknowledgments: The Lindy Institute for Urban Innovation at Drexel University provides this
Economic Update and Prospects for 2019 Professor Robert M. McNab Dragas Center for Economic Analysis and Policy Strome College of Business
 Economic Update and Prospects for 2019 Professor Robert M. McNab Dragas Center for Economic Analysis and Policy Strome College of Business January 3, 2019 The forecasts and commentary do not constitute
Briefing on the State of the State. presented to the. SCAA Schuyler Center for Analysis and Advocacy
 Briefing on the State of the State presented to the SCAA Schuyler Center for Analysis and Advocacy Rae D. Rosen Assistant Vice President Federal Reserve Bank of New York November 16, 2006 Key Points: Economic
More of the Same; Or now for Something Completely Different?
 More of the Same; Or now for Something Completely Different? C2ER Place cover image here Richard Wobbekind Chief Economist and Associate Dean for Business and Government Relations June 14, 2017 Real GDP
SFMTA Annual Parking Rates & Policies Survey
 SFMTA Annual Parking Rates & Policies Survey December 2011 2011 Parking Rates and Policies Survey/ 1 Parking rates and policies survey The purpose of the survey is to track changes over time in other cities
Housing Market Update Greater Moncton. Housing market intelligence you can count on
 Housing Market Update Greater Moncton Housing market intelligence you can count on Housing Market Drivers Multi-Residential/Rental Market New Home Market Single Family Homes Resale Market 2013/2014 Outlook
Zions Bank Economic Overview
 Zions Bank Economic Overview Intermountain Credit Education League May 10, 2018 Dow Tops 26,000 Up 48% Since 2016 Election Jan 26, 2018 26,616 Oct 30, 2016 17,888 Source: Wall Street Journal Dow Around
PHILADELPHIA REGIONAL HOUSE PRICE INDICES
 PHILADELPHIA REGIONAL HOUSE PRICE INDICES August 11, 2015 KEVIN C. GILLEN, Ph.D. Kevin.C.Gillen@Drexel.edu Disclaimers and Acknowledgments: The Lindy Institute for Urban Innovation at Drexel University
Monthly Indicators - 5.2% % % Activity Overview New Listings Pending Sales. Closed Sales. Days on Market Until Sale. Median Sales Price
 Monthly Indicators 2018 Sales and new listings continue to perform well throughout the state of New York largely due to a booming U.S. economy that has increased listing and purchasing confidence. Housing
COMPARISON OF FIXED & VARIABLE RATES (25 YEARS) CHARTERED BANK ADMINISTERED INTEREST RATES - PRIME BUSINESS*
 CHARTERED BANK ADMINISTERED INTEREST RATES - PRIME BUSINESS*") COMPARISON OF FIXED & VARIABLE RATES (25 YEARS) Fixed Rates Variable Rates FIXED RATES OF THE PAST 25 YEARS AVERAGE RESIDENTIAL MORTGAGE LENDING RATE - 5 YEAR* (Per cent) Year Jan Feb Mar Apr May Jun Jul
COMPARISON OF FIXED & VARIABLE RATES (25 YEARS) Fixed Rates Variable Rates FIXED RATES OF THE PAST 25 YEARS AVERAGE RESIDENTIAL MORTGAGE LENDING RATE - 5 YEAR* (Per cent) Year Jan Feb Mar Apr May Jun Jul
Charlotte Region Monthly Indicators
 Charlotte Region Monthly Indicators A RESEARCH TOOL PROVIDED BY CHARLOTTE REGIONAL REALTOR ASSOCIATION FOR MORE INFORMATION CONTACT A REALTOR 2018 The booming U.S. economy continues to prop up home sales
The State of the Commercial Real Estate Industry: Year-End 2010 Office Review & Outlook
 The State of the Commercial Real Estate Industry: Year-End 2010 Office Review & Outlook Copyright 2011 CoStar Realty Information, Inc. No reproduction or distribution without permission. The following
Economic Outlook March Economic Policy Division
 Economic Outlook March 212 Economic Policy Division Real GDP Outlook Percent Change, Annual Rate 2 1 1 - -1 197 197 198 198 199 199 2 2 21 U.S. GDP Actual and Potential Quarterly, Q1 197 to Q4 211 Real
Canadian Teleconference: Can the Canadian Economy Survive the Turmoil in the United States?
 Canadian Teleconference: Can the Canadian Economy Survive the Turmoil in the United States? Nigel Gault Chief U.S. Economist Dale Orr Canadian Macroeconomic Services Copyright 2008 Global Insight, Inc.
U.S. AUTO INDUSTRY UPDATE Federal Reserve Bank of Chicago Automotive Outlook Symposium. Emily Kolinski Morris Chief Economist May 2015
 U.S. AUTO INDUSTRY UPDATE Federal Reserve Bank of Chicago Automotive Outlook Symposium Emily Kolinski Morris Chief Economist May 2015 NORTH AMERICA INDUSTRY VOLUME SUMMARY 13.1 Total North America* (Mils.)
Zions Bank Economic Overview
 Zions Bank Economic Overview National Assoc of Credit Managers Member Seminar December 12, 2017 National Economic Conditions Dow Breaks 24,000 The Trump Bump Dow Reaches New Heights Following U.S. Presidential
Zions Bank Economic Overview
 Zions Bank Economic Overview Utah Bankruptcy Lawyers Forum March 20, 2018 National Economic Conditions When Good News is Bad News Is Good News?? Dow Tops 26,000 Up 44% Since 2016 Election Source: Wall
PHILADELPHIA HOUSE PRICE INDICES
 PHILADELPHIA HOUSE PRICE INDICES April 14, 2014 KEVIN C. GILLEN, Ph.D. gillenk@upenn.edu Disclaimers and Acknowledgments: The Fels Institute of Government at the University of Pennsylvania provides this
Zions Bank Economic Overview. December 5, 2017
 Zions Bank Economic Overview December 5, 2017 National Economic Conditions Dow Breaks 24,000 The Trump Bump Dow Reaches New Heights Following U.S. Presidential Election Source: Federal Reserve Bank of
What s Ahead for The Colorado Economy?
 What s Ahead for The Colorado Economy? Colorado Counties Inc. Place cover image here Richard Wobbekind Senior Economist and Associate Dean for Business and Government Relations November 28, 2017 Real GDP
PHILADELPHIA REGIONAL HOUSE PRICE INDICES
 PHILADELPHIA REGIONAL HOUSE PRICE INDICES May 6, 2015 KEVIN C. GILLEN, Ph.D. Kevin.C.Gillen@Drexel.edu Disclaimers and Acknowledgments: The Lindy Institute for Urban Innovation at Drexel University provides
Zions Bank Municipal Conference Economic Overview August 13, 2015
 Zions Bank Municipal Conference Economic Overview August 13, 2015 Overview National Economic Conditions Utah Economic Conditions Utah is One of the Fastest Growing CA 0.9% States in the Country Percent
Commuter Credits Pilot Project
 Commuter Credits Pilot Project IBTTA 2015 Washington, DC Briefing -- March 31, 2015 State and Local Innovations in Surface Transportation Funding Christopher Tomlinson Executive Director State Road and
Economic Update Edward Seiler NH&RA
 Economic Update Edward Seiler NH&RA 2 Annual Real GDP Growth (%) 5.0 4.0 Actual (BEA) Forecast (CBO in red, OMB red + orange) 3.0 2.0 1.0 0.0-1.0 1990 1991 1992 1993 1994 1995 1996 1997 1998 1999 2000
2019 Market Outlook. Jeff Tumbarello Director SWFL REIA Broker/Owner Steelbridge Realty LLC
 2019 Market Outlook Jeff Tumbarello Director SWFL REIA Broker/Owner Steelbridge Realty LLC Data from MLS (exported 1/14/2019 9:26 AM) and public records. Trended with Microsoft excel. Unless otherwise
MAINTAINING MOMENTUM:
 MAINTAINING MOMENTUM: 2018 National Economic Update September 12, 2018 noun mo men tum \ mō-ˈmen-təm, mə- \ 1 b : the strength or force that allows something to continue or to grow stronger or faster as
Regional Real Estate Trends
 Regional Real Estate Trends Terry L. Clower, Ph.D. Director, Center for Regional Analysis Schar School of Policy and Government George Mason University April 6, 2018 140.0 120.0 100.0 80.0 60.0 40.0 20.0
U.S. Oil & Gas Industry Chartbook
 U.S. Oil & Gas Industry Chartbook BBVA Research USA Houston, TX July 2015 DISCLAIMER This document was prepared by Banco Bilbao Vizcaya Argentaria s (BBVA) BBVA Research U.S. on behalf of itself and its
U.S. Overview. Gathering Steam? Tuesday, October 1, 2013
 U.S. Overview Gathering Steam? Tuesday, October 1, 2013 Uneven global economic recovery Annual real GDP growth projections (%) Projections 2013 2014 World 3.1 3.1 3.8 United States 2.2 1.7 2.7 Euro Area
Economic Update: Accelerating Growth and Increasing Risk
 Economic Update: Accelerating Growth and Increasing Risk Professor Robert M. McNab Dragas Center for Economic Analysis and Policy Strome College of Business May 23, 2018 The forecasts and commentary do
Zions Bank Economic Overview
 Zions Bank Economic Overview Kenworth National Dealers Conference November 8, 2018 1 National Economic Conditions 2 Volatility Returns to the Stock Market 27,000 Dow Jones Industrial Average October 10,
PHILADELPHIA HOUSE PRICE INDICES
 PHILADELPHIA HOUSE PRICE INDICES January 15, 2015 KEVIN C. GILLEN, Ph.D. Kevin.C.Gillen@Drexel.edu Disclaimers and Acknowledgments: The Lindy Institute for Urban Innovation at Drexel University provides
Real gross domestic growth
 Real gross domestic growth United States, 2000 prices Compound annual growth rate 10 5 0-5 -10 81 83 85 87 89 91 93 95 97 99 01 03 05 07 Sources: BEA, Global Insight. Consumer sentiment University of Michigan,
Zions Bank Economic Overview
 Zions Bank Economic Overview WIB Education Summit September 19, 2017 National Economic Conditions Dow Breaks 22,000 The Trump Bump Dow Reaches New Heights Following U.S. Presidential Election Source: Federal
Monthly Indicators - 9.1% + 4.5% + 8.0% Activity Overview New Listings. Closed Sales Median Sales Price
 Monthly Indicators 2018 Home prices were consistently up again in most markets in 2018 but at reduced levels compared to recent years. High demand for few homes for sale fueled price increases, but evidence
Will 2016 Be the Last Hurrah for Commercial Real Estate? Presented By: John Chang First Vice-President Marcus & Millichap Research Services
 Will 2016 Be the Last Hurrah for Commercial Real Estate? Presented By: John Chang First Vice-President Marcus & Millichap Research Services Rising Uncertainty Creating Headwinds for Commercial Real Estate
Dr. Richard Wobbekind Executive Director, Business Research Division and Senior Associate Dean for Academic Programs University of Colorado Boulder
 Dr. Richard Wobbekind Executive Director, Business Research Division and Senior Associate Dean for Academic Programs University of Colorado Boulder Member FDIC VectraBank.com Economic Outlook 2015 Richard
Zions Bank Economic Overview Utah Bankers Association Emerging Bank Leaders Conference. November 9, 2017
 Zions Bank Economic Overview Utah Bankers Association Emerging Bank Leaders Conference November 9, 2017 National Economic Conditions Dow Breaks 23,000 The Trump Bump Dow Reaches New Heights Following U.S.
RISI Housing Report An Update on the Housing Market
 RISI Housing Report An Update on the Housing Market North American Conference October 2018 Jennifer Coskren Senior Economist Agenda Current housing demand and demographic conditions Supply and impediments
2008 Real Estate Market Forecast. October 10, 2007 Leslie Appleton-Young C.A.R. Vice President and Chief Economist
 2008 Real Estate Market Forecast October 10, 2007 Leslie Appleton-Young C.A.R. Vice President and Chief Economist Overview California Real Estate Market: 2007 Recap 2007 Forecast Sub-Prime, Credit Crunch
National and Regional Economic Outlook. Central Southern CAA Conference
 National and Regional Economic Outlook Central Southern CAA Conference Dr. Mira Farka & Dr. Adrian R. Fleissig California State University, Fullerton April 13, 2011 The Painfully Slow Recovery The Painfully
Zions Bank Economic Overview Coldwell Banker Commercial Group. November 6, 2017
 Zions Bank Economic Overview Coldwell Banker Commercial Group November 6, 2017 National Economic Conditions Dow Breaks 23,000 The Trump Bump Dow Reaches New Heights Following U.S. Presidential Election
Quick Facts. For Week Ending December 8, 2018 Data current as of December 17, % % - 5.0% Metrics by Week
 Charlotte Region Weekly Market Report A RESEARCH TOOL PROVIDED BY THE CHARLOTTE REGIONAL REALTOR ASSOCIATION FOR MORE INFORMATION CONTACT A REALTOR For Week Ending December 8, 2018 Data current as of December
Monthly Indicators + 1.7% + 7.1% % Market Overview New Listings Pending Sales. Closed Sales. Days on Market Until Sale. Median Sales Price
 Monthly Indicators 2018 Home prices were consistently up again in most markets in 2018 but at reduced levels compared to recent years. High demand for few homes for sale fueled price increases, but evidence
Babson Capital/UNC Charlotte Economic Forecast. May 13, 2014
 Babson Capital/UNC Charlotte Economic Forecast May 13, 2014 Outline for Today Myths and Realities of this Recovery Positive Economic Signs Negative Economic Signs Outlook for 2014 The Employment Picture
Beyond Bullet Points: Statistics, Trends and Analysis
 Beyond Bullet Points: Statistics, Trends and Analysis Vail R. Brown VP, Global Business Development & Marketing Vail@str.com @vail_str 5 THINGS TO KNOW www.hotelnewsnow.com Click on Data Presentations
Iowa Land Values. Wendong Zhang Assistant Professor of Economics and Extension Economist
 Iowa Land Values Wendong Zhang Assistant Professor of Economics and Extension Economist wdzhang@iastate.edu 515-294-2536 2017 U.S. Bank Ag Summit, Ames, IA, January 10 th, 2017 The new Mike Duffy 30 29
Land Values and Chinese Agriculture
 Land Values and Chinese Agriculture Wendong Zhang Assistant Professor of Economics and Extension Economist wdzhang@iastate.edu 515-294-2536 2016 Pro-Ag Meetings, Clarinda, IA, December 15 th, 2016 The
Cement & Construction Outlook
 Cement & Construction Outlook Minnesota Concrete Council November 17, 2011 Dave Zwicke, PCA Analytics Manager, Sr. Economist Bottom Line Economy in a slow growth period characterized by tepid job gains.
Asheville Region Monthly Indicators
 Asheville Region Monthly Indicators A RESEARCH TOOL PROVIDED BY CHARLOTTE REGIONAL REALTOR ASSOCIATION FOR MORE INFORMATION CONTACT A REALTOR 2018 If the last few months are an indication of the temperature
Annual Report on the Charlotte Region Housing Market RESIDENTIAL REAL ESTATE ACTIVITY FROM THE CHARLOTTE REGIONAL REALTOR ASSOCIATION
 Annual Report on the Charlotte Region Housing Market RESIDENTIAL REAL ESTATE ACTIVITY FROM THE CHARLOTTE REGIONAL REALTOR ASSOCIATION Annual Report on the Charlotte Region Housing Market RESIDENTIAL REAL
Federal Reserve Bank of Dallas, FIRM (Financial Institution Relationship Management)
") The Economic Roller Coaster: Where Have We Been? And Where Are We Going? Thomas F. Siems, Ph.D. Senior Economist and Director of Economic Outreach Federal Reserve Bank of Dallas Economic Summit Dallas
The Economic Roller Coaster: Where Have We Been? And Where Are We Going? Thomas F. Siems, Ph.D. Senior Economist and Director of Economic Outreach Federal Reserve Bank of Dallas Economic Summit Dallas
Monthly Indicators + 3.2% + 8.6% + 7.7%
 Monthly Indicators 2018 Residential real estate activity comprised of single-family properties, townhomes and condominiums combined. Percent changes are calculated using rounded figures. Activity Snapshot
PHILADELPHIA REGIONAL HOUSE PRICE INDICES
 PHILADELPHIA REGIONAL HOUSE PRICE INDICES November 28, KEVIN C. GILLEN, Ph.D. Kevin.C.Gillen@Drexel.edu Sponsored By: Disclaimers and Acknowledgments: The Lindy Institute for Urban Innovation at Drexel
FANNIE MAE CONVENTIONAL PRODUCTS
 30-Year Fixed Rate 20-Year Fixed Rate 15-Year Fixed Rate CONFORMING 30 YEAR FIXED CONFORMING 20 YEAR FIXED CONFORMING 15 YEAR FIXED 4.000 100.299 100.257 100.207 100.168 3.750 99.960 99.909 99.842 99.787
FANNIE MAE CONVENTIONAL PRODUCTS
 30-Year Fixed Rate 20-Year Fixed Rate 15-Year Fixed Rate CONFORMING 30 YEAR FIXED CONFORMING 20 YEAR FIXED CONFORMING 15 YEAR FIXED 4.000 97.328 97.284 97.240 97.193 3.750 97.322 97.263 97.206 97.159 3.125
Zions Bank Economic Overview
 Zions Bank Economic Overview Veteran Owned Business Conference May 11, 2018 Dow Tops 26,000 Up 48% Since 2016 Election Jan 26, 2018 26,616 Oct 30, 2016 17,888 Source: Wall Street Journal Dow Around Correction
Economic Update and Outlook
 Economic Update and Outlook NAIOP Vancouver Chapter November 15, 2012 Helmut Pastrick Chief Economist Central 1 Credit Union Outline: Global, U.S., and Canadian economic conditions Canada economic and
CALIFORNIA STATE UNIVERSITY LONG BEACH. Southern California Regional Economic Forecast
 CALIFORNIA STATE UNIVERSITY LONG BEACH Southern California Regional Economic Forecast Lisa M. Grobar, Ph.D. Director, CSULB Economic Forecast Project Office of Economic Research 2009: A terrible year for