Cleve Gaddis Gaddis Partners, RE/MAX Center & USA Management
|
|
|
- Kathlyn Reeves
- 5 years ago
- Views:
Transcription
1 Cleve Gaddis Gaddis Partners, RE/MAX Center & USA Management (a boutique residential property management company) Medlock Bridge Road, Suite 119 Johns Creek, GA www All information contained in this report is believed accurate, but is not warranted.
2 FMLS Market Charts
3 80,000 70,000 Single Family Detached - Closings Metro Atlanta 2013 vs % 60,000 65,803 68,256 50,000 40,000 47,826 51,743 57,726 57,218 45,992 44,752 41,740 49,092 54,174 53,965 30,000 20,000 10, Source: First Multiple Listing Service
4 Single Family Detached - Average Sale Price Metro Atlanta $300, vs $250,000 $200,000 $225,022 $231,846 $240,312 $255,168 $260,723 $265,723 $230, % $230,762 $197,562 $200,252 $176,326 $183,829 $150,000 $100,000 $50,000 $ Source: First Multiple Listing Service
5 14,000 12,000 Single Family Attached Closings Metro Atlanta 12, vs % 10,000 10,562 10,771 9,843 10,462 8,000 6,000 4,000 5,514 6,185 8,181 7,794 7,722 7,648 8,758 2, Source: First Multiple Listing Service
6 $250,000 Single Family Attached - Average Sales Price Metro Atlanta 2013 vs % $200,000 $150,000 $180,365 $187,073 $186,042 $192,495 $195,446 $186,324 $177,318 $175,157 $100,000 $150,811 $143,386 $139,328 $125,126 $50,000 $ Source: First Multiple Listing Service
7 90,000 80,000 82, to 2013 Total SFD and SFA Closings Metro Atlanta 2013 vs % 70,000 69,936 64,008 64,427 60,000 50,000 55,794 54,483 51,128 57,850 Total Single Family 40,000 30,000 20,000 68,256 57,218 45,992 44,752 41,470 49,092 54,174 53,965 Single Family Detached Single Family Attached 10,000 12,052 10,711 7,794 7,722 7,648 8,758 9,834 10, Source: First Multiple Listing Service
8 140 Single Family Detached Total Days on Market Metro Atlanta Source: First Multiple Listing Service
9 80,000 70,000 60,000 Single Family Detached - Total Expired Listings Metro Atlanta 63,922 71, vs % 50,000 51,695 40,000 30,000 34,829 40,845 42,939 39,050 45,847 43,966 35,169 20,000 10,000 20,529 15, Source: First Multiple Listing Service
10 35,000 30,000 Single Family Detached - Total Withdrawn Listings Metro Atlanta 2013 vs % 25,000 29,186 27,713 20,000 15,000 10,000 10,643 13,022 14,377 15,192 18,959 19,094 16,254 14,420 10,223 9,525 5, Source: First Multiple Listing Service
11 80,000 70,000 Total Listing Inventory as of 12/31 Metro Atlanta 75, vs % 60,000 68,431 50,000 59,425 54,121 54,070 40,000 30,000 34,190 39,326 41,311 44,544 36,659 20,000 23,564 27,043 10, Source: First Multiple Listing Service
12 Months of Supply Months of Supply Metro Atlanta Seller s Market Less than 4 months inventory Balanced Market 4 to 5 months inventory Buyer s Market More than 5 months inventory New - Residential Detached New - Residential Attached Resale - Residential Detached Resale - Residential Attached Balanced Market Source: First Multiple Listing Service
13 100.0% 98.0% 96.0% 94.0% 92.0% 90.0% 88.0% 86.0% 84.0% 82.0% 80.0% List-Price to Sales-Price Ratios Single Family Detached in Metro 97.6% 96.7% 94.7% 97.0% 95.6% 88.4% Atlanta 93.6% 93.9% 94.0% 95.1% 86.6% 86.8% 88.5% 90.2% 96.8% 94.9% OLP/LP LP/SP Source: First Multiple Listing Service
14 New Construction and Re-Sale Closings in Atlanta 100% 90% % 70% 60% 50% 40% 30% ReSale 60+ ReSale New 20% 10% 0% 20.9% 7.08% % Source: First Multiple Listing Service
15 $400,000 $350,000 $300,000 $250,000 $200,000 Average Sales Prices of New and Re-Sale Homes Metro Atlanta $340,782 $244,744 $330,504 $207,495 $298,396 $297,603 $179,866 $187,610 $275,583 $166,367 $283,724 $176,206 $319,590 $222,626 43% higher Avg. Sls. Price New $150,000 $100,000 Avg. Sls. Price Resale $50,000 $ Source: First Multiple Listing Service
16 Price Ranges of Single Family Detached Closings in Metro Atlanta 100% 90% 80% 70% 60% 50% 40% 30% 20% 10% 0% $1,000,000+ $750,000-$999,999 $500,000-$749,999 $250,000-$499,999 $100,000-$249,999 <$99,999 Source: First Multiple Listing Service
17 50.00% 45.00% 40.00% Cash Purchases as Percentage of Total Closings Single Family Detached - Priced Under $200,000 - Metro Atlanta 39.91% 45.09% 44.21% 35.00% 30.00% 31.24% 25.00% 20.00% 19.15% 26.41% Cash % 15.00% 10.00% 5.00% In 2013: 13,711 cash closings $1.54 billion 0.00% Source: First Multiple Listing Service
18 S&P/Case-Shiller Home Price Index August of Each Year AZ-Phoenix CA-Los Angeles DC-Washington FL-Miami GA-Atlanta IL-Chicago NC-Charlotte NV-Las Vegas NY-New York TX-Dallas Source: S&P/Case-Shiller
19
20
21 Metro Atlanta County Charts
22 12,000 10,000 8,000 6,000 4,000 2,000 0 Gwinnett County 10,337 10,516 9,537 8,974 7,681 7,914 7,353 3,464 4,002 2,697 2,272 1,961 1,898 1, % $300,000 Total SFD Closings Total SFD Distressed Closings 21.1% of total Gwinnett County Source: First Multiple Listing Service $250,000 $200,000 $150,000 $100,000 $50,000 $241,070 $222,523 $181,828 $176,037 $167,827 $157,777 $162,363 $157,421 $142,737 $150,101 $108,892 $112,857 $192,319 $137, % Avg. Total SP Avg. Distressed SP $
23 North Fulton County Source: First Multiple Listing Service 4,500 4,000 3,500 3,000 2, % Total SFD Closings 2,000 1,500 Total SFD Distressed Closings 1, % of total North Fulton County $500,000 $450,000 $400,000 $456,617 $455,497 $410,796 $405,817 $427,108 $392,881 $361, % $350,000 $300,000 $250,000 $200,000 $150,000 $100,000 $50,000 $0 $375,059 $383,409 $370,524 $350,100 $289,795 $284,992 $308, Avg. Total SP Avg. Distressed SP
24 South Fulton County Source: First Multiple Listing Service 1,800 1,600 1,400 1,200 1, , ,487 1, , , , , % Total SFD Closings Total SFD Distressed Closings 33.9 % of total $250,000 South Fulton County $200,000 $192, % $150,000 $100,000 $50,000 $151,830 $131,591 $125,197 $118,565 $142,273 $101,955 $102,410 $117,374 $104,823 $107,919 $104,759 $83,622 $85,813 Avg. Total SP Avg. Distressed SP $
25 6,000 5,213 City of Atlanta Source: First Multiple Listing Service 5,000 4,000 3,000 2,000 1,000 4,215 1,128 2,079 4,459 1,744 3,827 3,411 1,083 1,108 3, , % Total SFD Closings Total SFD Distressed Closings 13.2 % of total City of Atlanta $400,000 $350,000 $353,280 $297,869 $354, % $300,000 $250,000 $200,000 $217,427 $197,349 $284,181 $260,717 Avg. Total SP $150,000 $100,000 $101,593 $59,615 $129,508 $95,147 $64,789 $91,976 $132,346 Avg. Distressed SP $50,000 $
26 9,000 8,000 7,000 8,243 Cobb County 8,041 7,051 6,219 6,032 5,992 8, % Source: First Multiple Listing Service 6,000 5,000 Total SFD Closings 4,000 3,000 2,000 1, Total SFD Distressed Closings 13.2 % of total $300,000 $250,000 $200,000 $150,000 $100,000 $279,727 $255,472 $245,411 $225,781 $221,356 $202,083 $192,121 $163,622 $161,340 $158,088 Cobb County $155,923 $126,026 $113,041 $131, % Avg. Total SP Avg. Distressed SP $50,000 $
27 7,000 6,000 6,539 6,031 5,726 Dekalb County 5,118 5,073 6,509 6, % Source: First Multiple Listing Service 5,000 4,000 Total SFD Closings 3,000 2,000 1,000 1,193 1,742 1,768 1,429 1,582 1, Total SFD Distressed Closings 15.4 % of total $300,000 $250,000 $200,000 Dekalb County $265,330 $248,769 $223,661 $184,816 $178,402 $179,446 $167, % $150,000 Avg. Total SP $100,000 $50,000 $131,504 $105,998 $88,224 $95,987 $104,047 $80,362 $83,339 Avg. Distressed SP $
28 Forsyth County 3,500 3,000 2,500 3,283 2,386 2,098 2,199 2,609 2, % Source: First Multiple Listing Service 2,000 Total SFD Closings 1,500 1, Total SFD Distressed Closings 22.1 % of total $400,000 $355,547 Forsyth County $350,000 $300,000 $324,648 $291,159 $293,263 $277,071 $256,347 $263, % $250,000 $279,964 $264,959 $200,000 $150,000 $232,633 $231,184 $190,018 $185,018 $211,885 Avg. Total SP Avg. Distressed SP $100,000 $50,000 $ Source: First Multiple Listing Service
29 Cherokee County 4,000 3,500 3,489 3,186 3, % Source: First Multiple Listing Service 3,000 2,813 2,500 2,000 2,344 2,410 2,342 Total SFD Closings 1,500 1, Total SFD Distressed Closings 17.9 % of total $300,000 Cherokee County $253,392 $250,000 $200,000 $232,402 $212,785 $203,348 $180,993 $211,014 $184, % $150,000 $100,000 $198,066 $182,532 $178,867 $182,441 $150,575 $136,053 $139,641 Avg. Total SP Avg. Distressed SP $50,000 $
30 Hall County 2,000 1,800 1,779 1,635 1,789 1, % Source: First Multiple Listing Service 1,600 1,400 1,216 1,216 1,351 1,200 1, Total SFD Closings Total SFD Distressed Closings 21.6 % of total ,000 $254,922 Hall County 250, ,000 $226,327 $202,984 $193,258 $181,721 $158,667 $158, % 150, ,000 50,000 $174,053 $156,681 $149,894 $138,768 $109,630 $106,598 $106,296 Avg. Total SP Avg. Distressed SP
31 Clayton County 1,600 1,400 1,200 1,035 1,225 1,432 1,143 1,289 1, % Source: First Multiple Listing Service 1, Total SFD Closings Total SFD Distressed Closings 42.5 % of total Clayton County 140, ,000 $119, ,000 80,000 60,000 40,000 20,000 $83,003 $92,228 $59,822 $62,940 $55,958 $48,588 $66,275 $47,117 $55,952 $57,113 $50,699 $44,046 $39, % Avg. Total SP Avg. Distressed SP
32 Fayette County % Source: First Multiple Listing Service 150 Total SFD Closings Total SFD Distressed Closings 13.9 % of total Fayette County $350,000 $300,000 $250,000 $308,204 $294,653 $277,205 $267,005 $227,401 $255,956 $239, % $200,000 $150,000 $100,000 $230,856 $204,486 $194,453 $171,285 $171,005 $162,982 $166,851 Avg. Total SP Avg. Distressed SP $50,000 $
33 Rockdale County Source: First Multiple Listing Service % 250 Total SFD Closings Total SFD Distressed Closings 33.0% of total $250,000 $210,530 Rockdale County $200,000 $150,000 $100,000 $50,000 $172,777 $152,726 $149,421 $139,831 $169,542 $121,904 $113,566 $143,675 $141,007 $136,289 $115,355 $103,225 $94, % Avg. Total SP Avg. Distressed SP $
34 The Effect of Distressed Property Sales on Single Family Sales Prices in 2012 in Metro Atlanta Average Sales Price (Non-Distressed) $220,930 Single Family Detached Average Sales Price (Distressed Closings) $110,676 Single Family Detached -16.7% Average Sales Price (All Closings) $183,827 Single Family Detached Average Sales Price (Non-Distressed) $166,180 Single Family Attached Average Sales Price (Distressed Closings) $82,250 Single Family Attached -15.9% Average Sales Price (All Closings) $139,729 Single Family Attached Source: First Multiple Listing Service
35 The Effect of Distressed Property Sales on Single Family Sales Prices in 2013 in Metro Atlanta Average Sales Price (Non-Distressed) $258,683 Single Family Detached Average Sales Price (Distressed Closings) $120,509 Single Family Detached % Average Sales Price (All Closings) $230,731 Single Family Detached Average Sales Price (Non-Distressed) $194,596 Single Family Attached Average Sales Price (Distressed Closings) $92,310 Single Family Attached -9.99% Average Sales Price (All Closings) $175,189 Single Family Attached Source: First Multiple Listing Service
36 Savings on Short Sales and Foreclosures vs. Market Sales Metro Atlanta 2013 Single Family Detached Non Distressed Avg. Sales Price $258,683 Short Sales Avg. Sales Price $142,731 (44% less) Foreclosures Avg. Sales Price $107,386 (58% less) Single Family Attached Non Distressed Avg. Sales Price $194,596 Short Sales Avg. Sales Price $92,157 (52% less) Foreclosures Avg. Sales Price $92,518 (52% less) Source: First Multiple Listing Service
37 Mortgage Delinquencies

38 Source: Mortgage Bankers Association

39 Source: Mortgage Bankers Association
40 Price-to-Rent Ratios
41 Ratio of Annual Rents to Home Prices
42 Looking Ahead
43

44
45
46
47

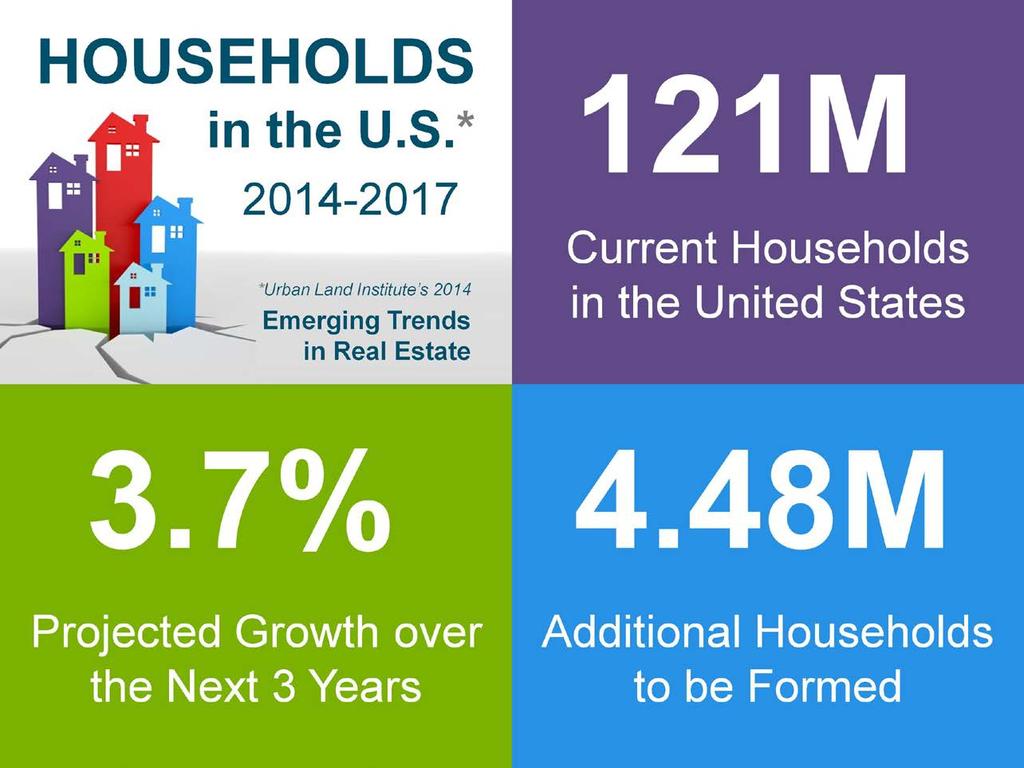
48
49
50

51
52

53 * *
54
55 88,800 New households forming in Metro Atlanta in the next 3 years* *Based on the Urban Land Institute s 2014 Emerging Trends in Real Estate Numbers

56 250, Population and Housing Growth Metro Atlanta 200, ,000 54,300 shortage 100, ,000 50, ,700 83,000 Population Growth Housing Permits Actual Housing Permits Required Source: Atlanta Regional Commission
57
58

59 Visit SchoolChimp.com and obtain Metro Atlanta high school ratings as well as other valuable real estate information and demographics for each high school district.
60 Gaddis Partners Mission: To help those we serve BE SURE about decisions they make because MAKE SURE they are the best educated party in a real estate transaction. Atlanta s Exclusive Provider of the: SURE Home Selling System & SURE Home Buying System


61 Tune In All Things Real Estate with Cleve Gaddis Fridays at 1 PM
62 Atlanta Will Continue to Grow By 2040 Year Population Employment ,473,846 2,699, ,256,323 4,472,563 Source: Atlanta Regional Commission
63 Where Will Growth Take Place in Metro Atlanta? For 20 Counties NNW NNE ENE WNW The Core is not depicted by a growth bar, but increases by 77,024 persons and 65,562 jobs between 2000 and 2030 ESE WSW SSW SSE Source: Atlanta Regional Commission
64 Metro Atlanta Employment Density percent of 20-county jobs is inside the blue outline 1.32 = median jobs per acre for census tracts Source: Atlanta Regional Commission
65 Feel free to contact me with any questions. Cleve Gaddis Gaddis Partners, RE/MAX Center & USA Management (a boutique residential property management company) Medlock Bridge Road, Suite 119 Johns Creek, GA www. Office:
Metro Atlanta. Cleve s 10-Year Market Projections SF Detached. GoGaddis.com 89,002 83,829 78,958 74,369 70,047 65,976 62,142 58,531 55,129 51,926
 350000 300000 250000 200000 $231,000 $221,760 $228,413 $235,265 $242,323 Metro Atlanta Cleve s 10-Year Market Projections SF Detached $252,016 $262,097 $275,909 $290,450 $305,756 $321,870 Total Single
Carol Tomé CFO and Executive Vice President, Corporate Services
 Carol Tomé CFO and Executive Vice President, Corporate Services Financial Overview December 6, 2017 1 Discussion Overview Fiscal 2017 Financial Guidance Our View of the Economy and State of the U.S. Housing
National Housing Trends
 National Housing Trends 34% America s Choice of Best Long Term Investment 26% 17% 15% 6% Real Estate Stocks / Mutual Funds Gold Savings Accounts / CDs Bonds Gallup 2018 Housing Affordability 197 Index
National Housing Trends
 National Housing Trends 34% America s Choice of Best Long Term Investment 26% 17% 15% 6% Real Estate Stocks / Mutual Funds Gold Savings Accounts / CDs Bonds Gallup 2018 Housing Affordability 197 Index
SFMTA Annual Parking Rates & Policies Survey
 SFMTA Annual Parking Rates & Policies Survey December 2011 2011 Parking Rates and Policies Survey/ 1 Parking rates and policies survey The purpose of the survey is to track changes over time in other cities
National Housing Trends
 National Housing Trends 34% America s Choice of Best Long Term Investment 26% 17% 15% 6% Real Estate Stocks / Mutual Funds Gold Savings Accounts / CDs Bonds Gallup 2018 Home Sales in thousands 2017 2018P
National Housing Trends
 National Housing Trends 34% America s Choice of Best Long Term Investment 26% 17% 15% 6% Real Estate Stocks / Mutual Funds Gold Savings Accounts / CDs Bonds Gallup 2018 Housing Affordability 197 Index
PHILADELPHIA HOUSE PRICE INDICES
 PHILADELPHIA HOUSE PRICE INDICES February 13, 2017 KEVIN C. GILLEN, Ph.D. Kevin.C.Gillen@Drexel.edu Disclaimers and Acknowledgments: The Lindy Institute for Urban Innovation at Drexel University provides
THE MOST INFORMATIVE EVENT COVERING REAL ESTATE INVESTMENTS
 THE MOST INFORMATIVE EVENT COVERING REAL ESTATE INVESTMENTS 2014 U.S. Economic, Capital Markets, and Retail Market Overview and Outlook Retail Trends 2014 U.S. Economic Overview and Outlook Total Employment
PHILADELPHIA HOUSE PRICE INDICES
 PHILADELPHIA HOUSE PRICE INDICES July 20, 2017 KEVIN C. GILLEN, Ph.D. Kevin.C.Gillen@Drexel.edu Disclaimers and Acknowledgments: The Lindy Institute for Urban Innovation at Drexel University provides this
U.S. REITs have rebounded strongly Dow Jones Equity REIT Total Return Index
 U.S. REITs have rebounded strongly Dow Jones Equity REIT Total Return Index Index, 2005 = 100 250 200 150 100 50 0 2005 2006 2007 2008 2009 2010 2011 2012 2013 2014 Sources: Bloomberg, Dow Jones. Affordability
U.S. Economic and Apartment Market Overview and Outlook. July 15, 2014
 2014 U.S. Economic and Apartment Market Overview and Outlook July 15, 2014 U.S. Economic Overview U.S. GDP Growth Persistent Despite 1Q Polar Vortex Annualized Quarterly Percent Change 10% 5% 0% -5% -10%
Investing in Real Estate. The smart choice for today s investor
 Investing in Real Estate The smart choice for today s investor Real Estate is preferred over stocks Real estate out performs stocks http://blog.863katy.com/category/national-housing-news/page/2/ Real Estate
Future of Housing Trends and the Housing Market Demographic Waves in the Region and Future of Housing. Illinois Finance Forum January 25, 2019
 Future of Housing Trends and the Housing Market Demographic Waves in the Region and Future of Housing Illinois Finance Forum January 25, 2019 Millions OUR STATE S POPULATION 2000-2017 13.0 12.4 M 12.9
DFW MULTIFAMILY TRENDS & OBSERVATIONS Q2 2017
 DFW MULTIFAMILY TRENDS & OBSERVATIONS Q2 2017 DALLAS / FORT WORTH The Top US Demand Driven Apartment Market DFW MULTIFAMILY STARTS A HISTORY LESSON!!! The challenge boom or bust perception vs recent history
Real Estate: Investing for the Future. Sponsored By:
 Real Estate: Investing for the Future Sponsored By: Percent Change, Year Ago 6 5 4 3 2 1 Real GDP Growth United States, 2000 Prices 0 1994 1995 1996 1997 1998 1999 2000 2001 2002 2003 2004 U.S. Employment
PHILADELPHIA REGIONAL HOUSE PRICE INDICES
 PHILADELPHIA REGIONAL HOUSE PRICE INDICES August 11, 2015 KEVIN C. GILLEN, Ph.D. Kevin.C.Gillen@Drexel.edu Disclaimers and Acknowledgments: The Lindy Institute for Urban Innovation at Drexel University
Kevin Thorpe Financial Economist & Principal Cassidy Turley
 Kevin Thorpe Financial Economist & Principal Cassidy Turley Economic & Commercial Real Estate Outlook Kevin Thorpe, Chief Economist 2012 Another Year Of Modest Improvement 2006Q1 2006Q3 2007Q1 2007Q3 2008Q1
PHILADELPHIA HOUSE PRICE INDICES
 PHILADELPHIA HOUSE PRICE INDICES April 14, 2014 KEVIN C. GILLEN, Ph.D. gillenk@upenn.edu Disclaimers and Acknowledgments: The Fels Institute of Government at the University of Pennsylvania provides this
Briefing on the State of the State. presented to the. SCAA Schuyler Center for Analysis and Advocacy
 Briefing on the State of the State presented to the SCAA Schuyler Center for Analysis and Advocacy Rae D. Rosen Assistant Vice President Federal Reserve Bank of New York November 16, 2006 Key Points: Economic
Real Estate and Economic Outlook
 Real Estate and Economic Outlook Lawrence Yun, Ph.D. Chief Economist NATIONAL ASSOCIATION OF REALTORS Presentation at Inforum Outlook Conference University of Maryland College Park, MD December 12, 2013
2016 Texas Prosperity Conference The Barnhill Center Brenham, Texas August 26, Dr. James P. Gaines Chief Economist. recenter.tamu.
 2016 Texas Prosperity Conference The Barnhill Center Brenham, Texas August 26, 2016 Dr. James P. Gaines Chief Economist recenter.tamu.edu Housing and People 2 Texas Population 1910-2050 60,000,000 50,000,000
PHILADELPHIA REGIONAL HOUSE PRICE INDICES
 PHILADELPHIA REGIONAL HOUSE PRICE INDICES May 6, 2015 KEVIN C. GILLEN, Ph.D. Kevin.C.Gillen@Drexel.edu Disclaimers and Acknowledgments: The Lindy Institute for Urban Innovation at Drexel University provides
2009 California & Bay Area Real Estate Market Outlook
 2009 California & Bay Area Real Estate Market Outlook November 24, 2008 Fairmont Hotel Leslie Appleton-Young C.A.R. Vice President and Chief Economist California Real Estate Market: 2008 California s Housing
More of the Same; Or now for Something Completely Different?
 More of the Same; Or now for Something Completely Different? C2ER Place cover image here Richard Wobbekind Chief Economist and Associate Dean for Business and Government Relations June 14, 2017 Real GDP
PHILADELPHIA HOUSE PRICE INDICES
 PHILADELPHIA HOUSE PRICE INDICES January 15, 2015 KEVIN C. GILLEN, Ph.D. Kevin.C.Gillen@Drexel.edu Disclaimers and Acknowledgments: The Lindy Institute for Urban Innovation at Drexel University provides
2012 Raleigh-Durham Market Forecast Investment Sales. Jeff Glenn CBRE Wednesday, March 21, 2012
 2012 Raleigh-Durham Market Forecast Investment Sales Jeff Glenn CBRE Wednesday, March 21, 2012 What s Wrong with this Picture? TOPICS I. National Perspective II. Raleigh-Durham Spotlight III. A Closer
Quick Facts. For Week Ending December 8, 2018 Data current as of December 17, % % - 5.0% Metrics by Week
 Charlotte Region Weekly Market Report A RESEARCH TOOL PROVIDED BY THE CHARLOTTE REGIONAL REALTOR ASSOCIATION FOR MORE INFORMATION CONTACT A REALTOR For Week Ending December 8, 2018 Data current as of December
Monthly Indicators - 5.2% % % Activity Overview New Listings Pending Sales. Closed Sales. Days on Market Until Sale. Median Sales Price
 Monthly Indicators 2018 Sales and new listings continue to perform well throughout the state of New York largely due to a booming U.S. economy that has increased listing and purchasing confidence. Housing
Economic Recovery Has Stalled, Recession in the Cards by Year End
 Economic Indicators to Watch for Signs of Recovery Economic Recovery Has Stalled, Recession in the Cards by Year End New York, NY Monday, June 27, 2011 Richard Yamarone Author of The Trader s Guide to
Dr. Richard Wobbekind Executive Director, Business Research Division and Senior Associate Dean for Academic Programs University of Colorado Boulder
 Dr. Richard Wobbekind Executive Director, Business Research Division and Senior Associate Dean for Academic Programs University of Colorado Boulder Member FDIC VectraBank.com Economic Outlook 2015 Richard
Monthly Indicators + 3.2% + 8.6% + 7.7%
 Monthly Indicators 2018 Residential real estate activity comprised of single-family properties, townhomes and condominiums combined. Percent changes are calculated using rounded figures. Activity Snapshot
Economic and Real Estate Outlook
 Economic and Real Estate Outlook By Lawrence Yun, Ph.D. Chief Economist, National Association of REALTORS Presentation at Charlottesville Area Association of REALTORS October 13, 2016 1990 1991 1992 1993
2007 Real Estate Market Forecast. October 18, 2006 Leslie Appleton-Young C.A.R. Vice President and Chief Economist
 2007 Real Estate Market Forecast October 18, 2006 Leslie Appleton-Young C.A.R. Vice President and Chief Economist Overview California Real Estate Market What happened in 2006? Tipping Points/Market Psychology
The U.S. Economy How Serious A Downturn? Nigel Gault Group Managing Director North American Macroeconomic Services
 The U.S. Economy How Serious A Downturn? Nigel Gault Group Managing Director North American Macroeconomic Services Growth Is Cooling; But a Soft Landing Is Likely (Real GDP, annualized rate of growth)
Riverside Rising Economic Outlook for the Region April 2015
 Analysis. Answers Riverside Rising Economic Outlook for the Region April 2015 Beacon Economics, LLC California fact versus fiction Looking back a few years (2009 / 2010) everyone was saying that CA would
Regional Real Estate Trends
 Regional Real Estate Trends Terry L. Clower, Ph.D. Director, Center for Regional Analysis Schar School of Policy and Government George Mason University April 6, 2018 140.0 120.0 100.0 80.0 60.0 40.0 20.0
10 County Conference. Richard Wobbekind. Executive Director Business Research Division & Senior Associate Dean Leeds School of Business
 10 County Conference Richard Wobbekind Executive Director Business Research Division & Senior Associate Dean Leeds School of Business Hmm... (http://myfallsemester.blogspot.com) Real GDP Growth Percent
Sustainable Transportation Planning in the Portland Region
 Sustainable Transportation Planning in the Portland Region Jennifer Dill, Ph.D. Associate Professor School of Urban Studies & Planning jdill@pdx.edu http://web.pdx.edu/~jdill/ Outline Elements of a sustainable
MAINTAINING MOMENTUM:
 MAINTAINING MOMENTUM: 2018 National Economic Update September 12, 2018 noun mo men tum \ mō-ˈmen-təm, mə- \ 1 b : the strength or force that allows something to continue or to grow stronger or faster as
Charlotte Region Monthly Indicators
 Charlotte Region Monthly Indicators A RESEARCH TOOL PROVIDED BY CHARLOTTE REGIONAL REALTOR ASSOCIATION FOR MORE INFORMATION CONTACT A REALTOR 2018 The booming U.S. economy continues to prop up home sales
Hotel InduSTRy Overview What Lies Ahead
 Hotel InduSTRy Overview What Lies Ahead Vail R. Brown Vice President, Global Business Development & Marketing www.hotelnewsnow.com Click on Hotel Data Presentations U.S. In Review Demand Growth Strong.
PHILADELPHIA REGIONAL HOUSE PRICE INDICES
 PHILADELPHIA REGIONAL HOUSE PRICE INDICES September 26, 2018 KEVIN C. GILLEN, Ph.D. Kevin.C.Gillen@Drexel.edu Sponsored By: Disclaimers and Acknowledgments: The Lindy Institute for Urban Innovation at
REQUEST FOR PROPOSALS Race Coordination and Event Timing for 5K Race and Children s Fun Run
 REQUEST FOR PROPOSALS The (Metro Water District) is soliciting proposals from firms to provide race coordination, event registration and official race timing for the 2014 Water Drop Dash 5K race and Children
Alabama Residential Report August 2018
 Alabama Residential Report August 2018 Monthly Indicators Recent Figures Trends Total Residential Sales Current Month August 2018 5,862 Alabama home sales for August 2018 vs. Prior Month July 2018 5,722
recenter.tamu.edu Dr. James P. Gaines Research Economist Real Estate Center at Texas A&M University
 recenter.tamu.edu Dr. James P. Gaines Research Economist Real Estate Center at Texas A&M University Area Market Reports RECENTER.TAMU.EDU Tierra Grande Economic Review Videos, Audios & Presentations Data,
The 2015 Mid-Year Economic Update
 Download slides here at www.mdm.com/slides or email info@mdm.com The 2015 Mid-Year Economic Update Brian Lewandowski and Thomas P. Gale June 18, 2015 Produced by: Sponsored by: Download slides here at
PHILADELPHIA REGIONAL HOUSE PRICE INDICES
 PHILADELPHIA REGIONAL HOUSE PRICE INDICES November 28, KEVIN C. GILLEN, Ph.D. Kevin.C.Gillen@Drexel.edu Sponsored By: Disclaimers and Acknowledgments: The Lindy Institute for Urban Innovation at Drexel
U.S. AUTO INDUSTRY UPDATE Federal Reserve Bank of Chicago Automotive Outlook Symposium. Emily Kolinski Morris Chief Economist May 2015
 U.S. AUTO INDUSTRY UPDATE Federal Reserve Bank of Chicago Automotive Outlook Symposium Emily Kolinski Morris Chief Economist May 2015 NORTH AMERICA INDUSTRY VOLUME SUMMARY 13.1 Total North America* (Mils.)
Partnerships with Purpose: Housing for Texans
 Partnerships with Purpose: Housing for Texans 25th Annual TALHFA Educational Conference October 25-27, 2017 Fort Worth, Texas Dr. James P. Gaines Chief Economist 2 Outlook Since November 10, 2017: Rising
Section 1: Introduction
 Date: October 18, 2016 Regarding: Vehicle Thefts with Keys in the United States - (Public Dissemination) Prepared By: Olivia Ortiz, Strategic Analyst and Josh Cahill, Strategic Analyst Section 1: Introduction
Housing Market Update Greater Moncton. Housing market intelligence you can count on
 Housing Market Update Greater Moncton Housing market intelligence you can count on Housing Market Drivers Multi-Residential/Rental Market New Home Market Single Family Homes Resale Market 2013/2014 Outlook
NC Demographic Trends Through 2035
 NC Demographic Trends Through 2035 House Select Committee on Strategic Transportation Planning and Long Term Funding Solutions February 22, 2016 Rebecca Tippett, University of North Carolina July 1 Population
Frederick Ross. Real Estate Market Overview. Presented by: Kevin Thomas Senior Vice President. Frederick Ross. Company.
 Frederick Ross Real Estate Market Overview Presented by: Kevin Thomas Senior Vice President Frederick Ross Company January 2003 Business Consumers Source: BEA, Ross Research Housing...Bust or Rust? 2001
NC Demographic Trends Through 2035
 NC Demographic Trends Through 2035 Joint Appropriation Committee on Transportation February 21, 2017 Rebecca Tippett, PhD Director, Carolina Demography July 1 Population (Millions) North Carolina s Total
Dr. James P. Gaines Research Economist recenter.tamu.edu
 Texas Uncertain Economy in a World of Uncertain Oil Prices Dr. James P. Gaines Research Economist recenter.tamu.edu National Economic Recovery still Going 2 U.S. Outlook Expected GDP growth still modest:
Philadelphia Housing s Recovery Becomes More Equitable in Q3 Sales surge citywide; house value appreciation strongest in low-priced neighborhoods.
 Philadelphia Housing s Recovery Becomes More Equitable in Q3 Sales surge citywide; house value appreciation strongest in low-priced neighborhoods. October 13, 2014: After a brisk spring which saw widespread
ORLANDO MSA MARKET OVERVIEW LAST UPDATED: MAY 2018
 ORLANDO MSA MARKET OVERVIEW LAST UPDATED: MAY 2018 Orlando MSA Market Overview Labor Market Payroll Employment Commercial Real Estate Residential Real Estate Consumer Spending Visitor Industry Labor Market
Friday, May 22, NAR Convention
 NAR Convention 5-14-09 NAR Convention 5-14-09 Lawrence Yun, NAR Chief Economist NAR Marketing Tips!Provide Market Data to buyers!forbes Buyer Survey: Now good time to buy home!best Banner Ads: 1. Has Market
Texas Economic Outlook: Recovery in 2010 Keith Phillips Federal Reserve Bank of Dallas San Antonio Office
 Texas Economic Outlook: Recovery in 2010 Keith Phillips Federal Reserve Bank of Dallas San Antonio Office The views expressed in this presentation are strictly those of the author and do not necessarily
Monthly Indicators - 6.4% + 8.0% - 5.3% Market Overview New Listings Pending Sales. Closed Sales. Days on Market Until Sale. Median Sales Price
 Monthly Indicators 2018 The booming U.S. economy continues to prop up home sales and new listings in much of the nation, although housing affordability remains a concern. Historically, housing is still
Cement & Construction Outlook
 Cement & Construction Outlook Minnesota Concrete Council November 17, 2011 Dave Zwicke, PCA Analytics Manager, Sr. Economist Bottom Line Economy in a slow growth period characterized by tepid job gains.
RED DEER HOUSING MARKET OUTLOOK
 RED DEER - JUNE 3, 2009 RED DEER HOUSING MARKET OUTLOOK Regine durand Market Analyst - CMHC Prairie and Territories 50,000 48,000 46,000 44,000 42,000 40,000 38,000 36,000 34,000 32,000 30,000 28,000 Red
THE BLUE SKY REPORT A KERRIGAN QUARTERLY. Third Quarter 2018 December 2018
 THE BLUE SKY REPORT A KERRIGAN QUARTERLY Third Quarter 2018 December 2018 Contact Erin Kerrigan: (949) 439-6768 erin@kerriganadvisors.com Contact Ryan Kerrigan: (949) 728-8849 ryan@kerriganadvisors.com
RISI Housing Report An Update on the Housing Market
 RISI Housing Report An Update on the Housing Market North American Conference October 2018 Jennifer Coskren Senior Economist Agenda Current housing demand and demographic conditions Supply and impediments
President and Chief Executive Officer Federal Reserve Bank of New York Washington and Lee University H. Parker Willis Lecture in Political Economics
 The U.S. Economic Outlook Chartspresented by WilliamC Dudley Charts presented by William C. Dudley President and Chief Executive Officer Federal Reserve Bank of New York Washington and Lee University H.
Monthly Indicators - 9.1% + 4.5% + 8.0% Activity Overview New Listings. Closed Sales Median Sales Price
 Monthly Indicators 2018 Home prices were consistently up again in most markets in 2018 but at reduced levels compared to recent years. High demand for few homes for sale fueled price increases, but evidence
What s Ahead for The Colorado Economy?
 What s Ahead for The Colorado Economy? Colorado Counties Inc. Place cover image here Richard Wobbekind Senior Economist and Associate Dean for Business and Government Relations November 28, 2017 Real GDP
Supplemental Material. Projected Temperature-Related Deaths in Ten Large U.S. Metropolitan Areas Under Different Climate Change Scenarios
 Supplemental Material Projected Temperature-Related Deaths in Ten Large U.S. Metropolitan Areas Under Different Climate Change Scenarios Kate R. Weinberger, Leah Haykin, Melissa N. Eliot, Joel D. Schwartz,
Beyond Bullet Points: Statistics, Trends and Analysis
 Beyond Bullet Points: Statistics, Trends and Analysis Vail R. Brown VP, Global Business Development & Marketing Vail@str.com @vail_str 5 THINGS TO KNOW www.hotelnewsnow.com Click on Data Presentations
Appendix T 1: Additional Supporting Data
 Appendix T 1: Additional Supporting Data Project Delivery Delays with the implementation of the 2000 TIP became apparent early in the decade. In response to direction among policy officials, ARC began
Arnold Hinojosa
 Policy Analysis of the Mass Transit Challenges Facing Rapidly Growing Southern and Western Cities and How These Challenges Can Be Addressed Using the Model Set by Chicago Arnold Hinojosa ahinojosa@kentlaw.edu
Demographic Change in North Carolina
 Demographic Change in North Carolina 5 Trends to Watch North Carolina Aggregates Association June 29, 2017 Rebecca Tippett, PhD Director, Carolina Demography July 1 Population (Millions) North Carolina
Annual Report on the Charlotte Region Housing Market RESIDENTIAL REAL ESTATE ACTIVITY FROM THE CHARLOTTE REGIONAL REALTOR ASSOCIATION
 Annual Report on the Charlotte Region Housing Market RESIDENTIAL REAL ESTATE ACTIVITY FROM THE CHARLOTTE REGIONAL REALTOR ASSOCIATION Annual Report on the Charlotte Region Housing Market RESIDENTIAL REAL
PHILADELPHIA REGIONAL HOUSE PRICE INDICES
 PHILADELPHIA REGIONAL HOUSE PRICE INDICES June 17, 2016 KEVIN C. GILLEN, Ph.D. Kevin.C.Gillen@Drexel.edu Disclaimers and Acknowledgments: The Lindy Institute for Urban Innovation at Drexel University provides
Percent of Brokerages by Size
 Percent of Brokerages by Size 80% 70% 60% 58.4% 50% 40% 30% 28.7% 20% 10% 0% #: +23.6% -7.3% +9.9% 0.1% 0.1% 0.2% 0.5% 0.6% 1.8% 2.6% 1,000+ 500-999 300-499 100-299 50-99 20-49 10-19 5-9 2-4 Single Brokers
Charlotte Region Monthly Indicators
 Charlotte Region Monthly Indicators A RESEARCH TOOL PROVIDED BY CHARLOTTE REGIONAL REALTOR ASSOCIATION FOR MORE INFORMATION CONTACT A REALTOR 2018 If the last few months are an indication of the temperature
Federal Reserve Bank of Dallas, FIRM (Financial Institution Relationship Management)
") The Economic Roller Coaster: Where Have We Been? And Where Are We Going? Thomas F. Siems, Ph.D. Senior Economist and Director of Economic Outreach Federal Reserve Bank of Dallas Economic Summit Dallas
The Economic Roller Coaster: Where Have We Been? And Where Are We Going? Thomas F. Siems, Ph.D. Senior Economist and Director of Economic Outreach Federal Reserve Bank of Dallas Economic Summit Dallas
Demographic Characteristics and Trends of Bexar County and San Antonio, TX
 Demographic Characteristics and Trends of Bexar County and San Antonio, TX Leadership San Antonio Understand Infrastructure. Prepare for Growth. May 2, 2012 San Antonio, TX Select Growing States, 2000-2010
Will 2016 Be the Last Hurrah for Commercial Real Estate? Presented By: John Chang First Vice-President Marcus & Millichap Research Services
 Will 2016 Be the Last Hurrah for Commercial Real Estate? Presented By: John Chang First Vice-President Marcus & Millichap Research Services Rising Uncertainty Creating Headwinds for Commercial Real Estate
Quick Facts. For Week Ending February 16, 2019 Data current as of February 25, % % - 0.3% Metrics by Week
 Charlotte Region Weekly Market Report A RESEARCH TOOL PROVIDED BY THE CHARLOTTE REGIONAL REALTOR ASSOCIATION FOR MORE INFORMATION CONTACT A REALTOR For Week Ending February 16, 2019 Data current as of
PHILADELPHIA CONDO PRICE INDICES
 PHILADELPHIA CONDO PRICE INDICES February 26, 2018 KEVIN C. GILLEN, Ph.D. Gillen@AllanDomb.com Disclaimers and Acknowledgments: Alland Domb Real Estate supports the production of this report and it free
Monthly Indicators + 1.7% + 7.1% % Market Overview New Listings Pending Sales. Closed Sales. Days on Market Until Sale. Median Sales Price
 Monthly Indicators 2018 Home prices were consistently up again in most markets in 2018 but at reduced levels compared to recent years. High demand for few homes for sale fueled price increases, but evidence
Charlotte Region Monthly Indicators
 Charlotte Region Monthly Indicators A RESEARCH TOOL PROVIDED BY CHARLOTTE REGIONAL REALTOR ASSOCIATION FOR MORE INFORMATION CONTACT A REALTOR 2018 Home prices were consistently up again in most markets
Ranking Walkable Urbanism in America s Largest Metros
 Ranking Walkable Urbanism in America s Largest Metros The Largest 30 Metros in the United States SHARE OF U.S. POPULATION SHARE OF U.S. GDP 54% 46% 42% 58% LARGEST 30 METROS REST OF U.S. The Old Dichotomy
Zions Bank Municipal Conference Economic Overview August 13, 2015
 Zions Bank Municipal Conference Economic Overview August 13, 2015 Overview National Economic Conditions Utah Economic Conditions Utah is One of the Fastest Growing CA 0.9% States in the Country Percent
Asheville Region Monthly Indicators
 Asheville Region Monthly Indicators A RESEARCH TOOL PROVIDED BY CHARLOTTE REGIONAL REALTOR ASSOCIATION FOR MORE INFORMATION CONTACT A REALTOR 2018 If the last few months are an indication of the temperature
Golf Participation in the U.S Edition
 Golf Participation in the U.S. 2016 Edition Golf Participation in the U.S. 2016 Edition Published by National Golf Foundation 501 N Highway A1A Jupiter, Florida 33477 (561) 744-6006 www.ngf.org April 2016
Charlotte Region Monthly Indicators
 Charlotte Region Monthly Indicators A RESEARCH TOOL PROVIDED BY CHARLOTTE REGIONAL REALTOR ASSOCIATION FOR MORE INFORMATION CONTACT A REALTOR 2018 Some economy observers are pointing to 2018 as the final
Kentucky s Surface Transportation System
 Kentucky s Surface Transportation System ROAD AND BRIDGE CONDITIONS, TRAFFIC SAFETY, TRAVEL TRENDS, AND NEEDS MARCH 2018 PREPARED BY WWW.TRIPNET.ORG Founded in 1971, TRIP of Washington, DC, is a nonprofit
Canadian Teleconference: Can the Canadian Economy Survive the Turmoil in the United States?
 Canadian Teleconference: Can the Canadian Economy Survive the Turmoil in the United States? Nigel Gault Chief U.S. Economist Dale Orr Canadian Macroeconomic Services Copyright 2008 Global Insight, Inc.
Walkability. The Pathway to Atlanta s Future Growth April 19, 2017
 Walkability The Pathway to Atlanta s Future Growth April 19, 2017 1 Walkability The Pathway to Atlanta s Future Growth This report was prepared by the ULI Atlanta s Livable Communities Council Working
Managed Lanes: The Fitch Approach. Saavan Gatfield, Senior Director
 Managed Lanes: The Fitch Approach Saavan Gatfield, Senior Director HOT Lanes Getting Hotter Priced Managed Lanes Across the United States As of 4/27/14 Sources: HNTB Corporation; GAO analysis of USDOT,
Iowa Land Values. Wendong Zhang Assistant Professor of Economics and Extension Economist
 Iowa Land Values Wendong Zhang Assistant Professor of Economics and Extension Economist wdzhang@iastate.edu 515-294-2536 2017 U.S. Bank Ag Summit, Ames, IA, January 10 th, 2017 The new Mike Duffy 30 29
INTERSECTIONS. Metro Denver 2016 Economic Forecast January 2016
 INTERSECTIONS Metro Denver 2016 Economic Forecast January 2016 Employment Intersections Employment growth and Great Recession recovery Industry clusters Average annual salary Photo Credit: istockphoto
Public Transport and Development: Making It Work
 Public Transport and Development: Making It Work Robert T. Dunphy Urban Land Institute World Bank Transport Forum 2006 March 28, 2006 Transportation Development Disconnect Now Few Then places w/o car Many
Houston and Tomball Economic and. Housing Outlook. recenter.tamu.edu. Dr. James P. Gaines Research Economist
 Houston and Tomball Economic and Dr. James P. Gaines Research Economist Housing Outlook recenter.tamu.edu THE CURRENT SITUATION The Future Just Ain t What It Used to Be! Yogi Berra National Economic Recovery
Iowa Farmland Market Update: What s Ahead?
 Iowa Farmland Market Update: What s Ahead? Wendong Zhang Assistant Professor of Economics and Extension Economist wdzhang@iastate.edu 515-294-2536 Ag Credit School, June 14 th, 2017 The new Mike Duffy
The Outlook for Real Estate and Residential Construction. Patrick M. Barkey, Director Bureau of Business and Economic Research University of Montana
 The Outlook for Real Estate and Residential Construction Patrick M. Barkey, Director Bureau of Business and Economic Research University of Montana Montana s Real Estate Performance: Getting Back to Boom
UNITED 2026 BID: TRAINING SITE AGREEMENT. Park Board Committee Meeting Monday, February 19, 2018
 UNITED 2026 BID: TRAINING SITE AGREEMENT Park Board Committee Meeting Monday, February 19, 2018 Purpose Present and review Vancouver s participation in the United 2026 bid process Seek Board approval to