Warm-Up: Create a Boxplot.
|
|
|
- Godfrey Palmer
- 6 years ago
- Views:
Transcription

1
2 Warm-Up: Create a Boxplot. 2
3

4
5 Warm - UP Find the mean. 3. Find the standard deviation for the set { 54, 59, 35, 41, 22}
6 Warm - UP
7 How many hours do you spend watching TV or surfing the net each day ( none educational)?
8 Boxplot The number of hysterectomies performed by a sample of 15 male doctors are arranged in order. 20,25,25,27,28,31,33, 34, 36,37,44, 50,59, 85, 86
9 Minimum Lower Upper Quartile Quartile Median Maximum Box and Whisker Plots
10 Student will be able to arrange data from a given data set using the boxplot.

11 Connection A box-and-whisker plot can be useful for handling many data values. They allow people to explore data and to draw informal conclusions when two or more variables are present. It shows only certain statistics rather than all the data. Box and whisker plots consists of the median, the quartiles, and the smallest and greatest values in the distribution.
12 Vocabulary Interquartile Range abbreviated IQR, is defined as the distance between the first and third quartiles. The five-number summary of a data set consists of the smallest observation, the first quartile, the median, the third quartile, and the largest observation, written in order from smallest to largest in the symbols, the five summary is Minimum Q 1 M Q 3 Maximum Modified Boxplot Plots outliers as isolated points. The first, highest none outlier point is used for the maximum and minimum. Outlier Data point that falls more than 1.5 X IQR below Q 1 or above Q 3. Quartiles marks out the middle of half of the data. The first quartile is onequarter of the way up the list. The third quartile is three-quarters of the way up the list. The second quartile is the median, which is larger than 50% of the observations. The first quartile is larger than 25% of the list. The third quartile is larger than 75% of the list.
13 Calculating Quartiles 1. Arrange the observations in increasing order and locate the median of M in the ordered list of observations. 2. The first Q1 is the median of the observations whose position in the ordered list is the left of the location of the overall median. 3. The third quartile Q3 is the median of the observation whose position in the ordered list is to the right of the location of the overall median.
14 How to make a Box and Whisker Plot 1. Put your set of date in increasing numerical order (if it isn t already). Example: 100, 27, 34, 54, 59, 18, 52, 61, 78, 68, 82, 87, 85, 93, 91. Should now look like this 18, 27, 34, 52, 54, 59, 61, 68, 78, 82, 85, 87, 91, 93, 100.
15 Step 2 - Median 2. Find the median of your set of data *Remember the median is the value exactly in the middle of an ordered set of numbers* 18, 27, 34, 52, 54, 59, 61, 68, 78, 82, 85, 87, 91, 93, 100. Q: What would you do it you had an even set of numbers?
16 Step 3 Lower Quartile 3. Next, we consider only the values to the left of the median 18, 27, 34, 52, 54, 59, 61, 68, 78, 82, 85, 87, 91, 93, 100. We find the median of those numbers 18, 27, 34, 52, 54, 59, 61 Q: This number is call the lower quartile. Can you guess why?
17 Step 4 Upper Quartile 4. Next, we consider only the values to the right of the median 18, 27, 34, 52, 54, 59, 61, 68, 78, 82, 85, 87, 91, 93, 100. We find the median of those numbers 78, 82, 85, 87, 91, 93, 100. Q: This number is call the upper quartile. Can you guess why?
18 Step 5 Highest/Lowest Values 5. Now indicate your lowest and highest values 18, 27, 34, 52, 54, 59, 61, 68, 78, 82, 85, 87, 91, 93, 100.
19 Step 6 - Drawing 6. Now we are ready to begin to draw our graph. 18, 27, 34, 52, 54, 59, 61, 68, 78, 82, 85, 87, 91, 93, 100. Plot the lowest value, lower quartile, median, upper quartile, and the highest value on a number line.
20 Put a line through the Lower Quartile, Median, and Upper Quartile. Then Put a box around those lines
21 Lastly draw a line from your extreme values to the box There is your Box and Whisker Plot
22 Group Practice
23
24 Time for a challenge activity 1/interpret-box-and-whisker-plots
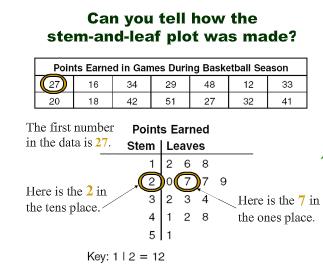
25 Stem-Leaf Plot
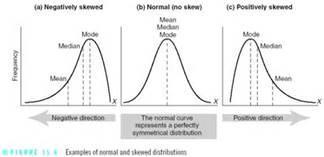
26 Background Individuals are objects described by a set of data. Individuals may be people, but they may also be animals or things. A variable is an characteristic of an individual. A variable can be different values for different individuals. The distribution of a variable tells us what values the variables takes and how often it takes the values. Skewed to the right a distribution is skewed to the right if the right side of the historgram (containing the upper half of the observations) extends much farther out than the left side ( containing the lower half of the observations) Skewed to the left - A distribution is skewed to the left if the left side of the histogram extends farther out than the right side Symmetric A distribution is symmetric if the right and left sides of the histogram are approximately mirror images of each other. Copyright 2000 by Monica Yuskaitis
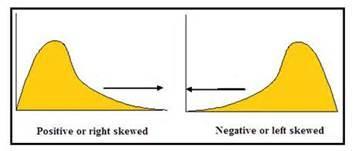
27 Skewed Histograms
28 Skewed Historgrams/Distrubitions
29
30
31
32
33
34
35 Homework

36 36

37 Warm-UP 37
38 38
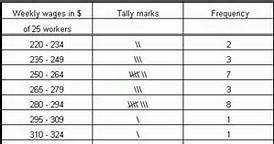
39 Rubric: Problem Completion - 5 points Presentation - 5 points Data set 3-Minute Presentations Categories for grouping data ( Interval or Range) Range of data set. Width The difference between the cutpoints of a class. Height of Bars/ Frequency 39
40 The Dot Plot What is it? How to Draw it Bet you ve never seen a graph like this one before...
41 What is a Dot Plot? A dot plot - A dot plot is a graph that shows the distribution of a quantitative variable above a number line with small periods, dots, circles or x s. It plots a quantitative variable against a quantitative variable. Axes on a dot plot.- A dot plot only has an x- axis. The y-axis is never drawn Advantage of a dot plot - Moderate amounts of quantitative data can be quickly visualized 41
42 What is a Dot Plot? 2 Variables on a dot plot: x-axis variable is quantitative and identified y-axis variable is implied since the y-axis is never drawn. y-axis variable is the count and so is normally discrete quantitative 42
43 Making a Dot Plot I want to know more about my students who take Intro Stats so I ve decided to take a survey and make a dot plot of the results I d like to find out about the pets they have in their household. The question then becomes: How many pets are in your household? 43
44 Making a Dot Plot from Live Data Frequency Frequency 0 pets 9 pets 1 pet 10 pets 2 pets 11 pets 3 pets 12 pets 4 pets 13 pets 5 pets 14 pets 6 pets 15 pets 7 pets 16 pets 8 pets 17 pets 44
45 Dot Plot Example Number of Pets Per Household for Ms. H's Intro Stat Classes Source: In Class Survey x-axis: # of Pets 45
46 Freq Table Example 4 Classes Combined Fre- Relative Class quency Freq 0 pets % 1 pet % 2 pets % 3 pets 8 6.0% 4 pets % 5 pets 7 5.2% 6 pets 2 1.5% 7 pets 3 2.2% 8 pets 2 1.5% 9 pets 1 0.7% 10 pets 1 0.7% 11 pets 3 2.2% 12 pets 0 0.0% 13 pets 1 0.7% 14 pets 0 0.0% 15 pets 0 0.0% 16 pets 0 0.0% 17 pets 0 0.0% 18 pets 0 0.0% 19 pets 0 0.0% 20 pets 0 0.0% 21 pets 0 0.0% 22 pets 0 0.0% 23 pets 0 0.0% 24 pets 0 0.0% 25 pets 0 0.0% 26 pets 0 0.0% % % % % Mean = 2.52 pets Median = 2 pets Mode = 0 pets (37x) Range = 30 pets Spread = 0-30 pets n = 134 students Totals 31 classes % 46
47 Dot Plot Example 4 Classes Combined. : : Number of Pets Per Household :. for Ms. H's Intro Stat Classes : : Oct 6, 2010 : :. : : : : : : : : : : : : : : : : : : : : : : : : : : : : : : : : :. : : : : : : : : : : : :.. : : : : : : : : :.. : Source: In Class Survey x-axis: # of Pets 47
48 Dot Plot: Statistical Vocabulary Background Spread (also called Variability) Range The spread of data in statistics is the smallest value in a data set and the largest value It is always expressed as 2 numbers Prefer to write smallest then largest number Units are important The range of data in statistics is the difference between the smallest value and the largest value Take the spread and subtract the two numbers: large small Units are important 48
49 Dot Plot: Statistical Vocabulary Background One Measure of Center Mode One measure of the center of a data distribution is the median, the place where the data tends to be ½ above and ½ below. Units are important The mode of data is a place or places with the largest number of data with the same value. Units are important. 49
50 Shape Dot Plot: How to Describe It The shape of a data distribution possibilities: 1) Symmetry Symmetric Also Fairly Symmetrical Skewed Left (negatively skewed) Skewed Right (positively skewed) 2) Peaks Single Peaked (unimodal) Double Peaked (bimodal) Multi Peaked (multimodal) NOTE: Data have modes, dot plots have peaks 50
51 Student Scores in Anderson s Cr Writing Name Gender 3rd Per Grade ID Test #10 Teacher No % 1 Benson, Paul M Kling Bishop, Sally F Smith Chan, Alex M Yale Chaney, Brenda F Fernando Darosa, Rick M Iijima Dovsten, Stan M Browne Dring, Pamela F Nikola Gomez, Tom M Lunceford Hart, Ron M Tyler Ho, DJ M Cedric Hughes, Kim F Dorman Kennedy, Fred M Ho Khangura, Sam M Horvath Lace, Bob M Kwok Lamar, Candy F Falck Lunda, Alice F Edwards Nester, Lucy F Ho Pomodor, Gorde M Horvath Prado, Cindy F Kang Rice, Dale M Duerr
52 Student Scores in Anderson s Cr Writing Anderson's English Class Test 101 Scores : :. :.... : Source: Teacher Records x-axis: Score in pts. 52
53 % of Population Over 65 1 Alabama Montana 13 2 Alaska 5 27 Nebraska 14 3 Arizona Nevada 11 4 Arkansas N Hampshire 12 5 California N Jersey 14 6 Colorado N Mexico 11 7 Connecticut N York 13 8 Delaware N Carolina 13 9 Florida N Dakota Georgia Ohio Hawaii Oklahoma Idaho Oregon Illinois Penn Indiana R Island Iowa S Carolina Kansas S Dakota Kentucky Tennessee Louisiana Texas Maine Utah 9 20 Maryland Vermont Mass Virginia Michigan Washington Minnesota W Virginia Mississippi Wisconsin Missouri Wyoming 11 53
54 Population over 65 Data Sorted by % 1 Alaska 5 26 Indiana 13 2 Utah 9 27 Kentucky 13 3 Colorado Alabama 13 4 Georgia Montana 13 5 Texas Arizona 13 6 N Mexico Wisconsin 13 7 California N York 13 8 Virginia Ohio 13 9 Wyoming Oklahoma Maryland Oregon Idaho Kansas Louisiana N Jersey Nevada Maine Washington Missouri N Hampshire Nebraska S Carolina Mass Vermont Connecticut Mississippi S Dakota Michigan Arkansas Minnesota N Dakota Illinois Iowa N Carolina W Virginia Tennessee R Island Delaware Penn Hawaii Florida 19 54
55 Make Dot Plot of State Population Data Percent of Population over 65 years of Age in the 50 States. : : : :. : : : : : :. : : : : :.. : : : : : : : Source: Statistical Abstract of the US x-axis: Number in % to nearest integer 55
56 Dot Plot: How to Describe It More on Shape Symmetric When the left & right sides of a distribution are mirror images of one another Fairly Symmetric When the left and right sides of a distribution are almost mirror images of one another, but there are small exceptions. Skewed Left (negatively skewed) If a distribution extends much farther out to the left. The direction of skewness is on the side of the longer tail, in this case LEFT. Skewed Right (positively skewed) If a distribution extends much farther out to the right. The direction of skewness is on the side of the longer tail, in this case RIGHT. 56
57 Dot Plot: What it Looks Like Shape: Symmetry Symmetric 57
58 Dot Plot: What it Looks Like More on Shape: Non Symmetric Skewed Left (negatively skewed) tail Left Skew Skewed Right (positively skewed) Right Skew tail 58
59 Goals by US Women s Soccer Number of Goals Scored by US Women's Soccer Team in 34 games in Source: US Soccer Assn. 59
60 Goals by US Women s Soccer Ordered Ascending
61 Dot Plot of Goals by US Women s Soccer Goals per Game by US Women's Soccer Team in 2004 : : : :. : : : : :. : : : : : : Source: US Women's Soccer Assn x-axis: # of goals per game 61
62 Living in Poverty East of the Mississippi Percent of State Residents Living in Poverty East of Mississippi River, 1999 Source: Stat Abs of US Alabama 13 Maryland 6 Penn 8 Connecticut 6 Mass 7 Rhode Is 9 Delaware 7 Michigan 7 S Caroliina 11 Florida 9 Mississippi 16 Tennessee 10 Georgia 10 New Hamp 4 Vermont 6 Illinois 8 New Jersey 6 Virginia 7 Indiana 7 NY 12 W Virginia 14 Kentucky 13 N Carolina 9 Wisconsin 6 Maine 8 Ohio 8 62
63 Living in Poverty East of the Mississippi Ordered Ascending New Hamp 4 Ohio 8 Wisconsin 6 Penn 8 Maryland 6 Rhode Is 9 Connecticu 6 Florida 9 New Jersey 6 N Carolina 9 Vermont 6 Georgia 10 Delaware 7 Tennessee 10 Indiana 7 S Caroliina 11 Mass 7 NY 12 Virginia 7 Alabama 13 Michigan 7 Kentucky 13 Illinois 8 W Virginia 14 Maine 8 Mississippi 16 63
64 Living in Poverty East of the Mississippi % of State Residents Living in Poverty East of.. the Mississippi River in 1999 : : :.. : : : : :.. : Source: Statistical Abstract of the US x-axis: Values to the nearest % 64
65 Dot Plot: Mean & Median Essentials Skew on a dot plot in relation to mean and median You ve drawn the line that connects the dot plot points on the top of the distribution. The line clearly shows right or left skew. If you have right skew, the mean will be to the right of (greater than) the median, as the mean follows the tail of the distribution. median mean Right Skew tail 65
66 Dot Plot: Mean & Median Essentials Skew on a dot plot in relation to mean and median If you have left skew, the mean will be to the left of (less than) the median, as the mean follows the tail of the distribution. mean median tail Left Skew 66
67 Dot Plot: Describing Peaks Peaks Unimodal Unimodal Bimodal Bimodal Multimodal (3 or more peaks) Trimodal or Multimodal 67
68 TI83 and Sort Ascending How to Sort Data in Ascending Order Enter all values in a list at STAT EDIT Exit to Home Screen using 2 nd MODE Hit STAT key. Go to #2 SORT A(. Hit ENTER Type 2 nd 1 (if the data is in List 1). Hit Enter Done appears Check your data in List 1. It should be sorted. Use your eyes to find the range & spread from the sorted list. 68
69 Calculator 69
70 Dot Plot: TI Essentials Finding Mean and Median Enter your data as a list in STAT EDIT Exit to home screen 2 nd Mode Go to 2 nd STAT. Right Arrow to MATH #3 is Mean; hit Enter; type 2 nd and list #; Enter #4 is Median; hit Enter; type 2 nd and list #; Enter Calculator does not give Mode. You need your eyes for that 70
71 Guided Practice 71
72 Glucose Blood Levels Glucose Blood Levels for Adult Women
73 Glucose Blood Levels GLUCOSE BLOOD LEVELS in mg/ml for 40 Women at Sutter Health in March 2009 : : :... : :.. :. :.. : : : :. : : Source: Sutter Health Clinic x-axis: glucose level in mg/ml 73
74 WBNA EAST Free Throws Data in Ascending Order Women's National Basketball Assn Free Throw Percentages for 1998 from WNBA
75 WBNA Free Throws Dot Plot WNBA EASTERN CONFERENCE FREE THROW PERCENTAGES :. :. :... :... :.. :. : : :.. : :. :... :. :. : Source: WNBA x-axis: %age of converted free throws per game 75
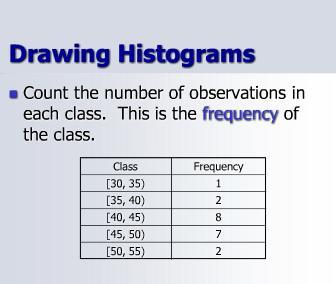
76 Dot Plot: How to Describe It Unusual Features. Possibilities include-- Potential Outliers: any data value that falls out of the pattern of the rest of the distribution. A potential outlier will lie at either extreme of the data when it is written in order. (We will learn how to calculate actual outliers later. For now, we will call these points potential outliers) Clusters: isolated groups of values. Clusters begin when frequency >1 and end before frequency returns to 1 or zero. Gaps: large spaces between values. Write gap values from beginning empty space to end empty space. A gap of one number is NOT a gap. 76
77 Fuel Consumption Data Fuel Consumption for 2009 Passenger Fords
78 Fuel Consumption Dot Plot Fuel Consumption for 2009 Passenger Fords. : :.. : : :... : :.. : :. :.. :. : : : Source: Consumer Reports x-axis: miles per gallon 78
79 IXL 79

80 Saying

81 Warm-Up: Create a boxplot for the given data set.
82 Warm-up , 132, 136, 142, 145, 146, 149, 150, 151, 155, 158, 158, 161, 161, 165,165, 167, 170, 170, 172, 173, 173, 175, 175, 178,178,182, 182, 185, 187, 187, 188, 191, 209, 214, 218,
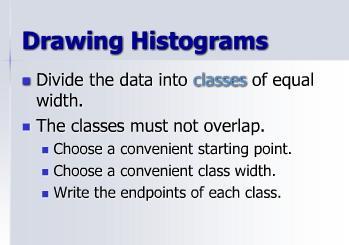
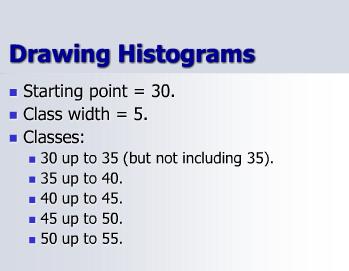
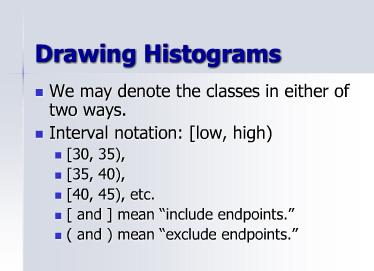
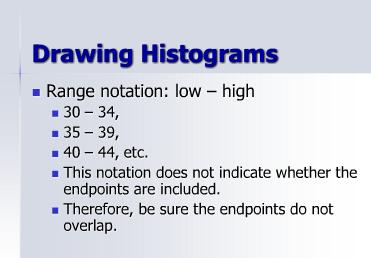
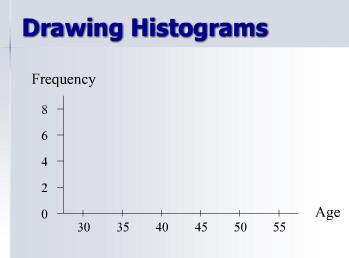
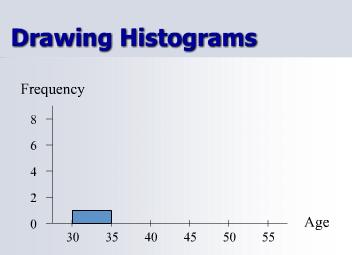
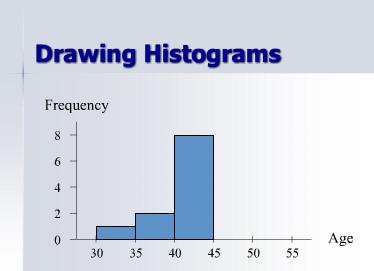
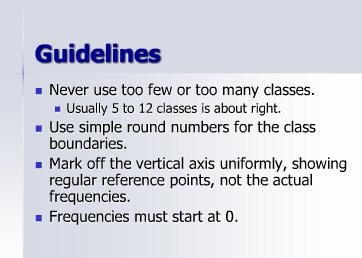
83 Classes - Categories for grouping data Frequency Distribution A listing of all classes and their frequencies Frequency ( or count) The number of observations that fall into a particular class is called the frequency (or count) of that class. Relative Frequency The percentage of a class, expressed as a decimal is called the relative frequency of the class. Lower Cutpoint The smallest value that go in a class. Upper Cutpoint Highest value that can go in a class Midpoint the middle of a class, found by averaging its cutpoints. Width The difference between the cutpoints of a class. Mark The Mark of a class is the average of a class is the average of its lower and upper limits.
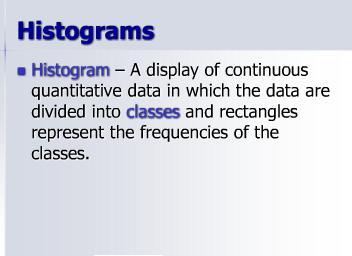
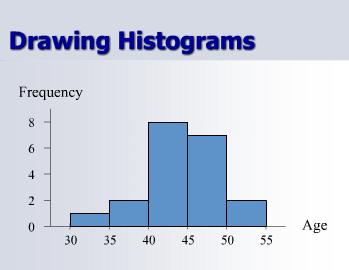
84 Background Frequency histogram A graph that displays the classes on the horizontal axis and the frequencies of the classes on the vertical axis. The frequency of each class is represented by a vertical bar whose height is equal to the frequency. Relative Frequency histogram A graph that displays the classes on the horizontal axis and relative frequencies of the classes on the vertical axis. The relative frequency of each class is represented by a vertical bar whose height is equal to the relative frequency of the class.

85 Days to - Maturity
86
87 Data Set: 32, 35, 39, 41, 41, 43, 43, 42, 40, 40, 43,45,46,47,48,46, 49,49, 51, 51

88 Data Set: 32, 35, 39, 41, 41, 43, 43, 42, 40, 40, 43,45,46,47,48,46, 49,49, 51,
89
90
91
92
93
94
95
96
97
98
99
100 The following is a list of scores for Mr. Scott s math class. Use a histogram to represent the data. Use 10 units to categorize the data. 40, 41,42,54, 63, 66, 61, 69, 71,71,71, 75,78,78, 90,99,95,95,95,98,92, 92, 100,100,100

101 The following is a list of scores for Mr. Scott s math class. Use a histogram to represent the data. Use 10 units to categorize the data. 40, 41,42,54, 63, 66, 61, 69, 71,71,71, 75,78,78, 90,99,95,95,95,98,92, 92, 100,100,100
102 Guided Practice
103 Student Practice
104 Objective
105 Connections
106 Intro and background
107 Content
108 Guided Practice
109 Individual Practice
110 Guided Practice
111 Summary
112 Homework

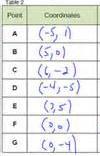
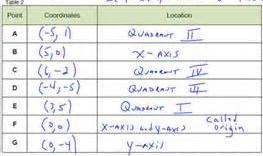
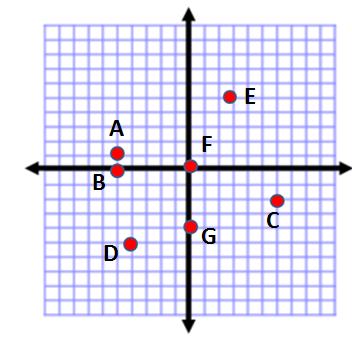
113 B A D F G E C
114
TABLE C: STATE MANDATES AND FUNDING LEVELS
 TABLE C: STATE MANDATES AND FUNDING LEVELS Information was collected from the 2012-2013 State of the States in Gifted Education report. Empty cells indicate no response to the question Hatched cells indicate
HANDICAP ACTIVE AND INACTIVE SEASON SCHEDULE
 HANDICAP ACTIVE AND INACTIVE SEASON SCHEDULE The authorized golf association having jurisdiction in an area is responsible for declaring the duration of any inactive season. Any non-member club of an authorized
2011 National Survey of Fishing, Hunting, and Wildlife-Associated Recreation
 U.S. Fish & Wildlife Service 2011 National Survey of Fishing, Hunting, and Wildlife-Associated Recreation State Overview Issued September 2012 Preliminary Estimates 2 2011 National Survey of Fishing, Hunting,
Agricultural Weather Assessments World Agricultural Outlook Board
 Texas (8) Missouri (7) South Dakota (6) Kansas () Nebraska () North Dakota () Oklahoma () Kentucky (4) Montana (4) California (3) Minnesota (3) New York (3) Pennsylvania (3) Tennessee (3) Wisconsin (3)
Agricultural Weather Assessments World Agricultural Outlook Board
 Texas (8) Missouri (7) South Dakota (6) Kansas (5) Nebraska (5) North Dakota (5) Oklahoma (5) Kentucky (4) Montana (4) California (3) Minnesota (3) New York (3) Pennsylvania (3) Tennessee (3) Wisconsin
Occupant Protection Laws
 Occupant Protection s Alabama Alaska Arizona Under 1 yr. or
 Alabama Alaska Arizona Under 1 yr. or
 A Comparison of Highway Construction Costs in the Midwest and Nationally
 A Comparison of Highway Construction Costs in the Midwest and Nationally March 20, 2018 Mary Craighead, AICP 1 INTRODUCTION State Departments of Transportation play a significant role in the construction
Occupant Protection Laws
 Alabama Alaska Arizona ; under 5 yrs. and 20 lbs. forward-facing ; 4-8 yrs.,
Occupant Protection Laws
 Occupant rotection Laws tate Must Be in Child Restraint* Additional eat Belt Coverage* Who is Covered & Where rimary or econdary Alabama Under 6 yrs.** 6 until 15 yrs. 15+ yrs. in Alaska Under 4 yrs.**
Chapter 2: Organizing Data
 Chapter 2: Organizing Data MULTIPLE CHOICE 1. Finish times (to the nearest hour) for 10 dogsled teams are shown below. Find the class width. Use five classes. (Round your answer to the nearest integer.)
Chapter 2: Organizing Data
 Chapter 2: Organizing Data MULTIPLE CHOICE 1. Finish times (to the nearest hour) for 10 dogsled teams are shown below. Find the class width. Use five classes. (Round your answer to the nearest integer.)
CHAPTER 6. APPENDICES
 CHAPTER 6. APPENDICES Appendix 6.1. Summary of State Regulations Pertaining to Asian Carps. Some states prohibit or restrict the possession of certain species of Asian carps. State regulations pertaining
STAT 155 Introductory Statistics. Lecture 2-2: Displaying Distributions with Graphs
 The UNIVERSITY of NORTH CAROLINA at CHAPEL HILL STAT 155 Introductory Statistics Lecture 2-2: Displaying Distributions with Graphs 8/31/06 Lecture 2-2 1 Recall Data: Individuals Variables Categorical variables
Organizing Quantitative Data
 Organizing Quantitative Data MATH 130, Elements of Statistics I J. Robert Buchanan Department of Mathematics Fall 2018 Objectives At the end of this lesson we will be able to: organize discrete data in
Traffic Safety Facts. State Traffic Data Data. Overview
 Traffic Safety Facts 2015 Data June 2017 DOT HS 812 412 State Traffic Data Key Findings Traffic fatalities increased by 7 percent from 2014 to 2015 (32,744 to 35,092) for the United States. The fatality
Traffic Safety Facts 2007 Data
 Traffic Safety Facts 2007 Data Bicyclists and Other Cyclists DOT HS 810 986 Bicyclists and other cyclists include riders of two-wheel nonmotorized vehicles, tricycles, and unicycles powered solely by pedals.
THE FUTURE OF SALES TAX REVENUE
 THE FUTURE OF SALES TAX REVENUE Presented by Adam Fulton, Senior Economic Associate The Outlook for Sales Taxes State governments rely on state sales taxes for more than a fifth of their revenue Economic
CLIFF PENNINGTON. Oakland A s 2012 Math Educational Program. 3 rd -5 th Grade Workbook
 CLIFF PENNINGTON Oakland A s 2012 Math Educational Program 3 rd -5 th Grade Workbook EARN 2 VOUCHERS TO A 2012 A s GAME! ELIGIBILITY Students from 1st through 8th grade are eligible to participate in the
ECONOMIC IMP ACT REPORT 2018
 FIREARMS AND AMMUNITION INDUSTRY ECONOMIC IMP ACT REPORT 218 THE FIREARMS INDUSTRY TRADE ASSOCIATION NSSF.ORG Who is the National Shooting Sports Foundation? The National Shooting Sports Foundation (NSSF)
Education Committee Economic Background and Issue Review
 Education Committee Economic Background and Issue Review Montpelier, Vermont January 22, 2014 Thomas E. Kavet State Economist and Principal Economic Advisor to the Vermont State Legislature Since 1996
Year 10 Term 2 Homework
 Yimin Math Centre Year 10 Term 2 Homework Student Name: Grade: Date: Score: Table of contents 6 Year 10 Term 2 Week 6 Homework 1 6.1 Data analysis and evaluation............................... 1 6.1.1
Catena Media analysis of how we expect sports betting to roll out across the United States of America.
 Catena Media analysis of how we expect sports betting to roll out across the United States of America. The impacts of this ruling on sports betting in the United States The state of New Jersey can now
STT 315 Section /19/2014
 Name: PID: A STT 315 Section 101 05/19/2014 Quiz 1A 50 minutes 1. A survey by an electric company contains questions on the following: Age of household head, Gender of household head and use of electric
States. Postal Abbreviations LEARN THE. AND. by Joy A. Miller
 1 States LEARN THE AND Postal Abbreviations by Joy A. Miller http://fivejs.com Learn the States and Postal Abbreviations Copyright 2009 Published by Joy A. Miller http://fivejs.com All rights reserved.
Target Shooting by Hunters and Their Use of Shooting Ranges: 1975, 1991, and 2011
 U.S. Fish & Wildlife Service Target Shooting by Hunters and Their Use of Shooting Ranges: 1975, 1991, and 2011 Addendum to the 2011 National Survey of Fishing, Hunting, and Wildlife-Associated Recreation
Purpose of the Efficiency Program Industry By State and Region Appendices and Limitations of Data
 Purpose of the Efficiency Program Industry By State and Region Appendices and Limitations of Data CEE collaborates with the American Gas Association (AGA) to survey and collect data in the United States
7. Ranking the States with the Greatest Energy Intensity and Residual Effect Reductions
 37 7. Ranking the States with the Greatest Energy Intensity and Residual Effect Reductions In this chapter, we report on the states that had the greatest reductions in energy intensity and residuals over
There are three major federal data sources that we evaluate in our Bicycle Friendly States ranking:
 Since the landmark Intermodal Surface Transportation Efficiency Act (ISTEA) created the Transportation Enhancements program in 1991 bicycle and pedestrian projects have been eligible for programmatic federal
Black Homicide Victimization in the Great Lakes States
 APRIL 2018 Victimization in the Great Lakes States An Analysis of 2015 Homicide Data WWW.VPC.ORG BLACK HOMICIDE VICTIMIZATION IN THE GREAT LAKES STATES VIOLENCE POLICY CENTER 1 COPYRIGHT AND ACKNOWLEDGMENTS
TABLE 3. Level of Activity in State Financial Assurance Funds 2017
 of of where of where Annual Approximate Amount Paid Annual and and total Alabama 752 28 78 47,792 47,462 2,810 2,810 59 $40.60 $568.00 $1.30 $10.30 $41.90 $578.30 $175,309 $163,492 2,519 1 Alaska* N/A
Chapter 2: Organizing Data
 1. Define: class boundary Chapter 2: Organizing Data Student: Class boundary specifies the span of data values that fall within a class. Class boundary is the difference between the lowest data value and
Chapter 2: Modeling Distributions of Data
 Chapter 2: Modeling Distributions of Data Section 2.1 The Practice of Statistics, 4 th edition - For AP* STARNES, YATES, MOORE Chapter 2 Modeling Distributions of Data 2.1 2.2 Normal Distributions Section
United States Flags. Gauge: 28 sts = 4", though gauge is not critical. Use any yarn and a needle size that gives you a fabric you like.
 United States Flags by Deborah V. Gardner Materials: 1 skein each Cascade 220 Sport, 100% Peruvian wool, #9568 Twilight Blue, #8895 Christmas Red, #8505 White (8 flags can be knitted with 1skein of each
The 2019 Economic Outlook Forum The Outlook for MS
 The 2019 Economic Outlook Forum The Outlook for MS February 2019 Mississippi University Research Center Mississippi Institutions of Higher Learning Darrin Webb, State Economist dwebb@mississippi.edu (601)432-6556
STUN GUN LAWS/ REQUIREMENTS DATED
 STUN GUN LAWS/ REQUIREMENTS DATED 11-09-15 State Laws / Permit Requirements Penalties-At-A-Glance Alabama Under Alabama law, a stun gun is not considered a firearm. Rather, Alabama defines a firearm as
Together, we are creating a world that works better.
 Together, we are creating a world that works better. www.td.org/powermember www.td.org/membership TIPS, TOOLS & INTELLIGENCE FOR DEVELOPING TALENT HUMAN CAPITAL ISSUE 1801 Alan Landers JANUARY 2018 $19.50
Official Match Program
 Official Match Program 2013-14 The American Legion presents its 24 th Junior 3-Position Air Rifle Tournament, which provides competitors an opportunity to test their marksmanship ability in competition
Arizona X X X 2013
 Alabama X X X 2012 http://children.alabama.gov/uploadedfiles/file/dev elopmental_standards_handbook.pdf Alaska X X 2007 https://education.alaska.gov/publications/earlylearn ingguidelines.pdf http://www.azed.gov/earlychildhood/files/2011/10/arizona-early-learningstandards-3rd-edition.pdf
Lesson 2.1 Frequency Tables and Graphs Notes Stats Page 1 of 5
 Stats Page 1 of 5 Frequency Table: partitions data into classes or intervals and shows how many data values are in each class. The classes or intervals are constructed so that each data value falls exactly
TABLE 3. Level of Activity in State Financial Assurance Funds 2016
 TABLE 3. Level of Activity in Financial Assurance Funds 2016 have where have Annual Approximate Amount Paid Annual and and total closed average Annual Claims Alabama 3,186 60 71 45,335 44,928 2,745 2,745
Catena Media analysis of how we expect sports betting to roll out across the United States of America.
 Catena Media analysis of how we expect sports betting to roll out across the United States of America. The impacts of this ruling on sports betting in the United States The state of New Jersey can now
Practice Test Unit 06B 11A: Probability, Permutations and Combinations. Practice Test Unit 11B: Data Analysis
 Note to CCSD HS Pre-Algebra Teachers: 3 rd quarter benchmarks begin with the last 2 sections of Chapter 6 (probability, which we will refer to as 6B), and then address Chapter 11 benchmarks (which will
Analyzing Categorical Data & Displaying Quantitative Data Section 1.1 & 1.2
 Analyzing Categorical Data & Displaying Quantitative Data Section 1.1 & 1.2 Reference Text: The Practice of Statistics, Fourth Edition. Starnes, Yates, Moore Starter Problem Antoinette plays a lot of golf.
Chapter 4 Displaying Quantitative Data
 Chapter Displaying Quantitative Data 17 Chapter Displaying Quantitative Data 1. Statistics in print. Answers will vary. 2. Not a histogram. Answers will vary. 3. In the news. Answers will vary.. In the
Practice Test Unit 6B/11A/11B: Probability and Logic
 Note to CCSD Pre-Algebra Teachers: 3 rd quarter benchmarks begin with the last 2 sections of Chapter 6, and then address Chapter 11 benchmarks; logic concepts are also included. We have combined probability
DOT HS November 2009 Geospatial Analysis of Rural Motor Vehicle Traffic Fatalities
 DOT HS 811 196 November 2009 Geospatial Analysis of Rural Motor Vehicle Traffic Fatalities This document is available to the public from the National Technical Information Service, Springfield, Virginia
America s Brightest ORANGE
 America s Brightest ORANGE Oklahoma State University 2013 Survey of Alumni of Graduate Programs Jeremy Penn, Ph.D. Director Mark Nicholas, Ph.D. Assistant Director John Hathcoat, Ph.D. Statistical Analyst
CHAPTER 1 ORGANIZATION OF DATA SETS
 CHAPTER 1 ORGANIZATION OF DATA SETS When you collect data, it comes to you in more or less a random fashion and unorganized. For example, what if you gave a 35 item test to a class of 50 students and collect
Weekly Peak Season Meeting
 Military Surface Deployment & Distribution Command Weekly Meeting 14-May- Current Week = 2 Data Source: DPS Analytics (11-May-15) Current Week Legend Week Ending Number Date 11 3/13 12 3/2 13 3/27 14 4/3
Age of Fans
 Measures of Central Tendency SUGGESTED LEARNING STRATEGIES: Activating Prior Knowledge, Interactive Word Wall, Marking the Text, Summarize/Paraphrase/Retell, Think/Pair/Share Matthew is a student reporter
MEDICAID EXPENDITURES FOR LONG-TERM SERVICES AND SUPPORTS: 2011 UPDATE
 RESEARCH PAPER MEDICAID EXPENDITURES FOR LONG-TERM SERVICES AND SUPPORTS: 2011 UPDATE STEVE EIKEN, KATE SREDL, BRIAN BURWELL, AND LISA GOLD THOMSON REUTERS 150 CAMBRIDGEPARK DRIVE CAMBRIDGE, MA 02140 OCTOBER
Sears Directors' Cup Final Standings
 1 North Carolina 529.0 24.5 0 0.0 16 49.0 11 54.0 0 0 0 0 17 44.5 6 58.5 26 37.5 0.0 0 5 58.5 0 0.0 806.5 2 Stanford 507.5 40.5 36 24.5 7 58.0 1 64.0 0 0 2 63.0 2 63.0 18 47.0 0.0 0 0.0 0 0.0 0 0 0.0 786.5
61,634 Website Traffic: Average Monthly Page Views. 24,414 Pool and Spa News Insider Newsletter Recipients Per Issue (24 issues per year)
") PUBLISHER S AUDIENCE STATEMENT December 2016 Mission Statement POOL AND SPA NEWS serves the interests of residential builders, retailers and service techs who build, sell, service, and support the use
PUBLISHER S AUDIENCE STATEMENT December 2016 Mission Statement POOL AND SPA NEWS serves the interests of residential builders, retailers and service techs who build, sell, service, and support the use
Formula Ford Championship
 Formula Ford Championship Ford (FF), Club Ford (CF) and Post Club Ford (PCF) Sponsored by SVRA The Formula Ford Championship is designed to celebrate the history of these great affordable open wheel cars.
Unit 3 ~ Data about us
 Unit 3 ~ Data about us Investigation 3: Data Sets & Displays I can construct, interpret, and compare data sets and displays. I can find, interpret, and compare measures of center and variation for data
LOTTERY CIRCLE MANUAL
 LOTTERY CIRCLE MANUAL ACE LEE COPYRIGHT 2016 WWW.LOTTERYCIRCLE.COM COPYRIGHT, LEGAL NOTICE AND DISCLAIMER: THE BOOK LOTTERY CIRCLE MANUAL IS COPYRIGHT 2016 BY WWW.LOTTERYCIRCLE.COM. NO PART OF THIS BOOK
Are Highways Crumbling? State Performance Summaries,
 Policy Summary 407 February 2013 Are Highways Crumbling? State Performance Summaries, 1989 2008 by David T. Hartgen, Ph.D., P.E., M. Gregory Fields and Elizabeth San José Project Director: Adrian T. Moore,
Dartmouth College Fact Book
 Undergraduate Entering Classes All First-year Entering Year 2004 2005 2006 2007 2008 2009 2010 2011 2012 2013 Graduating Class of 2008 2009 2010 2011 2012 2013 2014 2015 2016 2017 Applied 11,734 12,756
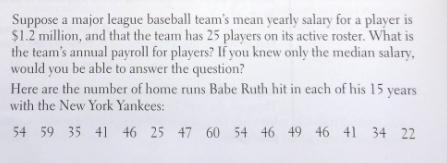
Descriptive Statistics Project Is there a home field advantage in major league baseball?
 Descriptive Statistics Project Is there a home field advantage in major league baseball? DUE at the start of class on date posted on website (in the first 5 minutes of class) There may be other due dates
Warm-up. Make a bar graph to display these data. What additional information do you need to make a pie chart?
 Warm-up The number of deaths among persons aged 15 to 24 years in the United States in 1997 due to the seven leading causes of death for this age group were accidents, 12,958; homicide, 5,793; suicide,
The Walking College: Building the Local Capacity of the National Walking Movement
 The Walking College: Building the Local Capacity of the National Walking Movement Ian Thomas, America Walks Faye Paige Edwards, GirlTrek Team Meeting of the National Physical Activity Society: October
Legal Heat: 50 State Guide to Firearm Laws and Regulations
 Legal Heat: 50 State Guide to Firearm Laws and Regulations First Edition A Traveler s resource for all 50 states and the District of Columbia. Plus User-friendly overviews of essential information like:
CHAPTER 2 Modeling Distributions of Data
 CHAPTER 2 Modeling Distributions of Data 2.2 Density Curves and Normal Distributions The Practice of Statistics, 5th Edition Starnes, Tabor, Yates, Moore Bedford Freeman Worth Publishers Density Curves
Legislative Economic Briefing
 Legislative Economic Briefing February 16, 2017 Mississippi University Research Center Mississippi Institutions of Higher Learning Darrin Webb, State Economist dwebb@mississippi.edu (601)432-6556 To subscribe
0-13 Representing Data
 1. SURVEYS Alana surveyed several students to find the number of hours of sleep they typically get each night. The results are shown in the table. Make a bar graph of the data. Draw a histogram to represent
Unit 6 Day 2 Notes Central Tendency from a Histogram; Box Plots
 AFM Unit 6 Day 2 Notes Central Tendency from a Histogram; Box Plots Name Date To find the mean, median and mode from a histogram, you first need to know how many data points were used. Use the frequency
Question: How does your state accommodate pedestrian pushbutton pole placement vs. ramp location and reach? State Contact Response Alabama Alaska
 Question: How does your state accommodate pedestrian pushbutton pole placement vs. ramp location and reach? State Contact Response Alabama Alaska Arizona Richard Moeur, rmoeur@azdot.gov (requestor) Trying
Irving Marathon Sponsorship Proposal
 2018 Irving Marathon Sponsorship Proposal Table of Contents What is the Irving Marathon?... 3 Event Demographics... 4 Vision for 2018... 4 Partnering with the Irving Marathon... 5 Title Sponsorship...
North Point - Advance Placement Statistics Summer Assignment
 North Point - Advance Placement Statistics This assignment is due during the first week of class. It is considered an exam grade, which that category is worth approximately 60% of your total grade. All
5.1. Data Displays Batter Up. My Notes ACTIVITY
 SUGGESTED LEARNING STRATEGIES: Activating Prior Knowledge, Marking the Text, Group Presentation, Interactive Word Wall Henry Hank Aaron and Harmon Killebrew are among the alltime leaders in home runs in
For the First Time, a Smaller Jackpot
 F I S C A L S T U D I E S WWW.ROCKINST.ORG SEPTEMBER 21, 2009 For the First Time, a Smaller Jackpot Trends in State Revenues from Gambling Lucy Dadayan and Robert B. Ward HIGHLIGHTS State-local gambling
Solutionbank S1 Edexcel AS and A Level Modular Mathematics
 Page 1 of 1 Exercise A, Question 1 A group of thirty college students was asked how many DVDs they had in their collection. The results are as follows. 12 25 34 17 12 18 29 34 45 6 15 9 25 23 29 22 20
3.3 - Measures of Position
 3.3 - Measures of Position Z-Scores Who is taller, a man 73 inches tall or a woman 68 inches tall? The obvious answer is that the man is taller. However, men are taller than women on the average. Let s
Historical Prevalence of Reelected Representatives in the U. S. House
 Historical Prevalence of Reelected Representatives in the U. S. House By Congress and by State Second through 109 th Congress Reelected Incumbents in the U. S. House Second through 109th Congresses 500
SIA SNOW SPORTS PARTICIPANT STUDY
 2012-2013 SIA SNOW SPORTS PARTICIPANT STUDY TABLE OF CONTENTS Section Page Number Participation Demographics 5 Gender and Age Demographics 27 Income and Education Demographics 38 Ethnic Demographics 54
Fighting Alabama s Prescription Drug Abuse Epidemic
 Fighting Alabama s Prescription Drug Abuse Epidemic Lori M. Quiller, APR Director, Communications & Social Media Medical Association of the State of Alabama Alabama Statistics How bad is prescription drug
OAKLAND ATHLETICS MATHLETICS MATH EDUCATIONAL PROGRAM. Presented by. #26 MATT CHAPMAN 3rd Base
 08 OAKLAND ATHLETICS MATHLETICS MATH EDUCATIONAL PROGRAM Presented by #6 MATT CHAPMAN 3rd Base HOW TO EARN YOUR TICKETS F years, the Mathletics program has helped promote the imptance of math among students
Descriptive Stats. Review
 Descriptive Stats Review Categorical Data The Area Principal Distorts the data possibly making it harder to compare categories Everything should add up to 100% When we add up all of our categorical data,
Wildlife Watching in the U.S.: The Economic Impacts on National and State Economies in 2011
 U.S. Fish & Wildlife Service Wildlife Watching in the U.S.: The Economic Impacts on National and State Economies in 2011 Addendum to the 2011 National Survey of Fishing, Hunting, and Wildlife-Associated
How are the values related to each other? Are there values that are General Education Statistics
 How are the values related to each other? Are there values that are General Education Statistics far away from the others? Class Notes Measures of Position and Outliers: Z-scores, Percentiles, Quartiles,
USA TRIATHLON MEMBERSHIP REPORT TABLE OF CONTENTS
 USA TRIATHLON MEMBERSHIP REPORT This report has been prepared by the Membership Services staff based on active memberships on December 31, 2015. Media requests can be addressed to communications@usatriathlon.org.
9.3 Histograms and Box Plots
 Name Class Date 9.3 Histograms and Box Plots Essential Question: How can you interpret and compare data sets using data displays? Explore Understanding Histograms Resource Locker A histogram is a bar graph
Appendix A: State-Level Survey Results
 Appendix A: State-Level Survey Results Table A1: Reimbursement for LARCs Post Labor and Delivery States Hospital Reimbursement Other Provider Reimbursement Device Insertion Device (n=39) Insertion (n=40)
All-Time College Football Attendance (Includes all divisions and non-ncaa teams) No. Total P/G Yearly Change No. Total P/G Yearly Change Year Teams
 No. Total P/G Yearly Change No. Total P/G Yearly Change Year Teams") Attendance Records All-Time College Football Attendance... 2 All-Time NCAA Attendance... 2 Annual Conference Attendance Leaders... 4 Largest Regular-Season Crowds... 11 2010 Attendance... 11 Annual Team
Attendance Records All-Time College Football Attendance... 2 All-Time NCAA Attendance... 2 Annual Conference Attendance Leaders... 4 Largest Regular-Season Crowds... 11 2010 Attendance... 11 Annual Team
Pedestrian Fatalities on Interstate Highways, United States, Saving lives through research and education.
 Saving lives through research and education Pedestrian Fatalities on Interstate Highways, United States, 1993-2012 September 2014 607 14th Street, NW, Suite 201 Washington, DC 20005 AAAFoundation.org 202-638-5944
46 Chapter 8 Statistics: An Introduction
 46 Chapter 8 Statistics: An Introduction Activity 5 Continued Box 4 1. The median is 6. The mode is 5. The mean is about 7 (6.8). 2. The median and the mode were unchanged, but the mean increased significantly.
Division I Sears Directors' Cup Final Standings
 1 Stanford (Calif.) 747.5 112.5 4 61.0 4 61.0 34 29.5 0 0.0 0 0.0 0 0.0 0 0.0 1 64.0 1 64.0 12 52.5 11 53.5 1 64.0 1084.5 2 North Carolina 631.5 0 0.0 21 43.5 10 55.0 3 61.5 0 0.0 0 0.0 0 0.0 0 0.0 41
17t h Ann u a l Re p o r t on th e ( ) POLICY STUDY
 POLICY STUDY") July 2008 17t h Ann u a l Re p o r t on th e Per f o r m a n c e of Stat e Hi g h w a y Sy s t e m s (1984 2006) By David T. Hartgen, Ph.D., P.E., and Ravi K. Karanam Project Director: Adrian T. Moore,
July 2008 17t h Ann u a l Re p o r t on th e Per f o r m a n c e of Stat e Hi g h w a y Sy s t e m s (1984 2006) By David T. Hartgen, Ph.D., P.E., and Ravi K. Karanam Project Director: Adrian T. Moore,
Statistical Studies: Analyzing Data III.B Student Activity Sheet 6: Analyzing Graphical Displays
 The Phoenix Mercury of the Women s National Basketball League had 14 players on the roster for the 2008 season. The players and their average points per game (PPG) are shown below. Player Diana Taurasi
Statistical Studies: Analyzing Data III.B Student Activity Sheet 6: Analyzing Graphical Displays
 The Phoenix Mercury of the Women s National Basketball League had 14 players on the roster for the 2008 season. The players and their average points per game (PPG) are shown below. Player Diana Taurasi
2016 River Use Statistics -by Steve Sullivan
 Grand Canyon River Office 2016 River Use Statistics -by Steve Sullivan Topics River Use Statistics Overview Commercial River Use Statistics Noncommercial River Use Statistics Noncommercial River Lottery
Regional Summit on GROWING STATE ECONOMIES Nashville, TN November 14, Global Entrepreneurship Monitor Research: Highlights. Abdul Ali, Ph.D.
 Regional Summit on GROWING STATE ECONOMIES Nashville, TN November 14, 2011 Global Entrepreneurship Monitor Research: Highlights Abdul Ali, Ph.D. 1 Babson College # 1 Entrepreneurship Undergraduate: 1995-2011
Wildlife Watching in the U.S.: The Economic Impacts on National and State Economies in 2006
 U.S. Fish & Wildlife Service Wildlife Watching in the U.S.: The Economic Impacts on National and State Economies in 2006 Addendum to the 2006 National Survey of Fishing, Hunting, and Wildlife-Associated
(c) The hospital decided to collect the data from the first 50 patients admitted on July 4, 2010.
 The hospital decided to collect the data from the first 50 patients admitted on July 4, 2010.") Math 155, Test 1, 18 October 2011 Name: Instructions. This is a closed-book test. You may use a calculator (but not a cell phone). Make sure all cell-phones are put away and that the ringer is off. Show
Math 155, Test 1, 18 October 2011 Name: Instructions. This is a closed-book test. You may use a calculator (but not a cell phone). Make sure all cell-phones are put away and that the ringer is off. Show
Unit 3 - Data. Grab a new packet from the chrome book cart. Unit 3 Day 1 PLUS Box and Whisker Plots.notebook September 28, /28 9/29 9/30?
 Unit 3 - Data Grab a new packet from the chrome book cart 9/28 9/29 9/30? 10/3 10/4 10/5 10/6 10/7-10/10 10/11 10/12 10/13 Practice ACT #1 Lesson 1: Box and Whisker Plots I can find the 5 number summary
State and National Economic Effects of Fishing, Hunting and Wildlife-Related Recreation on U.S. Forest Service-Managed Lands
 State and National Economic Effects of Fishing, Hunting and Wildlife-Related Recreation on U.S. Forest Service-Managed Lands Prepared by the: American Sportfishing Association for the: Wildlife, Fish and
2019 Adult Sectional Figure Skating Championships. Bid Information & Guidelines
 2019 Adult Sectional Figure Skating Championships Bid Information & Guidelines Available Competition Dates: March 8-10, 2019 or March 15-17, 2019 CONTACT: Brett Mueller, Competitions Coordinator U.S. Figure
Where the HSUS Spends it s Money HSUS 2006 Tax Return Analysis by Alice Fix
 Where the HSUS Spends it s Money HSUS 2006 Tax Return Analysis by Alice Fix Here are some interesting facts found when doing an analysis of the HSUS 2006 Tax Return. It is a public document and you can
Conduent EDI Solutions, Inc. Eligibility Gateway 270/271 Payer Guide Medicaid
 Conduent EDI Solutions, Inc. Eligibility Gateway 270/271 Payer Guide Medicaid Version 4010 Technical Support: egateway@conduent.com May 10, 2017 2017 Conduent Business Services, LLC. All rights reserved.