THE GRID: Big 4 North American Sports League Operating Rules Spring 2016
|
|
|
- Jack Doyle
- 6 years ago
- Views:
Transcription
1 THE GRID: Big 4 North American Sports League Operating Rules Spring 2016 League NFL MLB NBA NHL Size/Season Playoffs Roster size 32 teams, 8 divisions, 16 games. 4 rounds, 12 teams 4 wild cards 1- game knockouts with 4 1 st round byes 45 active / 53 total 30 teams, 6 divisions, 162 games. 4 rounds, 10 teams 4 wild cards (2012) WC play in, best of 5, best of 7, best of 7 25 active / 40 total 30 teams, 6 divisions, 82 games. 4 rounds, 16 teams, no reseeding All rounds best of 7(2003) 12 active / 15 total 30 teams, 4 divisions, 82 games. 4 rounds, 16 teams, top 3 in division + 4 wild cards; all rounds best of 7; no reseed 20 active / 23 total Bargaining Agreement Ten years NFLPA is weak: decertified before 1993 free agency. Five years: MLBPA is strong: 2002 CBA was first without stoppage Ten years: : Mutual option year in Work stoppages ; Ten years: , Double option. Lockout in and seasons Free Agency Conditions Unrestricted free agency after 4 years. Restricted after 3 years Unrestricted free agency after 6 years. Arbitration 3-5 years. Reserve 0-2 yrs. Unrestricted after 1st contract with first refusal rights to team. Unrestricted age 27after 4 years NHL. Restricted under age 27. Mean Salary $1.9M in 2012 from $395K in $3.4M in 2014 from $579K in $5.3M in 2014 from $717K in $2.4M in 2012 from $221K in Payroll Cap/ Luxury Tax Hard cap since 1994: % of AR after 2013; $143M in Minimum payroll 89% of cap. Luxury tax: 17.5% of payroll over $189M ( ); 30% - 40% for 2 nd & 3 rd breach and 50% for 4 th breach Soft cap since 1984: 49-51% of BRI cap $70M, min 90% of cap. Lux tax 53.5% of BRI, 2016 threshold $84.74M. Hard cap since 2005: 50% of hockey related revenue HRR. Cap $71.4 in 2016 Max/min payroll +15%/-15% of midpoint Local Revenue Gate 18% of total and shared 66/34. Venue 27% unshared. Local media insignificant. Gate 30%, venue 28%, local media 22% of total revenue. 34% of local revenue shared. Gate 27%, venue 15%, local media 13% of total revenue.50% of local revenue shared. Gate 40%, venue 25%, media 20% of total. 5% of local revenue is shared. Central Revenue National media 55% of total, equal shares. Nine years, FOX, ABC/ESPN, CBS, DirecTV: $205M annually per club. National media 20% of total, equal shares. Eight-years FOX, TBS and ESPN: $51.7M annually per club. National media 27% of total, equal shares. Nine-year TNT and ABC/ESPN: $90.3M annually per club. National media 20% of total, equal shares. 10-year NBC; 12 years Rogers Sportsnet : $21M annual per club. Forbes Mean Team Value Revenue share V/R = $1,966M / $347M = league revenue $11.1 billion Local/National split 40%/60% V/R = $1,200M / $262M = league revenue $7.8 billion Local/National split 50%/50% V/R = $1,106M / $160M = league revenue $4.8 billion. Local/National split 60%/40% V/R = $505M / $133M = league revenue $4 billion Local/National split 80%/20% Source: John Vrooman, Vanderbilt University
2 North American TV Market Size (million TV households) RNK Designated Market Area (DMA) TVHH NFL MLB NBA NHL TOT 1 New York Los Angeles Chicago Philadelphia Toronto Dallas-Ft. Worth San Francisco-Oakland-San Jose Boston Washington, DC Atlanta Houston Detroit Phoenix Seattle-Tacoma Tampa-St. Pete Minneapolis-St. Paul Miami-Ft. Lauderdale Denver Montreal/Quebec City Orlando-Daytona Beach Cleveland-Akron Sacramento Vancouver St. Louis Portland, OR Pittsburgh Raleigh-Durham Charlotte Indianapolis Baltimore San Diego Nashville Hartford & New Haven Kansas City Columbus, OH Salt Lake City Milwaukee Cincinnati San Antonio Greenvll-Spart-Asheville West Palm Beach-Ft. Pierce Grand Rapids-Kalmzoo-B.Crk Austin Oklahoma City Las Vegas Harrisburg Birmingham Norfolk Greensboro Albuquerque-Santa Fe Jacksonville Louisville Memphis New Orleans Buffalo Edmonton Calgary Ottawa Winnipeg TOTALS Source: Nielsen Research and John Vrooman
3 31 Theory of the Perfect Game Table 11. Expansion, Relocation and Extortion Year X/R League/Club Fee a League DMA b Venue a Public% National Football League 1995 X Carolina Panthers (NFC) X Jacksonville Jaguars (AFC) c R Los Angeles Raiders to Oakland c R Los Angeles Rams to St. Louis f R Cleveland Browns to Baltimore Ravens f R Houston Oilers to Nashville f X Cleveland Browns (AFC) X Houston Texans (AFC) e Major League Baseball 1993 X Colorado Rockies (NL) X Florida Marlins (NL) c 1998 X Arizona Diamondbacks (NL) X Tampa Bay Devil Rays (AL) R Montreal Expos to Washington Nationals National Basketball Association g 1995 X Toronto Raptors d 0.0 X Vancouver Grizzlies d R Vancouver Grizzlies to Memphis R Charlotte Hornets to New Orleans c X Charlotte Bobcats National Hockey League 1991 X San Jose Sharks X Ottawa Senators X Tampa Bay Lightning R Minnesota North Stars to Dallas Stars d 29.8 X Anaheim Mighty Ducks X Florida Panthers R Quebec Nordiques to Colorado Avalanche d R Winnipeg Jets to Phoenix Coyotes R Hartford Whalers to Carolina Hurricanes X Nashville Predators X Atlanta Thrashers d X Columbus Blue Jackets X Minnesota Wild X= Expansion R= Relocation a Venue cost and expansion/relocation fees in $millions b DMA Nielsen Media Designated Market Area in million households c Renovations; d Joint NBA-NHL arenas e Seattle Seahawks switched from AFC to NFC in 2002 realignment of eight divisions of 4 teams. f Relocation fee is share of PSL payments to Ravens ($65 million), Titans ($71 million) and Rams ($78 million). g NBA added Charlotte Hornets, Miami Heat (1988); Minnesota T-Wolves, Orlando Magic (1989) fee of $37.5 million. The NFL retro-expanded into Cleveland in 1999 for 75 percent public funding of the new Browns Stadium with 147 suites and 8,800 club seats. 73 After several delays between competing L.A. investment groups, the NFL decided instead to retro-fill the Houston market for 71 percent public funding of Reliant Stadium (191suites and 8,300 club seats) in The new Cleveland Browns paid an expansion fee of $530 million and Houston Texans paid a premium fee of $700 million. That left the second largest U.S. TV market L.A. without a NFL team. This was not a major problem for two reasons. 73 In litigation settlement the NFL promised the City of Cleveland a new Browns club by 1999 and allowed the old Browns to become the Baltimore Ravens. The League did not say whether the new Cleveland team would be a relocation or expansion franchise until 1998 after stadium deals were completed in Tampa and Cincinnati.
4
5 Alternative Futures for St. Louis Rams ($millions) Ed Jones Riverfront LA Relocation Local revenue (Venue revenue+home gate) $100 $150 $300 National revenue (Media+Visitor gate) $200 $200 $200 Total Revenue $300 $350 $500 Total Operating expenses $220 $240 $278 Operating Profit $75 $110 $222 Present Value of Net Cash Flow 30 $1,470 $2,150 $4,350 Stadium Funding Rams ($150 million PSLs + $250 million Kroenke) $0 $400 $1,800 NFL G-4 loan (LA relocation not eligible for G-4) $0 $200 $0 Private Share Rams + NFL): 55% in St. Louis and 100% in LA $0 $600 $1,800 Public Share: 45% in St. Louis and 0% in LA $0 $500 $0 Franchise value = PV of cash flow - club share of venue cost $1,470 $1,750 $2,550 Value/Revenue multiple Net value gain from relocation to LA over new venue in St. Louis $0 $0 $800 NFL relocation indemnity fee (50/50 split of $800m LA relocation gain) $0 $0 $400 Net Franchise Value $1,470 $1,750 $2,150 Stadium Cost: LA $1.8 billion; St. Louis $1.1 billion Source: John Vrooman, Vanderbilt University NFL Team Values 2015 Rank Team Value % Chg D/V Revenue Income V/R P/E 1 Dallas Cowboys $4,000 25% 5% $620 $ New England Patriots $3,200 23% 7% $494 $ Washington Redskins $2,850 19% 8% $439 $ New York Giants $2,800 33% 18% $400 $ San Francisco 49ers $2,700 69% 21% $427 $ New York Jets $2,600 44% 23% $383 $ Houston Texans $2,500 35% 7% $383 $ Chicago Bears $2,450 44% 4% $352 $ Philadelphia Eagles $2,400 37% 8% $370 $ Green Bay Packers $1,950 42% 6% $347 $ Denver Broncos $1,940 34% 6% $346 $ Baltimore Ravens $1,930 29% 14% $345 $ Pittsburgh Steelers $1,900 41% 11% $334 $ Indianapolis Colts $1,880 34% 3% $321 $ Seattle Seahawks $1,870 41% 6% $334 $ Miami Dolphins $1,850 42% 19% $322 $ Atlanta Falcons $1,670 48% 51% $303 $ Minnesota Vikings $1,590 38% 31% $281 $ Carolina Panthers $1,560 25% 4% $325 $ Arizona Cardinals $1,540 54% 10% $308 $ Kansas City Chiefs $1,530 39% 5% $307 $ San Diego Chargers $1,530 53% 7% $304 $ New Orleans Saints $1,520 36% 5% $322 $ Tampa Bay Buccaneers $1,510 23% 12% $313 $ Cleveland Browns $1,500 34% 13% $313 $ Tennessee Titans $1,490 28% 10% $318 $ Jacksonville Jaguars $1,480 53% 7% $315 $ St Louis Rams $1,450 56% 8% $290 $ Cincinnati Bengals $1,450 46% 7% $296 $ Detroit Lions $1,440 50% 19% $298 $ Oakland Raiders $1,430 47% 14% $285 $ Buffalo Bills $1,400 50% 14% $296 $ NFL 32 Team Average $1, % 12% $346.6 $ Source: Forbes and John Vrooman
6 Franchise Stadium Year Total Luxury Club PSL G-3/4 PSL Total Private Public Private Public Open Seats Suites Seats Seats Loan Fees Cost Cost Cost Share Share Relocation-Extortion Jacksonville Jaguars EverBank Field $141 $20 $ % 85.8% St. Louis Rams Edward Jones Dome $78 $299 $0 $ % 100.0% Oakland Raiders O.co Coliseum $68 $128 $0 $ % 100.0% Carolina Panthers Bank of America Stadium $122 $248 $187 $ % 24.6% San Diego Chargers Qualcomm Stadium $78 $18 $ % 76.9% Washington Redskins FedEx Stadium $251 $180 $ % 28.3% Baltimore Ravens M&T Bank Stadium $65 $229 $29 $ % 87.3% Tampa Bay Bucs Raymond James Stadium $169 $15 $ % 91.1% Tennessee Titans LP Field $71 $292 $71 $ % 75.7% Cleveland Browns First Energy Stadium $25 $314 $79 $ % 74.8% Cincinnati Bengals Paul Brown Stadium $26 $458 $44 $ % 90.4% Pittsburgh Steelers Heinz Field $37 $284 $113 $ % 60.2% Houston Texans NRG Stadium $50 $449 $132 $ % 70.6% $2,210 Extortion Totals 13 Venues $0 $542 $3,340 $888 $2, % 73.4% G-3/4 Loan Program Denver Broncos Sports Authority Field $48 $401 $100 $ % 75.1% New England Patriots Gillette Stadium $141 $412 $340 $ % 17.5% Detroit Lions Ford Field $100 $500 $375 $ % 25.0% Seattle Seahawks CenturyLink Field $63 $17 $430 $130 $ % 69.8% Philadelphia Eagles Lincoln Financial Field $125 $70 $518 $330 $ % 36.3% Chicago Bears New Soldier Field $100 $70 $632 $200 $ % 68.4% Green Bay Packers Lambeau Field $13 $93 $295 $126 $ % 57.3% Arizona Cardinals University of Phoenix $42 $455 $147 $ % 67.7% Indianapolis Colts Lucas Oil Stadium $33 $675 $100 $ % 85.2% Dallas Cowboys AT&T Stadium $ $1,200 $850 $ % 29.2% Kansas City Chiefs Arrowhead Stadium $43 $375 $125 $ % 66.7% New York Giants/Jets MetLife Stadium $300 $800 $1,600 $1,600 $ % 0.0% San Francisco 49ers Levis Stadium (G-4) $200 $312 $1,310 $1,196 $ % 8.7% Minnesota Vikings US Bank Stadium (G-4) $200 $151 $1,027 $529 $ % 48.5% $1,381 Atlanta Falcons Mercedes Benz Stadium (G-4) $200 $200 $1,400 $600 $ % 57.1% G-3/4 Totals 15 Venues $1,684 $2,183 $11,230 $6,748 $4, % 39.9% Grand Total 28 Venues $1,684 $2,725 $14,570 $7,636 $6, % 47.6% Source: John Vrooman, Vanderbilt University NFL Venue Revolution since 1995 Expansion Following the aborted move of New England Patriots to Hartford Connecticut in 1999, the League established the G-3 loan program for venue construction (Amendment 1999 G-3 NFL Bylaws). Using a debt facility backed by TV revenues, the NFL loaned up to 50 percent of private stadium contribution for top six TV markets ($150 million maximum) and up to 34 percent of the private share for smaller markets ($100 million maximum). G-3 loans are repaid from visiting team share of club-seat premiums The G-3 program ended in 2007 and after the 2008 financial crisis was it was replaced by the G-4 program ($200 million maximum) in 2011 *Private cost includes G-3/4 League loans and PSL fees as the present value of season ticket discounts over time. Stadium renovations
7


8 Carolina Panthers Bank of America Stadium (1996) Seating Capacity Lower Bowl: 22,714 Club Level: 11,209. Suites: 2,717 Total Lower Bowl/Suite Seating: 36,640 Upper Bowl: 37,138 Total Stadium: 73,778 Cost $248 million. Private share 76.3% Los Angeles Rams/Raiders L.A. Memorial Coliseum (1923) Seating Capacity 91,000
9 The Cost of NHL Southern Expansion Strategy In the league spent 57 percent of league revenues for player salaries. That year the player s salaries took up $414 million of the league's $732 million in revenues. Player costs approached 76 percent of revenues at the time of the lockout in Beginning in the NHL salary cap sets the player cost limit at 57 percent of Hockey Related Revenue. NHL Cost Squeeze before the Lockout Average Player Salary $558,000 $1,790,000 Total NHL Revenues $732 million $1.93 billion Total Player Salaries $414 million $1.46 billion Player Cost Squeeze 56.6% 75.6% Source: John Vrooman and NHL NHL Player Salaries Southern Strategy Season Avg. Salary $276, $368, $465, $558, $733, $892, $981, $1,167, $1,288, $1,356, $1,434, $1,642, $1,790, $1,830, Lockout $1,460,000 Source: John Vrooman and NHL
10 Proposed NHL Expansion/Relocation 32 Teams RNK Designated Market Area (DMA) TVHH NFL MLB NBA NHL TOT X/R 5 Toronto/GTA X1 14 Seattle-Tacoma X2 13 Phoenix R1 19 Montreal/Quebec City R1 17 Miami-Ft. Lauderdale R2 25 Portland, OR R2 27 Raleigh-Durham R3 33 Hartford & New Haven R3 45 Las Vegas R4 Expansion (X) and relocation (R) markets Source: John Vrooman National Hockey League Values 2015 Rank Team 2015 Value Change D/V Revenue Earnings P/E V/R 1 New York Rangers $1,200 9% 0% $229 $ Montreal Canadiens $1,175 18% 20% $219 $ Toronto Maple Leafs $1,150-12% 11% $192 $ Chicago Blackhawks $925 12% 0% $182 $ Boston Bruins $750 0% 0% $158 $ Vancouver Canucks $745-7% 11% $152 $ Philadelphia Flyers $660 6% 9% $146 $ Detroit Red Wings $600 5% 33% $135 $ Los Angeles Kings $580 0% 16% $132 $ Washington Capitals $565 13% 23% $132 $ Pittsburgh Penguins $560-1% 20% $151 $ Edmonton Oilers $455-4% 18% $119 $ Dallas Stars $450 7% 33% $132 $ San Jose Sharks $445 5% 11% $126 $ Calgary Flames $435-4% 6% $130 $ Anaheim Ducks $400 10% 16% $122 ($0.80) Minnesota Wild $380 3% 30% $125 $ Ottawa Senators $370-7% 34% $119 $ Colorado Avalanche $360 0% 0% $106 ($3.70) Winnipeg Jets $350-2% 37% $116 $ New Jersey Devils $330 0% 79% $125 $ New York Islanders $325 8% 31% $93 ($14) Buffalo Sabres $300 4% 27% $113 $ St Louis Blues $270 15% 24% $111 ($7.10) Tampa Bay Lightning $260 13% 17% $121 ($1.40) Nashville Predators $255 2% 33% $110 $ Columbus Blue Jackets $226 13% 33% $99 $ Carolina Hurricanes $225 2% 53% $99 ($11.70) Arizona Coyotes $220-2% 63% $92 ($4.50) Florida Panthers $186-2% 62% $93 ($20.20) NHL Averages $ % 25% $ $ Source: Forbes and John Vrooman
11 NHL Attendance Report NHL Attendance Report RK TEAM GMS AVG Capacity RK TEAM GMS Capacity 1 Chicago 41 21, % 1 Chicago 27 21, % 2 Montreal 41 21, % 2 Montreal 23 21, % 3 Detroit 41 20, % 3 Detroit 26 20, % 4 Philadelphia 41 19, % 4 Boston 25 19, % 5 Washington 41 19, % 5 Toronto 22 19, % 6 Calgary 41 19, % 6 Calgary 23 19, % 7 Toronto 41 19, % 7 Philadelphia 22 19, % 8 Minnesota 41 19, % 8 Tampa Bay 24 19, % 9 Tampa Bay 41 18, % 9 Minnesota 24 19, % 10 Vancouver 41 18, % 10 Pittsburgh 24 18, % 11 San Jose 41 18, % 11 Washington 22 18, % 12 Pittsburgh 41 18, % 12 Buffalo 26 18, % 13 Buffalo 41 18, % 13 Vancouver 21 18, % 14 St. Louis 41 18, % 14 Dallas 24 18, % 15 Los Angeles 41 18, % 15 Los Angeles 24 18, % 16 Ottawa 41 18, % 16 St. Louis 27 18, % 17 NY Rangers 41 18, % 17 NY Rangers 24 18, % 18 Boston 41 17, % 18 Ottawa 23 17, % 19 Dallas 41 17, % 19 Nashville 23 16, % 20 Anaheim 41 16, % 20 Edmonton 24 16, % 21 Nashville 41 16, % 21 San Jose 23 16, % 22 Edmonton 41 16, % 22 Anaheim 26 16, % 23 Colorado 41 16, % 23 Colorado 25 16, % 24 Columbus 41 15, % 24 Winnipeg 23 15, % 25 NY Islanders 41 15, % 25 Florida 24 14, % 26 New Jersey 41 15, % 26 New Jersey 24 14, % 27 Winnipeg 41 15, % 27 Columbus 23 13, % 28 Arizona 41 13, % 28 NY Islanders 25 13, % 29 Carolina 41 12, % 29 Arizona 25 13, % 30 Florida 41 11, % 30 Carolina 25 11, % Full season As of 1/23/2016 NHL Standings January 2016 Eastern Conference WIN% GP W L OTL PTS Western Conference WIN% GP W L OTL PTS ATLANTIC CENTRAL Florida Chicago Tampa Bay Dallas Detroit St. Louis Boston Colorado Montreal Minnesota Ottawa Nashville Toronto Winnipeg Buffalo METROPOLITAN PACIFIC Washington Los Angeles NY Rangers San Jose NY Islanders Arizona New Jersey Vancouver Pittsburgh Anaheim Carolina Calgary Philadelphia Edmonton Columbus
12 National Hockey League Expansion: Plan B Current 30 Club Alignment Proposed NHL Expansion 32 Clubs Eastern Conference Western Conference Eastern Conference Western Conference ATLANTIC CENTRAL Orr Division Hull Division Boston Bruins Chicago Blackhawks Northeast Midwest Montreal Canadiens St. Louis Blues Boston Bruins Chicago Blackhawks Florida Panthers Minnesota Wild Montreal Canadiens St. Louis Blues Detroit Red Wings Dallas Stars Hartford Whalers (Florida) Minnesota Wild Ottawa Senators Winnipeg Jets Quebec City (Expansion) Columbus (New Conference) Toronto Maple Leafs Nashville Predators Buffalo Sabres Colorado Avalanche Great Lakes Mid-South Tampa Bay Lightning Detroit Red Wings Dallas Stars Ottawa Senators Winnipeg Jets METROPOLITAN PACIFIC Toronto Maple Leafs Nashville Predators NY Rangers Los Angeles Kings Buffalo Sabres Colorado Avalanche NY Islanders San Jose Sharks New Jersey Devils Anaheim Ducks Lemieux Division Gretzky Division Pittsburgh Penguins Arizona Coyotes Metropolitan Southwest Philadelphia Fyers Vancouver Canucks NY Rangers Los Angeles Kings Washington Capitals Calgary Flames NY Islanders San Jose Sharks Carolina Hurricanes Edmonton Oilers New Jersey Devils Anaheim Ducks Columbus Blue Jackets Tampa Bay (New Division) Las Vegas (Arizona) Mid-Atlantic Northwest Relocation Pittsburgh Penguins Vancouver Canucks Realignment Philadelphia Fyers Calgary Flames Expansion Washington Capitals Edmonton Oilers Carolina Hurricanes Seattle (Expansion) John Vrooman, Vanderbilt University

13 realignment maps/
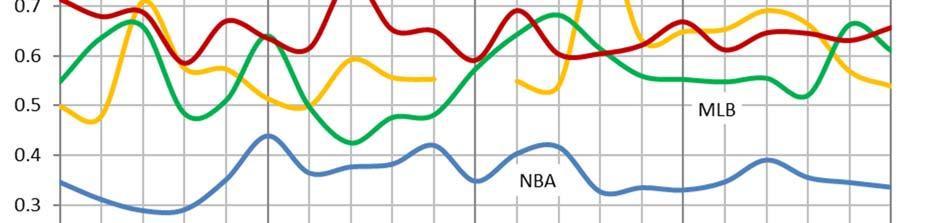
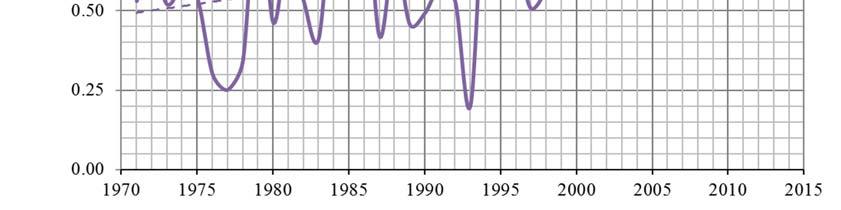
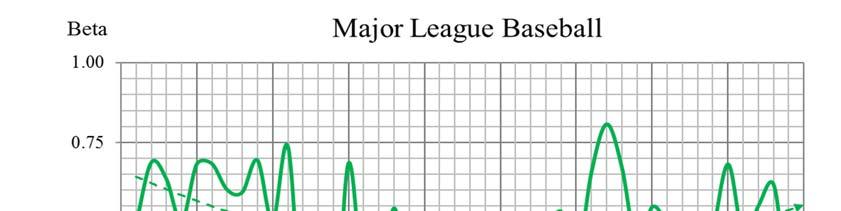
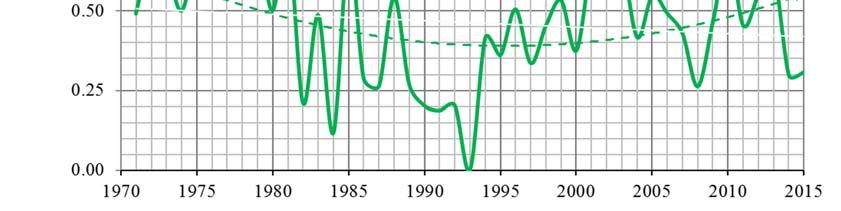
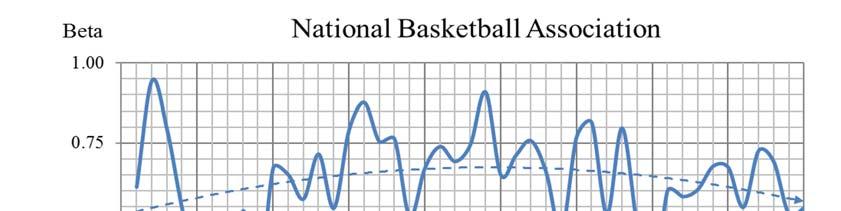
14 Big 4 Win Distributions for 2015 NFL MLB NBA NHL Carolina Panthers.938 St. Louis Cardinals.617 Golden State Warriors.817 New York Rangers.646 Arizona Cardinals.813 Pittsburgh Pirates.605 Atlanta Hawks.732 Anaheim Ducks.622 Cincinnati Bengals.750 Chicago Cubs.599 Houston Rockets.683 St. Louis Blues.622 Denver Broncos.750 Kansas City Royals.586 Los Angeles Clippers.683 Montreal Canadiens.610 New England Patriots.750 Toronto Blue Jays.574 Memphis Grizzlies.671 Tampa Bay Lightning.610 Kansas City Chiefs.688 Los Angeles Dodgers.568 San Antonio Spurs.671 Chicago Blackhawks.585 Minnesota Vikings.688 N.Y. Mets.556 Cleveland Cavaliers.646 Vancouver Canucks.585 Green Bay Packers.625 Texas Rangers.543 Portland Trail Blazers.622 Nashville Predators.573 New York Jets.625 N.Y. Yankees.537 Chicago Bulls.610 New York Islanders.573 Pittsburgh Steelers.625 Houston Astros.531 Dallas Mavericks.610 Minnesota Wild.561 Seattle Seahawks.625 Los Angeles Angels.525 Toronto Raptors.598 Calgary Flames.549 Houston Texans.563 San Francisco Giants.519 Washington Wizards.561 Washington Capitals.549 Washington Redskins.563 Minnesota Twins.512 New Orleans Hornets.549 Detroit Red Wings.524 Atlanta Falcons.500 Washington Nationals.512 Oklahoma City Thunder.549 Ottawa Senators.524 Buffalo Bills.500 Cleveland Indians.503 Milwaukee Bucks.500 Pittsburgh Penguins.524 Indianapolis Colts.500 Baltimore Orioles.500 Boston Celtics.488 Winnipeg Jets.524 Detroit Lions.438 Tampa Bay D-Rays.494 Phoenix Suns.476 Columbus Blue Jackets.512 New Orleans Saints.438 Arizona D-Backs.488 Brooklyn Nets.463 Boston Bruins.500 Oakland Raiders.438 Boston Red Sox.481 Indiana Pacers.463 Dallas Stars.500 Philadelphia Eagles.438 Chicago White Sox.469 Utah Jazz.463 Los Angeles Kings.488 St. Louis Rams.438 Seattle Mariners.469 Miami Heat.451 San Jose Sharks.488 Chicago Bears.375 Detroit Tigers.460 Charlotte Bobcats.402 Colorado Avalanche.476 Miami Dolpins.375 San Diego Padres.457 Detroit Pistons.390 Florida Panthers.463 New York Giants.375 Miami Marlins.438 Denver Nuggets.366 Philadelphia Flyers.402 Tampa Buccaneers.375 Colorado Rockies.420 Sacramento Kings.354 New Jersey Devils.390 Baltimore Ravens.313 Milwaukee Brewers.420 Orlando Magic.305 Carolina Hurricanes.366 Jacksonville Jaguars.313 Oakland Athletics.420 Los Angeles Lakers.256 Toronto Maple Leafs.366 San Francisco 49ers.313 Atlanta Braves.414 Philadelphia 76ers.220 Phoenix Coyotes.293 Dallas Cowboys.250 Cincinnati Reds.395 New York Knicks.207 Edmonton Oilers.293 San Diego Chargers.250 Philadelphia Phillies.389 Minnesota T-Wolves.195 Buffalo Sabres.280 Cleveland Browns.188 Tennessee Titans balance = ideal for n= ideal for n= ideal for n= ideal for n= actual for actual for actual for actual for balance index.656 balance index.610 balance index.336 balance index.538 Source: John Vrooman, Vanderbilt University
15
16
17
18
19
20
21
 + c (TVHH) coefficients significant @.01 2015 averages: NFL Values=$1965.9; Win%=.500; TVHH=1.")
22 Does it pay to win in the NFL? ($M) Years Win% Period Win% TVHH Base $225.9 $470.3 $1, $1,307.5 $474.9 $ $1,919.6 $446.0 $ $1,972.4 $452.1 $ $2,549.6 $ $106.6 Value = Base + b (Win%) + c (TVHH) coefficients 2015 averages: NFL Values=$1965.9; Win%=.500; TVHH=1.723 Source: John Vrooman, Vanderbilt University


23 National Football League Franchise Values 2015 Rank Team Value D/V Revenue Income V/R 1 Dallas Cowboys $4,000 5% $620 $ New England Patriots $3,200 7% $494 $ Washington Redskins $2,850 8% $439 $ New York Giants $2,800 18% $400 $ San Francisco 49ers $2,700 21% $427 $ New York Jets $2,600 23% $383 $ Houston Texans $2,500 7% $383 $ Chicago Bears $2,450 4% $352 $ Philadelphia Eagles $2,400 8% $370 $ Green Bay Packers $1,950 6% $347 $ Denver Broncos $1,940 6% $346 $ Baltimore Ravens $1,930 14% $345 $ Pittsburgh Steelers $1,900 11% $334 $ Indianapolis Colts $1,880 3% $321 $ Seattle Seahawks $1,870 6% $334 $ Miami Dolphins $1,850 19% $322 $ Atlanta Falcons $1,670 51% $303 $ Minnesota Vikings $1,590 31% $281 $ Carolina Panthers $1,560 4% $325 $ Arizona Cardinals $1,540 10% $308 $ Kansas City Chiefs $1,530 5% $307 $ San Diego Chargers $1,530 7% $304 $ New Orleans Saints $1,520 5% $322 $ Tampa Bay Buccaneers $1,510 12% $313 $ Cleveland Browns $1,500 13% $313 $ Tennessee Titans $1,490 10% $318 $ Jacksonville Jaguars $1,480 7% $315 $ St Louis Rams $1,450 8% $290 $ Cincinnati Bengals $1,450 7% $296 $ Detroit Lions $1,440 19% $298 $ Oakland Raiders $1,430 14% $285 $ Buffalo Bills $1,400 14% $296 $ Team Average $1,966 12% $347 $ Source: John Vrooman and Forbes

24 Major League Baseball Franchise Values 2015 Rank Team Value D/V Revenue Income V/R 1 New York Yankees $3,200 0% $508 $ Los Angeles Dodgers $2,400 17% $403 ($12.2) Boston Red Sox $2,100 0% $370 $ San Francisco Giants $2,000 4% $387 $ Chicago Cubs $1,800 24% $302 $ St Louis Cardinals $1,400 21% $294 $ New York Mets $1,350 26% $263 $ Los Angeles Angels $1,300 0% $304 $ Washington Nationals $1,280 27% $287 $ Philadelphia Phillies $1,250 8% $265 ($39.0) Texas Rangers $1,220 13% $266 $ Atlanta Braves $1,150 0% $267 $ Detroit Tigers $1,125 15% $254 ($20.7) Seattle Mariners $1,100 0% $250 $ Baltimore Orioles $1,000 15% $245 $ Chicago White Sox $975 5% $227 $ Pittsburgh Pirates $900 10% $229 $ Minnesota Twins $895 25% $223 $ San Diego Padres $890 22% $224 $ Cincinnati Reds $885 6% $227 $ Milwaukee Brewers $875 6% $226 $ Toronto Blue Jays $870 0% $227 ($17.9) Colorado Rockies $855 7% $214 $ Arizona Diamondbacks $840 17% $211 ($2.2) Cleveland Indians $825 9% $207 $ Houston Astros $800 34% $175 $ Oakland Athletics $725 8% $202 $ Kansas City Royals $700 8% $231 $ Miami Marlins $650 34% $188 $ Tampa Bay Rays $625 22% $188 $ Team Averages $1,200 13% $262 $ Source: John Vrooman and Forbes
25 National Basketball Association Franchise Values 2015 Rank Team Value D/V Revenue Income V/R 1 Los Angeles Lakers $2,600 2% $293 $ New York Knicks $2,500 0% $278 $ Chicago Bulls $2,000 3% $201 $ Boston Celtics $1,700 9% $173 $ Los Angeles Clippers $1,600 0% $146 $ Brooklyn Nets $1,500 19% $212 ($99.4) Golden State Warriors $1,300 12% $168 $ Houston Rockets $1,250 8% $175 $ Miami Heat $1,175 8% $188 $ Dallas Mavericks $1,150 17% $168 $ San Antonio Spurs $1,000 8% $172 $ Portland Trail Blazers $940 11% $153 $ Oklahoma City Thunder $930 15% $152 $ Toronto Raptors $920 16% $151 $ Cleveland Cavaliers $915 22% $149 $ Phoenix Suns $910 20% $145 $ Washington Wizards $900 14% $143 $ Orlando Magic $875 17% $143 $ Denver Nuggets $855 1% $136 $ Utah Jazz $850 6% $142 $ Indiana Pacers $830 18% $139 $ Atlanta Hawks $825 21% $133 $ Detroit Pistons $810 23% $144 $ Sacramento Kings $800 29% $125 $ Memphis Grizzlies $750 23% $135 $ Charlotte Bobcats $725 21% $130 $ Philadelphia 76ers $700 21% $125 $ New Orleans Pelicans $650 19% $131 $ Minnesota Timberwolves $625 16% $128 $ Milwaukee Bucks $600 29% $110 $ Team Averages $1,106 14% $159.6 $ Source: John Vrooman and Forbes

26 National Hockey League Franchise Values 2015 Rank Team 2015 Value D/V Revenue Income V/R 1 New York Rangers $1,200 0% $229 $ Montreal Canadiens $1,175 20% $219 $ Toronto Maple Leafs $1,150 11% $192 $ Chicago Blackhawks $925 0% $182 $ Boston Bruins $750 0% $158 $ Vancouver Canucks $745 11% $152 $ Philadelphia Flyers $660 9% $146 $ Detroit Red Wings $600 33% $135 $ Los Angeles Kings $580 16% $132 $ Washington Capitals $565 23% $132 $ Pittsburgh Penguins $560 20% $151 $ Edmonton Oilers $455 18% $119 $ Dallas Stars $450 33% $132 $ San Jose Sharks $445 11% $126 $ Calgary Flames $435 6% $130 $ Anaheim Ducks $400 16% $122 ($0.8) Minnesota Wild $380 30% $125 $ Ottawa Senators $370 34% $119 $ Colorado Avalanche $360 0% $106 ($3.7) Winnipeg Jets $350 37% $116 $ New Jersey Devils $330 79% $125 $ New York Islanders $325 31% $93 ($14.0) Buffalo Sabres $300 27% $113 $ St Louis Blues $270 24% $111 ($7.1) Tampa Bay Lightning $260 17% $121 ($1.4) Nashville Predators $255 33% $110 $ Columbus Blue Jackets $226 33% $99 $ Carolina Hurricanes $225 53% $99 ($11.7) Arizona Coyotes $220 63% $92 ($4.5) Florida Panthers $186 62% $93 ($20.2) Team Averages $505 25% $132.6 $ Source: John Vrooman and Forbes

27 NA Big Four and European Big Five League Revenues 2014 ($ Billions) League Revenues TV Revenues TV Percent Player Cost National Football League $10.0 $6.6 66% 49% Major League Baseball $8.0 $1.6 19% 47% English Premier League $5.3 $2.9 54% 58% National Basketball Association $4.8 $2.6 54% 46% National Hockey League $3.7 $0.6 17% 50% German Bundesliga $3.2 $0.9 27% 49% Spanish La Liga $2.7 $1.1 40% 60% Italian Serie A $2.3 $1.2 50% 70% French Ligue 1 $2.1 $1.0 47% 64% Source: Vrooman Sports Economics and Deloitte Sports Business Group E-rate 6/30/2014: 1 =.833 = $1.37 Expected EPL TV rights of 3 billion per season will jump to $4.7 billion at 1 = $1.5
 $6,580,000,000 9 2014-22 $4,065,000,000 1.")
 $633,000,000 10 2012-21 $148,000,000 4.28 NCAAB Tournament (67 games) $771,000,000 24 2011-34 $545,000,000 1.")
28 TV Rights Fees $7,000 $6,000 $5,000 $4,000 $3,000 $2,000 $1,000 $0 $6,580 $4,065 $2,600 $1,550 $930 $803 $633 $771 $545 $608 $148 $175 NFL NBA MLB NHL NCAAB CFP/BCS Annual rights Previous fees TV RIGHTS FEES EXPLOSION League Annual rights fees Years Term Previous fees Growth National Football League (season) $6,580,000, $4,065,000, National Basketball Association (season) $2,600,000, $930,000, Major League Baseball (season) $1,550,000, $803,000, National Hockey League (season) $633,000, $148,000, NCAAB Tournament (67 games) $771,000, $545,000, BCS/College Football Playoff (7 games) $608,000, $175,000, Source: Vanderbilt Sports Economics CFP Payouts $90.0 $80.0 $70.0 $60.0 $50.0 $40.0 $30.0 $20.0 $10.0 $0.0 $87.5 $83.5 $69.8 $60.0 $60.0 $58.0 $30.2 $30.2 $30.2 $30.2 $28.9 $23.9 SEC ACC PAC12 BIG10 BIG12 POWER 5 CFP 2015 BCS 2014
29 FBS BUDGET CONF REVENUE EXPENSE PROFIT 5%-REV SALARY RATIO HEAD COACH FBS BUDGET CONF REVENUE EXPENSE PROFIT 5%-REV SALARY RATIO HEAD COACH Texas Big 12 $ $38.43 $74.08 $5.63 $ % Charlie Strong Cincinnati AAC $14.56 $14.56 $0.00 $0.73 $ % Tommy Tuberville Alabama SEC $94.99 $41.72 $53.27 $4.75 $ % Nick Saban South Florida AAC $13.89 $12.13 $1.76 $0.69 $ % Willie Taggart Michigan Big Ten $91.38 $26.76 $64.63 $4.57 $ % Brady Hoke Southern Methodist AAC $12.94 $12.94 $0.00 $0.65 $ % June Jones LSU SEC $87.87 $37.86 $50.01 $4.39 $ % Les Miles Temple AAC $12.89 $12.89 $0.00 $0.64 $ % Matt Rhule Notre Dame Ind. $80.56 $32.76 $47.80 $4.03 $ % Brian Kelly Colorado State Mt. West $12.04 $12.04 $0.00 $0.60 $ % Jim McElwain Georgia SEC $77.16 $27.25 $49.91 $3.86 $ % Mark Richt Memphis AAC $11.94 $11.94 $0.00 $0.60 $ % Justin Fuente Oklahoma Big 12 $71.37 $28.11 $43.26 $3.57 $ % Bob Stoops San Diego State Mt. West $11.83 $ $0.56 $0.59 $ % Rocky Long Tennessee SEC $70.48 $21.67 $48.81 $3.52 $ % Butch Jones Texas-El Paso CUSA $11.76 $8.66 $3.10 $0.59 $ % Sean Kugler Florida SEC $69.25 $23.04 $46.21 $3.46 $ % Will Muschamp Rice CUSA $11.54 $11.54 $0.00 $0.58 $ % David Bailiff Penn State Big Ten $68.02 $31.49 $36.53 $3.40 $ % James Franklin Fresno State Mt. West $11.15 $10.32 $0.83 $0.56 $ % Tim DeRuyter Washington PAC-12 $67.73 $29.10 $38.63 $3.39 $ % Chris Petersen Connecticut AAC $10.63 $ $3.75 $0.53 $ % Bob Diaco Ohio State Big Ten $65.77 $23.38 $42.39 $3.29 $ % Urban Meyer Tulsa AAC $10.01 $10.01 $0.00 $0.50 $ % Bill Blankenship Nebraska Big Ten $60.16 $23.84 $36.32 $3.01 $ % Bo Pelini East Carolina AAC $9.96 $9.88 $0.08 $0.50 $ % Ruffin McNeill Texas A&M SEC $57.72 $23.73 $34.00 $2.89 $ % Kevin Sumlin Hawaii Mt. West $9.82 $9.82 $0.00 $0.49 $ % Norm Chow Florida State ACC $57.39 $32.86 $24.53 $2.87 $ % Jimbo Fisher Wyoming Mt. West $9.63 $7.51 $2.11 $0.48 $ % Craig Bohl Arkansas SEC $57.06 $28.07 $28.98 $2.85 $ % Bret Bielema Houston AAC $9.38 $9.38 $0.00 $0.47 $ % Tony Levine Oregon PAC-12 $55.98 $18.23 $37.75 $2.80 $ % Mark Helfrich North Texas CUSA $9.13 $7.33 $1.80 $0.46 $ % Dan McCarney South Carolina SEC $55.62 $26.10 $29.51 $2.78 $ % Steve Spurrier Middle Tennessee State CUSA $9.04 $9.04 $0.00 $0.45 $ % Rick Stockstill Iowa Big Ten $53.62 $24.13 $29.49 $2.68 $ % Kirk Ferentz Alabama at Birmingham CUSA $8.98 $8.96 $0.02 $0.45 $ % Bill Clark Michigan State Big Ten $52.79 $26.68 $26.12 $2.64 $ % Mark Dantonio Marshall CUSA $8.64 $8.25 $0.39 $0.43 $ % Doc Holliday Auburn SEC $49.64 $49.64 $0.00 $2.48 $ % Gus Malzahn Florida Atlantic CUSA $8.44 $8.44 $0.00 $0.42 $ % Charlie Partridge Arizona State PAC-12 $48.98 $27.12 $21.86 $2.45 $ % Todd Graham Ohio MAC $8.42 $7.70 $0.71 $0.42 $ % Frank Solich Oklahoma State Big 12 $48.64 $22.23 $26.41 $2.43 $ % Mike Gundy Nevada-Las Vegas Mt. West $8.34 $8.34 $0.00 $0.42 $ % Bobby Hauck Wisconsin Big Ten $47.28 $31.28 $16.00 $2.36 $ % Gary Andersen Northern Illinois MAC $8.31 $8.31 $0.00 $0.42 $ % Rod Carey Southern California PAC-12 $44.84 $30.28 $14.57 $2.24 $ % Steve Sarkisian New Mexico Mt. West $8.03 $8.03 $0.00 $0.40 $ % Bob Davie Mississippi SEC $43.99 $24.17 $19.83 $2.20 $ % Hugh Freeze Massachusetts MAC $7.82 $7.82 $0.00 $0.39 $ % Mark Whipple Virginia Tech ACC $43.37 $22.39 $20.98 $2.17 $ % Frank Beamer Western Kentucky CUSA $7.79 $7.79 $0.00 $0.39 $ % Jeff Brohm Clemson ACC $42.43 $24.75 $17.68 $2.12 $ % Dabo Swinney Louisiana-Lafayette Sun Belt $7.75 $7.75 $0.00 $0.39 $ % Mark Hudspeth Texas Christian Big 12 $40.45 $34.65 $5.80 $2.02 $ % Gary Patterson Southern Mississippi CUSA $7.40 $7.40 $0.00 $0.37 $ % Todd Monken Minnesota Big Ten $39.82 $27.76 $12.06 $1.99 $ % Jerry Kill Toledo MAC $7.39 $7.39 $0.00 $0.37 $ % Matt Campbell Syracuse ACC $38.53 $23.62 $14.91 $1.93 $ % Scott Shafer Western Michigan MAC $7.34 $7.34 $0.00 $0.37 $ % P.J. Fleck Texas Tech Big 12 $38.26 $16.00 $22.26 $1.91 $ % Kliff Kingsbury Texas-San Antonio CUSA $7.26 $7.26 $0.00 $0.36 $ % Larry Coker North Carolina State ACC $38.02 $17.99 $20.03 $1.90 $ % Dave Doeren Miami (Ohio) MAC $7.19 $7.19 $0.00 $0.36 $ % Chuck Martin Utah PAC-12 $36.85 $16.14 $20.71 $1.84 $ % Kyle Whittingham South Alabama Sun Belt $7.16 $7.48 -$0.32 $0.36 $ % Joey Jones Stanford PAC-12 $36.75 $20.86 $15.88 $1.84 $ % David Shaw Florida International CUSA $7.16 $7.16 $0.00 $0.36 $ % Ron Turner Georgia Tech ACC $34.31 $18.99 $15.31 $1.72 $ % Paul Johnson New Mexico State Sun Belt $7.01 $7.01 $0.00 $0.35 $ % Doug Martin Kentucky SEC $34.08 $17.21 $16.87 $1.70 $ % Mark Stoops Akron MAC $6.76 $6.76 $0.00 $0.34 $ % Terry Bowden Missouri SEC $34.06 $21.42 $12.64 $1.70 $ % Gary Pinkel Buffalo MAC $6.69 $6.69 $0.00 $0.33 $ % Jeff Quinn Miami ACC $33.53 $27.92 $5.61 $1.68 $ % Al Golden Tulane AAC $6.59 $ $3.91 $0.33 $ % Curtis Johnson California PAC-12 $33.27 $22.18 $11.09 $1.66 $ % Sonny Dykes Ball State MAC $6.51 $6.51 $0.00 $0.33 $ % Pete Lembo North Carolina ACC $33.26 $17.98 $15.28 $1.66 $ % Larry Fedora Bowling Green MAC $6.41 $6.41 $0.00 $0.32 $ % Dino Babers Kansas State Big 12 $32.73 $16.64 $16.09 $1.64 $ % Bill Snyder Nevada Mt. West $6.39 $6.30 $0.09 $0.32 $ % Brian Polian Northwestern Big Ten $31.48 $22.64 $8.84 $1.57 $ % Pat Fitzgerald Utah State Mt. West $6.27 $6.27 $0.00 $0.31 $ % Matt Wells Iowa State Big 12 $30.97 $14.46 $16.51 $1.55 $ % Paul Rhoads Louisiana Tech CUSA $6.23 $6.02 $0.21 $0.31 $ % Skip Holtz UCLA PAC-12 $30.35 $24.09 $6.26 $1.52 $ % Jim Mora Georgia State Sun Belt $6.13 $6.13 $0.00 $0.31 $ % Trent Miles Illinois Big Ten $30.32 $16.56 $13.76 $1.52 $ % Tim Beckman Texas State Sun Belt $6.05 $6.05 $0.00 $0.30 $ % Dennis Franchione Arizona PAC-12 $29.26 $28.20 $1.06 $1.46 $ % Rich Rodriguez Arkansas State Sun Belt $5.94 $5.94 $0.00 $0.30 $ % Blake Anderson Colorado PAC-12 $28.43 $17.35 $11.08 $1.42 $ % Mike MacIntyre Idaho Sun Belt $5.89 $5.89 $0.00 $0.29 $ % Paul Petrino Oregon State PAC-12 $28.33 $14.37 $13.96 $1.42 $ % Mike Riley Troy Sun Belt $5.80 $5.13 $0.66 $0.29 $ % Larry Blakeney Baylor Big 12 $28.32 $24.57 $3.74 $1.42 $ % Art Briles Kent State MAC $5.76 $5.18 $0.58 $0.29 $ % Paul Haynes Pittsburgh ACC $28.23 $20.20 $8.03 $1.41 $ % Paul Chryst Eastern Michigan MAC $5.55 $6.30 -$0.75 $0.28 $ % Chris Creighton Virginia ACC $28.23 $20.19 $8.03 $1.41 $ % Mike London Georgia Southern Sun Belt $4.57 $4.35 $0.22 $0.23 $ % Willie Fritz Mississippi State SEC $27.14 $15.30 $11.84 $1.36 $ % Dan Mullen San Jose State Mt. West $4.39 $6.67 -$2.28 $0.22 $ % Ron Caragher Washington State PAC-12 $26.99 $15.71 $11.28 $1.35 $ % Mike Leach Appalachian State Sun Belt $4.30 $4.30 $0.00 $0.22 $ % Scott Satterfield Louisville ACC $26.52 $21.57 $4.95 $1.33 $ % Bobby Petrino Louisiana-Monroe Sun Belt $4.11 $4.11 $0.00 $0.21 $ % Todd Berry Indiana Big Ten $26.24 $17.65 $8.59 $1.31 $ % Kevin Wilson Central Michigan MAC $3.90 $5.87 -$1.97 $0.19 $ % Dan Enos Duke ACC $25.24 $20.58 $4.66 $1.26 $ % David Cutcliffe Vanderbilt SEC $24.98 $21.50 $3.47 $1.25 $ % Derek Mason Boston College ACC $23.99 $19.92 $4.07 $1.20 $ % Steve Addazio Kansas Big 12 $23.18 $14.84 $8.33 $1.16 $ % Charlie Weis Brigham Young Ind. $22.21 $15.24 $6.98 $1.11 $ % Bronco Mendenhall Maryland Big Ten $21.72 $15.40 $6.32 $1.09 $ % Randy Edsall Central Florida AAC $21.27 $19.64 $1.63 $1.06 $ % George O'Leary Rutgers Big Ten $20.81 $19.22 $1.59 $1.04 $ % Kyle Flood Purdue Big Ten $19.79 $15.33 $4.46 $0.99 $ % Darrell Hazell Boise State Mt. West $18.98 $11.52 $7.45 $0.95 $ % Bryan Harsin Wake Forest ACC $18.69 $18.69 $0.00 $0.93 $ % Dave Clawson West Virginia Big 12 $18.61 $16.98 $1.63 $0.93 $ % Dana Holgorsen

30 Marketing 17% Concessions 5% NFL Money National TV 37% Luxury boxes 5% Home games 12% Road games 6% NFL Properties 18%
31 Green Bay Packers' Revenues ($millions) $400 $350 $300 $250 $200 $150 National 60% $100 $50 Local 40% $ Packers' Revenue Local Revenue $43.1 $47.1 $60.5 $79.2 $89.5 $93.1 $93.2 $105.8 $100.8 $100.4 $119.3 $130.4 $128.2 $136.4 $149.3 National Revenue $80.7 $84.9 $92.6 $99.9 $110.8 $115.3 $124.9 $135.6 $147.1 $157.6 $163.3 $171.6 $179.9 $187.7 $226.4 Operating Income $123.8 $132.0 $153.1 $179.1 $200.3 $208.4 $218.1 $241.3 $247.9 $258.0 $282.6 $302.0 $308.1 $324.1 $375.7 League-wide* Local Revenue* $1,336 $1,508 $1,936 $2,535 $2,865 $2,979 $2,982 $3,384 $3,226 $3,212 $3,818 $4,173 $4,102 $4,365 $4,778 National Revenue* $2,502 $2,717 $2,964 $3,196 $3,546 $3,690 $3,996 $4,338 $4,708 $5,044 $5,226 $5,491 $5,757 $6,006 $7,245 Total NFL Revenue* $3,838 $4,224 $4,899 $5,731 $6,411 $6,669 $6,978 $7,723 $7,934 $8,256 $9,043 $9,664 $9,859 $10,371 $12,022 Local Revenue 34.8% 35.7% 39.5% 44.2% 44.7% 44.7% 42.7% 43.8% 40.7% 38.9% 42.2% 43.2% 41.6% 42.1% 39.7% National Revenue 65.2% 64.3% 60.5% 55.8% 55.3% 55.3% 57.3% 56.2% 59.3% 61.1% 57.8% 56.8% 58.4% 57.9% 60.3% *Estimated as multiple of number of team s
32 NFL Salary Cap Room 2015 NFL Team 2015 Salary Cap 2014 Carryover Team Cap Cap Room Jacksonville Jaguars $143,280,000 $21,768,205 $133,405,931 $35,080,176 Cleveland Browns $143,280,000 $18,908,285 $139,962,500 $21,804,900 Tennessee Titans $143,280,000 $11,254,828 $133,405,170 $20,948,408 Oakland Raiders $143,280,000 $7,400,000 $132,443,714 $19,429,042 Cincinnati Bengals $143,280,000 $8,697,310 $134,957,680 $17,172,755 Dallas Cowboys $143,280,000 $3,260,740 $131,826,707 $16,751,606 Atlanta Falcons $143,280,000 $2,845,290 $130,098,815 $16,150,000 Green Bay Packers $143,280,000 $7,791,106 $136,021,411 $15,449,695 San Francisco 49ers $143,280,000 $4,206,936 $135,886,273 $13,969,707 Carolina Panthers $143,280,000 $4,939,773 $136,059,030 $13,312,607 Miami Dolphins $143,280,000 $7,770,411 $139,930,169 $12,996,768 Philadelphia Eagles $143,280,000 $15,715,700 $146,957,769 $12,914,609 Tampa Bay Buccaneers $143,280,000 $1,063,033 $133,214,572 $11,695,317 Indianapolis Colts $143,280,000 $7,699,867 $141,191,587 $11,231,805 AVERAGE/TEAM $143,280,000 $5,670,168 $138,155,092 $11,227,360 Seattle Seahawks $143,280,000 $4,825,000 $138,639,492 $9,618,246 Kansas City C hiefs $143,280,000 $2,246,790 $136,991,931 $9,152,269 Chicago Bears $143,280,000 $1,545,934 $136,823,755 $8,344,679 Houston Texans $143,280,000 $966,613 $137,923,166 $8,102,580 Washington Redskins $143,280,000 $108,621 $138,532,710 $8,059,035 Minnesota Vikings $143,280,000 $5,723,960 $141,582,305 $8,045,655 Arizona Cardinals $143,280,000 $4,256,919 $140,557,466 $7,958,400 Baltimore Ravens $143,280,000 $5,791,927 $137,769,295 $7,361,832 New England Patriots $143,280,000 $6,442,054 $137,478,636 $7,065,769 Pittsburgh Steelers $143,280,000 $778,469 $137,121,377 $6,937,092 Buffalo Bills $143,280,000 $2,647,907 $138,606,518 $6,613,812 Denver Broncos $143,280,000 $5,870,000 $144,140,611 $5,925,413 San Diego Chargers $143,280,000 $1,500,000 $137,425,035 $5,547,577 New York Jets $143,280,000 $12,619,394 $151,157,046 $4,992,348 New York Giants $143,280,000 $151,000 $138,626,286 $4,785,597 St. Louis Rams $143,280,000 $0 $140,070,796 $4,602,591 New Orleans Saints $143,280,000 $1,710,130 $140,894,728 $4,197,702 Detroit Lions $143,280,000 $939,171 $141,260,449 $3,057,542 TOTAL $4,728,240,000 $187,115,541 $4,559,118,022 $370,502,894 Source: NFLPA
33 Estimated NFL Salary Cap Space 2016 Season Team (22 February 2016) Cap Space 2016 Cap 2015 Carryover 2016 Team Cap 2016 Spending Dead Money Jacksonville Jaguars $79,803,211 $155,000,000 $32,837,428 $187,837,428 $107,745,479 $288,738 Oakland Raiders $74,275,436 $155,000,000 $13,404,867 $168,404,867 $93,709,095 $420,336 Chicago Bears $60,453,041 $155,000,000 $1,064,464 $156,064,464 $89,124,626 $6,486,797 New York Giants $58,623,872 $155,000,000 $11,240,106 $166,240,106 $97,910,603 $9,705,631 St. Louis Rams $58,346,856 $155,000,000 $933,521 $155,933,521 $91,126,940 $6,459,725 San Francisco 49ers $55,239,714 $155,000,000 $12,644,186 $167,644,186 $105,788,006 $6,616,466 Tennessee Titans $50,694,155 $155,000,000 $20,830,676 $175,830,676 $118,801,271 $6,335,250 Tampa Bay Buccaneers $49,392,453 $155,000,000 $8,268,998 $163,268,998 $113,486,308 $390,237 Cleveland Browns $42,098,128 $155,000,000 $21,359,144 $176,359,144 $132,647,188 $1,613,828 Cincinnati Bengals $38,723,157 $155,000,000 $7,712,902 $162,712,902 $123,796,474 $193,271 Kansas City Chiefs $32,733,632 $155,000,000 $2,847,838 $157,847,838 $124,880,558 $233,648 Houston Texans $32,094,427 $155,000,000 $3,099,555 $158,099,555 $125,610,546 $394,582 San Diego Chargers $31,774,386 $155,000,000 $2,343,426 $157,343,426 $123,146,867 $2,422,173 NFL Averages $30,138,361 $155,000,000 $6,442,954 $161,442,954 $127,759,949 $3,544,643 Atlanta Falcons $27,489,014 $155,000,000 $3,905,771 $158,905,771 $116,377,511 $15,039,246 Detroit Lions $26,226,314 $155,000,000 $880,941 $155,880,941 $128,294,333 $1,360,294 Philadelphia Eagles $25,998,040 $155,000,000 $7,280,362 $162,280,362 $132,010,114 $4,272,208 Indianapolis Colts $24,559,614 $155,000,000 $4,997,504 $159,997,504 $129,042,916 $6,394,974 Minnesota Vikings $24,534,868 $155,000,000 $2,384,159 $157,384,159 $132,363,905 $485,386 Seattle Seahawks $23,029,279 $155,000,000 $199,087 $155,199,087 $128,891,764 $3,278,044 Carolina Panthers $22,365,540 $155,000,000 $3,749,950 $158,749,950 $132,513,407 $3,871,003 Green Bay Packers $21,865,614 $155,000,000 $7,452,597 $162,452,597 $139,908,390 $678,593 Arizona Cardinals $19,542,095 $155,000,000 $3,084,788 $158,084,788 $138,290,644 $252,049 New York Jets $14,043,256 $155,000,000 $2,484,216 $157,484,216 $142,872,226 $568,734 Washington Redskins $13,372,122 $155,000,000 $6,112,784 $161,112,784 $147,167,498 $573,164 Dallas Cowboys $11,831,119 $155,000,000 $3,852,589 $158,852,589 $146,120,394 $901,076 Miami Dolphins $8,661,763 $155,000,000 $9,137,544 $164,137,544 $150,156,354 $5,319,427 Pittsburgh Steelers $8,445,842 $155,000,000 $3,000,327 $158,000,327 $148,789,297 $765,188 Denver Broncos $8,161,005 $155,000,000 ($700,000) $154,300,000 $145,212,357 $926,638 New Orleans Saints $7,441,957 $155,000,000 $1,400,000 $156,400,000 $126,686,198 $22,271,845 Baltimore Ravens $6,310,966 $155,000,000 $1,633,944 $156,633,944 $150,121,620 $201,358 New England Patriots $6,086,955 $155,000,000 $2,263,507 $157,263,507 $150,778,152 $398,400 Buffalo Bills $209,715 $155,000,000 $4,467,331 $159,467,331 $154,947,341 $4,310,275 NFL Totals $964,427,546 $4,960,000,000 $206,174,512 $5,166,174,512 $4,088,318,382 $113,428, Players Share = 48.5% of $11.62B Revenues = $5.64B -12% Player Benefits ($676M)= $4.96B/32 clubs = $155M per club Source: John Vooman and Jordan Matthews 2014 NFL Draft Round 2, Pick 42 (Eagles) Year Base Salary Prorated Bonus Cap Number Actual Payroll Dead Money 2014 $420,000 $479,867 $899,867 $2,339, $644,967 $479,867 $1,124,834 $644, $869,934 $479,867 $1,349,801 $869,934 $479, $1,094,901 $479,867 $1,574,768 $1,094,901 $479,867 Total $3,029,802 $1,919,468 $4,949,270 $4,949,270 $959,734 Average $757,451 $479,867 $1,237,318 $1,237,318
Sports. Baseball. PERSONALIZE your cake by adding your own message, photo & icing colors Includes three baseball player figurines!
 PERSONALIZE Includes three baseball player figurines! Shown on ¼ Two Tier Cake Serves 64 100/170 cal. per slice 3 + WARNING Baseball 65 Decopac/MLBP 2013 Anaheim Angels #4672 Arizona Diamondbacks #4709
BASEBALL AND THE AMERICAN CITY: An examination of public financing and stadium construction in American professional sports.
 BASEBALL AND THE AMERICAN CITY: An examination of public financing and stadium construction in American professional sports. By Brian Reich April 30, 2001 http://www.stadiummouse.com/ APPENDICIES 1A 1B
Each Price $25 $21 $15 $8 $20 NFL
 Date: Name: Omaha, NE: 402.334.3485 Columbus, OH: 614.527.1200 PO#: Email Address: Minimum order policy of $100. A $4 fee will be added to orders under $100. All items are subject to collective MOQ and
New York Sports - New York Yankees (MLB)
") New York Sports - New York Yankees (MLB) Spielplan der Saison 2018 EDV-Code: NYC1NX Datum Gegner Uhrzeit April 02.04.18 Tampa Bay Rays TBD 04.04.18 Tampa Bay Rays TBD 05.04.18 Baltimore Orioles TBD 06.04.18
New York Sports - New York Yankees (MLB) Spielplan der Saison 2018 EDV-Code: NYC1NX Datum Gegner Uhrzeit April 02.04.18 Tampa Bay Rays TBD 04.04.18 Tampa Bay Rays TBD 05.04.18 Baltimore Orioles TBD 06.04.18
Take Me Out to the Ball Game. By: Sarah Gates
 Take Me Out to the Ball Game By: Sarah Gates Geographic Question: How does the location of major league sports teams correlate to population patterns of the U.S.? Overview: At the middle to high school
Spirit Cups. $20.00 Beverage 4-pack. 18 ounces of your favorite cold beverage goes here. Heavy-gauge plastic make these cups victorious for years
 Spirit Cups 18 ounces of your favorite cold beverage goes here Heavy-gauge plastic make these cups victorious for years Did you know? You can order an NFL Fan Pack through this catalog. An NFL Fan Pack
Sports & Outdoors. Sports & Outdoors DecoPac
 Sports & Outdoors 2016 DecoPac - 20605 Selecting Your Cake Size and Cake Format How many guests do you expect? Figure at least one slice of cake per guest. Cakes are traditionally cut in 1" x 2" slices
National Football League
 1 Albo d Oro 1920 Akron PROS - 1921 Chicago STALEYS - 1922 Canton BULLDOGS - 1923 Canton BULLDOGS - 1924 Cleveland BULLDOGS - 1925 Chicago CARDINALS - 1926 Frankford YELLOW JACKETS - 1927 New York GIANTS
OVER 350 DESIGNS AVAILABLE ALL FEATURING EXCLUSIVE 3D ANIMATION
 OVER 350 DESIGNS AVAILABLE ALL FEATURING EXCLUSIVE 3D ANIMATION ALL 32 NATIONAL FOOTBALL LEAGUE TEAMS! $36.00 NFL Team Fan Pack Includes a 4-pack of s and a 2-pack of s of the same NFL Team! ALL 30 MAJOR
Show your support with. $20 FULL-IMAGE 3D Tumblers purchase featuring designs in everyone s favorite teams!
 Show your support with 20 FULL-IMAGE 3D Tumblers purchase featuring designs in everyone s favorite teams! DESIGNS IN AMERICA S FAVORITE TEAMS all 32 NFL Teams all 30 MLB Clubs 30 NHL Teams Top 75 Colleges
Sears Directors' Cup Final Standings
 1 North Carolina 529.0 24.5 0 0.0 16 49.0 11 54.0 0 0 0 0 17 44.5 6 58.5 26 37.5 0.0 0 5 58.5 0 0.0 806.5 2 Stanford 507.5 40.5 36 24.5 7 58.0 1 64.0 0 0 2 63.0 2 63.0 18 47.0 0.0 0 0.0 0 0.0 0 0 0.0 786.5
NFL ATTENDANCE BY TEAM
 NFL ATTENDANCE BY TEAM Team Facility Year Built Capacity 2015 Average Attendance % of Capacity Dallas Cowboys AT&T Stadium 2009 80,000 91,459 114% Indianapolis Colts Lucas Oil Field 2008 62,421 66,048
Web Address: Address: 2018 Official Rules Summary
 2018 Official Rules Summary 1. $5.00 per week per entry over 17 weeks of the regular season and $5.00 for the playoffs. ($90.00 total for season). No limit on the number of entries per person each week.
Phoenix Cardinals. Record: 7-9 t-3rd Place - NFC East Head Coach: Gene Stallings Defense: 4-3 Against Runs: Average to Poor; Against Passes: Poor
 Phoenix Cardinals Record: 7-9 t-3rd Place - NFC East Head Coach: Gene Stallings Defense: 4-3 Against Runs: Average to Poor; Against Passes: Poor Sun Devil Stadium - 70,491 Atlanta Falcons Record: 5-11
Professional Football in Texas
 Professional Football in Texas Professional football first arrived in Texas in the fall of 152 when a 1-member syndicate purchased the National Football League franchise that had been known as the New
AKRON, UNIVERSITY OF $16,388 $25,980 $10,447 $16,522 $14,196 $14,196 $14,196 ALABAMA, UNIVERSITY OF $9,736 $19,902 N/A N/A $14,464 $14,464 $14,464
 AKRON, UNIVERSITY OF $16,388 $25,980 $10,447 $16,522 $14,196 $14,196 $14,196 ALABAMA, UNIVERSITY OF $9,736 $19,902 N/A N/A $14,464 $14,464 $14,464 ALBANY LAW SCHOOL OF UNION UNIVERSITY $35,079 $35,079
Phoenix Cardinals. Record: th Place - NFC East Head Coach: Joe Bugel Defense: 3-4 Against Runs and Passes: Poor. Sun Devil Stadium - 74,865
 Phoenix Cardinals Record: 4-12 5th Place - NFC East Head Coach: Joe Bugel Against Runs and Passes: Poor Sun Devil Stadium - 74,865 Atlanta Falcons Record: 10-6 2nd Place - NFC West (Wild Card) Lost - NFC
All-Time College Football Attendance (Includes all divisions and non-ncaa teams) No. Total P/G Yearly Change No. Total P/G Yearly Change Year Teams
 No. Total P/G Yearly Change No. Total P/G Yearly Change Year Teams") Attendance Records All-Time College Football Attendance... 2 All-Time NCAA Attendance... 2 Annual Conference Attendance Leaders... 4 Largest Regular-Season Crowds... 11 2010 Attendance... 11 Annual Team
Attendance Records All-Time College Football Attendance... 2 All-Time NCAA Attendance... 2 Annual Conference Attendance Leaders... 4 Largest Regular-Season Crowds... 11 2010 Attendance... 11 Annual Team
FUNDRAISING CATALOG ALL PRODUCTS OFFICIALLY LICENSED
 FUNDRAISING CATALOG ALL PRODUCTS OFFICIALLY LICENSED SCST V-8/15 NHL and the NHL Shield are registered trademarks of the National Hockey League. All NHL logos and marks and NHL team logos and marks depicted
STATE OF THE INDUSTRY: WHERE WE VE BEEN, WHERE WE ARE, WHERE WE RE GOING
 STATE OF THE INDUSTRY: WHERE WE VE BEEN, WHERE WE ARE, WHERE WE RE GOING Welcome to Design and Build An Exciting Time for the Sports Facility Industry $8.05 Billion in Major League Sports Projects Currently
4. Fortune magazine publishes the list of the world s billionaires annually. The 1992 list (Fortune,
 Class 2 1. For each of the following variables, indicate with Q or C whether it is a quantitative variable or a categorical variable. a. the color of a M&M candy b. the weight of an airplane c. the life
Division I Sears Directors' Cup Final Standings
 1 Stanford (Calif.) 747.5 112.5 4 61.0 4 61.0 34 29.5 0 0.0 0 0.0 0 0.0 0 0.0 1 64.0 1 64.0 12 52.5 11 53.5 1 64.0 1084.5 2 North Carolina 631.5 0 0.0 21 43.5 10 55.0 3 61.5 0 0.0 0 0.0 0 0.0 0 0.0 41
2019 NFL SCHEDULE ANNOUNCED
 FOR USE AS DESIRED 4/17/19 2019 NFL SCHEDULE ANNOUNCED Complete 256-Game Regular-Season Schedule Available on NFL.com The NFL announced today its 17-week, 256-game regular-season schedule in 2019, which
Centre City Development Corporation NFL Stadium Financing Background
 Presentation To: Centre City Development Corporation NFL Stadium Financing Background January 2010 Overview Stadium Development Background Review of Recent NFL Stadiums Appendix A Summary Tables Appendix
Michele Luck s Social Studies & Other Teacher Resources
 Michele Luck s Social Studies & Other Teacher Resources If you like this product, please visit my store for other Analysis Ac8vi8es, Scavenger Hunts, Archeological Digs, Walking Gallery Tours, Centers
HOME COURT ADVANTAGE REPORT. March 2013
 HOME COURT ADVANTAGE REPORT March 2013 Execu4ve Summary While Sacramento and Sea6le both have great legacies as NBA ci>es, Sacramento has proven to be a superior NBA market in several respects In terms
Kevin Greene. Kevin Greene, a fifth-round draft pick of the Los Angeles Rams in the 1985 NFL Draft,
 Kevin Greene Kevin Greene, a fifth-round draft pick of the Los Angeles Rams in the 1985 NFL Draft, quickly developed into one of the most punishing pass rushers in league history. A walk-on at Auburn he
PLAYOFF RACES HEATING UP AS NFL SEASON ROLLS ON
 FOR IMMEDIATE RELEASE 11/13/12 http://twitter.com/nfl345 PLAYOFF RACES HEATING UP AS NFL SEASON ROLLS ON The NFL has entered the second half of the season and the excitement is building as playoff races
2014 MAJOR LEAGUE LEAGUE BASEBALL ATTENDANCE NOTES
 2014 MAJOR LEAGUE LEAGUE BASEBALL ATTENDANCE NOTES This is a brief summary of 2014 Major League Baseball attendance. It includes league and team attendance in the pages that follow the notes below. The
 Page 1 of 15 SB Nation Login Sign Up Search NFL NBA MLB NHL CFB CBB UFC Soccer NASCAR Fantasy Golf Tennis Video Local Cycling Boxing Horse Racing Running Water Polo Wrestling more All 312 Blogs Arizona
MORE EXCITING FOOTBALL AHEAD AS NFL ENTERS WEEK 3
 MORE EXCITING FOOTBALL AHEAD AS NFL ENTERS WEEK 3 Two games down. Fourteen more to go. Eight teams are off to strong starts at 2-0: Baltimore, Denver, Houston, Minnesota, New England, the New York Giants,
Lesson 5 Post-Visit Do Big League Salaries Equal Big Wins?
 Lesson 5 Post-Visit Do Big League Salaries Equal Big Wins? Objective: Students will be able to: Determine the average salary of a Major League Baseball player. Use charts to locate information. Compare
NFL SCHEDULE SAMPLE. Green Bay
 Scott Kellen NFL SCHEDULE SAMPLE Thursday game Monday night Green Bay DATE HA OPPONENT 7 9/11/2016 A Jacksonville Jaguars 7.33 9/18/2016 7 A Minnesota Vikings 9.55 9/25/2016 7 H Detroit Lions 7.24 BYE
Lesson 2 Pre-Visit Big Business of the Big Leagues
 Lesson 2 Pre-Visit Big Business of the Big Leagues Objective: Students will be able to: Identify several sources of revenue for Major League Baseball teams. Use math skills to estimate team revenue from
Bowl Predictions for 2013
 Bowl Predictions for 2013 1 Gildan New Mexico Bowl Albuquerque NM; University Stadium, Dec. 21, 2 p.m. ESPN. Washington State Colorado State Adam Cz 35 31 Carl Erikson 36 33 Chris Pool Master Andrews 28
NFL Calendar 2019 NFL Draft
 NFL Calendar 2019 NFL Draft NFL Calendar 2019 Thru the NFL Draft 2019 February 3: Super Bowl Atlanta, Georgia February 19 First day for clubs to designate Franchise or Transition Players. Feb 26-March
2018 PRODUCT CATALOG LICENSED GOLF ACCESSORIES
 2018 PRODUCT CATALOG LICENSED GOLF ACCESSORIES TABLE OF CONTENTS TEAM Code LIST switchblade divot tools & golf chips golf chip packs, divot tool packs & cap clips ball markers & SIGNATURE divot tools golf
Bowl Predictions for 2015
 Bowl Predictions for 2015 1 Air Force Reserve Celebration Bowl Atlanta; Georgia Dome, Dec. 19, Noon; ABC. Alcorn State North Carolina A+T Mark Fitz 32 21 Guru Geoff 35 24 Chris Pool Master Andrews 31 21
!"#$%&''('% )*++#,-.*/ Your Home for Officially Licensed Pro & College Merchandise
*++#,-.*/ Your Home for Officially Licensed Pro & College Merchandise") !"#$%&''('% )*++#,-.*/ Your Home for Officially Licensed Pro & College Merchandise (37 ) Vertical Flags Designed to hang vertically from an outdoor pole or side as wall decor. Durable polyester flag measures
!"#$%&''('% )*++#,-.*/ Your Home for Officially Licensed Pro & College Merchandise (37 ) Vertical Flags Designed to hang vertically from an outdoor pole or side as wall decor. Durable polyester flag measures
American League Ballpark
 American League Ballpark Baltimore Orioles Oriole Park at Camden Yards open1992 Left Foul Line: 333feet/101.6m Left Power Alley: 364feet/111m Center Field: 400feet/122m Deep Center: 410feet/125m Right
TV & Digital Research Update
 TV & Digital Research Update 2014-15 COLLEGE FOOTBALL BOWL SEASON KEY TAKEAWAYS- Non-CFP Bowls were down one-tenth of a point from averages of the last three years. ESPN added three new bowls for the 2014-15
NFL SCHEDULE SAMPLE. Green Bay
 NFL SCHEDULE SAMPLE Thursday game Opponent off bye week Monday night Green Bay DATE HA OPPONENT 7 9/11/2016 A Jacksonville Jaguars 7.33 9/18/2016 7 A Minnesota Vikings 9.55 9/25/2016 7 H Detroit Lions
2015 Baltimore Orioles
 Baltimore Orioles Record: 81-81 3rd Place American League East Manager: Buck Showalter Oriole Park at Camden Yards - 45,971 Day: 1-8 Good, 9-15 Average, 16-20 Bad Night: 1-4 Good, 5-15 Average, 16-20 Bad
Double Play System 1.0
 Double Play System 1.0 A step-by-step system for the MLB 2011 Season By James Jones The DPS 1.0 System is a very simple and effective system. There are two steps you must follow. 1) How to detect when
2015 COLLEGE & PRO FOOTBALL NEWSLETTER
 LOGICAL APPROACH P. O. Box 20405 - - - Las Vegas, NV 89112 - - - (702) 898-9802 Visit us on the Web at www.thelogicalapproach.com 2015 COLLEGE & PRO FOOTBALL NEWSLETTER Issue # 5 Games of October 1-5,
NFL SCHEDULE SAMPLE. Green Bay
 NFL SCHEDULE SAMPLE Thursday game Monday night Green Bay DATE HA OPPONENT 7 9/11/2016 A Jacksonville Jaguars 7.33 9/18/2016 7 A Minnesota Vikings 9.55 9/25/2016 7 H Detroit Lions 7.24 BYE 10/9/2016 14
Part A: Changes in Distance between Major League Baseball Franchises and their Triple-A Affiliates
 Five Themes of Geography: Movement Major and Minor League Baseball Team Affiliations, 1998 & 2011 Ezra Zeitler University of Wisconsin-Eau Claire Department of Geography & Anthropology Purpose: This exercise
Follow links for Class Use and other Permissions. For more information send to:
 COPYRIGHT NOTICE: Wayne L. Winston: Mathletics is published by Princeton University Press and copyrighted, 2009, by Princeton University Press. All rights reserved. No part of this book may be reproduced
Boston Bruins
 Boston Bruins Record: 51-26-7-109 Points 1st Place - Adams Division Lost - Adams Division Semifinals Head Coach: Brian Sutter Captain: Ray Bourque Boston Garden - 14,448 Buffalo Sabres Record: 38-36-10-86
2014 Baltimore Orioles
 Baltimore Orioles Record: 96-66 1st Place American League East Manager: Buck Showalter Oriole Park at Camden Yards - 48,187 Day: 1-8 Good, 9-15 Average, 16-20 Bad Night: 1-4 Good, 5-15 Average, 16-20 Bad
Boston Bruins
 Boston Bruins Record: 39-30-13-91 Points 3rd Place - Northeast Division (6th East) Lost - Eastern Conference Semifinals Head Coach: Pat Burns Captain: Ray Bourque FleetCenter - 17,565 Alternate Buffalo
By Kerry Beck. Kerry Beck,
 By Kerry Beck www.howtohomeschoolmychild.com/blog Super Bowl Alphabetizing Use the list of NFL-American Conference teams. Place them in alphabetical order. 1. 2. 3. 4. 5. 6. 7. 8. 9. 10. 11. 12. 13. 14.
NBA TVs Comprehensive Preseason Coverage to Feature 30 Live Game Telecasts, NBA Real Training Camp and Media Day Reports From Around the League
 NBA TVs Comprehensive Preseason Coverage to Feature 30 Live Game Telecasts, NBA Real Training Camp and Media Day Reports From Around the League Thursday, September 25, 2014 NBA Real Training Camp Tips
Regular Season Coverage to Culminate with 22 Games in 20 Days, March 19- April 7
 NBA TV to Televise 107 Games During 2018-19 Regular Season with Double-Digit Appearances by Defending Champion Warriors, Rockets, Celtics, 76ers, Lakers & Thunder Friday, August 10, 2018 Editor s note:
2019 S4 HERSCHEL SUPPLY COMPANY x NBA
 NBA 2019 S4 2019 S4 HERSCHEL SUPPLY COMPANY x NBA THE COLLECTION STEMS FROM THE PASSION TO WIN AT THE HIGHEST LEVEL, TAKING CUES FROM THE VINTAGE SATIN TEAM JACKETS THAT INSPIRED FASHION. FROM THE COURT
2016 MAJOR LEAGUE BASEBALL ATTENDANCE HIGHLIGHTS
 2016 MAJOR LEAGUE BASEBALL ATTENDANCE HIGHLIGHTS This is a brief summary of 2016 Major League Baseball attendance. It includes league and team attendance totals in the pages that follow the notes below.
CHAPTER 1 Exploring Data
 CHAPTER 1 Exploring Data 1.2 Displaying Quantitative Data with Graphs The Practice of Statistics, 5th Edition Starnes, Tabor, Yates, Moore Bedford Freeman Worth Publishers Displaying Quantitative Data
[ONLINE].. Indianapolis Colts vs Detroit Lions live stream free (NFL Preseason 2017)...
![[ONLINE].. Indianapolis Colts vs Detroit Lions live stream free (NFL Preseason 2017)...](/thumbs/95/124377748.jpg "[ONLINE].. Indianapolis Colts vs Detroit Lions live stream free (NFL Preseason 2017)...") [ONLINE].. Indianapolis Colts vs Detroit Lions live stream free (NFL Preseason 2017)... Watch..Live: http://livestreamworld.com/nflive/ Watch..Live: http://livestreamworld.com/nflive/ [ONLINE].. Indianapolis
[ONLINE].. Indianapolis Colts vs Detroit Lions live stream free (NFL Preseason 2017)... Watch..Live: http://livestreamworld.com/nflive/ Watch..Live: http://livestreamworld.com/nflive/ [ONLINE].. Indianapolis
2013 Baltimore Orioles
 Baltimore Orioles Record: 85-77 t-3rd Place American League East Manager: Buck Showalter Oriole Park at Camden Yards - 48,187 Day: 1-8 Good, 9-15 Average, 16-20 Bad Night: 1-4 Good, 5-15 Average, 16-20
NFL SCHEDULE SAMPLE. Green Bay
 NFL SCHEDULE SAMPLE Thursday game Monday night Green Bay DATE HA OPPONENT 7 9/11/2016 A Jacksonville Jaguars 7.33 9/18/2016 7 A Minnesota Vikings 9.55 9/25/2016 7 H Detroit Lions 7.24 BYE 10/9/2016 14
2012 Baltimore Orioles
 Baltimore Orioles Record: 93-69 (Wild Card) 2nd Place American League East Lost - ALDS Manager: Buck Showalter Oriole Park at Camden Yards - 48,187 Day: 1-8 Good, 9-15 Average, 16-20 Bad Night: 1-4 Good,
2018 MAJOR LEAGUE AND MINOR LEAGUE BASEBALL ATTENDANCE HIGHLIGHTS
 2018 MAJOR LEAGUE AND MINOR LEAGUE BASEBALL ATTENDANCE HIGHLIGHTS This is a brief summary of 2018 Major League and Minor League Baseball attendance. It includes league and team attendance totals in the
Local Chapter Pictorial
 APA Local Chapter Pictorial Local Chapter Pictorial Alamo Chapter of the APA Albuquerque Chapter APA of Acadiana Atlanta Chapter Birmingham Payroll Association Buffalo-Niagara Chapter Cascade Payroll Association
Conference Championship Weekend. The Granddaddy Of Them All January 1, pm PT
 TI N ROS E E Conference Championship Weekend BOWL The Granddaddy Of Them All January 1, 2018 1pm PT Games of the Week Ohio State vs Wisconsin Sat., Dec. 2, 5 pm PT, FOX In December 2014, Wisconsin and
APA Local Chapter Pictorial
 APA Local Chapter Pictorial Alamo Chapter of the APA Albuquerque Chapter APA of Acadiana Atlanta Chapter Broward County Association of Payroll Professionals Buffalo-Niagara Chapter Cascade Payroll Association
ARE PUBLIC POLICIES NEEDED TO LEVEL THE PLAYING FIELD BETWEEN CITIES AND TEAMS? MARK S. ROSENTRAUB* Indiana University
 ARE PUBLIC POLICIES NEEDED TO LEVEL THE PLAYING FIELD BETWEEN CITIES AND TEAMS? MARK S. ROSENTRAUB* Indiana University ABSTRACT: The owners of professional sports franchises, once minor players in the
NFL SCHEDULE SAMPLE. Green Bay
 NFL SCHEDULE SAMPLE Thursday game Opponent off bye week Monday night Green Bay DATE HA OPPONENT 7 9/11/2016 A Jacksonville Jaguars 7.33 9/18/2016 7 A Minnesota Vikings 9.55 9/25/2016 7 H Detroit Lions
Guide to the Sports Memorabilia Collection SC No online items
 http://oac.cdlib.org/findaid/ark:/13030/kt258035tx No online items Daniel Hartwig & Jenny Johnson Department of Special Collections and University Archives October 2010 Green Library 557 Escondido Mall
MEMORABLE DRINKWARE PRODUCT FEATURES LICENSED COLLEGIATE DESIGNS 24 OUNCE TUMBLER
 81 MEMORABLE DRINKWARE With unique customizable options and the enduring quality of a product that s been made in America since 1946, Tervis drinkware is built for a lifetime of memorable moments and everyday
Results by School -- Detail
 Page 1 of 12 Alabama 1992 Gene Stallings 13 0 Conference National 1993 Gene Stallings 1 12 1994 Gene Stallings 12 1 West 1995 Gene Stallings 8 3 1996 Gene Stallings 10 3 West 1997 Mike DuBose 4 7 1998
(56.3%) AL (60%) (62%) (69%) (+4149) 7* 9-5 (64%) +450 (400% ROI
 AL (60%) (62%) (69%) (+4149) 7* 9-5 (64%) +450 (400% ROI") Season: 107-83 (56.3%) for +3924 AL System: 27-18 (60%) June: 18-11 (62%) and +1005 May: 22-10 (69%) (+4149) 7* and Higher: 9-5 (64%) Playoffs: +450 (400% ROI for Playoff purchasers) By Game Season To
Season: 107-83 (56.3%) for +3924 AL System: 27-18 (60%) June: 18-11 (62%) and +1005 May: 22-10 (69%) (+4149) 7* and Higher: 9-5 (64%) Playoffs: +450 (400% ROI for Playoff purchasers) By Game Season To
2017 MAJOR LEAGUE AND MINOR LEAGUE BASEBALL ATTENDANCE HIGHLIGHTS
 2017 MAJOR LEAGUE AND MINOR LEAGUE BASEBALL ATTENDANCE HIGHLIGHTS This is a brief summary of 2017 Major League and Minor League Baseball attendance. It includes league and team attendance totals in the
What s the difference between categorical and quantitative variables? Do we ever use numbers to describe the values of a categorical variable?
 Pg. 10 What s the difference between categorical and quantitative variables? Do we ever use numbers to describe the values of a categorical variable? When describing the distribution of a quantitative
NHL Teams. November 2016
 NHL Teams November 2016 Media Cycle: Oct 1-31, 2016 This free report provides media prominence metrics for the top 15 entities in the sector. For full analytics on all sector entities, subscribe to mediaquant
1982 Atlanta Braves. Record: st Place National League West Manager: Joe Torre
 Atlanta Braves Record: 89-73 1st Place National League West Manager: Joe Torre Atlanta-Fulton County Stadium - 52,785 Day: 1-10 Good, 11-17 Average, 18-20 Bad Night: 1-6 Good, 7-17 Average, 18-20 Bad Day:
2018 MAJOR LEAGUE AND MINOR LEAGUE BASEBALL ATTENDANCE HIGHLIGHTS
 2018 MAJOR LEAGUE AND MINOR LEAGUE BASEBALL ATTENDANCE HIGHLIGHTS This is a brief summary of 2018 Major League and Minor League Baseball attendance. It includes league and team attendance totals in the
NFL SCHEDULE SAMPLE. Green Bay
 NFL SCHEDULE SAMPLE Thursday game Opponent off bye week Monday night Green Bay DATE HA OPPONENT 7 9/11/2016 A Jacksonville Jaguars 7.33 9/18/2016 7 A Minnesota Vikings 9.55 9/25/2016 7 H Detroit Lions
MAJOR LEAGUE BASEBALL 2013 ATTENDANCE ANALYSIS. Compiled and Written by David P. Kronheim.
 MAJOR LEAGUE BASEBALL 2013 ATTENDANCE ANALYSIS Compiled and Written by David P. Kronheim d.kronheim@verizon.net 2014 MAJOR LEAGUE BASEBALL 2013 ATTENDANCE ANALYSIS TABLE OF CONTENTS PAGES Attendance Reporting
Paul M. Sommers. March 2010 MIDDLEBURY COLLEGE ECONOMICS DISCUSSION PAPER NO
 IS THERE HOME-FIELD ADVANTAGE IN INTERLEAGUE PLAY? by Paul M. Sommers March 2010 MIDDLEBURY COLLEGE ECONOMICS DISCUSSION PAPER NO. 10-12 DEPARTMENT OF ECONOMICS MIDDLEBURY COLLEGE MIDDLEBURY, VERMONT 05753
GEOGRAPHY LESSON 1: PRE-VISIT - SAFE AT HOME LOCATION, PLACE AND BASEBALL BASEBALL COAST TO COAST HOUSTON ASTROS IN PARTNER WITH THE NBHOF
 PRE-VISIT - SAFE AT HOME LOCATION, PLACE AND BASEBALL OBJECTIVE: Students will be able to: Define location and place, two of the five themes of geography. Give reasons for the use of latitude and longitude.
HANDICAP ACTIVE AND INACTIVE SEASON SCHEDULE
 HANDICAP ACTIVE AND INACTIVE SEASON SCHEDULE The authorized golf association having jurisdiction in an area is responsible for declaring the duration of any inactive season. Any non-member club of an authorized
NBA TVs Preseason Coverage to Feature 31 Live Game Telecasts Featuring Anticipated Debuts of LeBron James, Kobe Bryant and Chris Paul
 NBA TVs Preseason Coverage to Feature 31 Live Game Telecasts Featuring Anticipated Debuts of LeBron James, Kobe Bryant and Chris Paul Thursday, October 1, 2015 Network s Original Programming Lineup to
Unit: [ALL] Category: [ALL] Average: 68% Type: S---- Median: 71% Jan. 22, 2018
![Unit: [ALL] Category: [ALL] Average: 68% Type: S---- Median: 71% Jan. 22, 2018](/thumbs/94/118999504.jpg "Unit: [ALL] Category: [ALL] Average: 68% Type: S---- Median: 71% Jan. 22, 2018") SUMMARY Mark (%) Adj. Class Avg. (%) ± Class Avg. (%) 1. Atlanta Hawks 92 69 23 2. Boston Celtics 88 68 20 3. Brooklyn Nets 87 69 18 4. Charlotte Hornets 79 69 10 5. Chicago Bulls 88 69 19 6. Cleveland
SUMMARY Mark (%) Adj. Class Avg. (%) ± Class Avg. (%) 1. Atlanta Hawks 92 69 23 2. Boston Celtics 88 68 20 3. Brooklyn Nets 87 69 18 4. Charlotte Hornets 79 69 10 5. Chicago Bulls 88 69 19 6. Cleveland
Doc's NHL Hockey Record
 2006-2007 Doc's NHL Hockey Record Date Team Score W/L Units Total Units + / - Total $$ 18-Feb Dallas -110 over San Jose 5-2 Win 19-Feb Boston -110 over Philadelphia 6-3 Win 20-Feb St. Louis -165 over Columbus
Friday's Games (All Times Eastern) NHL PLAYOFFS - First Round (3) -Winnipeg 4 Minnesota 1 (Jets lead series 2-0)
 NHL PLAYOFFS - First Round (3) -Winnipeg 4 Minnesota 1 (Jets lead series 2-0)") Friday's Games (All Times Eastern) NHL PLAYOFFS - First Round (3) -Winnipeg 4 Minnesota 1 (Jets lead series 2-0) The Winnipeg Jets are in control of their first-round playoff series against Minnesota.
Friday's Games (All Times Eastern) NHL PLAYOFFS - First Round (3) -Winnipeg 4 Minnesota 1 (Jets lead series 2-0) The Winnipeg Jets are in control of their first-round playoff series against Minnesota.
Case 1:12-cv SAS Document 329 Filed 03/12/15 Page 1 of 11
 Case 1:12-cv-01817-SAS Document 329 Filed 03/12/15 Page 1 of 11 UNITED STATES DISTRICT COURT SOUTHERN DISTRICT OF NEW YORK THOMAS LAUMANN, FERNANDA GARBER, ROBERT SIL VER, DAVID DILLON, GARRETT TRAUB and
Indian Cowboy College Basketball Record. By Game Daily Season To Date Date Game / pick Score W / L Units $$$ Units $$$ Units $$$
 By Game Daily Season To Date Date Game / pick Score W / L Units $$$ Units $$$ Units $$$ 11/9/2011 Liberty +20.5 over Texas A&M 81 59 L 4 440 4 440 4 440 11/10/2011 No games 11/11/2011 Illinois State +2
2015 Fantasy NBA Scouting Report
 2015 antasy NBA Scouting Report Introduction to Daily antasy Basketball on DraftKings Your Team Scoring Point +1 / 3-pt Shot Made Rebound +0.5 +1.25 Small orward Power orward / Assist Steal Block Turnover
HUSKERS in the NFL. Nebraska Football in the NFL
 HUSKERS in the NFL Nebraska Football in the NFL Nebraska owns one of the most impressive histories of any school with players in the National Football League. Nearly 300 former Huskers have represented
MAJOR LEAGUE BASEBALL 2014 ATTENDANCE ANALYSIS. Compiled and Written by David P. Kronheim.
 MAJOR LEAGUE BASEBALL 2014 ATTENDANCE ANALYSIS Compiled and Written by David P. Kronheim d.kronheim@verizon.net 2015 MAJOR LEAGUE BASEBALL 2014 ATTENDANCE ANALYSIS TABLE OF CONTENTS PAGES Attendance Reporting
1977 Boston Red Sox. Record: t-2nd Place American League East Manager: Don Zimmer
 Boston Red Sox Record: 97-64 t-2nd Place American League East Manager: Don Zimmer Fenway Park - 33,513 Day: 1-7 Good, 8-14 Average, 15-20 Bad Night: 1-3 Good, 4-13 Average, 14-20 Bad Day: 1-11 Good, 12-17
Largest Comeback vs. Eagles vs. Minnesota Vikings at Veterans Stadium, December 1, 1985 (came back from 23-0 deficit in 4th qtr.
 BLANK SINGLE-SEASON TEMPLATE TEAM RECORDS SCORING Most Points Scored 474 (2014, 16 games) 457 (2017, 15 games( 442 (2013, 16 games) 439 (2010, 16 games) 429 (2009, 16 games) Fewest Scored 51 (1936, 12
Choose Your Favorite Team! 24 oz. Tumblers BPA-FREE. Elige tu equipo favorito! Vasos de 24 oz. Sin BPA. MADE FOR LIFE GUARANTEE
 Choose Your Favorite Team! Elige tu equipo favorito! A 24 oz. Tumblers BPA-FREE Vasos de 24 oz. Sin BPA. MADE FOR LIFE GUARANTEE LOVE TO SHOP ONLINE? Over 1,500 products are available at gaschoolstore.com.
MADE FOR LIFE GUARANTEE
 Choose Your Favorite Team! Elige tu equipo favorito! A 24 oz. Tumblers BPA-FREE Vasos de 24 oz. sin BPA MADE FOR LIFE GUARANTEE LOVE TO SHOP ONLINE? Over 1,500 products are available at gaschoolstore.com.
Fundamental Certainty
 Fundamental Certainty.or No? a presentation at: R. Mark Woodworth PKF Hospitality Research, LLC May 7, 2013 mark.woodworth@pkfc.com Hotel Horizons Forecasting Model Smith Travel Research Historical rooms
Arizona Diamondbacks Turner Field Atlanta Braves Chase Field Turner Field - Advanced Ballpark Factors
 Chase Field Arizona Diamondbacks Manager: A. J. Hinch Record: - Std Type: Retractable Dome/Grass Capacity:, Doubles: / Triples: Turner Field Atlanta Braves Manager: Bobby Cox Record: - Stadium Type: Open
GUIDE to the KARL ORTH SCORECARD COLLECTION. National Baseball Hall of Fame Library Manuscript Archives
 GUIDE to the KARL ORTH SCORECARD COLLECTION National Baseball Hall of Fame Library Manuscript Archives National Baseball Hall of Fame and Museum 25 Main Street Cooperstown, NY 13326 www.baseballhall.org
2013 INTERNATIONAL BROADCAST GUIDE 2013 NFL INTERNATIONAL BROADCAST GUIDE
 2013 INTERNATIONAL BROADCAST GUIDE 2013 NFL INTERNATIONAL BROADCAST GUIDE Table of Contents The purpose of this guide is to provide our international broadcasters with detailed information on NFL Operations
Competition and Cooperation between Professional Sports Franchises: The Impact on Ticket Prices
 MPRA Munich Personal RePEc Archive Competition and Cooperation between Professional Sports Franchises: The Impact on Ticket Prices Gregory Pelnar 3. October 2009 Online at http://mpra.ub.uni-muenchen.de/17787/
Hail to the Chief! BOB2Ki BALA FOOTBALL POOL 2018 WEEK 12 NOTES
 BOB2Ki BALA FOOTBALL POOL 2018 WEEK 12 NOTES 1. Still no residents of Reverse Consensus Island. Twelve weeks in! 2. Ho! Ho! Ho! No, around here, that doesn t mean Christmas. It means Thanksgiving. As the