6 NATIONS 2004 STATISTICAL REVIEW AND MATCH ANALYSIS
|
|
|
- Samson Edwards
- 6 years ago
- Views:
Transcription
1 6 NATIONS 2004 STATISTICAL REVIEW AND MATCH ANALYSIS IRB Game Analysis 6 Nations 2004 April 2004
2 6 NATIONS 2004 STATISTICAL REVIEW AND MATCH ANALYSIS contents pages: COMMENTARY 1-2 SUMMARY 3 CHAMPIONSHIP TABLE/MATCHES PLAYED 4-10 SCORING PROFILES - points scored - tries - penalty goals compared with 1954, 1964, 1974, 1984, kicking TRIES - tries scored by winning team - source of tries - origin of tries - position where tries scored - build up to tries - timing of scores MODE OF PLAY - match time - ball in play time - activity cycles ruck/maul(2nd phase), passes,kicks - passing movements 21 RESTARTS LINEOUT 22 SCRUM PENALTIES - number and incidence - teams penalised - times of penalties - offences penalised - pitch location of penalties - northern/southern hemisphere referees RED/YELLOW CARDS - red card details - yellow card details 29 SUBSTITUTIONS 30 TELEVISION MATCH OFFICIAL IRB Game Analysis 6 Nations 2004 April 2004
3 COMMENTARY Six Nations 2004 provided a clear example of how much the game of rugby has changed over recent and not so recent years. In 2004, for example, there was one penalty goal for every try. Ten years ago, there were 3 times as many penalty goals as tries and 20 years ago twice as many. Of the 15 matches played in 6 Nations 2004, 13 were won by the team scoring most tries. In no game did the team scoring the fewest tries win - tries still win matches, and England s performance over the past 5 years illustrates this. they have scored more tries than any other country in each of the last 5 years with the exception of this year where Ireland also scored 17. they are the only team to have scored more tries than penalty goals in every one of the last five years. None of the other countries have come close. On all but a handful of occasions, the remaining 5 countries have consistently kicked more penalty goals than tries. In the last 5 years, England have scored 50% more tries than the second placed country, Ireland. Penalty goals, as a proportion of all scores, therefore are in decline, and the extent of such a reduction is shown in the following table which shows the number of penalty goals kicked in the championship in each of the last 5 years: penalty goals As an illustration of the effect of such a reduction, a comparison with England s championship win in 1996 is illuminating. While England have averaged over 4 tries per game in recent years, in 1996 they scored just 3 tries in the 4 matches, or less than one per game, and still won the IRB Game Analysis 6 Nations 2004 April 2004
4 championship thanks to 17 penalty goals. This contrasts with France s 14 tries and 18 penalty goals in this year s championship. Much of this change results from an increase in ball-in-play time. It continues to increase there was no game with less than 40% (ie 32 minutes play) and for the first time, two games were 50% or over. Since the game went professional at the end of 1995, ball in play time has increased by almost 40% resulting in more rucks/mauls kicks and passes with the number of passes increasing almost exponentially. Despite this however, most tries are not the result of continuous recycling and sweeping passing movements. The data shows that in 2004, 88% of tries were preceded by 3 or fewer second phases and 43% of tries were preceded by 3 or fewer passes. Other trends were also confirmed in 6 Nations Conversion success rates continued to show a steady reduction in each of the last 5 years. From an 82% success rate in 2000, it has now declined to 63%. The year on year reduction is as follows: Conversion success rate % % % % % This contrasts with penalty goal success rates which have remained more or less constant at around 72%. As explanation for this could be that defences are organised in such a way that try scoring is being pushed further and further towards the touchlines. In one area, there was one notable difference in 6 Nations 2004 from recent years. There was a measurable difference between the Northern Hemisphere group of referees and the Southern Hemisphere group: Southern Hemisphere referees awarded 30% more penalties than Northern Hemisphere referees the 4 highest penalised games were refereed by Southern Hemisphere referees while the 3 games with the least number of penalties were refereed by Northern Hemisphere referees and IRB Game Analysis 6 Nations 2004 April 2004
5 Northern Hemisphere referees were noticeably harsher on the tackled player than were Southern Hemisphere referees The detailed report that follows covers the above and contains further analyses and breakdowns of other facets of play. It shows, for example, that France did not concede a single try in the first half of any of their matches and Scotland or Italy did not score a single try in the first half of theirs. England mauled the most, France the least Wales passed the most, Ireland the least Italy kicked the most, England the least Wales conceded the most penalties, while England conceded the largest proportion of penalties and as a final illustration of how the game has changed, it shows that 22 substitutions were made after 40 minutes of the second half IRB Game Analysis 6 Nations 2004 April 2004
6 6 NATIONS 2004 STATISTICAL REVIEW AND MATCH ANALYSIS summary the average number of points scored per match was 43 - compared with 47 in 6 Nations Tries were slightly down and penalty goals showed a small increase. tries accounted for 53% of total points scored. In 2003, it was 52%. The last time this figure was exceeded was in ball in play time was 46% - up by 2% on rucks/mauls increased from an average of 150 to 152 per game passes increased from 285 to 291 open play kicks decreased to 57 from 60 63% of tries were converted, a success rate that has declined in each of the last 5 years. 75% of penalty kicks at goal succeeded, a slight increase over 2003 both rates slightly down on tries were scored in the 15 matches. This compares with 74 tries in 2003 and 75 in each of the previous 3 years. of the 68 tries, 1 in 6 started from inside the scoring team s half compared with1 in 3 three years ago. as in previous years, over 30% of tries were the direct result of lineout possession. almost 90% of tries were preceded by 3 or fewer rucks/mauls. two thirds of all tries were scored in the second half while three quarters of penalty goals were kicked in the first half. around 80% of all passing movements continue to contain 2 passes or less. there were an average of 36 lineouts per game, the same as in 2003 but 3 more than Retained possession varied little at 80%. IRB Game Analysis 6 Nations
7 there were 21 scrums per game one more than in 2003 while the number of collapsed scrums increased. during the championship, only one free kick was awarded for a crooked scrum feed. penalties went down from 25 in 2003 to 23 in penalties for ground offences at ruck and tackle accounted for 47% of all penalties, compared with 49% in 2003 and 42% in no red cards were issued while 4 yellow cards were issued compared with 8 in the incidence of scoring during the sin bin period was not significant. in the 15 matches, there were around 9 substitutions per game, a small reduction over 2003 note Over the last 5 years, England have scored 50% more tries than the next highest country England are the only country to have scored more tries than penalty goals in every one of the last 5 years Over the last 5 years, England have scored the most tries France kicked the most penalty goals And Scotland have the highest penalty goal to try ratio IRB Game Analysis 6 Nations
8 SIX NATIONS 2004 STATISTICAL REVIEW AND MATCH ANALYSIS CHAMPIONSHIP TABLE Team Played Won Lost Drawn For Against Points France Ireland England Wales Italy Scotland MATCHES PLAYED 27 Mar 2004 France vs England Mar 2004 Ireland vs Scotland Mar 2004 Wales vs Italy Mar 2004 Scotland vs France Mar 2004 England vs Wales Mar 2004 Ireland vs Italy Mar 2004 Wales vs France Mar 2004 England vs Ireland Mar 2004 Italy vs Scotland Feb 2004 Ireland vs Wales Feb 2004 Scotland vs England Feb 2004 France vs Italy Feb 2004 Italy vs England Feb 2004 Wales vs Scotland Feb 2004 France vs Ireland IRB Game Analysis 6 Nations
9 6 NATIONS 2004 STATISTICAL REVIEW AND MATCH ANALYSIS A SCORING PROFILES POINTS SCORED i There were 642 points scored in the 15 matches played. They were made up as follows: Points Scored Converted Tries Unconverted Tries Penalties Drop Goals converted tries unconverted tries penalties drop goals 9 642pts ii iii The average number of points per game was 43 down 4 points over 2003 s average of 47. The last 4 year s figures were: 53, 51, 47 and 43. There was a small reduction in the average number of tries scored per game. - in 2000, there were 5.0 tries per match, an increase of 11% - in 2001, there were 5.0 tries per match no change - in 2002, there were 5.0 tries per match no change - in 2003, there were 5.0 tries per match no change - in 2004, there were 4.5 tries per match a reduction of a half a try per game. Despite the small reduction in the number of tries, they still accounted for 53% of total points scored, a similar figure to IRB Game Analysis 6 Nations
10 Iv Drop goals decreased from 11 to 3 in the 15 matches - in 2000, there were 0.5 drop goals per match - in 2001, there were in 2002, there were in 2003, there were in 2004, there were 0.2 v vi Penalty goals averaged 4.6 per match, a slight increase over in 2000, there were in 2001, there were in 2002, there were in 2003, there were in 2004, there were 4.6 SUMMARY: average per match Score Summary Frequency Tries Penalty Goals Drop Goals Year TRIES Over the 5 years since RWC99, the total number of tries scored by each country in the 6 Nations championship is as follows: Total tries scored in last 5 years Average per game England Ireland France Wales Italy Scotland The table shows that that England have scored 50% more tries than the second placed country, Ireland. What is interesting to note however is that England s total try count has declined in each of the last 4 years from 29 in 2001, to 23 in 2002, 18 in 2003 and 17 in IRB Game Analysis 6 Nations
11 Nevertheless, England have scored more tries than any other country in each of the last 5 years with the exception of 2004 where Ireland also scored 17. Finally, as an indication of how far the game has changed since the onset of professionalism, a comparison with England s championship win in 1996 is illuminating. While England have averaged over 4 tries per game in recent years, in 1996 they scored just 3 tries in the 4 matches, or less than one per game, and still won the championship thanks to 17 penalty goals. PENALTY GOALS Despite the slight increase, the 2004 average of 4.6 per game confirmed the diminishing reliance on penalty goals in the 6 Nations championship. The extent of such a reduction is shown in the following table which shows the number of penalty goals kicked in the championship in each of the last 5 years: penalty goals A further breakdown shows that England is the only team to have scored more tries than penalty goals in every one of the last five years. None of the other countries have come close. On all but a handful of occasions, the remaining 5 countries have consistently kicked more penalty goals than tries. This is further illustrated in the following table which shows the total number of penalty goals kicked by each country over the last 5 years together with the total number of tries over the same period: penalties kicked tries scored ratio pens:tries England to 1 Ireland to 1 Wales to 1 France to 1 Italy to 1 Scotland to 1 IRB Game Analysis 6 Nations
12 The above table shows that over the 5 year period, France have kicked the most penalty goals England have scored the most tries and Scotland have the highest penalty goal to try ratio. SCORING PROFILE OF THE MODERN GAME The following table shows the comparative figures for the 5 Nations Championships played in 1954, 1964, 1974, 1984 and 1994 and compares them with 6 Nations 2004 scores - average number per game converted unconverted total tries pens drops tries tries conversion success rate % % % % % % As an indication of how the game has changed, it is worth noting that while there were very nearly the same number of tries as penalty goals in 2004, ten years ago, there were 3 times as many penalty goals as tries and 20 years ago twice as many. KICKING Over the last number of years, kicking success rates in all international matches including World Cups, have shown a noticeable improvement over earlier decades. In the 6 Nations tournament however, this increase now appears to have reversed. Conversion success rates have shown a steady reduction in each of the last 5 years. From an 82% success rate in 2000, it has now declined to 63%. The year on year reduction is as follows: Conversion success rate % % % % % IRB Game Analysis 6 Nations

 Penalties 23 missed attempts 69 successful attempts success")

13 As for 2004, the following charts show all successful and unsuccessful conversion and penalty kicks during the 2004 championship. Conversions 25 missed attempts 43 successful attempts success rate: 63% ( %) Penalties 23 missed attempts 69 successful attempts success rate: 75% ( %) The following charts show each country s successful and unsuccessful kicks at goal. Blue = successful: Red = unsuccessful IRB Game Analysis 6 Nations
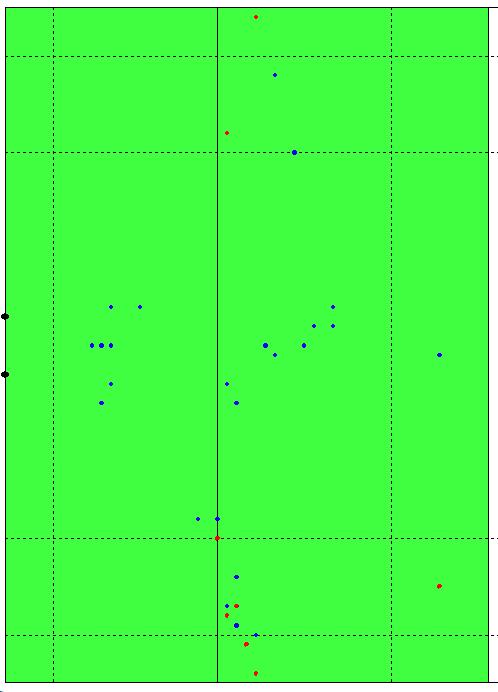
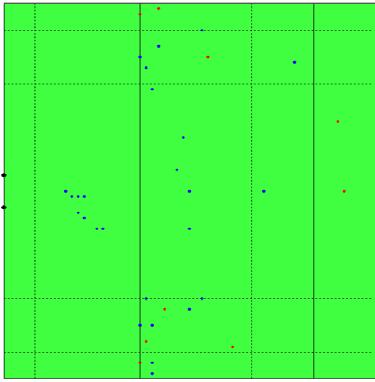
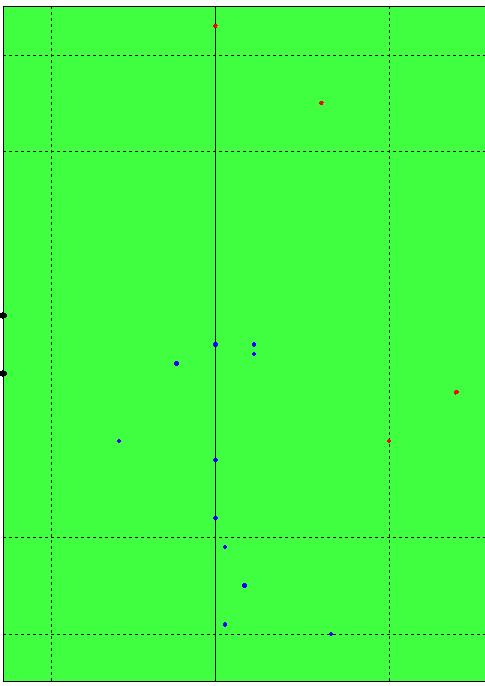
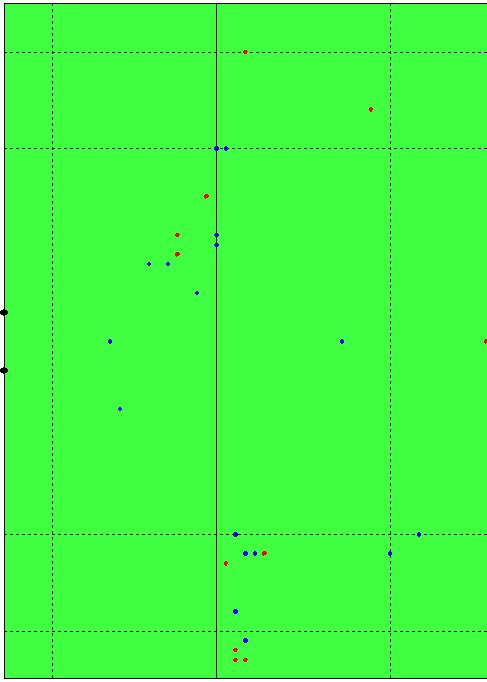
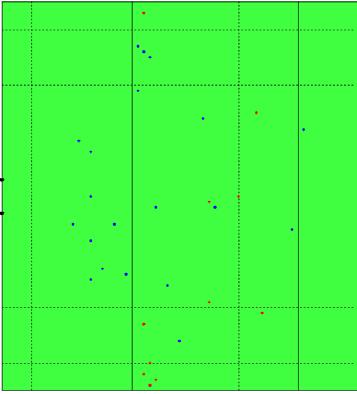
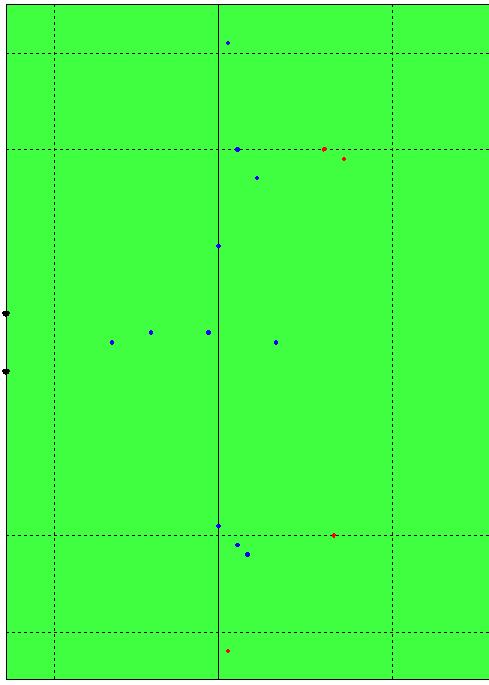
14 SUCCESSFUL/UNSUCCESSFUL KICKS AT GOAL BY COUNTRY England France Ireland Italy Scotland Wales IRB Game Analysis 6 Nations
15 KICKING SUCCESS RATES FROM VARIOUS PARTS OF PITCH The success and failure rate of both conversions and penalties were combined in order to determine success rates from various parts of the pitch. An appropriate adjustment was made for left-footed kickers. If the various areas are grouped into 3 i.e. in front, right side and left side, the success rates are: In front 87% Right side 55% Left side 61% Overall therefore, the degree of difficulty of a kick is little affected by the side of the post from which the kick is taken. B i TRIES tries scored by winning team Of the 15 matches played in 6 Nations 2004, 13 were won by the team scoring most tries. In 2 games, tries were equal and in no game did the team scoring the fewer tries win. It remains true therefore that 75% to 80% of matches are won by the team scoring the most tries. It is still infrequent for a team to score fewer tries but then win because of penalties. ii source of tries There were 68 tries scored in 6 Nations 2004 six less than The teams scoring the tries obtained possession of the ball prior to the scoring of the try from a variety of sources. This is shown in the following chart and table: Source of Tries Penalty Scrum - Own Lineout - Own Lineout - Opposition Opponent's Kick Opponent's Handling Error Turnover Opponent's Restart Own Restart Opponent's Scrum IRB Game Analysis 6 Nations
, in 2004 tries from lineout possession went down slightly with tries from opponents errors")
16 Possession source Penalty 8 12 Scrum Lineout - own Lineout - opposition 2 3 Opponent s kick 9 9 Opponent s handling error 9 6 Turnover 7 5 Opponent s restart 0 1 Own restart 1 1 Opponent s scrum While lineout possession continues to account for most tries (around 30%), in 2004 tries from lineout possession went down slightly with tries from opponents errors increasing correspondingly. iii origin of tries Tries originate from various parts of the pitch. The following chart shows where the attacking team obtained the possession from which they eventually scored. This shows that: 34 or 50% originated within the 22 metre line ( %) 18 or 26% between the 22 and 10 metre line ( %) 6 or 9% between 10 metres and halfway ( %)and 10 or 15% originated in the scoring team s half ( %) In 2001, 1 in 3 tries originated from within the scoring team s own half. This has become a less frequent occurrence over the last 3 years. In 2002, it went down to 1 in 5 and in 2003 and 2004 it was 1 in 6. IRB Game Analysis 6 Nations

17 The corollary is that over 50% of tries started within 22 metres of the goal line in 2003 and 2004 compared with 30% in Iv Position where tries were scored The chart below indicates where across the goal-line tries were scored. It shows that 7% were scored under the posts 56% on the left side of the posts, and 36% on the right side of the posts. The chart below shows that twice as many tries were scored within 15 metres of the left corner of the pitch than on the right. H v build-up to tries Possession of the ball that leads to tries is obtained from a number of sources and they are listed above. More often than not, other actions second phase, kicks and passes then take place before the try is scored. IRB Game Analysis 6 Nations
18 The first table below shows the number of rucks and mauls (2 nd phase) that preceded each of the 68 tries scored in the 2004 championship No of 2 nd phases frequency None The table shows that 88% of tries were preceded by 3 or fewer second phases.( %) The next table shows the total number of passes that preceded each of the 68 tries. No of passes frequency None The table shows that 43% of tries were preceded by 3 or fewer passes. ( %) IRB Game Analysis 6 Nations
19 This was not a figure that was seen consistently throughout all six teams. The table below shows that only 2 of Wales 14 tries included 3 passes or less. In Ireland s case however, the opposite was the case - 12 out of their 17 tries had 3 or fewer passes. vi timing of tries The 2 charts show that every country scored most of their tries in the second half every country conceded more tries in the second half France did not concede a single try in the first half of any of their matches and Scotland or Italy did not score a single try in the first half of theirs. a the half in which each country scored their tries Times of Tries Scored in 6N Frequency England France Ireland 9 0 Italy Scotland Wales First Half Second Half Team b the half in which each country conceded tries. Times of Tries Conceded in 6N Frequency England 4 0 France Ireland 8 Italy 7 Scotland Wales First Half Second Half Team IRB Game Analysis 6 Nations
20 vii timing of scores There is a noticeable difference between the time when tries are scored and the time when penalties are kicked. In 6 Nations 2004: 25 tries were scored in the first half 43 in the second. Penalties however showed a different profile: 51 penalties were kicked in the first half - 18 in the second In general therefore, almost twice as many tries were scored in the second half than the first half but three quarters of penalty goals were kicked in the first. The following chart breaks down the timings further and shows both penalties and tries in 5 minute sequences: Score Times for 6 Nations Frequency Tries Penalties Time The above analysis was then broken down further to see if the scoring profiles of each of the 6 countries reflected the overall scoring profile. With regard to penalties, all countries kicked the majority of their penalties in the first half. Ireland and Scotland did not kick a single penalty in the second half of any of their matches. France however kicked almost as many 2 nd half penalties as the other 5 countries combined. IRB Game Analysis 6 Nations
21 C i MODE OF PLAY match time The average length of a match in 6 Nations 2004 was 90 mins 26 seconds The comparative figure for 6 Nations 2003 was 88 mins 49 seconds. an increase of 1 min 37 seconds. The longest match time was 96 mins 09 secs The shortest match time was 84 mins 01 secs ii ball in play times In percentage terms, the 2004 matches produced the following ball-in-play times 40%, 40%, 41%, 42%, 44%, 45%, 46%, 47%, 47%, 48%, 49%, 49%, 49%, 50%, 51%.- an average of 46% In 2003, the corresponding figures were 38%, 41%, 41%, 42%, 42%, 42%, 42%, 43%, 43%, 45%, 45%, 46%, 48%, 49%, 50% - an average of 44% The average ball in play time increased therefore from 44% to 46%. Ball in play time continues to increase there was no game with less than 40% (ie 32 minutes) and for the first time, two games were 50% or over. The ball in play for each game is shown in the chart below: BIP Distribution Percentage (F v E) (Ir v S) (E v W) (S v Fr) (W v It) (Ir v It) (E v Ir) (W v F) (It v S) (Ir v W) (S v E) (F v It) (It v E) (F v Ir) (W v S) Frequemcy IRB Game Analysis 6 Nations
22 An indication of how far ball in play time has increased is when a comparison is made with with 5 Nations In that year, only one game exceeded 40% ball in play time while in 2004, all 15 achieved 40% or more. Not surprisingly, the above figures also show noticeable increases from RWC91, 95 and 99 as shown below: ball in play time RWC91 24 mins 48 secs (31%) ball in play time RWC95 26 mins 43 secs (33%) ball in play time RWC99 30 mins 35 secs (38%) ball in play time 6 Nations mins 41 secs (46%) Since the game went professional at the end of 1995, ball in play time has increased by almost 40%. Ball In Play Competition 6N N 2003 RWC 03 RWC RWC Percentage BIP iii activity cycles Activity cycles reflect what happens when the ball is in play - and with increased ball in play times, there has been a consequent increase in activity levels i.e. there have been more passes, kicks and ruck/mauls. Consequently, the average number of stoppages in the game has come down and in recent years has stabilised at around 95 per game. The following data compares the average for the matches played in the last 4 years rucks/mauls (2nd phase) passes open play kicks kick:pass ratio 1 to to in in 5.1 IRB Game Analysis 6 Nations
23 Rucks/Mauls (2nd Phase) Passes Year Year Average Average Open Play Kicks Kick:Pass Ratio : : 4.8 Year Year : : Average Average It can be seen that the increase in ball in play time over recent years has resulted in more rucks, passes and kicks with open play kicks increasing proportionately more than rucks and passes. Rucks/Mauls (2 nd phase) The average number per game was 152 ( ). The most in any game was 207 the fewest was almost 100 less at 108. The most by any team in a game was 143 (England) the fewest, 53(Italy). There was a noticeable difference between some of the 6 teams. England for example created 34% more rucks/mauls than Wales. The average per country is shown below: Average no of rucks/mauls per game England 90 Scotland 84 Ireland 74 Italy 71 France 71 Wales 67 IRB Game Analysis 6 Nations
24 The above table shows the total number of rucks/mauls created by each team in the competition expressed as an average per game. On a game by game basis therefore it shows that England and Scotland created the most rucks and mauls while Wales rucked and mauled the least. However, the number of rucks and mauls made by one team may be constrained because it obtained only limited possession of the ball. In order to address this, an alternative calculation has been made which relates the number of rucks/mauls to the share of ball in play time won by each team. ruck/mauls per minutes possession England 4.6 Italy 4.4 Scotland 4.3 average: 4.2 Ireland 4.0 Wales 4.0 France 3.6 The above chart shows certain changes from the former. While England remained the highest ruck/mauling team on both measures, France s rate of rucking was seen to be less than any other country. Passes Games, on average, contained 291 passes ( ). The most in any game was 348 the fewest was almost 150 less at 212. The most by any team in a game was 260 (France) the fewest, 98 (Ireland). Again, there were noticeable differences between the six teams France completed almost 50% more passes than Italy. Each team s average is shown below: Average no of passes per game France 166 Wales 162 Scotland 157 England 150 Ireland 125 Italy 114 When an adjustment is made to take account of the percentage possession obtained by each team, then the table changes however. IRB Game Analysis 6 Nations
25 This table now shows that Wales were the clearly the highest passing team, their rate exceeding France and Ireland by 14% and 41% respectively. Passes per minutes possession Wales 9.6 France 8.4 Scotland 7.9 average: 7.9 England 7.7 Italy 7.0 Ireland 6.8 Kicks The average number per game was 57. The most open play kicks in a game was 81 - the fewest 42. The most by any team in a game was 44 (Ireland) the fewest 19 (Scotland and Italy). There were little differences between the 6 participating teams - all were within 6 kicks of each other. Average no of kicks per game Scotland 31 France 30 Ireland 29 Italy 29 England 28 Wales 25 When an adjustment is made to take account of the percentage possession obtained by each team, it shows that Italy was the highest kicking team in relation to the possession they obtained while England were the lowest. Kicks per minutes possession Italy 1.8 Ireland 1.6 Scotland 1.6 average: 1.6 France 1.5 Wales 1.5 England 1.4 A summary of both tables the first showing the average number of rucks, passes,and kicks per game and the second the rate per minute possession is given below: Average per game Average per minute possession rucks passes kicks rucks passes kicks ENGLAND ENGLAND FRANCE FRANCE IRELAND IRELAND ITALY ITALY SCOTLAND SCOTLAND WALES WALES IRB Game Analysis 6 Nations
26 vi passing movements Passes are grouped into passing movements i.e. one pass movement, two pass movements and so on. The data shows that some 83% of all passing movements contained two passes or less. This now appears to be a constant and varies little from year to year. Most teams played to this formula, but there are exceptions. The noticeable differences this year relate to England: 71% of their passing movements contained just one pass which was a far higher percentage than any other country. The corresponding figure for France, for example, was just 46%. The 71% figure was also noticeably different from the 2003 figure of 50% Passing Sequences 1 Pass% 2 Pass % Total % 2003 England France Ireland Italy Scotland Wales D RESTARTS There were 198 start and restart kicks in the 15 matches. Just under 1 in 4 were contestable and of these, the kicking team regained possession on 28% of occasions. Overall, and after allowing for kicking errors, possession was retained by the kicking team on 1 in 8 occasions. E LINEOUT The following data compares lineouts in 2002, 2003 and 2004: average number per game percentage competed 70% 64% 61% lineout penalties per game possession retained 78% 83% 80% IRB Game Analysis 6 Nations
27 The most lineouts in a game was 44; the fewest 23. Competition at the lineout has reduced in each of the last 4 years. Possession retained by the throwing in team has however changed little. However, it should be noted that quality of possession has not been measured. No distinction has been made therefore between good and bad possession. This same qualification applies to scrum data. F SCRUM The following data compares scrummages in 2002, 2003 and average number per game scrum penalties per game scrum pens as % of all pens 15% 12% 14% penalty : scrum ratio 1 : 7 1 : 7 1 : 6 possession retained 91% 88% 87% In 6 Nations 2004, there were 314 scrummages and 100 resets making a total of 414 scrum engagements. Of the 414 engagements, there were 96 collapses or 23% of all engagements ( 2003, 15%) On 2 occasions the use it or lose it law was seen to apply. There were 4 in There was 1 free kick for a crooked feed compared with four in G i PENALTIES number and incidence In 6 Nations 2004, the average number of penalties and free kicks awarded in a game was 23. This compares with 25 in In 2004, the most awarded in a single game was 33 the least, 13. The comparative figures for 2003 were 31 and 21. In 2003 the extremes IRB Game Analysis 6 Nations
28 came far closer. The difference between the most and least penalties in 2004 was 20 this was the same number as 2002 and Last year however, the differential was only 10. In the 15 matches, the team playing at home was awarded the most penalties in 4 matches, the away team the most in 10 matches with an equal number of penalties being awarded in the remaining match. ii teams penalised Wales conceded the most penalties while Ireland conceded the fewest (including free kicks) as shown in the following table: penalties conceded Wales 67 Italy 60 Scotland 57 France 55 England 51 Ireland 50 What needs to be noted is that the above are absolute figures but because the number of penalties can vary from match to match (in 2004, between 13 and 33), a better and probably more accurate indicator, is the proportion of penalties conceded by a team in all their matches compared with their opponents. Proportion of times penalised England 54% Scotland 53% Wales 53% Italy 50% France 49% Ireland 43% The second table shows that England, just as in 2002 and 2003, conceded proportionately more penalties than their opponents. By contrast, Ireland were penalised the least. IRB Game Analysis 6 Nations
29 iii times of penalties There were more penalties awarded in the first 5 minutes of the game than in any other 5 minute period while the highest proportion of penalties were awarded in stoppage time at the end of the game. Overall however, there was little difference in the number of penalties awarded in the first half and the second half. The following chart shows the times at which penalties were awarded: Infringements in 5m Intervals Frequency Time iv categories of offences penalised The following table groups the penalties awarded into 10 categories and shows the comparative figure for 6 Nations 2001 and 2002: % % % ruck/tackle on ground offences offside backs/forwards/open play scrum lineout plus 10 metres foul play obstruction tackle early/late/dangerous maul pulling down miscellaneous % 100% 100% IRB Game Analysis 6 Nations

30 Penalty Offences Percentage scrum lineout plus 10 metres foul play obstruction miscellaneous Offence v pitch location of penalties The chart below shows the location of every penalty awarded during the championship. The figures on the chart show the percentages for each quarter of the pitch. IRB Game Analysis 6 Nations
31 vi Northern and Southern Hemisphere referees Of the 15 matches, 8 were refereed by Northern Hemisphere referees, 7 by Southern Hemisphere referees. The following table looks at the breakdown of penalties and other match details between the two groups: northern southern a average points per match b average ball in play times 46% 45% c average number of penalties d % of penalties given against team in possession at ruck/tackle on ground offences 48% 38% (36% ) (33% ) This is the first time for several years that there has been a noticeable difference between the 2 groups of referees. Southern hemisphere referees awarded 30% more penalties than northern hemisphere referees Northern hemisphere referees were harsher on the tackled player than were southern hemisphere referees The 4 games with the most penalties were refereed by Southern Hemisphere referees The 3 games with the lowest number, were refereed by Northern Hemisphere referees e offences penalised: NH referees SH % % ruck/tackle on ground offences offside backs/forwards/open play scrum lineout 4 7 plus 10 metres 1 2 foul play 1 2 obstruction 3 7 tackle early/late/dangerous 3 3 maul pulling down % 100% IRB Game Analysis 6 Nations
32 Penalty Offence North v South Percentage scrum lineout plus 10 metres foul play obstruction North South Offence H RED AND YELLOW CARDS ISSUED The following paragraphs examine the circumstances and effects of the issue of red and yellow cards during the 6 Nations championship, i red cards There were none issued during the 2004 championship.(2002 none) ii yellow cards Number issued 4 (2003-8) Matches: Scotland v England McHugh (I) 1 Ireland v Wales Jutje (F) 1 Scotland v France Young (SA) 1 Ireland v Italy Deaker (NZ) 1 4 IRB Game Analysis 6 Nations
33 In 11 of the 15 matches, not a single yellow card was issued. iii Offences for which yellow card issued: Tackle - dangerous 1 Ruck/Tackle player to ground 1 - wrong side 1 Offside - forward 1 4 During the 15 matches, there were just 4 penalties awarded for foul play offences. none resulted in a yellow card. Iv v Countries conceding yellow cards: France 0 0 Italy 1 1 Wales 2 0 England 2 0 Scotland 3 2 Ireland The yellow cards issued against Italian players amounted to just one just as in This total of two compares with 11 yellow and 1 red card received over the 2 previous seasons. Referees Northern Hemisphere referees matches refereed 8 matches with yellow cards 2 yellow cards issued 1, 1 2 Southern Hemisphere referees matches refereed 7 matches with yellow cards 2 yellow cards issued 1, 1 2 vi vii Home team/away team Issued against home team player 3 Issued against away team player 1 Times of issue Issued during first half 2 Issued during second half 2 IRB Game Analysis 6 Nations
34 viii ix Winning/Losing team Issued against player of team in lead 1 Issued against player of team behind 2 Scores equal 1 Impact on scoring during sin bin period The points benefit to the team with 15 players while an opponent was off the field was as follows: a b c d 7 pts. Last quarter of game - team penalised also losing heavily 7pts. Team penalised win comfortably. 5pts. First try to Ireland v Italy none The above figures indicate that the points benefit to the team with 15 players continues to be relatively marginal at best. I SUBSTITUTIONS In the 15 matches, there were 9 blood bins and 133 tactical and injury substitutions There were, on average, over 9 replacements per game. This shows a slight reduction over last year. The following chart shows the number of substitutions both injuries and tactical made in each 5 minute period Substitutions in 5m Intervals Frequency Time IRB Game Analysis 6 Nations
35 J TELEVISION MATCH OFFICIAL During the championship, there were 7 references to the TMO (2003 7). As a result of the 7 references, 1 try was awarded. The shortest reference to the TMO took 36 seconds the longest, 1min 35 seconds. Only 2 references took more than one minute (1m 35s,1m 17s). 4 of the remaining references took between 36s and 48s one took 59 secs CT April 2004 IRB Game Analysis 6 Nations
2011 WOMEN S 6 NATIONS
 2011 WOMEN S 6 NATIONS STATISTICAL REVIEW AND MATCH ANALYSIS IRB GAME ANALYSIS CONTENTS Page Commentary 1 Summary 6 Final Standings & Results 7 Section 1 Summary of Constituent Game Elements 8 Section
STATISTICAL ANALYSIS AND MATCH REVIEW
 STATISTICAL ANALYSIS AND MATCH REVIEW SIX NATIONS 2014 IRB GAME ANALYSIS CONTENTS PAGE COMMENTARY 1 MATCH FACTS 8 TEAM FACTS 9 FINAL STANDINGS & RESULTS 13 OVERALL SUMMARY PER MATCH 14 OVERALL SUMMARY
WOMEN S SIX NATIONS 2008
 WOMEN S SIX NATIONS 2008 STATISTICAL REVIEW & MATCH ANALYSIS IRB GAME ANALYSIS CONTENTS Page Commentary 1 Final Standings & Results 5 Summary 6 Section 1 Summary of Constituent Game Elements 7 Section
RWC 2003 STATISTICAL REVIEW AND MATCH ANALYSIS
 RWC 2003 STATISTICAL REVIEW AND MATCH ANALYSIS IRB Game Analysis RWC2003 Dec 2003 RWC2003 STATISTICAL REVIEW AND MATCH ANALYSIS contents pages: 1-3 SUMMARY 4-6 TOURNAMENT RESULTS 7-10 1 SCORING PROFILES
SIX NATIONS 2015 STATISTICAL REPORT WORLD RUGBY GAME ANALYSIS
 SIX NATIONS 2015 STATISTICAL REPORT FINAL RESULTS & STANDINGS P W D L PF PA PD TF TA PTS Ireland 5 4 0 1 119 56 +63 8 3 8 England 5 4 0 1 157 100 +57 18 11 8 Wales 5 4 0 1 146 93 +53 13 8 8 France 5 2
STATISTICAL ANALYSIS AND MATCH REVIEW
 STATISTICAL ANALYSIS AND MATCH REVIEW THE RUGBY CHAMPIONSHIP 2014 IRB GAME ANALYSIS CONTENTS PAGE COMMENTARY 1 MATCH FACTS 6 TEAM FACTS 7 FINAL STANDINGS & RESULTS 10 OVERALL SUMMARY PER MATCH 11 OVERALL
JUNIOR WORLD CHAMPIONSHIP 2008
 JUNIOR WORLD CHAMPIONSHIP 2008 STATISTICAL REVIEW & MATCH ANALYSIS IRB GAME ANALYSIS The attached report does 3 things: 1 it reflects the shape of the Under 20 game as played in Junior World Championship
IRB WOMEN S RUGBY WORLD CUP 2010
 IRB WOMEN S RUGBY WORLD CUP STATISTICAL REVIEW AND MATCH ANALYSIS IRB GAME ANALYSIS SUMMARY The report does the following: 1 it reflects the shape of the women s game as played in IRB Women s Rugby World
Rio 2016 Olympic Games Men s Rugby Sevens Game Analysis Report
 Rio 2016 Olympic Games Men s Rugby Sevens Game Analysis Report World Rugby Game Analysis COMMENTARY The Rio 2016 Olympic Games, which saw the reintroduction of rugby to the Games after a gap of 92 years,
2011/12 HSBC SEVENS WORLD SERIES STATISTICAL REVIEW GOLD COAST, DUBAI & PORT ELIZABETH IRB GAME ANALYSIS
 2011/12 HSBC SEVENS WORLD SERIES STATISTICAL REVIEW GOLD COAST, DUBAI & PORT ELIZABETH IRB GAME ANALYSIS This statistical report summarises the Australia (Gold Coast), Dubai and South Africa (Port Elizabeth)
2011/12 HSBC SEVENS WORLD SERIES STATISTICAL REVIEW OVERALL IRB GAME ANALYSIS
 2011/12 HSBC SEVENS WORLD SERIES STATISTICAL REVIEW OVERALL IRB GAME ANALYSIS This statistical report summarises the 2011/12 HSBC Sevens World Series. The report comprises a quantitative analysis of all
IRB SEVENS WORLD SERIES 2009/10 STATISTICAL REVIEW DUBAI 2009 IRB GAME ANALYSIS
 IRB SEVENS WORLD SERIES 2009/10 STATISTICAL REVIEW DUBAI 2009 IRB GAME ANALYSIS This is a report on the DUBAI leg of the IRB Sevens World Series 2009/10. It comprises a quantitative analysis of all elements
IRB SEVENS WORLD SERIES 2009/10 STATISTICAL REVIEW ADELAIDE 2010 IRB GAME ANALYSIS
 IRB SEVENS WORLD SERIES 2009/10 STATISTICAL REVIEW IRB GAME ANALYSIS This is a report on the leg of the IRB Sevens World Series 2009/10. It comprises a quantitative analysis of all elements of play together
STATISTICAL REVIEW AND MATCH ANALYSIS
 STATISTICAL REVIEW AND MATCH ANALYSIS IRB GAME ANALYSIS CONTENTS Page Commentary 1 Pool Results 5 Knockout Results 7 Player Statistics 8 Summary 9 Section 1 10 Summary of Constituent Game Elements Section
IRB SEVENS WORLD SERIES 2009/10 STATISTICAL REVIEW HONG KONG 2010 IRB GAME ANALYSIS
 IRB SEVENS WORLD SERIES 2009/10 STATISTICAL REVIEW This is a report on the leg of the IRB Sevens World Series 2009/10. It comprises a quantitative analysis of all elements of play together with the approach
MATCH OFFICIAL DEVELOPMENT REVIEW FORM /19
 MATCH OFFICIAL DEVELOPMENT REVIEW FORM 2 2018/19 MATCH OFFICIAL: SOCIETY/ORGANISATION: MATCH: GAME LEVEL: DEVELOPER: LEVEL: DATE: VERSUS: COMPETITION: ORGANISATION: GAME CONTEXT PLAYING CONDITIONS: GAME
M ATCH OFFICIAL PERFORMANCE RE VIE W FORM /19
 M ATCH OFFICIAL PERFORMANCE RE VIE W FORM 3 2018/19 REFEREE: SOCIETY/ORGANISATION: MATCH: GAME LEVEL: REVIEWER: LEVEL: DATE: VERSUS: COMPETITION: ORGANISATION: ASSISTANT REFEREE 1: ASSISTANT REFEREE 2:
GAME NOTES FRANCE VS SCOTLAND
 FRANCE VS SCOTLAND HEAD TO HEAD Scotland have won two of their last three Six Nations meetings with France, only losing at the Stade de France in 2017. They had won just one of their first 16 Six Nations
REFEREEING KIDS RUGBY (U8-U12)
") REFEREEING KIDS RUGBY (U8-U12) LAW THEORY AND MANAGEMENT EXAMINATION 2014 RKR Law and Management Exam 2014 This examination is comprised of questions that are applicable to the role of the referee during
REFEREEING KIDS RUGBY (U8-U12) LAW THEORY AND MANAGEMENT EXAMINATION 2014 RKR Law and Management Exam 2014 This examination is comprised of questions that are applicable to the role of the referee during
The below Rules of Play shall apply to Under 11 and Under 12 rugby.
 D) U11 AND U12 RULES OF PLAY Players and match officials must ensure that the Under 11 and Under 12 Rules of Play and RFU Regulation are observed when playing rugby at Under 11 and Under 12. The below
BASIC RULES OF THE GAME
 BASIC RULES OF THE GAME BASIC INFORMATION Rugby union is played by two teams of 15 players. The aim of the game is very simple - use the ball to score more points than the other team. You can run with
Level 1 Referee Competency Statements
 Level 1 Referee Competency Statements May 2006 Level 1 Referee Competency Statements Australian Rugby Union Level 1 Referees will be able to: A. MANAGEMENT 1. COMMUNICATION Followed acceptable communication
2013 CARMICHAEL HAWKS YOUTH RUGBY CLUB
 2013 CARMICHAEL HAWKS YOUTH RUGBY CLUB U10 HANDBOOK Welcome to the 2013 youth rugby season! We are excited that you have chosen to be a Carmichael Hawk and we promise you a very rewarding rugby experience.
(B) MINI RUGBY (UNDER 9 AND UNDER 10)
 MINI RUGBY (UNDER 9 AND UNDER 10)") (B) (UNDER 9 AND UNDER 10) Players and match officials must endeavour to ensure the irb Laws of the Game, modified by the following playing rules, are observed when playing rugby at Under 9 and Under 10:-
(B) (UNDER 9 AND UNDER 10) Players and match officials must endeavour to ensure the irb Laws of the Game, modified by the following playing rules, are observed when playing rugby at Under 9 and Under 10:-
Level 2 Referee Competency Statements. May 2006
 Level 2 Referee Competency Statements May 2006 Level 2 Referee Competency Statements Australian Rugby Union Level 2 Referees will be able to: A. MANAGEMENT 1. COMMUNICATION Adhere to the communication
UAE QUICK RIP RUGBY 7 s RULES U8 s & U12/U15 Girls. Law Overview
 Law Overview 7 players on the field Games are played over a 30min period with a 2min half time break. This can be broken down into 4 x 7min quarters or 2 x 15min halves. Duration must be agreed by coaches
IRB LEISURE RUGBY LAWS BEACH FIVES RUGBY
 IRB LEISURE RUGBY LAWS BEACH FIVES RUGBY IRB Leisure Rugby Laws LAW 1: THE GROUND 1.1 Surface of the playing enclosure (a) The surface must be safe to play on at all times. (b) The surface must be sand.
LAWS SUMMARY FOR U6 TO U12 U6 U7 U8 U9 U10 U11 U12 Player Numbers /3 Field L:60m, W:25m. 2 x 15 mins
 LAWS SUMMARY FOR U6 TO U12 U6 U7 U8 U9 U10 U11 U12 Player Numbers 7 7 10 12 15 Playing Area 1/4 Field L:40m, W:25m 1/3 Field L:60m, W:25m 1/2 Field L:60m, W:35m Full field less 10m width L:100m, W:60m
UNDER 13s RULES OF PLAY (Transitional Contact) - BOYS ONLY
 - BOYS ONLY") RFU REGULATION 15 AGE GRADE RUGBY (APPENDIX 7) UNDER 13s RULES OF PLAY (Transitional Contact) - BOYS ONLY Players and match officials must ensure that the following Rules of Play and RFU Regulation 15
RFU REGULATION 15 AGE GRADE RUGBY (APPENDIX 7) UNDER 13s RULES OF PLAY (Transitional Contact) - BOYS ONLY Players and match officials must ensure that the following Rules of Play and RFU Regulation 15
APPENDIX 8. RFU REGULATION 15 AGE GRADE RUGBY Appendix 8 Under 14s. UNDER 14s RULES OF PLAY (Transitional Contact) BOYS ONLY
 BOYS ONLY") APPENDIX 8 UNDER 4s RULES OF PLAY (Transitional Contact) BOYS ONLY Players and match officials must ensure that the applicable Rules of Play and RFU Regulation 5 www.englandrugby.com/governance/regulations
APPENDIX 8 UNDER 4s RULES OF PLAY (Transitional Contact) BOYS ONLY Players and match officials must ensure that the applicable Rules of Play and RFU Regulation 5 www.englandrugby.com/governance/regulations
GAME NOTES ITALY VS IRELAND
 ITALY VS IRELAND HEAD TO HEAD Italy s only Six Nations win over Ireland came in March 2013 - a 22-15 victory at the Stadio Olimpico. Italy s 19-point haul in these sides last Six Nations meeting was their
C) UNDER 10s NEW RULES OF PLAY (Transitional Contact)
 UNDER 10s NEW RULES OF PLAY (Transitional Contact)") C) UNDER 10s NEW RULES OF PLAY (Transitional Contact) Players and match officials must also ensure that RFU Regulation 15 www.englandrugby.com/governance/regulations and the IRB Laws of the Game, modified
C) UNDER 10s NEW RULES OF PLAY (Transitional Contact) Players and match officials must also ensure that RFU Regulation 15 www.englandrugby.com/governance/regulations and the IRB Laws of the Game, modified
"The whole point of rugby is that it is, first and foremost, a state of mind, a spirit." - Jean-Pierre Rives (1952- ), former French rugby captain.
, former French rugby captain.") We believe that rugby is the single greatest team sport in the world. This is not to say there are not other excellent team sports, there are, they are just second to rugby. A couple of quotes to start
We believe that rugby is the single greatest team sport in the world. This is not to say there are not other excellent team sports, there are, they are just second to rugby. A couple of quotes to start
conversion, we would have won the game. England's Jonny Wilkinson has kicked many great drop goals.
 Rugby Vocabulary Word Example sentence Meaning All Blacks attack conversion crossbar dangerous play drop goal (also field goal) drop kick field goal (alsodrop goal) Jonah Lomu played for the All Blacks.
LAWS OF IRFU TOUCH RUGBY
 LAWS OF IRFU TOUCH RUGBY Touch Laws 2014.docx Page 1 of 19 Introduction. Welcome to IRFU Touch Rugby. Touch Rugby is a fast and skilful sport suitable for all ages. It originated in Australia some 40 years
DRAFT UNDER 12s NEW RULES OF PLAY (Transitional Contact) TRIAL ONLY
 TRIAL ONLY") DRAFT UNDER 12s NEW RULES OF PLAY (Transitional Contact) TRIAL ONLY Players and match officials must also ensure that RFU Regulation 15 www.englandrugby.com/governance/regulations and the IRB Laws of the
DRAFT UNDER 12s NEW RULES OF PLAY (Transitional Contact) TRIAL ONLY Players and match officials must also ensure that RFU Regulation 15 www.englandrugby.com/governance/regulations and the IRB Laws of the
U12 CONTACT FOR JUNIORS RUGBY CLUBS
 U12 CONTACT FOR JUNIORS RUGBY CLUBS This Section contains the rules of play, regulations and recommendations (including modifications to the IRB Laws of the Game), which apply to players in the Under 12
#1 GOAL. Safety CORE PRINCIPLES
 RUGBY COLORADO TRY Rugby Youth Rugby for boys aged 5-15 and girls aged 5-17 Laws of the Game & Regulations 2011 (MODIFIED to meet the needs of Colorado TRY rugby development) #1 GOAL Safety CORE PRINCIPLES
SCRUM DEFINITION: KEY POINTS:
 SCRUM DEFINITION: scrum is formed in the field of play when eight players from each team, bound together in three rows for each team, close up with their opponents so that the heads of the front rows are
APPENDIX 4. RFU REGULATION 15 AGE GRADE RUGBY Appendix 4 Under 10s. UNDER 10s RULES OF PLAY (Transitional Contact)
") APPENDIX 4 UNDER 0s RULES OF PLAY (Transitional Contact) Players and match officials must ensure that the following Rules of Play and RFU Regulation 5 www.englandrugby.com/governance/regulations are observed
APPENDIX 4 UNDER 0s RULES OF PLAY (Transitional Contact) Players and match officials must ensure that the following Rules of Play and RFU Regulation 5 www.englandrugby.com/governance/regulations are observed
KNOW THE LAWS? BY ANDY MELROSE AND PETER SHORTELL.
 KNOW THE LAWS? BY ANDY MELROSE AND PETER SHORTELL. Andy Melrose is the Referee Department s Training & Education Officer. Peter Shortell is from the Gloucester Referees Society. They compiled a second
U13-U18 Girls Variations to the IRB Laws of the Game
 APPENDIX 3 U13-U18 Girls Variations to the IRB Laws of the Game Players and Match Officials must ensure that the IRB Laws of Game (including the IRB Under 19 Law Variations) and any such law variations
Law review proposals are considered against the following agreed principles:
 Every four years, rugby's governing body undertakes a complete health-check of the game's playing trends across the Rugby World Cup cycle to ensure that the sport continues to develop at all levels around
Television Match Official (TMO) Global Trial Protocol
 Global Trial Protocol") Television Match Official (TMO) Global Trial Protocol Introduction The current Law 6 provides the opportunity for match officials to utilise the TMO to assist in the adjudication of decisions when the
Television Match Official (TMO) Global Trial Protocol Introduction The current Law 6 provides the opportunity for match officials to utilise the TMO to assist in the adjudication of decisions when the
UNDER 12s RULES OF PLAY (Transitional Contact) - BOYS ONLY
 - BOYS ONLY") APPENDIX 6 UNDER 2s RULES OF PLAY (Transitional Contact) - BOYS ONLY Players and match officials must ensure that the following Rules of Play and RFU Regulation 5 www.englandrugby.com/governance/regulations
APPENDIX 6 UNDER 2s RULES OF PLAY (Transitional Contact) - BOYS ONLY Players and match officials must ensure that the following Rules of Play and RFU Regulation 5 www.englandrugby.com/governance/regulations
APPENDIX 10. RFU REGULATION 15 AGE GRADE RUGBY Appendix 10 Under 13s. UNDER 13s RULES OF PLAY - GIRLS ONLY
 APPENDIX 0 UNDER 3s RULES OF PLAY - GIRLS ONLY Players and match officials must ensure that the following Rules of Play and RFU Regulation 5 (www.englandrugby.com/governance/regulations) are observed when
U14 CONTACT FOR JUNIORS RUGBY CLUBS ONLY
 U14 CONTACT FOR JUNIORS RUGBY CLUBS ONLY RULES OF PLAY Players and match officials must endeavour to ensure the IRB Laws of the Game, modified by the following playing rules, are observed when playing
A Brief Introduction to Rules and Terminology of Rugby
 A Brief Introduction to Rules and Terminology of Rugby Virginia Tech has had a Men s rugby team since the fall of 1968, although it is believed that the first rugby game at Tech was played in 1891. Rugby
1/17/ S TOURNAMENT MANAGEMENT MANUAL
 1/17/2011 7 S TOURNAMENT MANAGEMENT MANUAL 7 s Competition Hosting Document The purpose of this document is to outline the requirements of a club/school/union seekng/proposing to run a 7 aside Rugby Union
CANDIDATE SCRIPT AND ANSWER PAPER
 LAWS OF THE GAME THEORY EXAMINATION 2014 LEVEL II CANDIDATE SCRIPT AND ANSWER PAPER 1 Name of Candidate Name of Province Name of Sub-Association 1. SITTING CATEGORY NEW ZEALAND RUGBY UNION Laws of the
mix-up s ssion COACHING GUIDE Rugby Football Union.
 mix-up E s ssion COACHING GUIDE www.xrugby7s.com Rugby Football Union. WEEK 1 Engagement SESSION AIMS: Increasing motivation to support regular participation. Setting a positive learning environment through
Counter-Attack Statistics and Systems
 Counter-Attack Statistics and Systems Daniel Hooper COUNTER ATTACK - STATISTICS In the modern Professional edition of rugby union, defence has become a major focus of all professional teams. With almost
Introductory (Level) 1 Referee Competency Assessment Form
 1 Referee Competency Assessment Form") Introductory (Level) 1 Referee Competency Assessment Form May 2006 Assessment Tool Name...Date:... Venue:... Player Age & Grade:... Special Conditions:...... Demonstrated (Yes/No) this column should be
Introductory (Level) 1 Referee Competency Assessment Form May 2006 Assessment Tool Name...Date:... Venue:... Player Age & Grade:... Special Conditions:...... Demonstrated (Yes/No) this column should be
BCRRS OFFICIAL'S GAME MANAGEMENT DOCUMENT Notes on U-19 and High School Games
 January 1, 2017 1 BCRRS OFFICIAL'S GAME MANAGEMENT DOCUMENT 2016-17 Notes on U-19 and High School Games For the most part the Laws of the Game and policies for games played by U-19 players, are the same
2018 Foxtel Touch 7s Laws
 2018 Foxtel Touch 7s Laws The Ground There are two options: Half field (60m x 35m) Third field (60m x 25m) The Ball Size 4 Under 11 and below Size 3 Number of Players 7 players A team may have up to 5
The length of the touchline must be greater than the length of the goal line
 General Principal Where not stated, the normal Laws of Association Soccer apply with the exceptions notably: that there is no running and no offside in Walking Soccer. The Playing Area The playing area
RFU LAWS LABORATORY BY DICK TILLEY, DIRECTOR OF CAMBRIDGE LAWS LABORATORY.
 RFU LAWS LABORATORY BY DICK TILLEY, DIRECTOR OF CAMBRIDGE LAWS LABORATORY. The author is in charge of trialling potential law changes at Cambridge University. He also organises coaching courses in the
Introduction to Match Officiating (L1)
") Introduction to Match Officiating (L1) Section 1 Online Learning Module Copyright World Rugby Limited 2016. All rights reserved. Contents Introduction and Aims... 3 Principles of Rugby... 4 Conduct...
Introduction to Match Officiating (L1) Section 1 Online Learning Module Copyright World Rugby Limited 2016. All rights reserved. Contents Introduction and Aims... 3 Principles of Rugby... 4 Conduct...
RUGBY REFEREE DEVELOPMENT SYSTEM INSTRUCTION MANUAL 2017 PLEASE READ THE MANUAL
 INSTRUCTION MANUAL 2017 PLEASE READ THE MANUAL IT IS HIGHLY RECOMMENDED TO READ THIS SHORT MANUAL TO BENEFIT COMPLETELY FROM ALL THE FEATURES THAT OFFERS SYSTEM SET-UP 1. WEBSITE ADDRESS: usa.advantagereferee.com
WOMEN S 5 ASIDE PLAYING RULES Women s 5Aside Playing Rules
 2013 WOMEN S 5 ASIDE PLAYING RULES 2013 Women s 5Aside Playing Rules 1 Playing Rules All rules and regulations of the Laws of the Game (Laws 1-17 inclusive) will apply unless otherwise directed below.
GAME MANAGEMENT GUIDELINES
 GAME MANAGEMENT GUIDELINES FOR COMMUNITY LEVEL RUGBY IN AUSTRALIA 2012 GMG Working Party A. Cole, A. Thompson, M. Wilkie, R. Mancell, J. McGregor. 5 th February 2012 GAME MANAGEMENT GUIDELINES 2012 The
WFA Laws of the Game 2018
 WFA Laws of the Game 2018 Introduction Whilst it is acknowledged there are no universal laws commonly used throughout the various interpretations of walking football, the WFA Laws of the Game reflect the
1. Kick-off The assistant referees must be in line with the second-last opponent.
 LAW 6 THE ASSISTANT REFEREES 85 Duties and responsibilities The assistant referees help the referee to control the match in accordance with the Laws of the Game. They also assist the referee in all other
Key Competencies for Grading Referees August 21, 2012
 Non- Compliances Failures in observation Errors in Law Key Competencies for Grading Referees August 21, 2012 Materiality C- Grade referees are not expected to apply materiality. If a C- Referee penalizes
MORE THAN A GAME TOUCH
 MORE THAN A GAME TOUCH Guide to playing Touch Rugby Club Club 't Gooi 't Gooi INTRODUCTION - WHAT IS TOUCHRUGBY? The origins of touchrugby can be traced back to Australia in the 1960s where it was used
IRFU Mini Rugby Regulations 2
 IRFU Mini Rugby Regulations 2 IRFU Age Grade Rugby Mini and Leprechaun Rugby (LTPD Stage 1) - Growing from 6 to 6 Nations 2015 to 2016 Mini and Leprechaun Rugby Mission Statement The ethos of Mini and
Village Soccer Leagues: Futsal Rules
 LAW I The Field Size: 40-45 x 15-20 M Goals: 2M X 3M X 1M DEEP Village Soccer Leagues: Futsal Rules LAW II - The Ball (All games will be played with a regulation futsal ball) Size #4 Circumference: 62-64
CRLRA WOLLONGONG SEMINAR
 CRLRA WOLLONGONG SEMINAR 2012 Q 1 Red kicks in General Play on the 3 rd tackle. The ball accidentally strikes a Blue player, on the full, on the Blue s 10 metre line and rebounds into touch-in-goal behind
Law 13 Kick-off and Restart Kicks
 DEFINITION The kickoff occurs at the start of the match and the restart of the match after halftime. Restart kicks occur after a score or a touch down. 13.1 WHERE AND HOW THE KICK-OFF IS TAKEN A team kicks
GAME MANAGEMENT GUIDELINES
 GAME MANAGEMENT GUIDELINES 2018 April 2018 1 INDEX 1.0 Introduction 2.0 Scrum 3.0 Tackle 4.0 Ruck 5.0 Offside in General Play 6.0 Quick Throw & Lineout 7.0 Maul 8.0 Kick Offs, Restarts & Other Kicks 9.0
WALES TOUCH ASSOCIATION PLAYING RULES FOR ATOMIC TOUCH /TOUCHBALL 2 nd EDITION
 WALES TOUCH ASSOCIATION PLAYING RULES FOR ATOMIC TOUCH /TOUCHBALL 2 nd EDITION WALES TOUCH ASSOCIATION PLAYING RULES FOR ATOMIC TOUCH /TOUCHBALL 2 nd EDITION MARCH 2012 Notice This booklet outlining the
WALES TOUCH ASSOCIATION. PLAYING RULES FOR ATOMIC TOUCH /TOUCHBALL 2 nd EDITION MARCH 2012
 B1.2 - WTA Touchball / Atomic Touch Rules of Play- 2 nd Edition March 2012 WALES TOUCH ASSOCIATION PLAYING RULES FOR ATOMIC TOUCH /TOUCHBALL 2 nd EDITION MARCH 2012 Notice This document outlines the playing
World Rugby Leisure Rugby Laws Tag Rugby
 World Rugby Leisure Rugby Laws Tag Rugby Leisure Rugby Laws THE PLAN In-goal Goal line In-goal 5-metre broken line 5m 5m 10-metre broken line Half way line 10m Not exceeding 70m 10-metre broken line Touchline
Walking Football Laws of the Game Player s Abridged Version
 Walking Football Laws of the Game Player s Abridged Version Contents Introduction... 3 The Field of Play... 4 The Players... 5 The Player s Equipment... 5 The Referee... 6 Duration of the Match... 6 The
PART 1 - Are You Ready to Play Rugby Policy and Procedures
 Age Grade Law Variations Laws of the game for rugby union played by young people aged 19 or under, covering the following age groups: Under 19 - Under 15 boys Under 18 Girls Under 15 Girls S2 Boys S1 Boys
Please advise all schools, clubs, associations and affiliate unions under your control.
 MEMORANDUM DATE: 26 May 2004 TO: FROM: SUBJECT: ARU Member & Affiliate Unions Geoff Shaw General Manager Community Rugby Age Grade Rugby Players Maximum Playing Time Unions are requested to note that as
FLAG RUGBY U8 & U10 LAWS OF THE GAME (REVISED FEB 2017)
") FLAG RUGBY U8 & U10 LAWS OF THE GAME (REVISED FEB 2017) The object of the game is that to teams of seven players each, observing fair play according to the Laws and sporting spirit, should by carrying,
FLAG RUGBY U8 & U10 LAWS OF THE GAME (REVISED FEB 2017) The object of the game is that to teams of seven players each, observing fair play according to the Laws and sporting spirit, should by carrying,
GAME MANAGEMENT GUIDELINES FOR RUGBY IN ONTARIO
 GAME MANAGEMENT GUIDELINES FOR RUGBY IN ONTARIO - 2017 The Game Management Guidelines are to reflect the playing, coaching and refereeing of the game in Ontario. The purpose of these guidelines is to ensure
An examination of try scoring in rugby union: a review of international rugby statistics.
 An examination of try scoring in rugby union: a review of international rugby statistics. Peter Laird* and Ross Lorimer**. *4 Seton Place, Edinburgh, EH9 2JT. **66/5 Longstone Street, Edinburgh, EH14 2DA.
A Beginner s Guide to. Rugby Union
 A Beginner s Guide to Rugby Union Safety as a top priority Rugby is a highly physical Game. To enjoy it to its utmost you need to be physically and mentally prepared. You also need to understand how to
INTERNATIONAL RUGBY BOARD LEVEL 2 COACHING DEVELOPING RUGBY SKILLS
 INTERNATIONAL RUGBY BOARD DEVELOPING RUGBY SKILLS INTERNATIONAL RUGBY BOARD DEVELOPING RUGBY SKILLS Course manual International Rugby Board 2011 Course workbook International Rugby Board 2011 Level 2 Coaching
RUGBY PATHWAY. Minis to Millennium
 RUGBY PATHWAY Minis to Millennium RECOMMENDED FIELD FOR 10-A-SIDE GAMES Based on a full-size pitch 5m 15m 5m 40m DIRECTION OF PLAY 22m 22m 10m 10m Half Way 5m 5m 60m 60m Half Way 10m 10m 40m DIRECTION
MATCH OFFICIAL DEVELOPER AND PERFORMANCE REVIEWER
 MATCH OFFICIAL DEVELOPER AND PERFORMANCE REVIEWER REVIEW GUIDANCE 2018/19 Rugby Football Union AIM To implement a nationally standardised approach to supporting the development of match officials, which
There are many reasons why people become involved in officiating Rugby.
 BCRRS Referee and Match Official Coach Pathway Document (2013) There are many reasons why people become involved in officiating Rugby. Some people want to referee as a pastime they can fit into the commitments
GLOBAL LAW TRIALS 1 August 2017 either 1 January January 2018 (for scrum and tackle/ ruck laws)
") GLOBAL LAW TRIALS 1 GLOBAL LAW TRIALS In line with the law review timelines, the trials will begin on 1 August 2017 in the northern hemisphere and either 1 January 2017 or 1 January 2018 (for scrum and
GLOBAL LAW TRIALS 1 GLOBAL LAW TRIALS In line with the law review timelines, the trials will begin on 1 August 2017 in the northern hemisphere and either 1 January 2017 or 1 January 2018 (for scrum and
Soccer Statistics Summary with Extended Coverage
 Soccer Statistics Summary with Extended Coverage 2018 1 SPORTRADAR SOCCER STATISTICS SUMMARY Sport & Category Information Category Country Code Category Name Sport Name Category Id Sport Id Tournament
RECOMMENDED FIELD FOR 10-A-SIDE GAMES
 RECOMMENDED FIELD FOR 10-A-SIDE GAMES Based on a full-size pitch 5m 15m 5m 40m DIRECTION OF PLAY 22m 22m 10m 10m Half Way 5m 5m 60m 60m Half Way 10m 10m 40m DIRECTION OF PLAY 22m 22m 5m 5m 15m CONTENTS
Standardised Instructions for Assistant Referees
 Appendix F Standardised Instructions for Assistant Referees Referees will ask their assistant referees to carry out their duties in accordance with the following instructions, based on the requirements
The following changes need to be made to the 2015 SARU law book to make it compliant for the 2016 season
 The following changes need to be made to the 2015 SARU law book to make it compliant for the 2016 season LAW 3 P37 [NEW] 3.5 THE FRONT ROW - REPLACEMENTS AND SUBSTITUTIONS (a) It is the team s responsibility
SSI/IRFU Men s Rugby League & Cup
 SSI/IRFU Men s Rugby 2017-2018 League & Cup Playing Rules 1. Divisions Student Sport Ireland in association with the IRFU shall coordinate the Men s Rugby League with divisions as follows: 1.1. Brendan
FEDERATION OF INTERNATIONAL TOUCH
 FEDERATION OF INTERNATIONAL TOUCH BEACH / INDOOR TOUCH PLAYING RULES FOREWORD This booklet on the Rules of Beach or Indoor Touch is an insight into an exciting new game, especially designed for fast action,
RETREATING LINE INTRODUCTION
 INTRODUCTION This guide has been developed to help all clubs, coaches, club based referees, parents and players, who are participating in football games utilising the. You will find the rules and regulations
News from the British Columbia Rugby Referees Society
 Whistle Talk News from the British Columbia Rugby Referees Society New Season Begins Volume 2 ed 1 There will be a lot of new in the upcoming season of BC Rugby: new Rules of Competition, new league structures,
NRL LAWS & INTERPRETATIONS 2018
 NRL LAWS & INTERPRETATIONS 2018 FROM NRL The 2018 NRL competition will be adjudicated in accordance with the current Rugby League Laws of the Game, International level, approved by the Australian Rugby
Impact and Influence. Gary Townsend, RFU Player Development Manager
 Impact and Influence Gary Townsend, RFU Player Development Manager Background Continuum written in 1990 No RFU template for skills acquisition U13-18. In 2007 identified need to visit first principles
Greater Manchester Walking Football League Rules (Amended November 2017)
") Greater Manchester Walking Football League Rules (Amended November 2017) 6-A-SIDE - Maximum squad of 10. 4 FLEXI SUBS - Any player - multi-use. Wait for a break in play on the referee s whistle or when
Greater Manchester Walking Football League Rules (Amended November 2017) 6-A-SIDE - Maximum squad of 10. 4 FLEXI SUBS - Any player - multi-use. Wait for a break in play on the referee s whistle or when
GAME DEVELOPMENT TOUCH JUDGE COURSE WORKBOOK
 GAME DEVELOPMENT TOUCH JUDGE COURSE WORKBOOK Steve Griffiths January 2002 Michael Malone July 2006, March 2008, and October 2009 CONTENTS Organization and Objective of the Course Page 1 MODULE 1 THE ROLE
 Preface The following Rules of Play for Rugby Virginia, Tackle (Contact) Rugby were derived from existing International Rugby Board (IRB) Law and former USA Rugby Midi-Rugby Rules of Play, and are consistent
ORIGINS OF RUGBY FIELD OF PLAY RUGBY ETHOS
 ORIGINS OF RUGBY Rugby is the precursor of American football and has been played in the United States since about 170. American football, as well as basketball, owes many of it s characteristics to rugby.
ORIGINS OF RUGBY FIELD OF PLAY RUGBY ETHOS
 ORIGINS OF RUGBY Rugby is the precursor of American football and has been played in the United States since about 170. American football, as well as basketball, owes many of its characteristics to rugby.