Table of Contents STANDARD 1.F.
|
|
|
- Marianna Gwen Johnston
- 5 years ago
- Views:
Transcription
1 Table of Contents TC Assignments Page # 7. Textbook scavenger hunt 8. Bubble gum lab 9. Averages. Scientific method quiz. Averages handout. Motion Position notes. Speed and Graphing STANDARD.F. Students know how to interpret graphs of (position) versus time and speed versus time for motion in a single direction.
2 (position) vs Graphs
3 Constant speed graph this graph should show that the object's speed does not change. Let's graph a bike traveling at a constant speed of meter per second. Constant speed graph a bike traveling at a constant speed of meter per second.
4 Constant speed graph a bike traveling at a constant speed of meter per second. Constant speed graph a bike traveling at a constant speed of meter per second.
5 Constant speed graph At second, we should expect the bike to travel meter. Constant speed graph At second, we should expect the bike to travel meter.
6 Constant speed graph At second, we should expect the bike to travel meter. Constant speed graph At second, we should expect the bike to travel meters. 6
7 Constant speed graph Since it is going at a constant speed of meter per second this is what the graph will look like after seconds. Constant speed graph is a diagonal line 7


8 Position vs. distance constant speed distance time Fast Position v. distance time Slow time 8
9 Stationary speed graph Stationary speed graph a person is tired of running and is taking a break. The runner is not moving. Let's graph the runner's speed at 0 meters per second. 9
10 Stationary speed graph the runner's speed at 0 meters per second. Stationary speed graph the runner's speed at 0 meters per second.
11 Stationary speed graph the runner's speed at 0 meters per second. Stationary speed graph At second, we should expect the runner to travel 0 meter. the runner's speed at 0 meters per second.
12 Stationary speed graph At second, we should expect the runner to travel 0 meter. the runner's speed at 0 meters per second. Stationary speed graph At second, we should expect the runner to travel 0 meter. the runner's speed at 0 meters per second.


13 Stationary speed graph A horizontal line the runner's speed at 0 meters per second. distance stationary time Position vs.

14 Acceleration Graph Acceleration Graph Acceleration is speeding up A car hits it's turbo and speeds up in a race at an extra meters per second
15 Acceleration Graph A car hits it's turbo and speeds up in a race an extra meters per second Acceleration Graph A car hits it's turbo and speeds up in a race an extra meters per second
16 Acceleration Graph A car hits it's turbo and speeds up in a race an extra meters per second Acceleration Graph from 0 to second it traveled a total of meters A car hits it's turbo and speeds up in a race an extra meters per second 6
17 Acceleration Graph from to seconds, the car increases it speed to meters per second and travels a total of meters A car hits it's turbo and speeds up in a race an extra meters per second Acceleration Graph between and seconds, the car increases it speed to meters per second and traveled a total of 0 meters. A car hits it's turbo and speeds up in a race an extra meters per second 7
18 Acceleration Graph At second, the car should increases it's speed to meters per second and traveled a total of 0 meters A car hits it's turbo and speeds up in a race an extra meters per second Acceleration Graph A half U shape A car hits it's turbo and speeds up in a race an extra meters per second 8


19 Position vs. distance speeding up time Deceleration Graph Slowing down 9
20 Deceleration Graph Slowing down Deceleration Graph

21 Deceleration Graph A half C Shape Position v. distance slowing down time
22 SPEED vs TIME Graphs Speeding up Graph Speed
23 Speed Speeding up Graph Line goes up Slowing down Graph Speed


24 Speed Slowing down Graph Line goes down Speed vs. speed speeding up time speed slowing down time
25 Constant speed Graph Speed Speed Constant speed Graph Any flat line above 0
26 Stationary speed Graph Speed Speed Stationary speed Graph Flat line at 0 6


27 Speed vs. speed constant speed time speed stationary time 7
28 8
29 9
30 0
Homework: Turn in Tortoise & the Hare
 Your Learning Goal: After students experienced speed in the Runner s Speed Lab, they will be able to describe how different speeds look like on a graph with 100% accuracy. Table of Contents: Notes: Graphs
Warm up # 20. Table of Contents TC1
 Warm up # 20 Try and describe where something is located in class. Table of Contents TC1 Assignments Page # 7. Textbook scavenger hunt 8. Bubble gum lab 9. Averages 10. Scientific method quiz 11. Motion
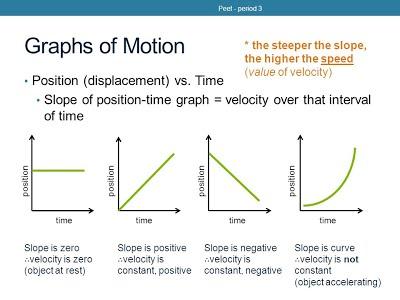
Describing a journey made by an object is very boring if you just use words. As with much of science, graphs are more revealing.
 Distance vs. Time Describing a journey made by an object is very boring if you just use words. As with much of science, graphs are more revealing. Plotting distance against time can tell you a lot about
Motion Graphing Packet
 Name: Motion Graphing Packet This packet covers two types of motion graphs Distance vs. Time Graphs Velocity vs. Time Graphs Describing the motion of an object is occasionally hard to do with words. Sometimes
Compare the scalar of speed and the vector of velocity.
 Review Video QOD 2/14/12: Compare the scalar of speed and the vector of velocity. What are the equations for each? Feb 14 6:51 AM 1 Imagine that you are a race car driver. You push on the accelerator.
x 2 = (60 m) 2 + (60 m) 2 x 2 = 3600 m m 2 x = m
 2 + (60 m) 2 x 2 = 3600 m m 2 x = m") 3.1 Track Question a) Distance Traveled is 1600 m. This is length of the path that the person took. The displacement is 0 m. The person begins and ends their journey at the same position. They did not
3.1 Track Question a) Distance Traveled is 1600 m. This is length of the path that the person took. The displacement is 0 m. The person begins and ends their journey at the same position. They did not
Speed Reading. Forces Cause Change. The force of a bat hitting a baseball causes the baseball to change direction.
 Speed Reading Forces Cause Change The force of a bat hitting a baseball causes the baseball to change direction. The force of the wind blowing can cause a sailboat to change position as the sail is pushed.
Fall 2008 RED Barcode Here Physics 105, sections 1 and 2 Please write your CID Colton
 Fall 2008 RED Barcode Here Physics 105, sections 1 and 2 Exam 1 Please write your CID Colton 2-3669 3 hour time limit. One 3 5 handwritten note card permitted (both sides). Calculators permitted. No books.
Movement and Position
 Movement and Position Syllabus points: 1.2 plot and interpret distance-time graphs 1.3 know and use the relationship between average speed, distance moved and 1.4 describe experiments to investigate the
Do Now 10 Minutes Topic Speed and Velocity
 Do Now 10 Minutes Topic Speed and Velocity Clear off everything from your desk, except for a calculator and something to write with. We re taking a pop quiz. Homework Complete the Distance vs. Displacement
a. Determine the sprinter's constant acceleration during the first 2 seconds. b. Determine the sprinters velocity after 2 seconds have elapsed.
 AP Physics 1 FR Practice Kinematics 1d 1 The first meters of a 100-meter dash are covered in 2 seconds by a sprinter who starts from rest and accelerates with a constant acceleration. The remaining 90
Jeddah Knowledge International School. Science Revision Pack Answer Key Quarter 3 Grade 10
 Jeddah Knowledge International School Science Revision Pack Answer Key 2016-2017 Quarter 3 Grade 10 Name: Section: ANSWER KEY- SCIENCE GRADE 10, QUARTER 3 1 1. What are the units for mass? A Kilograms
Figure 1 shows the distance time graph for a person walking to a bus stop. Figure 1. Time in seconds
 (a) Figure shows the distance time graph for a person walking to a bus stop. Figure Time in seconds (i) Which one of the following statements describes the motion of the person between points R and S on
Last First Date Per SETTLE LAB: Speed AND Velocity (pp for help) SPEED. Variables. Variables
 SPEED. Variables. Variables") DISTANCE Last First Date Per SETTLE LAB: Speed AND Velocity (pp108-111 for help) Pre-Activity NOTES 1. What is speed? SPEED 5-4 - 3-2 - 1 2. What is the formula used to calculate average speed? 3. Calculate
DISTANCE Last First Date Per SETTLE LAB: Speed AND Velocity (pp108-111 for help) Pre-Activity NOTES 1. What is speed? SPEED 5-4 - 3-2 - 1 2. What is the formula used to calculate average speed? 3. Calculate
Practice Problem. How long will it take a car going from 10 m/s to 50 m/s if the acceleration is 4 m/s2?
 Practice Problem How long will it take a car going from 10 m/s to 50 m/s if the acceleration is 4 m/s2? Practice Problem If a car slams on its breaks and comes to a complete stop, after driving for 20
You should know how to find the gradient of a straight line from a diagram or graph. This next section is just for revision.
 R1 INTERPRET THE GRADIENT OF A STRAIGHT LINE GRAPH AS A RATE OF CHANGE; RECOGNISE AND INTERPRET GRAPHS THAT ILLUSTRATE DIRECT AND INVERSE PROPORTION (foundation and higher tier) You should know how to
PHYSICS 12 NAME: Kinematics and Projectiles Review
 NAME: Kinematics and Projectiles Review (1-3) A ball is thrown into the air, following the path shown in the diagram. At 1, the ball has just left the thrower s hand. At 5, the ball is at its original
The bus has to stop a few times. The figure below shows the distance time graph for part of the journey. Time in seconds
 HW Acceleration / 55 Name Q1.A bus is taking some children to school. The bus has to stop a few times. The figure below shows the distance time graph for part of the journey. Time in seconds How far has
Motion. 1 Describing Motion CHAPTER 2
 CHAPTER 2 Motion What You ll Learn the difference between displacement and distance how to calculate an object s speed how to graph motion 1 Describing Motion 2(D), 4(A), 4(B) Before You Read Have you
1. A rabbit can cover a distance of 80 m in 5 s. What is the speed of the rabbit?
 Chapter Problems Motion at Constant Speed Class Work. A rabbit can cover a distance of 80 m in 5 s. What is the speed of the rabbit?. During the first 50 s a truck traveled at constant speed of 5 m/s.
Phys 201A. Lab 6 - Motion with Constant acceleration Kinematic Equations
 Phys 201A Lab 6 - Motion with Constant acceleration Kinematic Equations Problems: It would be good to list your four kinematic equations below for ready reference. Kinematic equations 1) An amateur bowler
JR. GENIUS EDUCATIONAL SERVICES INC.
 1 Name: 1. Multiple Choice: 25 marks Copy to Scantron Card after finding the answer on the sheet. Fill in the Scantron card in the last 5 min. of the test. Do Short section first. 1. You are riding your
AP Physics Chapter 2 Practice Test
 AP Physics Chapter 2 Practice Test Answers: E,E,A,E,C,D,E,A,C,B,D,C,A,A 15. (c) 0.5 m/s 2, (d) 0.98 s, 0.49 m/s 16. (a) 48.3 m (b) 3.52 s (c) 6.4 m (d) 79.1 m 1. A 2.5 kg ball is thrown up with an initial
Ch. 2 & 3 Velocity & Acceleration
 Ch. 2 & 3 Velocity & Acceleration Objective: Student will be able to Compare Velocity to Speed Identify what is acceleration Calculate velocity and acceleration from an equation and from slope of a graph.
Speed and Acceleration. Measuring motion
 Speed and Acceleration Measuring motion Measuring Distance Meter international unit for measuring distance. 1 mm = 50 m Calculating Speed Speed (S) = distance traveled (d) / the amount of time it took
Relative Motion. New content!
 Relative Motion New content! Task: Draw the speed vs time graphs for the six toy cars 2-D Kinematics Relative Motion Projectile Motion Angled Projectiles Announcements Meet in the lab tomorrow (bring
Activity 1: Walking Graphs. Answer the following questions based on your experiences in the Student Activity: Walk This Way.
 I. Foundations for Functions 3.1 Interpreting Distance versus Graphs: Activity 1 Activity 1: Walking Graphs Answer the following questions based on your experiences in the Student Activity: Walk This Way.
Chapter 11 Motion. Displacement-. Always includes Shorter than distance
 Chapter 11 Motion Section 1 - an object s change in position relative to a reference point. Observe objects in to other objects. international unit for. Frame of Reference Frame of reference- a system
Chapter : Linear Motion 2
 Text: Chapter 2.5-2.9 Think and Explain: 4-8 Think and Solve: 2-4 Chapter 2.5-2.9: Linear Motion 2 NAME: Vocabulary: constant acceleration, acceleration due to gravity, free fall Equations: s = d t v =
The distance-time graphs below represent the motion of a car. Match the descriptions with the graphs. Explain your answers.
 Motion Graphs 6 The distance-time graphs below represent the motion of a car. Match the descriptions with the graphs. Explain your answers. Descriptions: 1. The car is stopped. 2. The car is traveling
Kinematics 1. A. coefficient of friction between the cart and the surface. B. mass of the cart. C. net force acting on the cart
 Kinematics 1 Name: Date: 1. 4. A cart moving across a level surface accelerates uniformly at 1.0 meter per second 2 for 2.0 seconds. What additional information is required to determine the distance traveled
D) 83 m D) Acceleration remains the same and speed increases. C) 216 m B) 6.0 m shorter A) 4.5 s A) 15 km/hr C) 47 m C) 20 m/sec B) 20 m/sec
 83 m D) Acceleration remains the same and speed increases. C) 216 m B) 6.0 m shorter A) 4.5 s A) 15 km/hr C) 47 m C) 20 m/sec B) 20 m/sec") 1. A truck, initially traveling at a speed of 22 meters per second, increases speed at a constant rate of 2.4 meters per second 2 for 3.2 seconds. What is the total distance traveled by the truck during
1. A truck, initially traveling at a speed of 22 meters per second, increases speed at a constant rate of 2.4 meters per second 2 for 3.2 seconds. What is the total distance traveled by the truck during
During the Push What kind of motion does the puck have at this time? Is it speeding up, slowing down, not moving, or moving at a steady speed?
 Elaborate The teacher is giving a demonstration with a hover puck. Make the requested predictions before using your observations to check if you were correct or if you need to make changes.. Predict how
1.67 m/s m/s. 4 m/s
 Physics Problem Set 2 Week 2 (5620108) Question 1 2 3 4 5 6 7 8 9 10 11 12 13 14 15 16 17 18 1. Question Details OSColPhys1 2.P.043.WA. [2707255] An athlete is training on a 100 m long linear track. His
Physics 2204 Worksheet 6.5: Graphical Analysis of Non- Uniform Motion D-T GRAPH OF NON-UNIFORM MOTION (ACCELERATING) :
 :") Physics 2204 Worksheet 6.5: Graphical Analysis of Non- Uniform Motion D-T GRAPH OF NON-UNIFORM MOTION (ACCELERATING) : The d-t graph for uniformly Accelerated motion is definitely not the same as a d-t
Physics 2204 Worksheet 6.5: Graphical Analysis of Non- Uniform Motion D-T GRAPH OF NON-UNIFORM MOTION (ACCELERATING) : The d-t graph for uniformly Accelerated motion is definitely not the same as a d-t
Section 1. Objectives:
 Chapter 2 Motion Objectives: Section 1 Use a frame of reference to describe motion Differentiate between Speed and Velocity Calculate the speed of an object Use graphs to describe speed Observing Motion
The CBL cannot get accurate data closer than about 0.5 meters, so your graphs will be distorted anywhere the y-values are less than 0.5 meters.
 Name Hour Hiker Lab In this lab, you will be given a graph and you must try to walk in a manner so that the graph of your distance vs. time looks like the given graph. You will need: 1. A TI83 graphics
Chapter 11 Motion. Section 1
 Chapter 11 Motion Objectives: Section 1 Use a frame of reference to describe motion Differentiate between Speed and Velocity Calculate the speed of an object Use graphs to describe speed 1 Observing Motion
2 Motion BIGIDEA Write the Big Idea for this chapter.
 2 Motion BIGIDEA Write the Big Idea for this chapter. Use the What I Know column to list the things you know about the Big Idea. Then list the questions you have about the Big Idea in the What I Want to
The table below shows how the thinking distance and braking distance vary with speed. Thinking distance in m
 Q1.The stopping distance of a car is the sum of the thinking distance and the braking distance. The table below shows how the thinking distance and braking distance vary with speed. Speed in m / s Thinking
Generic 42km Finish Time : Sub 4 hours
 Day 1 Day 2 Day 3 Day 4 Day 5 Day 6 Day 7 Run 45 Run 60 Run 45. After 20 pace to 10km minute. Take 4 easy pace then return to the next 1 minute at 10km pace. Complete 3 one minute increases in pace. Cool
Physical Science You will need a calculator today!!
 Physical Science 11.3 You will need a calculator today!! Physical Science 11.3 Speed and Velocity Speed and Velocity Speed The ratio of the distance an object moves to the amount of time the object moves
One Dimensional Kinematics Challenge Problems
 One Dimensional Kinematics Challenge Problems Problem 1: One-Dimensional Kinematics: Two stones are released from rest at a certain height, one after the other. a) Will the difference between their speeds
Projectiles Shot up at an Angle
 Projectile Motion Notes: continued Projectiles Shot up at an Angle Think about a cannonball shot up at an angle, or a football punt kicked into the air, or a pop-fly thrown into the air. When a projectile
QUICK WARM UP: Thursday 3/9
 Name: pd: Unit 6, QUICK WARM UP: Thursday 3/9 1) The slope of a distance vs. time graph shows an object s. 2) The slope of a position vs. time graph shows an object s. 3) Can an object have a constant
Movement and Position
 Movement and Position Book pg 1-4 Syllabus 1.2, 1.3 and 1.6 Milhouse Remember what you see! Mo Mr. Burns Sideshow Bob Groundkeeper Willy Net Flanders Questions Which hand is Ned Flanders waving? - left
Ball Toss. Vernier Motion Detector
 Experiment 6 When a juggler tosses a ball straight upward, the ball slows down until it reaches the top of its path. The ball then speeds up on its way back down. A graph of its velocity vs. time would
An exploration of how the height of a rebound is related to the height a ball is dropped from. An exploration of the elasticity of rubber balls.
 BOUNCE! (1 Hour) Addresses NGSS Level of Difficulty: 2 Grade Range: 3-5 OVERVIEW In this activity, students drop rubber balls in order to observe and measure the effects of elasticity. They use graphs
Exam 1 Kinematics September 17, 2010
 Physics 16 Name KEY Exam 1 Kinematics September 17, 21 This is a closed book examination. You may use a 3x5 index card that you have made with any information on it that you would like. You must have your
P2a Force, Acceleration and Graphs
 P2a Force, Acceleration and Graphs 37 minutes 37 marks 90% - A* 80% - A 70% - B 60% - C 50% - D 40% - E 30% - F 20% - G Page 1 of 11 Q1. (a) The diagram shows two forces acting on an object. What is the
SF016: PAST YEAR UPS QUESTIONS
 CHAPTER 2: KINEMATICS OF LINEAR MOTION Session 205/206. (a)(i) If the object has zero acceleration, what happen to its velocity? Explain your answer. (ii) A car is initially at rest at =0. It then accelerates
Quizbank/College Physics/I T1study
 Quizbank/College Physics/I T1study From Wikiversity TrigPhys_I_T1_Study If you are reading this as a Wikiversity page, proper pagebreaks should result if printed using your browser's print option. On Chrome,
WHAT IS INSTANTANEOUS SPEED?
 Must Read: On the front of this worksheet, you ll see a data table. This data table shows the time and the distance of the wolf. The speed calculated, however, is not calculated as average speed. The speed
4-3 Rate of Change and Slope. Warm Up Lesson Presentation. Lesson Quiz
 4-3 Rate of Change and Slope Warm Up Lesson Presentation Lesson Quiz Holt Algebra McDougal 1 Algebra 1 Warm Up 1. Find the x- and y-intercepts of 2x 5y = 20. x-int.: 10; y-int.: 4 Describe the correlation
Note! In this lab when you measure, round all measurements to the nearest meter!
 Distance and Displacement Lab Note! In this lab when you measure, round all measurements to the nearest meter! 1. Place a piece of tape where you will begin your walk outside. This tape marks the origin.
SPEED, VELOCITY, ACCELERATION, & NEWTON STUDY GUIDE - Answer Sheet 1) The acceleration of an object would increase if there was an increase in the
 The acceleration of an object would increase if there was an increase in the") SPEED, VELOCITY, ACCELERATION, & NEWTON STUDY GUIDE - Answer Sheet 1) The acceleration of an object would increase if there was an increase in the A) mass of the object. B) force on the object. C) inertia
SPEED, VELOCITY, ACCELERATION, & NEWTON STUDY GUIDE - Answer Sheet 1) The acceleration of an object would increase if there was an increase in the A) mass of the object. B) force on the object. C) inertia
The Math and Science of Bowling
 The Report (100 : The Math and Science of Bowling 1. For this project, you will need to collect some data at the bowling alley. You will be on a team with one other student. Each student will bowl a minimum
3. Answer the following questions with your group. How high do you think he was at the top of the stairs? How did you estimate that elevation?
 Classwork Exploratory Challenge 1. Watch the first 1:08 minutes of the video below and describe in words the motion of the man. Elevation vs. Time #2 [http://www.mrmeyer.com/graphingstories1/graphingstories2.mov.
Energy Differences in Hilly Driving for Electric Vehicles:
 Energ Differences in Hill Driving for Electric Vehicles: Introduction Consider the idealized hill (an isosceles triangle) shown in the bo, with the left and right angle being. Let d sides of the triangle
1. The graph below shows how the velocity of a toy train moving in a straight line varies over a period of time.
 1. The graph below shows how the velocity of a toy train moving in a straight line varies over a period of time. v/m s 1 B C 0 A D E H t/s F G (a) Describe the motion of the train in the following regions
HONORS PHYSICS One Dimensional Kinematics
 HONORS PHYSICS One Dimensional Kinematics LESSON OBJECTIVES Be able to... 1. use appropriate metric units and significant figures for given measurements 2. identify aspects of motion such as position,
Kinematics Review. What distance did the object travel in moving from point A to point B? A) 2.5 m B) 10. m C) 20. m D) 100 m
 2.5 m B) 10. m C) 20. m D) 100 m") Kinematics Review 1. Base your answer to the following question on the diagram below which represents a 10-kilogram object at rest at point A. The object accelerates uniformly from point A to point B in
Kinematics Review 1. Base your answer to the following question on the diagram below which represents a 10-kilogram object at rest at point A. The object accelerates uniformly from point A to point B in
PHYSICS REVIEW SHEET 2010 MID-TERM EXAM
 PHYSICS REVIEW SHEET 2010 MID-TERM EXAM Concepts And Definitions Definitions of fact, hypothesis, law, theory Explain the scientific method Difference between average and instantaneous speed and speed
Add this important safety precaution to your normal laboratory procedures:
 Student Activity Worksheet Speed and Velocity Are You Speeding? Driving Question What is speed and how is it related to velocity? Materials and Equipment For each student or group: Data collection system
Acceleration Activity
 Acceleration Acceleration is the rate of change in the speed of an object. To determine the rate of acceleration, you use the formula below. The units for acceleration are meters per second per second
Force, Motion and Energy Review
 NAME Force, Motion and Energy Review 1 In the picture to the right, two teams of students are playing tug-of-war. Each team is pulling in the opposite direction, but both teams are moving in the same direction.
at home plate at 1st base at 2nd base at 3rd base back at home distance displacement
 You might need a calculator: The typical baseball diamond is a square 90 ft long on each side. Suppose a player hits a homerun and makes one complete trip from home plate, around the bases, and back to
Vocabulary. Page 1. Distance. Displacement. Position. Average Speed. Average Velocity. Instantaneous Speed. Acceleration
 Vocabulary Term Definition Distance Displacement Position Average Speed Average Velocity Instantaneous Speed Acceleration Page 1 Homer walked as follows: Starting at the 0,0 coordinate, he walked 12 meters
During part of the journey the car is driven at a constant speed for five minutes.
 Q1.The figure below shows the horizontal forces acting on a car. (a) Which one of the statements describes the motion of the car? Tick one box. It will be slowing down. It will be stationary. It will have
All work on this packet is my own. I have not done anything to give myself or anyone else an unfair advantage on this assignment.
 AP Physics Summer Packet Name: Period: All work on this packet is my own. I have not done anything to give myself or anyone else an unfair advantage on this assignment. Signature: I care significantly
Figure 1. What is the difference between distance and displacement?
 Q1.A train travels from town A to town B. Figure 1 shows the route taken by the train. Figure 1 has been drawn to scale. Figure 1 (a) The distance the train travels between A and B is not the same as the
Chapter 2: Linear Motion. Chapter 3: Curvilinear Motion
 Chapter 2: Linear Motion Chapter 3: Curvilinear Motion Linear Motion Horizontal Motion - motion along x-axis Vertical Motion (Free-Falling Bodies) motion along y-axis Equation for Uniformly Accelerated
December 6, SWBAT explain a position v time graph. SWBAT create a position v time graph for a situation.
 December 6, 2016 Aims: SWBAT explain a position v time graph. SWBAT create a position v time graph for a situation. Agenda 1. Do Now 2. Class Practice 3. Independent Practice 4. Practicing our AIMS: Homework:
Gravity: How fast do objects fall? Teacher Version (Grade level: 4 7)
") Gravity: How fast do objects fall? Teacher Version (Grade level: 4 7) *** Experiment with Audacity to be sure you know how to do what s needed for the lab*** Kinematics is the study of how things move
Gravity: How fast do objects fall? Teacher Version (Grade level: 4 7) *** Experiment with Audacity to be sure you know how to do what s needed for the lab*** Kinematics is the study of how things move
REACTION RATES. The reaction rate is the progress of the reaction over time.
 REACTION RATES To get started, let's think about what is meant by "rate". The rate of a reaction is just its speed. Just as your speed when driving down the highway can be described in terms of your progress
Calculate the size of the force(s) acting on Sarah just after the take- off, in position 2 in the above diagram.
 acting on Sarah just after the take- off, in position 2 in the above diagram.") MECHANICS: MOTION QUESTIONS High Jump (2017;2) Sarah, a 55.0 kg athlete, is competing in the high jump where she needs to get her body over the crossbar successfully without hitting it. Where she lands,
MECHANICS: MOTION QUESTIONS High Jump (2017;2) Sarah, a 55.0 kg athlete, is competing in the high jump where she needs to get her body over the crossbar successfully without hitting it. Where she lands,
Honors/AP Physics 1 Homework Packet #2
 Section 3: Falling Objects Honors/AP Physics 1 Homework Packet #2 1. A ball is dropped from a window 10 m above the sidewalk. Determine the time it takes for the ball to fall to the sidewalk. 2. A camera
Lesson one. Linear Motion. Terminal Objective. Lesson 1. Linear Motion
 Lesson one Terminal Objective Using their class notes to complete the handout on linear motion, students will be able to demonstrate their understanding of speed and acceleration by problem solving different
Physics of Sports. Homewood Campus, JHU Hodson Hall 213 Muhammad Ali Yousuf Assignment 1. Part 1
 Assigned date: January 9 th, 2018. Due date: January 16 th, 2018 Your name: Part 1 Instructions for Part `\1: I. Since time is limited and problems may be open-ended, you are allowed to discuss with others.
POTENTIAL ENERGY BOUNCE BALL LAB
 Energy cannot be created or destroyed. Stored energy is called potential energy, and the energy of motion is called kinetic energy. Potential energy changes as the height of an object changes due to gravity;
Activity P07: Acceleration of a Cart (Acceleration Sensor, Motion Sensor)
") Activity P07: Acceleration of a Cart (Acceleration Sensor, Motion Sensor) Equipment Needed Qty Equipment Needed Qty Acceleration Sensor (CI-6558) 1 Dynamics Cart (inc. w/ Track) 1 Motion Sensor (CI-6742)
Activity P07: Acceleration of a Cart (Acceleration Sensor, Motion Sensor) Equipment Needed Qty Equipment Needed Qty Acceleration Sensor (CI-6558) 1 Dynamics Cart (inc. w/ Track) 1 Motion Sensor (CI-6742)
Copyright, 1996 Dale Carnegie & Associates, Inc.
 300m/400m Hurdle Technique and Training Amy Deem Head Men s & Women s Track and Field Coach University of Miami Introduction The 300m/400m hurdle events demand the ability to run a fast 400m as well as
1. A tiger leaps horizontally from a 7.5 meter high rock with a speed of 4.5 m/s. How far from the base of the rock will she land?
 HONORS PHYSICS PROJECTILE MOTION 1. A tiger leaps horizontally from a 7.5 meter high rock with a speed of 4.5 m/s. How far from the base of the rock will she land? 2. A diver running 1.6 m/s dives out
3. Approximately how far will an object near Earth's surface fall in 3.0 seconds? m m m m
 Page 1 of 5 Sub work 10-10-02 Name 12-OCT-03 1. A car travels a distance of 98 meters in 10. seconds. What is the average speed of the car during this 10.-second interval? 1. 4.9 m/s 3. 49 m/s/ 2. 9.8
Instructor: Biswas/Ihas/Whiting PHYSICS DEPARTMENT PHY 2053 Exam 1, 120 minutes October 14, 2009
 Instructor: Biswas/Ihas/Whiting PHYSICS DEPARTMENT PHY 2053 Exam 1, 120 minutes October 14, 2009 Name (print, last first): Signature: On my honor, I have neither given nor received unauthorized aid on
General Physics Physics 101 Test #1 Fall 2018 Friday 9/21/18 Prof. Bob Ekey
 General Physics Physics 101 Test #1 Fall 2018 Friday 9/21/18 Prof. Bob Ekey Name (print): I hereby declare upon my word of honor that I have neither given nor received unauthorized help on this work. Signature:
Training the 100m Athlete for the 100m Race. Duane Ross North Carolina A&T State University
 Training the 100m Athlete for the 100m Race Duane Ross North Carolina A&T State University Long to Short Short to Long Slow to Fast Fast to Faster DON T TRAIN THE EVENT. INSTEAD, TRAIN THE ATHLETE FOR
Midterm Exam: Making a Study Guide
 Name: Class: Physics Teacher: Mr. Szopiak Date: Midterm Exam: Making a Study Guide This worksheet will help you and your classmates put together a pretty comprehensive guide to your midterm studying. Your
Motion, Vectors, and Projectiles Review. Honors Physics
 Motion, Vectors, and Projectiles Review Honors Physics The graph below represents the relationship between velocity and time of travel for a toy car moving in a straight line. The shaded area under the
STUDY GUIDE UNIT 7 - PROJECTILES
 Name Mods STUDY GUIDE UNIT 7 - PROJECTILES Date Agenda Homework Tues 11/17 Wed 11/18 Thurs 11/19 Fri 11/20 Mon 11/23 Tues 11/24 Lab - Projectiles Share Lab Data Go over lab Start problem set 1 Go over
3. Answer the following questions with your group. How high do you think he was at the top of the stairs? How did you estimate that elevation?
 J Hart Interactive Algebra 1 Classwork Exploratory Challenge 1. Watch the first 1:08 minutes of the video below and describe in words the motion of the man. Elevation vs. Time #2 [http://www.mrmeyer.com/graphingstories1/graphingstories2.mov.
7.3.2 Distance Time Graphs
 7.3.2 Distance Time Graphs 35 minutes 39 marks Page 1 of 11 Q1. A cyclist goes on a long ride. The graph shows how the distance travelled changes with time during the ride. (i) Between which two points
A position graph will give the location of an object at a certain time.
 Calculus 3.4 Notes A position graph will give the location of an object at a certain time. At t = 4, the car is 20 miles away from where it started. A position function is usually written as or. If the
Section 2: What Is a Force? (p. 115) 34 HOLT SCIENCE AND TECHNOLOGY
 34 HOLT SCIENCE AND TECHNOLOGY") 20. Scientifically speaking, how do you know the cyclist in Figure 4, on page 113, is accelerating? 21. Another name for acceleration in which velocity increases is acceleration. 22. Negative acceleration,
20. Scientifically speaking, how do you know the cyclist in Figure 4, on page 113, is accelerating? 21. Another name for acceleration in which velocity increases is acceleration. 22. Negative acceleration,
Name: Date Due: Motion. Physical Science Chapter 2
 Name: Date Due: Motion Physical Science Chapter 2 What is Motion? 1. Define the following terms: a. motion= a. frame of reference= b. distance= c. vector= d. displacement= 2. Why is it important to have
The table below shows how the thinking distance and braking distance vary with speed. Thinking distance in m
 Q1.The stopping distance of a car is the sum of the thinking distance and the braking distance. The table below shows how the thinking distance and braking distance vary with speed. Speed in m / s Thinking
How Do You Swing? You should be working with new lab partners starting with this lab.
 You should be working with new lab partners starting with this lab. Exploration: Swinging your arms and legs back and forth Discuss and try out the following questions within your lab group. After you
1 An object moves at a constant speed of 6 m/s. This means that the object:
 Slide 1 / 57 1 n object moves at a constant speed of 6 m/s. This means that the object: Increases its speed by 6 m/s every second ecreases its speed by 6 m/s every second oesn t move Has a positive acceleration
Unit 2: Kinematics in 1-D Exam Preparation
 Unit 2: Kinematics in 1-D Exam Preparation 1. 1. A bike first accelerates from 0.0 m/s to 5.0 m/s in 4.5 s, then continues at this constant speed for another 4.5 s. What is the total distance traveled
University of Colorado-Boulder MATH 1300 Homework 1
 Turn in the following problems: 1. Consider the following mathematical statements. Determine if the statements are always true, sometimes true, or never true. (a) (x + 2) 4 = x 4 + 16 (b) x 4 + 8x 2 +