Arizona Climate Summary December 2008
|
|
|
- Susanna Nash
- 6 years ago
- Views:
Transcription

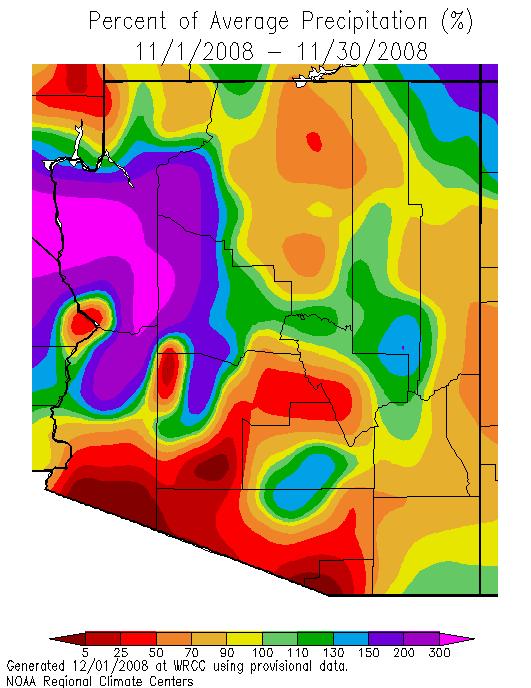
1 Arizona Climate Summary December 28 Summary of conditions for November 28 November 28 Temperature and Precipitation Summary November 1 st - 11 th : November began with high pressure over the western U.S., which brought clear skies and warm temperatures over all of Arizona. On the 2 nd, a cold front moving across the western U.S. brought light rain showers to north central Arizona, including Flagstaff, Cottonwood, Sedona, and Bellemont. A second, stronger cold front moved through on the 5 th, lowering temperatures into the upper 7 s across the state, and dropping.2 of rain at Page, and.5 at Canyon de Chelly in the northeast. High pressure and clear skies returned to the state on the 7 th and 8 th, with temperatures climbing back into the lower 8 s in the southwest deserts. Another very cold lower pressure system swept through form the 9 th through the 11 th, dropping snow at the higher elevations, and lowering temperatures into the s and 5 s at the higher elevations, and the 7 s in the deserts. The north rim of the Grand Canyon received 4 of snow, while Bellemont, near Flagstaff received 3.2. Lower elevations received light to moderate rainfall. November 12 th - 24 th : By the 12 th, a strong high pressure system set up off the California coast, keeping the storm systems well north of Arizona, and bringing clear skies, dry conditions, and warmer temperatures to the state through the 24th. time temperatures rose into the s and 7 s in northern Arizona and at higher elevations, while the southern deserts and lower Colorado River had daytime temperatures in the mid to upper 9 s. The relative heat wave melted most of the snow that had fallen earlier in the month. November 25 th 3 th : On the 25 th, a cut-off low pressure system (an area of low pressure with a closed circulation, cut off from the jet stream, so that it moves very slowly, eventually losing energy as the moisture is lost through rain or snowfall This system had significant moisture from the eastern tropical Pacific Ocean, and brought heavy rain to the lower elevations and snow to the higher elevations. The system remained over Arizona and the southwestern U.S. until the 3 th, when if finally dissipated. The north rim of the Grand Canyon had 4. of snow while the south rim had 1.5, Williams had 2., and Mount Lemmon had 4.. Show Low received 1.8 of rain, Yuma 2.23, Tonto Natural Bridge 2.15, Seligman 1.93, Sedona 1.2, Prescott Airport.92, Phoenix Airport.49, Payson 1.77, Flagstaff Airport.97, Bullhead City 1.65, Canyon de Chelly.74, Bisbee 1.9, and Tucson Airport.28. In This Issue: Graphs of the November daily maximum and minimum temperatures, precipitation, and mean daily dew points for Flagstaff, Phoenix, and Tucson; graphs of 28 dew points and cumulative 28 precipitation for Tucson, Phoenix and Flagstaff; November climate statistics for Phoenix, Tucson and Flagstaff; daily maximum and minimum temperatures and precipitation for 7 stations across Arizona; maps of the mean maximum and minimum temperatures and precipitation across the state for November and for the calendar year January through November; maps of the departure from average temperature and percentage of average precipitation; graphs of the November precipitation for the period of record, and the average monthly temperature and precipitation for Phoenix, Flagstaff and Tucson. Climate calendars for Flagstaff, Phoenix, Tucson, Prescott, Winslow and Yuma, including daily and monthly normals and extremes, for each month of the year, can be downloaded directly from the State Climate website. See page 19 of this report for calendar abbreviations. Data are preliminary and are from the National Weather Service Forecast Offices in State Climate Office Dr. Nancy J. Selover, State Climatologist 28 Arizona State Climate Office School of Geographical Sciences Arizona State University Tempe, AZ Tel:
2 Flagstaff, Phoenix and Tucson. **Note: The discrepancy between the Statewise Temperature and Precipitation values for Phoenix, Flagstaff and Tucson and the daily values in their graphs are due to the reporting times. The Statewide Temperature and Precipitation values are taken at 5pm, while the official daily records at the airports are taken from Midnight to Midnight. Monthly Temperature and Precipitation for Flagstaff, Phoenix, and Tucson Maximum temperatures began the month near average across the state, and became significantly warmer than average in mid-november as a strong high pressure system dominated the western U.S. High maximum temperature records were set in Phoenix on the 17 th and 18 th. Nighttime temperatures were near or above average in all three cities, with a few high minimum records tied or set in Flagstaff, Phoenix, and Tucson. No precipitation records were set in Flagstaff, Phoenix, or Tucson. Flagstaff had only 6 days of precipitation, Phoenix had 2, and Tucson had 4 days. Flagstaff and Tucson are still below their annual average precipitation amounts, while Phoenix has had above-average precipitation so far in Flagstaff November Maximum Temperature Flagstaff November Minimum Temperature Max Record Max Normal Max Record Lo Max 28 Min Record HiMin Normal Min Record LoMin 1 Phoenix November Maximum Temperatures 75 Phoenix November Minimum Temperatures Max Record Max Normal LowMax 28 Min Record HiMin Normal Min LowMin Tucson November Maximum Temperature Max Record Max Normal Max Record Low Max Tucson November Minimum Temperature Min Record HiMin Normal Min Record Low Min 2
3 Precipitation (in) Flagstaff November Precipitation Precipitation (in) Phoenix November Precipitation Precipitation Record Precipitation Record 2.5 Tucson November Precipitation Daily Dew Point November 28 Precipitation ((in) Precipitation Record Precipitation Dew Point Flagstaff Phoenix Tucson Cumulative Precipitation (in) Flagstaff Calendar Year Preciptiation Cumulative Precipitation (in) Phoenix Calendar Year Preciptiation Month Normal 28 Month Normal 28 Cumulative Precipitation (in) Tucson Calendar Year Preciptiation Month Normal 28 Dew Point Arizona 28 Calendar Year Dew Points Date Phoenix Tucson Flagstaff 3
4 PHOENIX CLIMATE STATISTICS NOVEMBER 28 This November tied for 4 th warmest with 26, and had no significant ranking for precipitation. Avg Max Temp(F) 78.8 Normal 75. Avg Min Temp(F) 55.5 Normal 5.4 Avg Mean Temp(F) 67.1 Normal 62.7 Departure from Normal 4.4 Degrees F Highest Monthly Avg Temp 7.F in 27 Lowest Monthly Avg Temp 55. o F in 1922 Highest Temp this month: Lowest Temp this month: 94 on 1 st 49 on 3 th Record High: 96 on 11/1 & 2/1924 Record Low: 27 on 11/23/1931 Temperature or precipitation records this month: 17 th HiMax of 87 set old record 86 in th HiMax of 88 set old record 86 in th HiMin of 62 set old record 59 in 1969 Phoenix Number of s of: Minimum Temp o or higher 6 Minimum Temp 5 o or lower 3 Maximum Temp 8 o or higher 13 Maximum Temp 7 o or lower 5 Heating Degree s 34 Normal 121 Cooling Degree s 14 Normal 51 Degree base 65 o F Total Nov Precipitation.49 Normal Nov Precipitation.73 Departure from normal -.24 Greatest 24-Hr Precipitation.45 on 26-27th Total Precipitation Year-to-Date 8.61 Departure from Normal Number of s: Clear 15 Partly Cloudy 13 Cloudy 2 Greatest Nov Precipitation 3.61 in 195 Least Nov Precipitation in 26 and 26 other years. 4 Average Wind Speed 4.6 mph Highest Peak Gust 38 mph from 27 o on 9 th Data are from the National Weather Service and the National Climatic Data Center and are preliminary. TUCSON CLIMATE STATISTICS NOVEMBER 28 This November was tied for 7 th warmest, along with 195 and 26, and had no significant ranking for precipitation. Avg Max Temp(F) 77. Normal 72.3 Avg Min Temp(F) 48.9 Normal 45.1 Avg Mean Temp(F) 63. Normal 58.7 Departure from Normal +4.3 Degrees F Highest Monthly Avg Temp 65.7 in 27 Lowest Monthly Avg Temp 5.9 in 1911 Highest Temp this month: Lowest Temp this month: 92 on 1 st 36 on 7 th Record High: 94 on 11/1/1924 Record Low: 19 on 11/19/1921 Temperature or precipitation records equaled or set this month: 21 st HiMin 55 tied record first set in th HiMin 55 set old record 54 set in 199 Tucson Number of s of: Minimum Temp o or lower 2 Minimum Temp 5 o or higher 12 Maximum Temp 8 o or higher 13 Maximum Temp 7 o or lower 6 Heating Degree s 1 Normal 195 Cooling Degree s Normal Degree base 65 o F Total Nov Precipitation.29 Normal Nov Precipitation.67 Departure from normal -.38 Greatest 24-Hr Precipitation.27 on th Total Precipitation Year-to-Date 7.65 Departure from Normal Greatest Nov Precipitation 4.61 in 195 Least Nov Precipitation. in 25,1999,198 and 19 other years.
5 Number of s: Clear 21 Partly Cloudy 3 Cloudy Average Wind Speed 7.2 mph Highest Peak Gust 43 mph from 12 o on 21 st FLAGSTAFF CLIMATE STATISTICS NOVEMBER 28 This November was tied with 27 as 4 th warmest on record, and had no significant ranking for precipitation. Number of s: Clear 24 Partly Cloudy 3 Cloudy 3 Greatest Nov Precipitation 7.1 in 195 Least Nov Precipitation. in 1999 Average Wind Speed 6.4 mph Highest Peak Gust 41 mph from 23 o on 9 th Avg Max Temp(F) 55.9 Normal 5.8 Avg Min Temp(F) 27.2 Normal 22.1 Avg Mean Temp(F) 41.6 Normal 36.5 Departure from Normal +5.1 Degrees F Highest Monthly Avg Temp 44.9 in 1949 Lowest Monthly Avg Temp 29.6 in 1972 Highest Temp this month: 7 on 13 th Lowest Temp this month: 12 on 6 th Record High: 74 on 11/3/1977 Record Low: -13 on 11/18/1958 Temperature or precipitation records equaled or set this month: 15 th HiMin 39 old record 37 set in th HiMin 39 old record 38 set in th HiMin 33 old record 32 set in 1939 Flagstaff Number of s of: Minimum Temp 2 o or lower 5 Minimum Temp 32 o or lower 23 Maximum Temp o or higher 11 Maximum Temp 5 o or lower 7 Heating Degree s 695 Normal 85 Cooling Degree s Normal Degree base 65 o F Total Nov Precipitation 1.29 Normal Nov Precipitation 1.86 Departure from normal -.57 Greatest 24-Hr Precipitation.77 on th Total Precipitation Year-to-Date Departure from Normal -6. 5
6 Winds for November: Phoenix Flagstaff Tucson (mph) Avg Max Avg Max Avg Max Dew Points for November: Daily Average Dew Point ( o F): Phx Tuc Flg
7 Statewide Temperatures and Precipitation for November 28 PRELIMINARY DATA from the 5pm Statewide Roundup Avg/ Station Parameter Total Alpine Min Temp M M M M M 27 M M M M M M 3 M M M Max Temp M M M M M 28 M M M M M M 37 M M M Precip M M M M M.12 M M M M M M. M M M Bellemont Min Temp Max Temp Precip Bisbee Min Temp Max Temp 76 M M Precip T 1.9 Bisbee- Min Temp Douglas AP Max Temp Precip Bouse Min Temp M 52 M 41 M 41 M M 41 M M M M M M M 43 M 56 5 M 42 M M Max Temp M 77 M 71 M 78 M M 72 M 8 84 M M 85 M 83 M M M M M 69 M M Precip M M M M M Bowie Min Temp M M M M 35 M 43 M M M 38 M M 36 M M Max Temp M M M M 75 M 64 M M M 69 M M 61 M M Precip M M.4 M M M M M M M M M M Bullhead City Min Temp M Canyon de Chelly Carefree Casa Grande Coolidge Coronado NM Cottonwood- Tuzigoot Davis Monthan AFB Douglas East Mesa Elgin Max Temp M M Precip Min Temp M M Max Temp M M 56 Precip.5.11 M T M.9 Min Temp M M Max Temp 91 M M M M Precip M.6.2 M Min Temp M M Max Temp M M M 82 M Precip T Min Temp M M M M M M M M M M M M M M M M M M M M M M M M M M M M M M M Max Temp M M M M M M M M M M M M M M M M M M M M M M M M M M M M M M M Precip M M M M M M M M M M M M M M M M M M M M M M M M M M M M M M M Min Temp M M M M Max Temp M M M M Precip M M Min Temp Max Temp M 51 M Precip.6.12 M 1.24 M T 1.42 Min Temp Max Temp Precip Min Temp M M M M Max Temp M M M M Precip M. Min Temp Max Temp M Precip Min Temp Max Temp Precip
8 Statewide Temperatures and Precipitation for November 28 PRELIMINARY DATA from the 5pm Statewide Roundup Avg/ Station Parameter Total Flagstaff Min Temp Max Temp Precip.3 T.29 T Fort Valley Min Temp M M Max Temp M M Precip Gila Bend Min Temp M M M M Max Temp M M M M M Precip M Globe Min Temp M Max Temp M 71 M M M Precip M Grand Canyon Min Temp AP Max Temp M Grand Canyon North Rim Grand Canyon Phantom Grand Canyon South Rim Greer Heber RS- Overgaard Hilltop Holbrook Kingman AP Lake Havasu City Litchfield Park Lost Dutchman St. Park Mt. Lemmon- Summerhaven Precip T Min Temp M M M M M Max Temp M M M M M Precip M T T..2 M M M M Min Temp M M M 5 M M M M M 51 M M M Max Temp M 7 M 75 M M M M 51 M M M M M M Precip T M M M M M M M.3 M M M Min Temp Max Temp M M M M M M 46 M 56 Precip M M.5 M M M.3 M M M M Min Temp M M M M M M M M M M M M Max Temp M 53 M 43 M 56 M M M 59 M 59 M M M M 59 M M M M M M M M 46 M Precip M M M.3 M M M M M M M M M M M M M M M Min Temp M M M 18 M M 21 M M M M M M M M M M M M M Max Temp M M M 5 M M M M 5 62 M M M M M M 51 M M M M M M Precip M M M M M.37 M M M M M M M M M M M M M Min Temp Max Temp Precip Min Temp 41 M M M M M M M M M 38 3 M M Max Temp 78 M M M M M 64 M M 68 M M M M M 49 M M M Precip M M M M M M M M M M M Min Temp Max Temp Precip.2.1 T.22.5 T.3 Min Temp M M M M 59 M M 5 M M 54 M M M M M M M M M M Max Temp M M 82 M M M M M M M M M M M M M M M Precip M M M M M M M M M Min Temp M M 55 M 52 M M M M M M 47 M M 49 M M 48 M 49 M 47 M 56 M M M M M Max Temp M M 83 M 74 M M M M M M 73 M M 82 M M 8 M 76 M 76 M 69 M M M M M Precip M M M M M M.5 M M M Min Temp 65 M M M Max Temp 93 M M M M Precip T.45 M M.45 Min Temp M M M M M M M M M Max Temp M M M M M M M M M Precip M M.12 M M M M M2.23 T
9 Statewide Temperatures and Precipitation for November 28 PRELIMINARY DATA from the 5pm Statewide Roundup Avg/ Station Parameter Total Navajo NM Min Temp M M M M Max Temp M M 51 M M M Precip M M.2 T M Nogales Intl Min Temp AP Max Temp Precip T T M.1.1 Oracle Min Temp 49 M M M M M M M M M Organ Pipe Cactus NM Page Parker Payson Petrified Forest Phoenix Deer Valley AP Phoenix Sky Harbor AP Picacho Peak Pinetop Max Temp 88 M M M M M M M M M Precip M M M M M M M.13 T M Min Temp M M Max Temp M M Precip M T.4 M.4 Min Temp Max Temp Precip.2 T Min Temp 5 M M M M M M M M M M M M M M M M M M M M M M M M M M M M M M Max Temp 73 M M M M M M M M M M M M M M M M M M M M M M M M M M M M M M Precip M M M M M M M M M M M M M M M M M M M M M M M M M M M M M M Min Temp M Max Temp M Precip T M Min Temp Max Temp M M 62 M 56 M M 63 Precip M M.63 Min Temp Max Temp Precip.11 T Min Temp Max Temp Precip T Min Temp M Max Temp M Precip.12 M T.94 Min Temp M M M M M M M 25 M M 3 22 M M M M M M M 24 M M M M M M M Max Temp M M M M M M M M M M M M M M M M M M M M M M M Precip M M M M M M M M M.6 M M M M M M M M M M M M M M Pinnacle Peak Min Temp M M M M 5 M 46 M M M 52 M M 55 M M M Max Temp M M M M 69 M 69 M M M 72 M M 79 M M M Precip M T M M T.96 Prescott Min Temp M Max Temp M M M 51 M Prescott Airport Roosevelt Safford Ag Station Precip.24 M.1 M.5 M.39 Min Temp Max Temp Precip.5.16 T Min Temp Max Temp Precip Min Temp Max Temp Precip
10 Statewide Temperatures and Precipitation for November 28 PRELIMINARY DATA from the 5pm Statewide Roundup Avg/ Station Parameter Total Safford Min Temp M Airport Max Temp M M Precip T T.7.2 T.9 Saint Johns Min Temp Max Temp Precip T Scottsdale Min Temp Airport Max Temp Precip T Sedona Min Temp Max Temp M M M 71 7 Precip M M 1.26 Seligman Min Temp M M Max Temp M M M Precip M M 1.93 Show Low Min Temp Max Temp M M M 61 M M M Precip M.3 M M M M Sierra Vista Min Temp M Max Temp Precip T.3 T.3 Sonora Desert Min Temp Museum Max Temp Precip Springerville Min Temp M M 24 Max Temp M M M 59 Precip.32 M.8.1 T M.41 Tonopah Min Temp M M 5 5 M M M M 47 M M M M M M M M M M M M M M M 45 M Max Temp M M M M M M 77 M M M M M M M M M M M M M M M 73 M Tonto Natural Bridge SP Tuba City Precip M M M M M M M M M Min Temp Max Temp Precip T 2.26 Min Temp M Max Temp M Precip.3.43 M.46 Tucson Int AP Min Temp Max Temp Precip M Tucson U of A Min Temp Max Temp Precip..2.2 Wickenburg Min Temp M M M M M M M M M 43 M M M Max Temp M M M M M M M M M 63 M M M Williams Window Rock Precip M M M.21 M Min Temp M M M M Max Temp M M M M Precip.2 M.3 M M M M Min Temp Max Temp Precip
11 Statewide Temperatures and Precipitation for November 28 PRELIMINARY DATA from the 5pm Statewide Roundup Avg/ Station Parameter Total Winslow Min Temp Max Temp Precip T T.4.54 T.58 Youngtown Min Temp M 52 Max Temp M 77 Precip Yuma AP Min Temp Max Temp Precip T Kunde Min Temp Max Temp Precip T Tilman_Chino Min Temp Valley Max Temp Precip Wupatki N.M. Min Temp Max Temp Precip Tempe ASU Min Temp M Max Temp Precip Temperature = Degrees Fahrenheit Precipitation = inches, 24-hour total ending 5 pm M= Missing T = Trace November 28 Temperature and Precipitation Maps are based on the above preliminary data from the National Weather Service. For most stations, final quality controlled data will not be available for approximately 4 months. 11

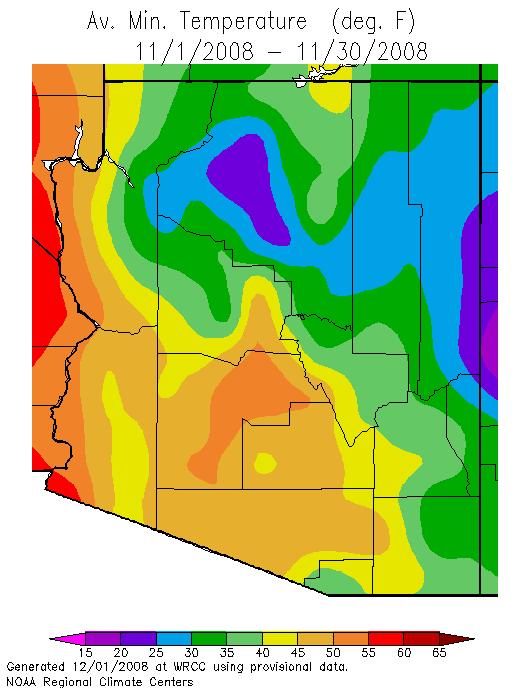
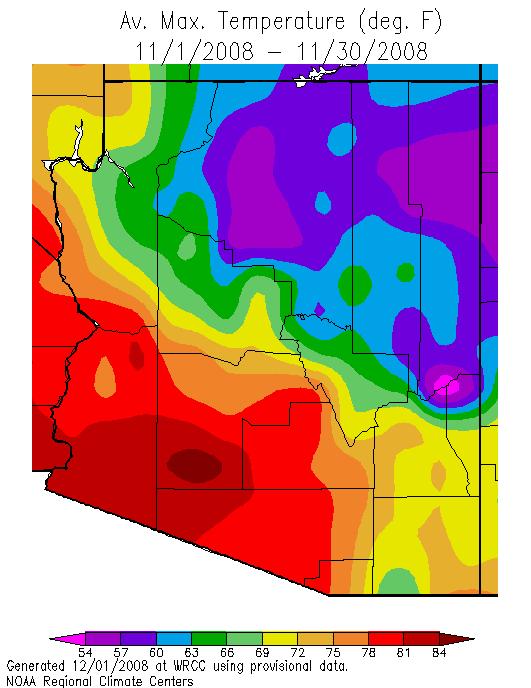
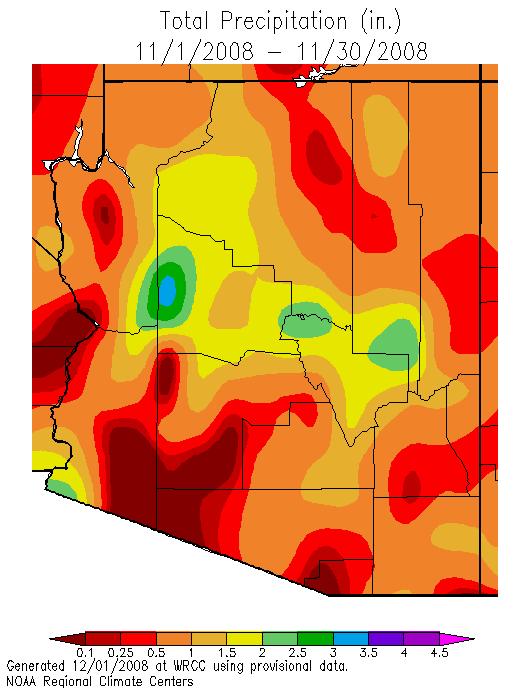
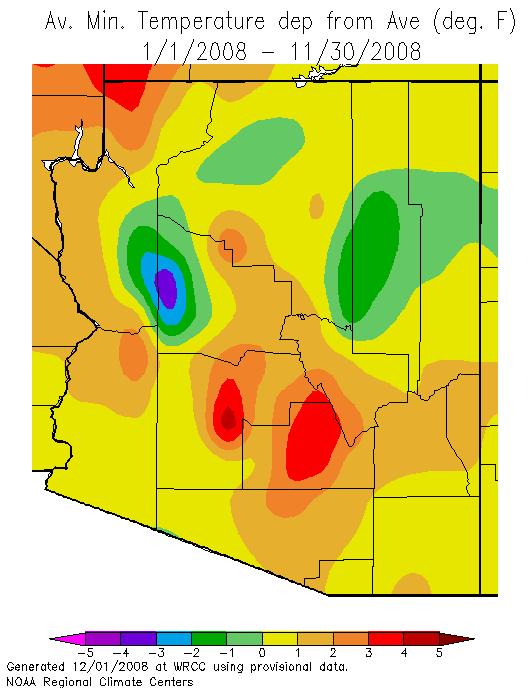
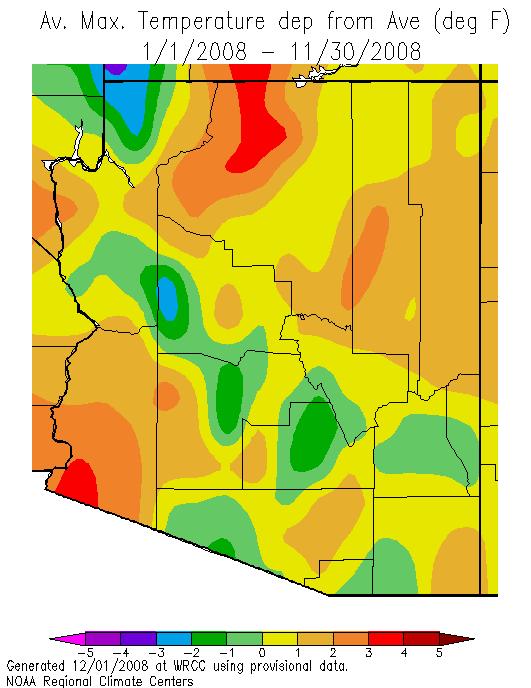
12 Mean minimum temperatures were in the 2s and 3s across most of northern Arizona, the s and 5s in the southwestern deserts, and in the 3s and s in southeastern Arizona for November. time highs averaged between 5 and 7 o F on the Colorado Plateau, 65 and 8 o F in the southern and southwest deserts. Flagstaff had 11 days with temperatures above degrees, while Phoenix and Tucson each had 13 days with temperatures above 8 degrees. Phoenix only had 3 days with nighttime temperatures below 5, while Tucson had 18, and Flagstaff had 3, with 23 days of nighttime temperatures below 33 degrees. Statewide, precipitation fell on 11 days, with snow reported on 4 of those days. Most stations in central and southern Arizona had no precipitation until the final week of the month. 12
13 13
14 14
15 15
16 Precipitation (in) Flagstaff Mean Monthly Temperature & Precipitation Annual average ( ) = 45.8 o F, 2.78" Precipitation Month Temperature 2.5 Phoenix Mean Monthly Temperature & Precipitation Annual average ( ) = 71.7 o F, 7.62" Precipitation (in) Temperature (F) Month Precipitation Temperature 3. Tucson Mean Monthly Temperature & Precipitation Annual average ( ) = 67.9 o F, 11.32" 1 Precipitation (in) Precipitation Month Temperature 16
17 Mean November Temperature Graphs Flagstaff ( ), Phoenix ( ) and Tucson ( ): Flagstaff Mean November Temperature (Median 36.9 o F) Year Phoenix Mean November Temperature (Median 61.4 o F) Year Tucson Mean November Temperature (Median 58.5 o F) Year
18 Mean November Precipitation Graphs Flagstaff ( ), Phoenix ( ) and Tucson ( ): 8. November Precipitation Flagstaff (Median 1.185") Precipitation (in) Year 4. November Precipitation Phoenix (Median.38") 3.5 Precipitation (in) Year November Precipitation Tucson (Median.49") Precipitation (in) Year 18
 LO MAX = Lowest maximum temperature for that day (F) LO MIN = Lowest minimum temperature for that day (F) HI MIN")
19 The downloadable normals and extremes calendars use the following abbreviations: NORM = 3 year (1971-2) average value (degrees Fahrenheit (F)) OBS = The temperature observation for that day this year AVG = Average daily temperature HI MAX = Highest maximum temperature for that day (F) LO MAX = Lowest maximum temperature for that day (F) LO MIN = Lowest minimum temperature for that day (F) HI MIN = Highest minimum temperature for that day (F) Mx PCP = Maximum precipitation for that day (inches) Mx SNO = Maximum snowfall for that day (inches) 19
Arizona Climate Summary September 2012
 Arizona Climate Summary September 2012 Summary of conditions for August 2012 August 2012 Temperature and Precipitation Summary August 1 st 15 th : During the month of August, at least one location received
Arizona Climate Summary
 Arizona Climate Summary March 2012 Summary of conditions for February 2012 February 2012 Temperature and Precipitation Summary February 1 st 17 th : February continued where January left off with a high
 To: The Membership, An Overview of the Duties of the State Convention Committee: 1. Main Purpose; A. To secure a venue to accommodate rooms for 200+ guests for the 5 days of the Convention, at an affordable
Vets & Military Support. State Delegate Dues. Inspection Report
 As of: 8/3/2016 QM Bond Trustee Audit Buddy Poppy AZ Cottage Vets & Military Support Inspection Report State Delegate Dues QM Bond Trustee Audit Buddy Poppy AZ Cottage Vets & Military Support Inspection
Basketball (Girls) AIA Initial Division Placements , Appeal Deadline Monday, Feb. 2, 2015 at 2 p.m.
 AIA Initial Division Placements , Appeal Deadline Monday, Feb. 2, 2015 at 2 p.m.") Basketball (Girls) AIA Initial Division Placements 2015 2018, Appeal Deadline Monday, Feb. 2, 2015 at 2 p.m. The following pages show the initial division placements. To get an understanding of how the
Basketball (Girls) AIA Initial Division Placements 2015 2018, Appeal Deadline Monday, Feb. 2, 2015 at 2 p.m. The following pages show the initial division placements. To get an understanding of how the
Basketball (Boys) AIA Initial Division Placements , Appeal Deadline Monday, Feb. 2, 2015 at 2 p.m.
 AIA Initial Division Placements , Appeal Deadline Monday, Feb. 2, 2015 at 2 p.m.") Basketball (Boys) AIA Initial Division Placements 2015 2018, Appeal Deadline Monday, Feb. 2, 2015 at 2 p.m. The following pages show the initial division placements. To get an understanding of how the
Basketball (Boys) AIA Initial Division Placements 2015 2018, Appeal Deadline Monday, Feb. 2, 2015 at 2 p.m. The following pages show the initial division placements. To get an understanding of how the
Arizona Department of Transportation
 Arizona Department of Transportation Transportation Planning Division 206 S. 17 th Avenue Mail Drop 3B Phoenix, Arizona 85007.3212 Jane Dee Hull Governor Mary E. Peters Director Mary Lynn Tischer Division
LAB H - ATMOSPHERE AND CLIMATE LAB II STABILITY AND PRECIPITATION PATTERNS
 Introduction LAB H - ATMOSPHERE AND CLIMATE LAB II STABILITY AND PRECIPITATION PATTERNS This lab will provide students with the opportunity to become familiar with the concepts of atmospheric stability
2015 AIA Spiritline State Championship Winner Sheet
 1 247.000 Desert Ridge All-Girl - I 1 258.000 Desert Mountain All-Girl - I 2 246.000 Chaparral All-Girl - I 2 255.000 *Mountain View Mesa All-Girl - I 3 245.000 Xavier All-Girl - I 3 255.000 *Pinnacle
Drought: What is the Status?
 Drought: What is the Status? Nolan J. Doesken Colorado Climate Center Colorado State University http://ccc.atmos.colostate.edu Presented at 2005 Peak to Prairie Landscape Symposium, February 11, 2005,
8/29/20098 SAHRA - Watershed Visualization
 Module 3 Narration Southwestern Water Cycle 001.wav 26 sec 002.wav 10 sec 003 wav 17 sec Water on Earth is constantly on the move. Water continually circulates between the surface of Earth and the atmosphere
A Snapshot of Our Changing Climatology
 A Snapshot of Our Changing Climatology Dr. Kenneth ( Kenny ) Blumenfeld Sr. Climatologist DNR State Climatology Office 11/17/2018 1 Items to bear in mind 1. Climate news elsewhere may not apply here 2.
Ecology. Professor Andrea Garrison Biology 3A Illustrations 2014 Cengage Learning unless otherwise noted
 Ecology Professor Andrea Garrison Biology 3A Illustrations 2014 Cengage Learning unless otherwise noted Ecology Ecology (oikos = house) is the study of where an organism lives and all the interactions
Station 1: Ocean Currents Use the ocean currents map copied from page 4 of the ESRT and the passage to answer the questions that follow.
 Station 1: Ocean Currents Use the ocean currents map copied from page 4 of the ESRT and the passage to answer the questions that follow. The Map: Questions: 1. Name the cool current off the West coast
GEOS 513 ENSO: Past, Present and Future
 GEOS 513 ENSO: Past, Present and Future Jessica Conroy Department of Geosciences Stephen W. Bieda, III Department of Atmospheric Sciences February 22, 2006: Regional Teleconnections (Observations) References:
Applied Earth Science Climate Exam Practice Questions Page 1
 Name: 1. Which combination of climate factors generally results in the coldest temperatures? A) low elevation and low latitude B) low elevation and high latitude C) high elevation and low latitude D) high
Weather EOG Review Questions
 Weather EOG Review Questions 1. Which statement best describes runoff? A Water vapor cools off and changes into water droplets. B Water in the form of rain, snow, sleet, or hail falls from clouds. C Precipitation
El Niño and the Winter Weather Outlook
 El Niño and the 2015-2016 Winter Weather Outlook 2015 NASEO Annual Meeting http://www.ospo.noaa.gov/products/ocean/sst/anomaly/ NWS Boston February 10, 2015 Jimmy Taeger Meteorologist National Weather
2. Study Setting. This section describes the study domain, major terrain features, land use, meteorology, and regional air quality and visibility.
 2. Study Setting This section describes the study domain, major terrain features, land use, meteorology, and regional air quality and visibility. 2.1 The Southwestern United States Figure 2-1 shows a terrain
Land and sea breezes are an example of which type of heat transfer?
 TEST #7 REVIEW Land and sea breezes are an example of which type of heat transfer? Land and sea breezes are an example of which type of heat transfer? convection The diagram above represents what? The
The Awesome, Wonderful, Beautiful, Exciting and Terrible Climate of the West What a Hoot!
 The Awesome, Wonderful, Beautiful, Exciting and Terrible Climate of the West What a Hoot! Nolan J. Doesken, State Climatologist Colorado Climate Center Presented to Four States Irrigation Council, 54 th
Recent Atmospheric and Oceanic Circulation Changes Affecting Winter Weather in North America. Dr. Art Douglas Professor Emeritus Creighton University
 Recent Atmospheric and Oceanic Circulation Changes Affecting Winter Weather in North America Dr. Art Douglas Professor Emeritus Creighton University Outline 1. The 2018 El Nino: A Northern Hemisphere induced
Air Masses and Fronts
 Air Masses and Fronts A huge body of air that has similar temperature, humidity, and air pressure at any given height is called an air mass. A single air mass may spread over millions of square kilometers
Environmental Protection The answer my friend is blowing in the wind
 Environmental Protection The answer my friend is blowing in the wind Nolan Doesken Colorado Climate Center Colorado State University Presented at the Pesticide Conference, November 17, 2005, Denver, CO
1.3: CLIMATE GEOGRAPHY. pgs
 1.3: CLIMATE GEOGRAPHY pgs. 76-89 INTRODUCTION WEATHER: Is the combination of temperature, precipitation, cloud cover and wind that we experience EACH DAY. Example: 22 0 C and clear skies. CLIMATE: The
National Weather Service
 National Weather Service Gulf of California Moisture Surges Gulf of California moisture surges, or simply Gulf Surges, are one of the most researched components of the North American Monsoon. As early
National Weather Service
 National Weather Service The North American Monsoon Until the late 1970s, there was serious debate about whether a monsoon truly existed in North America. However, considerable research, which culminated
TEP-UNS Electric Load and Peak Demand Forecast Overview
 TEP-UNS Electric Load and Peak Demand Forecast Overview Jon M. Bowman Senior Supply-Side Planner TEP and UES Resource Planning Workshop 1 Objectives Provide an overview of the load and peak demand forecasts
Lecture 13 March 24, 2010, Wednesday. Atmospheric Pressure & Wind: Part 4
 Lecture 13 March 24, 2010, Wednesday Atmospheric Pressure & Wind: Part 4 Synoptic scale winds Mesoscale winds Microscale winds Air-sea interactions The largest synoptic scale wind. Monsoon: Arabic for
Cal Poly Lands located in San Luis Obispo County experience a collection of idyllic microclimates
 Climate Margot McDonald, College of Architecture and Environmental Design Cal Poly Lands located in San Luis Obispo County experience a collection of idyllic microclimates due to their geographical position
THE RETREAT AT THE AERIE
 THE RETREAT AT THE AERIE EXCLUSIVE LISTING SEDONA, ARIZONA Capri Barney cbarney@landadvisors.com 4900 North Scottsdale Road, Suite 3000, Scottsdale, Arizona 85251 ph. 928.445.4457 www.landadvisors.com
THE RETREAT AT THE AERIE
 THE RETREAT AT THE AERIE EXCLUSIVE LISTING SEDONA, ARIZONA Capri Barney cbarney@landadvisors.com 4900 North Scottsdale Road, Suite 3000, Scottsdale, Arizona 85251 ph. 928.445.4457 www.landadvisors.com
Weather and Climate Impacts on Water Supply
 Weather and Climate Impacts on Water Supply Nolan Doesken Colorado Climate Center Atmospheric Science Department Colorado State University http://ccc.atmos.colostate.edu Presented at the South Platte Forum,
HEADQUARTERS WEST, LTD.
 Chambers Ranch Coconino County, Arizona Offered for Sale Exclusively by: Andy Groseta Headquarters West, Ltd. P.O. Box 1840 Cottonwood, Arizona 86326 Office (928) 634-8110 Cell (928) 300-6621 Email wdartranch@qwestoffice.net
Module 2 Narration What is a watershed?
 Module 2 Narration What is a watershed? Timing Key Narrative Snapshots a) 00:10 Every living thing relies on water to exist. But where does our water come from? The most natural place to look is upstream
The Arkansas Basin Climate Report Part 1 -- Remembering where we ve come from
 The Arkansas Basin Climate Report Part 1 -- Remembering where we ve come from Nolan Doesken State Climatologist (retired) Colorado Climate Center / Colorado Water Institute Colorado State University Arkansas
You Can Die Here PRACTICE Regents Exam Questions
 You Can Die Here PRACTICE Regents Exam Questions 1. Which diagram best illustrates how air rising over a mountain produces precipitation? (1) (3) (2) (4) 2. As a parcel of air rises, its temperature will
GROWING SEASON TEMPERATURES
 Ag-Weather Update: Review of Summer Growing Season & Update on the Wet Forecast for Fall & Winter Paul W. Brown Extension Specialist, Biometeorology College of Agriculture & Life Sciences University of
Canada s Natural Systems. Canadian Geography 1202
 Canada s Natural Systems Canadian Geography 1202 Canada s Natural Systems Natural System: A system found in nature Here are the four natural systems that we will explore in the next few weeks 1. Canada
Lornshill Academy. Geography Department Higher Revision Physical Environments - Atmosphere
 Lornshill Academy Geography Department Higher Revision Physical Environments - Atmosphere Physical Environments Atmosphere Global heat budget The earth s energy comes from solar radiation, this incoming
Drought or Not? Nolan J. Doesken Colorado Climate Center Colorado State University
 Drought or Not? Nolan J. Doesken Colorado Climate Center Colorado State University http://ccc.atmos.colostate.edu Presented at Horticultural Art Society meeting, November 19, 2004, Colorado Springs, Colorado
Final Report August 2005
 2.0 REGIONAL STUDY AREA 2.1 Regional Setting 2.1.1 Topography The Los Angeles Region is located within the western portion of the Transverse Ranges Geomorphic Province. The San Andreas transform fault
REVIEW AND APPROVAL STATEMENT
 1 REVIEW AND APPROVAL STATEMENT AFCCC/CCD-04/006, National Training Center (NTC), Fort Irwin, California A Full-Year Climatology,has been reviewed and is approved for public release. There is no objection
Subject Property SOUTHWEST. Mohave Crossroads. Approximate alignment of proposed Road and new Bridge. y a. w P e u
 Approximate alignment of proposed Road and new Bridge y a w ark P ad e llh u B Subject Property Mohave Crossroads Commercial Center Bed Bath & Beyond 99 Ross Pet Smart Target Kohl s CVS Starbuck s Bullhead
Monsoon. Arabic word mausim means season. Loose definition: a wind/precipitation pattern that shifts seasonally
 Monsoon Arabic word mausim means season Loose definition: a wind/precipitation pattern that shifts seasonally Classical criteria (Ramage 1971) Prevailing wind shifts 120 o between Jan & July Average frequency
First of all, you should know that weather and climate are not the same thing.
 First of all, you should know that weather and climate are not the same thing. WEATHER IS: Short term Limited area Can change rapidly Difficult to predict WEATHER is what s happening outside your window
Bicyclist Safety Action Plan (BSAP) 2018 Update. Presentation by Michael Sanders February 28, 2018
 2018 Update. Presentation by Michael Sanders February 28, 2018") Bicyclist Safety Action Plan (BSAP) 2018 Update Presentation by Michael Sanders February 28, 2018 1 BSAP Update Objectives Evaluate effectiveness of 2012 BSAP to reduce frequency of bicyclist crashes Analyze
Bicyclist Safety Action Plan (BSAP) 2018 Update Presentation by Michael Sanders February 28, 2018 1 BSAP Update Objectives Evaluate effectiveness of 2012 BSAP to reduce frequency of bicyclist crashes Analyze
Arizona High School Boys Basketball Records
 AVERAGE POINTS PER GAME (Season) INDIVIDUAL RECORDS 5A 40.1; Lawrence Westbrook Chandler 2005 (jr) 4A 30.8; Bobby Hancock Safford 1977 40.1; Isaac Bonds Winslow 1964 34.6; Travis Hice Wellton Antelope
Fluid Circulation (Student Mastery Objectives) -The most frequent type of heat transfer of energy in the atmosphere is convection.
 -The most frequent type of heat transfer of energy in the atmosphere is convection.") Fluid Circulation (Student Mastery Objectives) -The most frequent type of heat transfer of energy in the atmosphere is convection. -Differences in density affect the circulation of fluids. Cold air is
Fluid Circulation (Student Mastery Objectives) -The most frequent type of heat transfer of energy in the atmosphere is convection. -Differences in density affect the circulation of fluids. Cold air is
What Causes Different Weather?
 What Causes Different Weather? Table of Contents What causes weather?...3 What causes it to rain or snow?...4 What causes flooding?...5 What causes hail?...6 What causes the seasons?...7-8 What causes
Charlotte A. & Clinton E. Ring s. Photo History. By Al Ring 2007
 Charlotte A. & Clinton E. Ring s Photo History 1980 1984 By Al Ring 2007 1980: Charlotte & Granny, Desert Life, 3/1980 February 18, 1980, taken by Douglas Ring February 18, 1980, taken by Douglas Ring
 RECORD WARM AND COLD, WET AND DRY WEATHER January, 1901-1982 Cold periods (Criterion =< Threshold) Warm periods (Criterion => Threshold) (F) days day Year!F) days day Year 10 3 8 1968 30 31 1 1932 20 12
Nolan Doesken. Colorado Climate Center.
 Nolan Doesken Colorado Climate Center Presented to: Colorado Conservation Tillage Association, Greeley, CO, February 1-2, 1 2005 http://ccc.atmos.colostate.edu Prepared by Odie Bliss 1 Key Features of
Climate of Colorado. Climatography of the United States No. 60 (updated 1/2003) Prepared by
 Prepared by") Climate of Colorado Climatography of the United States No. 60 (updated 1/2003) Prepared by Nolan J. Doesken, Roger A. Pielke, Sr., and Odilia A.P. Bliss Colorado Climate Center, Atmospheric Science Department,
Climate of Colorado Climatography of the United States No. 60 (updated 1/2003) Prepared by Nolan J. Doesken, Roger A. Pielke, Sr., and Odilia A.P. Bliss Colorado Climate Center, Atmospheric Science Department,
Global Weather Patterns
 Global Weather Patterns AZ State Standards Concept 2: Energy in the Earth System (Both Internal and External) Understand the relationships between the Earth s land masses, oceans, and atmosphere. PO 2.
Please read Disclaimer, Acknowledgements, and Copyright info.
 General Disclaimer Please read Disclaimer, Acknowledgements, and Copyright info. In no event will R&R Publishing Inc. (or its directors, officers, or employees) be liable to any party for any direct, indirect,
The atmospheric circulation system
 The atmospheric circulation system Key questions Why does the air move? Are the movements of the winds random across the surface of the Earth, or do they follow regular patterns? What implications do these
D) water having a higher specific heat than land B) B C) expansion, cooling to the dewpoint, and condesation
 water having a higher specific heat than land B) B C) expansion, cooling to the dewpoint, and condesation") Base your answers to questions 1 through 4 on the map and the passage below and on your knowledge of Earth science. The map shows four different locations in India, labeled, A, B, C, and D, where vertical
Base your answers to questions 1 through 4 on the map and the passage below and on your knowledge of Earth science. The map shows four different locations in India, labeled, A, B, C, and D, where vertical
A Case Study in Tourism Development: Na8onal Park Visita8on Pa<erns in the Southwest
 Slide 1 A Case Study in Tourism Development: Na8onal Park Visita8on Pa
Climate briefing. Wellington region, February Alex Pezza and Mike Thompson Environmental Science Department
 Climate briefing Wellington region, February 2016 Alex Pezza and Mike Thompson Environmental Science Department For more information, contact the Greater Wellington Regional Council: Wellington PO Box
AT350 EXAM #2 November 18, 2003
 AT350 EXAM #2 November 18, 2003 Name and ID: Enter your name and student ID number on the answer sheet and on this exam. Record your answers to the 50 questions by using a No. 2 pencil to completely fill
Global Climate Change: Just the Facts
 Global Climate Change: Just the Facts Nolan Doesken State Climatologist, Colorado Climate Center Atmospheric Science Department Colorado State University Presented at Club 20 Fall Meeting, Grand Junction,
MONSOONS. Summer Monsoon
 MONSOONS A monsoon is a seasonal change in the direction of the prevailing, or strongest, winds of a region. Monsoons cause wet and dry seasons throughout much of the tropics. Monsoons are most often associated
Design Criteria Data
 TUCUMCARI NM Latitude = 35.18 N WMO No. 723676 Longitude =13.6 W Elevation = 465 feet Period of Record = 1973 to 1996 Average Pressure = 25.86 inches Hg Design Criteria Data Mean Coincident (Average) Values
3/8/2016 Oregon Wallowa Mountains Published by Michael Hatch (Wallowa Avalanche Center) and Scott Savage (on behalf of USFS National Avalanche Center)
 and Scott Savage (on behalf of USFS National Avalanche Center)") Location: Place Chief Joseph Peak, Wallowa Mountains State Oregon Date 3/8/2016 Time 1630 hrs Summary 1 skier partially buried and killed Number: Caught 1 Fully Buried 0 Injured 0 Killed 1 Avalanche Details:
Location: Place Chief Joseph Peak, Wallowa Mountains State Oregon Date 3/8/2016 Time 1630 hrs Summary 1 skier partially buried and killed Number: Caught 1 Fully Buried 0 Injured 0 Killed 1 Avalanche Details:
AIA Sectional Cross Country Championships Thursday, November 1, 2018
 AIA Sectional Cross Country Championships Thursday, November 1, 2018 Location: Rose Mofford Sports Complex 9833 N 25 th Ave Phoenix, AZ 85021 From the I-17 : Take the Dunlap Exit (#207). Turn east onto
9 STARS SPORTS/USA SOFTBALL AZ
 2017 APRIL MASH April 22-23, 2017 Coaches Packet 14 Open plays at: Desert West Sports Complex, 6602 W Encanto Blvd, Phoenix, AZ 85035 Roster: ALL teams MUST provide a copy of your 9 STARS ROSTER and give
Chart Discussion: Fri-25-May-2018 Rainfall Last Week
 Chart Discussion: Fri-25-May-2018 Rainfall Last Week 1 Last Week s Charts 2 MSL Analysis / Sat Image (Thu) 3 MSL Analysis / Sat Image (Fri) 4 Last Week s Model Forecasts OBSERVED Chart Discussion: Fri-25-May-2018
Name: Date: Day/Period: CGC1P1: Interactions in the Physical Environment. Factors that Affect Climate
 Name: Date: Day/Period: CGC1P1: Interactions in the Physical Environment PART A: Weather and Climate Factors that Affect Climate 1. The words weather and climate are often incorrectly used interchangeably.
Gold Wheel Cup of AZ SPONSORSHIP PACKAGE
 2017-2018 Gold Wheel Cup of AZ SPONSORSHIP PACKAGE www.goldwheelcup.com https://www.facebook.com/gold-wheel-cup-of-az-748477095357054/ Copyright 2017 by La Roue d Or, LLC / SWSportsReg.com. All rights
Weather Unit Study Guide
 Weather Unit Study Guide - 2018 Weather vs Climate What does weather measure? The condition of the earth's atmosphere at a particular time and place. How are climate and weather different? Climate is the
Site Description: Tower Site
 Wind Resource Summary for Elizabeth Site Final Report Colorado Anemometer Loan Program Monitoring Period: 7/3/6 /15/7 Report Date: December 22, 7 Site Description: The site is.6 miles northeast of the
Drought! When Do We Know It s Over?
 Drought! When Do We Know It s Over? Nolan J. Doesken Colorado Climate Center Colorado State University http://ccc.atmos.colostate.edu Presented at the 2004 Peak to Prairie Landscape Symposium, February
9 STARS SPORTS/USA SOFTBALL AZ
 2018 WHOLE ENCHILADA SHOWCASE October 27-28, 2018 Coaches Packet 10U plays at: Rose Mofford Sports Complex, 9833 N. 25 th Ave., Phoenix, AZ 85021 & Rio Vista Sports Complex, 8866-A W. Thunderbird Rd, Peoria,
9-1: What Causes Climate. 6 th Grade Earth Science
 6 th Grade Earth Science What is Climate? 9-1: What Causes Climate Climate is the long-term average conditions of temperature, precipitation, winds, and clouds in an area. Examples of Climate The Mojave
Buckland Wind Resource Report
 Buckland Wind Resource Report By: Douglas Vaught, P.E., V3 Energy LLC, Eagle River, Alaska Date: September 17, 2010 Buckland met tower; D. Vaught photo Contents Summary... 2 Test Site Location... 2 Photographs...
Wind is caused by differences in air pressure created by changes in temperature and water vapor content.
 Topic 8: Weather Notes, Continued Workbook Chapter 8 Wind is caused by differences in air pressure created by changes in temperature and water vapor content. Wind blows from high pressure areas to low
Name Date L.O: SWBAT explain what breezes, planetary winds, ocean currents & monsoons are.
 Name Date L.O: SWBAT explain what breezes, planetary winds, ocean currents & monsoons are. 1. A cool breeze is blowing toward the land from the ocean on a warm, cloudless summer day. This condition is
9/25/2014. Scales of Atmospheric Motion. Scales of Atmospheric Motion. Chapter 7: Circulation of the Atmosphere
 Chapter 7: Circulation of the Atmosphere The Atmosphere: An Introduction to Meteorology, 12 th Lutgens Tarbuck Lectures by: Heather Gallacher, Cleveland State University Scales of Atmospheric Motion Small-
Historical Analysis of Montañita, Ecuador for April 6-14 and March 16-24
 Historical Analysis of Montañita, Ecuador for April 6-14 and March 16-24 Prepared for the ISA by Mark Willis and the Surfline Forecast and Science Teams Figure 1. Perfect Right- hander at Montañita, Ecuador
Bell Work. Compare and contrast warm fronts and cold fronts. What type of weather is associated with a high pressure and low pressure systems?
 Daily Routine Sit in your appropriate seat quietly Have all necessary materials out All back packs on the floor All cell phones on silent and away in backpacks All music devices off and headphones out
Meteorology I Pre test for the Second Examination
 Meteorology I Pre test for the Second Examination MULTIPLE CHOICE 1. A primary reason why land areas warm up more rapidly than water areas is that a) on land, all solar energy is absorbed in a shallow
McKnight's Physical Geography 11e
 Chapter 2 Lecture McKnight's Physical Geography 11e Lectures Chapter 5 Atmospheric Pressure and Wind Michael Commons Ohio Northern University Atmospheric Pressure and Wind The Nature of Atmospheric Pressure
REMINDERS: UPCOMING REVIEW SESSIONS: - Thursday, Feb 27, 6:30-8:00pm in HSS 1330
 REMINDERS: Midterm 2: Friday, February 28 - lecture material covering chapters 6, 7, and 15 (since first midterm and through Wed lecture) - same Format as first midterm UPCOMING REVIEW SESSIONS: - Thursday,
Social Studies CHAPTER 2: PART 2 CLIMATE AND WEATHER
 Social Studies CHAPTER 2: PART 2 CLIMATE AND WEATHER Climate Weather and Identity Climate and weather have a large influence on how Canadians build their identity. We will study the factors that contribute
The Shops at Lake Havasu I Lake Havasu, AZ
 The Shops at Lake Havasu I Lake Havasu, AZ cyoung@capital-rev.com 1 Investment Summary Location: 5601 N. Highway 95 South Lake Havasu, AZ Price: $5,125,269.60 Lot Size 26.58 Acres Price Per Sq. Ft. Pads
Atmosphere Circulation
 Atmosphere Circulation Winds What Causes Winds? Difference in air pressure due to unequal heating of the atmosphere. Temperatures vary according to the amount of sun it gets. Uneven heating of the Earth
Water Budget I: Precipitation Inputs
 Water Budget I: Precipitation Inputs Forest Cover Global Mean Annual Precipitation (MAP) Biomes and Rainfall Forests won t grow where P < 15 / yr Forest type depends strongly on rainfall quantity, type
Validation Study of the Lufft Ventus Wind Sensor
 Weather Forecasts Renewable Energies Air and Climate Environmental Information Technology METEOTEST Cooperative Fabrikstrasse 14, CH-3012 Bern Tel. +41 (0)31 307 26 26 Fax +41 (0)31 307 26 10 office@meteotest.ch,
Coriolis Effect Movies
 Introduction to Oceanography Lecture 16: Wind 2 Wind speed and direction about 1.5 km above sea level By Trent Schindler (NASA) using satellite data. Public Domain https://svs.gsfc.nasa.gov/4571 Coriolis
2 Air Masses and Fronts
 CHAPTER 16 2 Air Masses and Fronts SECTION Understanding Weather BEFORE YOU READ After you read this section, you should be able to answer these questions: How is an air mass different from a front? How
SURFLINE TEAHUPOO, TAHITI SURF REPORT
 SURFLINE TEAHUPOO, TAHITI SURF REPORT Historical Analysis of Swell Patterns in April & May, 1997 2009 Prepared for Billabong ~ by Sean Collins, July 2009 Billabong has requested assistance to choose improved
Design Criteria Data
 MEMPHIS TN Latitude = 35.35 N WMO No. 723345 Longitude = 89.87 W Elevation = 322 feet Period of Record = 1973 to 1996 Average Pressure = 29.68 inches Hg Design Criteria Data Mean Coincident (Average) Values
Design Criteria Data
 FRESNO CA Latitude = 36.77 N WMO No. 72389 Longitude =119.7 W Elevation = 328 feet Period of Record = 1972 to 1996 Average Pressure = 29.62 inches Hg Design Criteria Data Mean Coincident (Average) Values
9. The Earth's planetary winds are deflected as a result of the Earth's A) revolution around the Sun B) seasonal changes C) rotation on its axis D)
 revolution around the Sun B) seasonal changes C) rotation on its axis D)") 1. Which ocean current transports warm water away from Earth s equatorial region? A) Brazil Current B) Guinea Current C) Falkland Current D) California Current 2. The Gulf Stream and North Atlantic Current
1. Which ocean current transports warm water away from Earth s equatorial region? A) Brazil Current B) Guinea Current C) Falkland Current D) California Current 2. The Gulf Stream and North Atlantic Current
Engineering Report: Apache-Sitgreaves National Forests. Black Mesa Ranger District. Analysis of. National Forest System Roads (NFSRs) #s 504 & 169
 #s 504 & 169") Engineering Report: Apache-Sitgreaves National Forests Black Mesa Ranger District Analysis of National Forest System Roads (NFSRs) #s 504 & 169 for Motorized Mixed Use Designation Forest: Apache-Sitgreaves
Engineering Report: Apache-Sitgreaves National Forests Black Mesa Ranger District Analysis of National Forest System Roads (NFSRs) #s 504 & 169 for Motorized Mixed Use Designation Forest: Apache-Sitgreaves
WEATHER SYSTEMS OF MIDDLE LATITUDES
 CHAPTER 10 WEATHER SYSTEMS OF MIDDLE LATITUDES MULTIPLE CHOICE QUESTIONS 1. In equal volumes, which one of the following air masses exerts the highest surface air pressure? a. cp *b. A c. mp d. ct e. mt
MET 200 Lecture 11 Local Winds. Last Lecture: Forces. Review of Forces. Balance of Forces
 MET 200 Lecture 11 Local Winds Last Lecture: Forces Scales of Motion Eddies Sea Breeze Mountain-Valley Circulations Chinook - Snow Eater Drainage Wind - Katabatic Wind 1 2 Review of Forces 1. Pressure
CLIMATE OF WASHINGTON
 1 of 7 3/19/2008 11:37 AM CLIMATE OF WASHINGTON TOPOGRAPHIC FEATURES The location of the State of Washington on the windward coast in mid-latitudes is such that the climatic elements combine to produce
The Setting - Climatology of the Hawaiian Archipelago. Link to Video of Maui Waves
 The Setting - Climatology of the Hawaiian Archipelago Link to Video of Maui Waves What caused this week s weather? What caused this weekend s weather? Today s Objective: Provide overview and description