NOTE ->->-> DUE THURSDAY APRIL 20 TH 2006 THAT IS CORRECT I FORGOT THIS IS EASTER WEEKEND SO I HAVE EXTENDED THE DUE DATE TO THE ABOVE
|
|
|
- Charleen Richards
- 5 years ago
- Views:
Transcription
 (JAN, FEB, MAR) Gulf of Maine variation of primary productivity ANNUAL CYCLE Indian Ocean off the southeast coast of")
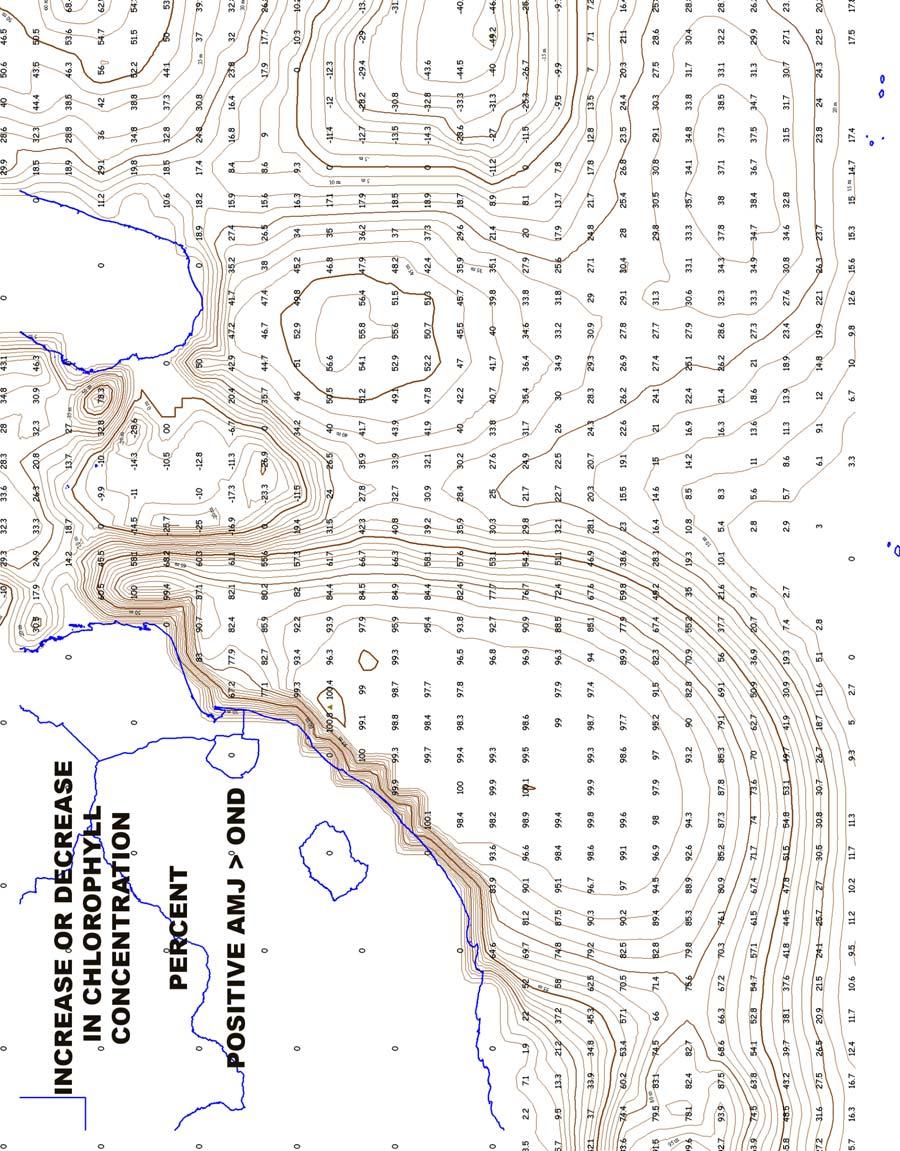
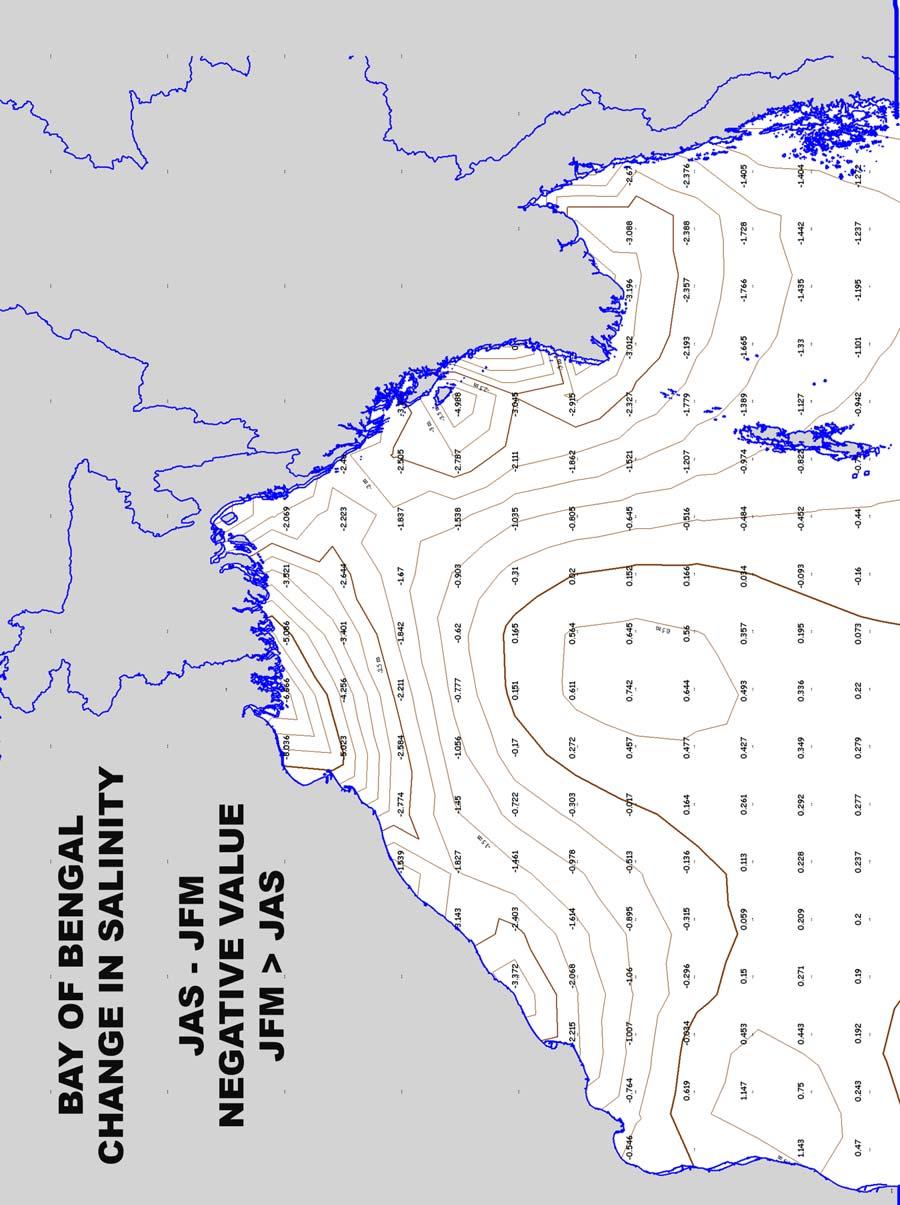
1 GEO 130 NAME OCEANOGRAPHY TEST 3 TAKE HOME TEST SPRING 2006 NOTE ->->-> DUE THURSDAY APRIL 20 TH 2006 THAT IS CORRECT I FORGOT THIS IS EASTER WEEKEND SO I HAVE EXTENDED THE DUE DATE TO THE ABOVE This test consists of: 3 case studies Bay of Bengal variation of SALINITY (AUG, SEP) (JAN, FEB, MAR) Gulf of Maine variation of primary productivity ANNUAL CYCLE Indian Ocean off the southeast coast of South Africa spring (northern hemisphere) phytoplankton bloom CHLOROPHYLL (APR, MAY, JUN) (OCT, NOV, DEC) CASE STUDY INDEX MAP 1 Map question - North Atlantic Basin 1 Map Question Antarctica and the Great Southern Ocean I eliminated questions on the films for this test. 1 of 14
2 GEO130 TEST 3 CASE STUDIES GENERAL INSTRUCTIONS Written answers must be created using a word processor, not hand written. On maps hand writing and drawing is, of course, fine. Be Neat! For scientists to communicate with each other their studies must be specific. For each of the case studies do the following: 1. Describe the geography of the region. Where is the study location and what geographic factors are relevant? What land, rivers, mountains are found in and around the region that may be important. Do not stretch the point if it is not important do not include it in the geographical summary. What ocean currents, if any, are important name them. 2. Describe the annual atmospheric and oceanic cycles which are driven by the variation of sunshine and are the starting points to discuss changes in the ocean environment. What changes take place in sunshine, the atmosphere in the region and in ocean circulation in the region that produce the changes in salinity or chlorophyll. Is the region known for a major weather system that produces drastic seasonal changes? 3. Describe the data. Indicate the time period, the data and the change in the data values. In general describe the changes from the first period to the second. For The Bay of Bengal and the Indian Ocean off South Africa, on the maps, shade in the general areas where the minimum and maximum values occur. Why do they occur there? 4. Proceed with the questions specific to each case study. 2 of 14


3 Case Study:The Gulf of Maine Map at Left Below seasonal temperature profiles Next page daily chlorophyll concentration of 14

4 The graph above shows the chlorophyll concentration in the Gulf of Maine for the year The graph on the previous page shows the annual change in the temperature profiles for four, three month periods. Write an essay (full sentences and paragraphs only) that describes what happens to the vertical temperature profile in the Gulf of Maine and why it happens over the course of a year. Include all relevant information that affect the primary productivity like vertical mixing, thermocline, pyconocline, column stability, etc. Your essay should be a concise summary of how and why vertical temperature structure changes, what is happening during each season and how if affects primary productivity. Take the information in your essay and apply it to the graph of chlorophyll concentration. Describe what is happening and why. Be sure to include the limiting factors for each season and for each change in chlorophyll concentration you discuss. 4 of 14

5 The major surface currents around Antarctica are the west wind drift (WWD - flowing to the east) and the Antarctic coastal current (ACC - also called the east wind drift). (10 points) a. Label the WWD and the ACC on the map above. b. Draw arrows indicating the net water transport for each current system based on the Coriolis effect c. The limit of the Great Southern Ocean is variable usually considered to be the Antarctic Divergence, label it on the map. d. Show where there is a zone of persistent upwelling. e. The ACC is caused by easterly (blowing to the west) surface winds. On the map illustrate the cause of the easterly surface winds around Antarctica f. The upwelling zone you located on the map above is a zone of high primary productivity but NOT all year. Why does the primary productivity decline during certain months. Which months? g. Why does the most dense water in the world form around Antarctica? What happens to it? h. IF global warming melts much of the Antarctic ice and prevents much of the north polar and Antarctic ice from forming each season what ironic occurrence may be the long term consequences of the change in the circulation of the global conveyor belt? 5 of 14
6 CASE STUDY INDIAN OCEAN OFF SOUTH AFRICA BE SURE YOU FIRST FOLLOW THE GENERAL INSTURCTIONS THEN ANSWER THE QUESTIONS BELOW. Did you indicate the areas of maximum and minimum chlorophyll? FULL SENTENCES, FULL PARAGRAPHS, USING MS WORD On the April, May and June maps draw the currents that are important in this environment. On the October, November and December map draw what the same currents look like during this time of the year. On an annual basis what are the most important oceaninc and atmospheric factors that cause the great increase in primary productivity during April, May and June? What is happening alongthe South African coast in AMJ that does not happen at other times of the year that accounts for the great primary productivity at that time? Why does this occur? This is an area where we find a western boundary current, how can there be so much primary productiviy? If you were a South African commercial fisher where would you be in April, May and June? Why? 6 of 14
7 7 of 14
8 8 of 14
9 9 of 14

10 For the North Atlantic basin, on the map above: a. NEATLY draw all the major currents of the North Atlantic Gyre and name them. b. Indicate the western boundary current and the eastern boundary current. c. Show where upwelling occurs due to the Coriolis effect for the entire basin d. Indicate where the maximum salinity occurs. e. Show where the highest average sea level occurs. f. indicate the the trade winds. Answer the questions below (use MS Word or similar program): a. Discuss the difference between an eastern boundary current and a western boundary current and explain why the difference exists. What is the implication for primary productivity? b. What causes the large ice free area north of Norway. Be sure the currents you put on the map indicate what is going on here. c. Why is the maximum salinity where it is? d. List all the eastern and western boundary currents for the world. 10 of 14
11 CASE STUDY BAY OF BENGAL BE SURE YOU FIRST FOLLOW THE GENERAL INSTURCTIONS THEN ANSWER THE QUESTIONS BELOW. Did you indicate the areas of maximum and minimum salinity? FULL SENTENCES, FULL PARAGRAPHS, USING MS WORD Describe the pattern of salinity in Jul, Aug and Sep. Why are there so many isopleths of salinity bunched so close together in the north end of the bay? The pattern of isopleth spacing has changed on the map for Jan, Feb, Mar. Why are there fewer isolines of salinity on this map? Referencing the annual cycle that occurs in the region what is happening here that reflects the larger pattern and the annual cycle? The salinity decrease is as much as 30% to 40% from JFM to JAS for the north end of the bay but over open water farther south the salinity INCREASES 3% to 3%. Why the difference. NOTE THE UNITS ON THE CHANGE MAP ARE IN PARTS PER THOUSAND, UNLINE THE SOUTH AFRICA MAP WITH UNITS IN PERCENT. Write an essay that describes the annual cycle of atmospheric and oceanic events in this part of the world. Tell me what happens and tell me why. Be thorough. 11 of 14
12 12 of 14
13 13 of 14
14 14 of 14
Ocean Currents Lecture Notes
 Ocean Currents Lecture Notes (Topic 9A) page 1 Ocean Currents Lecture Notes Surface Currents Ocean Currents (What is an ocean current? How is a current different from a wave?) The water in an travels from
Ocean Circulation. Si Hui Lee and Frances Wen. You can access ME at
 Ocean Circulation Si Hui Lee and Frances Wen You can access ME at http://tinyurl.com/oceancirculation Earth - the blue planet - 71% area covered by the oceans - 3/4 of ocean area between 3000-6000m deep
Introduction to Oceanography OCE 1001
 Introduction to Oceanography OCE 1001 Lecture Notes Chantale Bégin & Jessica Fry Version 2.1 10. Ocean Circulation (Trujillo, Chapter 7) Major ocean currents are stable and predictable; they have been
Lecture 13 El Niño/La Niña Ocean-Atmosphere Interaction. Idealized 3-Cell Model of Wind Patterns on a Rotating Earth. Previous Lecture!
 Lecture 13 El Niño/La Niña Ocean-Atmosphere Interaction Previous Lecture! Global Winds General Circulation of winds at the surface and aloft Polar Jet Stream Subtropical Jet Stream Monsoons 1 2 Radiation
For Class Today How does ocean water circulate? Ocean currents, surface currents, gyres, currents & climate, upwelling, deep ocean circulation
 For Class Today Modified Cornell Notes on section 16.1 (pg. 448-453) **Follow the guide in your ISN and previous notes for help** Heading: How does ocean water circulate? Left hand side categories: Ocean
CHAPTER 7 Ocean Circulation
 1 2 3 4 5 6 7 8 9 10 11 12 13 14 CHAPTER 7 Ocean Circulation Words Ocean currents Moving seawater Surface ocean currents Transfer heat from warmer to cooler areas Similar to pattern of major wind belts
Lesson: Ocean Circulation
 Lesson: Ocean Circulation By Keith Meldahl Corresponding to Chapter 9: Ocean Circulation As this figure shows, there is a connection between the prevailing easterly and westerly winds (discussed in Chapter
Section 6. The Surface Circulation of the Ocean. What Do You See? Think About It. Investigate. Learning Outcomes
 Chapter 5 Winds, Oceans, Weather, and Climate Section 6 The Surface Circulation of the Ocean What Do You See? Learning Outcomes In this section, you will Understand the general paths of surface ocean currents.
Ocean Layers. Based on sunlight penetration: Based on water density: Sunlight (photosynthesis is possible) Twilight Midnight
 Twilight Midnight") PART 3 Ocean Layers Based on sunlight penetration: Sunlight (photosynthesis is possible) Twilight Midnight Based on water density: Mixed layer Pycnocline (rapid change of themperature/salinity) Deep ocean
PART 3 Ocean Layers Based on sunlight penetration: Sunlight (photosynthesis is possible) Twilight Midnight Based on water density: Mixed layer Pycnocline (rapid change of themperature/salinity) Deep ocean
Role of the oceans in the climate system
 Role of the oceans in the climate system heat exchange and transport hydrological cycle and air-sea exchange of moisture wind, currents, and upwelling gas exchange and carbon cycle Heat transport Two Primary
Chapter 9: Circulation of the Ocean
 Chapter 9: Circulation of the Ocean Tropical gardens on Britain s Scilly Isles. Only 48 kilometers (30 miles) off the coast of Cornwall at 50 N, these scenic islands lie in the path of the warm waters
COMPARISON OF FIXED & VARIABLE RATES (25 YEARS) CHARTERED BANK ADMINISTERED INTEREST RATES - PRIME BUSINESS*
 CHARTERED BANK ADMINISTERED INTEREST RATES - PRIME BUSINESS*") COMPARISON OF FIXED & VARIABLE RATES (25 YEARS) Fixed Rates Variable Rates FIXED RATES OF THE PAST 25 YEARS AVERAGE RESIDENTIAL MORTGAGE LENDING RATE - 5 YEAR* (Per cent) Year Jan Feb Mar Apr May Jun Jul
COMPARISON OF FIXED & VARIABLE RATES (25 YEARS) Fixed Rates Variable Rates FIXED RATES OF THE PAST 25 YEARS AVERAGE RESIDENTIAL MORTGAGE LENDING RATE - 5 YEAR* (Per cent) Year Jan Feb Mar Apr May Jun Jul
Currents & Gyres Notes
 Currents & Gyres Notes Current A river of water flowing in the ocean. 2 Types of Currents Surface Currents wind-driven currents that occur in the top 100m or less Deep Currents density-driven currents
170 points. 38 points In your textbook, read about modern oceanography. For each item write the word that meets the description.
 Ch 15 Earth s Oceans SECTION 15.1 An Overview of Oceans 38 points In your textbook, read about modern oceanography. For each item write the word that meets the description. (5 points) 1. German research
(20 points) 1. ENSO is a coupled climate phenomenon in the tropical Pacific that has both regional and global impacts.
 1. ENSO is a coupled climate phenomenon in the tropical Pacific that has both regional and global impacts.") SIO 210 Problem Set 4 Answer key December 1, 2014 Due Dec. 12, 2014 (20 points) 1. ENSO is a coupled climate phenomenon in the tropical Pacific that has both regional and global impacts. (2 points) a)
SIO 210 Problem Set 4 Answer key December 1, 2014 Due Dec. 12, 2014 (20 points) 1. ENSO is a coupled climate phenomenon in the tropical Pacific that has both regional and global impacts. (2 points) a)
Ocean Currents that Redistribute Heat Globally
 Ocean Currents that Redistribute Heat Globally Ocean Circulation Ocean Currents Fig. CO7 OCEAN CURRENTS Surface ocean currents are similar to wind patterns: 1. Driven by Coriolis forces 2. Driven by winds
IX. Upper Ocean Circulation
 IX. Upper Ocean Circulation World Ocean Covers 71% of Earth s surface Contains 97% of surface water Arctic Ocean NH: 61% ocean, 39% land Pacific Ocean Atlantic Ocean Southern Ocean Indian Ocean SH: 81%
General Oceanography Geology 105 Expedition #19 The Ocean and Climate
 General Oceanography Geology 105 Expedition #19 The Ocean and Climate Name Not attempting to answer questions on expeditions will result in point deductions on course workbook (two or more blank answers
ATS150: Global Climate Change. Oceans and Climate. Icebergs. Scott Denning CSU 1
 The Oceans Wind-Driven Gyre Circulations Icebergs Scott Denning CSU 1 Surface Balance of Forces friction coriolis wind stress resultant current Wind stress accelerates surface water Friction couples surface
Wind Driven Circulation Indian Ocean and Southern Ocean
 Wind Driven Circulation Indian Ocean and Southern Ocean Lecture 18 MAR 350 Spring 2017 Reading: Knauss Chapter 7 ECCO2 model animation ecco2_sst_flow (2).mp4 Mean surface height and currents DPO Fig. 11.1
ENSO Cycle: Recent Evolution, Current Status and Predictions. Update prepared by Climate Prediction Center / NCEP 8 March 2010
 ENSO Cycle: Recent Evolution, Current Status and Predictions Update prepared by Climate Prediction Center / NCEP 8 March 2010 Outline Overview Recent Evolution and Current Conditions Oceanic Niño Index
EARTH, PLANETARY, & SPACE SCIENCES 15 INTRODUCTION TO OCEANOGRAPHY. LABORATORY SESSION #6 Fall Ocean Circulation
 EARTH, PLANETARY, & SPACE SCIENCES 15 INTRODUCTION TO OCEANOGRAPHY LABORATORY SESSION #6 Fall 2017 Ocean Circulation The focus of the Lab this week is circulation of the ocean and atmosphere. Here, you
Duckies have been found in Hawaii, Alaska, S. America, Scotland, Washington state and Australia as of 2012.
 Duckies have been found in Hawaii, Alaska, S. America, Scotland, Washington state and Australia as of 2012. We learned that it takes 3 years to complete one circuit of the North Pacific Gyre flow in the
The Surface Currents OCEA 101
 The Surface Currents OCEA 101 Why should you care? - the surface ocean circulation controls the major ocean biomes - variations in ocean circulation control the supply of nutrients for marine organisms
ATOMOSPERIC PRESSURE, WIND & CIRCULATION
 ATOMOSPERIC PRESSURE, WIND & CIRCULATION A. INTRODUCTION Important because: pressure patterns drive wind patterns which in turn drive oceanic circulation patterns o atmospheric & oceanic circulation: major
OCEANOGRAPHY STUDY GUIDE
 OCEANOGRAPHY STUDY GUIDE Chapter 2 Section 1 1. Most abundant salt in ocean. Sodium chloride; NaCl 2. Amount of Earth covered by Water 71% 3. Four oceans: What are they? Atlantic, Pacific, Arctic, Indian
OCEANOGRAPHY 101. Map, and temperature, salinity & density profiles of the water column at X, near mouth of the Columbia River.
 OCEANOGRAPHY 101 EXAM 2 WINTER 00 NAME STUDENT NUMBER 1 Map, and temperature, salinity & density profiles of the water column at X, near mouth of the Columbia River. P a c i f i c O c e a n X WA Columbia
Chapter 6: Atmospheric Pressure, Wind, and Global Circulation
 Discovering Physical Geography Third Edition by Alan Arbogast Chapter 6: Atmospheric Pressure, Wind, and Global Circulation Factors That Influence Air Pressure Air Pressure is the measured weight of air
W3 Global Circulation Systems
 W3 Global Circulation Systems Which regions of Earth receive the most energy from the Sun? If not for global circulation systems There would only be two narrow regions that would support life What
Variability in the tropical oceans - Monitoring and prediction of El Niño and La Niña -
 Variability in the tropical oceans - Monitoring and prediction of El Niño and La Niña - Jun ichi HIROSAWA Climate Prediction Division Japan Meteorological Agency SST anomaly in Nov. 1997 1 ( ) Outline
Ocean Inter-annual Variability: El Niño and La Niña. How does El Niño influence the oceans and climate patterns?
 Name: Date: Guiding Question: Ocean Inter-annual Variability: El Niño and La Niña How does El Niño influence the oceans and climate patterns? Introduction What is El Niño/La Niña? The El Niño/La Niña cycle
THE ATMOSPHERE. WEATHER and CLIMATE. The Atmosphere 10/12/2018 R E M I N D E R S. PART II: People and their. weather. climate?
 R E M I N D E R S Two required essays are due by Oct. 30, 2018. (A third may be used for extra credit in place of a Think Geographically essay.) ESSAY TOPICS (choose any two): Contributions of a noted
Oceans and the Global Environment: Lec 2 taking physics and chemistry outdoors. the flowing, waving ocean
 Oceans and the Global Environment: Lec 2 taking physics and chemistry outdoors the flowing, waving ocean Peter Rhines 1 Eric Lindahl 2 Bob Koon 2, Julie Wright 3 www.ocean.washington.edu/courses/has221a-08
Friday, February 8 th. Winds/Coriolis Worksheet: Due Today Lab Worksheet: Finish Questions
 Ocean Currents Friday, February 8 th Winds/Coriolis Worksheet: Due Today Lab Worksheet: Finish Questions Non-rotating Earth Convection cell model Add rotation and add landmasses unequal heating and cooling
ESS15 Lecture 12. Review, tropical oceans & El Nino, and the thermohaline ocean circulation. Please see new reading material on website.
 ESS15 Lecture 12 Review, tropical oceans & El Nino, and the thermohaline ocean circulation. Please see new reading material on website. Review. I-clicker exercise: In this graph of Earth s energy imbalances
The Ocean is a Geophysical Fluid Like the Atmosphere. The Physical Ocean. Yet Not Like the Atmosphere. ATS 760 Global Carbon Cycle The Physical Ocean
 The Physical Ocean The Ocean is a Geophysical Fluid Like the Atmosphere Three real forces: Gravity Pressure gradients Friction Two apparent forces: Coriolis and Centrifugal Geostrophic & Hydrostatic balances
Agronomy 406 World Climates
 Agronomy 406 World Climates January 30, 2018 Monsoons. Ocean properties and circulation. Review for today: Online textbook: 1.3.1 (Sea water) Composition and properties. For Thursday: Rahmstorf, S.: The
OCN 201 Surface Circulation
 OCN 201 Surface Circulation Excess heat in equatorial regions requires redistribution toward the poles 1 In the Northern hemisphere, Coriolis force deflects movement to the right In the Southern hemisphere,
Monday, October 2, Watch for new assessment (Week 4/5 review) TA s have your tests, please see key (at course website)
 TA s have your tests, please see key (at course website)") Monday, October 2, 2017 Watch for new assessment (Week 4/5 review) TA s have your tests, please see key (at course website) Homework 3 Due date Wednesday, Oct 11 (8 pm) Be ready to watch another important
Monday, October 2, 2017 Watch for new assessment (Week 4/5 review) TA s have your tests, please see key (at course website) Homework 3 Due date Wednesday, Oct 11 (8 pm) Be ready to watch another important
Wind and Air Pressure
 Wind and Air Pressure When air moves above the surface of the Earth, it is called wind. Wind is caused by differences in air pressure. When a difference in pressure exists, the air will move from areas
TEACHER VERSION: Suggested Student Responses Included. Upwelling and Phytoplankton Productivity
 Name: Date: TEACHER VERSION: Suggested Student Responses Included Guiding Questions: Upwelling and Phytoplankton Productivity How does nutrient concentration influence phytoplankton growth in coastal and
Section 3: Atmospheric Circulation
 Section 3: Atmospheric Circulation Preview Key Ideas The Coriolis Effect Global Winds Local Winds Maps in Action Key Ideas Explain the Coriolis effect. Describe the global patterns of air circulation,
Winds and Ocean Circulations
 Winds and Ocean Circulations AT 351 Lab 5 February 20, 2008 Sea Surface Temperatures 1 Temperature Structure of the Ocean Ocean Currents 2 What causes ocean circulation? The direction of most ocean currents
ATMOSPHERIC CIRCULATION
 Name ATMOSPHERIC CIRCULATION (adapted from Dr. S. Postawko, U. of Ok.) INTRODUCTION Why does the wind blow? Why do weather systems in the mid-latitudes typically move from west to east? Now that we've
Module 3, Investigation 1: Briefing 1 What are the effects of ENSO?
 Background The changing temperatures of the tropical Pacific Ocean affect climate variability all over Earth. Ocean warming and cooling dramatically affect human activities by changing weather patterns
Utility Debt Securitization Authority 2013 T/TE Billed Revenues Tracking Report
 Utility Debt Securitization Authority 2013 T/TE Billed Revenues Tracking Report Billing Budgeted Billed Dollar Percent Month Revenues Revenues Variance Variance Jan 2018 11,943,180.68 12,697,662.47 754,481.79
Deep Water Currents Lab
 Deep Water Currents Lab Background: Anyone visiting the seashore is struck by the constant motion of water traveling on the surface of the ocean in the form of waves. But beneath the ocean's surface, water
The General Circulation and El Niño. Dr. Christopher M. Godfrey University of North Carolina at Asheville
 The General Circulation and El Niño Dr. Christopher M. Godfrey University of North Carolina at Asheville Global Circulation Model Air flow broken up into 3 cells Easterlies in the tropics (trade winds)
Recent Atmospheric and Oceanic Circulation Changes Affecting Winter Weather in North America. Dr. Art Douglas Professor Emeritus Creighton University
 Recent Atmospheric and Oceanic Circulation Changes Affecting Winter Weather in North America Dr. Art Douglas Professor Emeritus Creighton University Outline 1. The 2018 El Nino: A Northern Hemisphere induced
Earth s oceans covers 71 % _ of the planet s surface. In reality, Earth s ocean waters are all. interconnected as part of a single large global ocean.
 Ocean Motion Met 101: Introduction to the World's Oceans Produced by The COMET Program Geography: Name Pd. Earth s oceans covers 71 % _ of the planet s surface. In reality, Earth s ocean waters are all
Station 1: Solar Radiation on Earth
 Station 1: Solar Radiation on Earth Activity Procedures 1. Choose one person to be the Sun. 2. Standing an arm s length away from the globe, have the Sun classmate hold the flashlight level with the equator,
Ocean Currents Shortcut method by to learn faster
 Ocean Currents Shortcut method by to learn faster In our geography notes on the hydrosphere, we have seen the major movements of the ocean water. They are waves, tides and ocean currents. Having covered
Ocean Currents Shortcut method by to learn faster
 Ocean Currents Shortcut method by to learn faster In our geography notes on the hydrosphere, we have seen the major movements of the ocean water. They are waves, tides and ocean currents. Having covered
Wednesday, September 27, 2017 Test Monday, about half-way through grading. No D2L Assessment this week, watch for one next week
 Wednesday, September 27, 2017 Test Monday, about half-way through grading No D2L Assessment this week, watch for one next week Homework 3 Climate Variability (due Monday, October 9) Quick comment on Coriolis
SEASONAL PRICES for TENNESSEE FEEDER CATTLE and COWS
 SEASONAL PRICES for TENNESSEE FEEDER CATTLE and COWS Tammy L. McKinley Extension Specialist Agricultural & Resource Economics economics.ag.utk.edu AE16-06 July 2016 TABLE OF CONTENTS Seasonal : Introduction...
1 Currents. TAKE A LOOK 2. Read a Map In what direction does the Gulf Stream flow?
 CHAPTER 5 1 Currents SECTION The Movement of Ocean Water BEFORE YOU READ After you read this section, you should be able to answer these questions: What factors affect ocean currents? Why are ocean currents
Lecture 5.1 Surface Ocean Circulation. Image from Daily Mail Newspaper, UK
 Lecture 5.1 Surface Ocean Circulation Image from Daily Mail Newspaper, UK Announcements Midterm is Thursday, consists of 25 multiple choice, 3 pages short answer questions No Scantron needed Calculators,
Chapter 22, Section 1 - Ocean Currents. Section Objectives
 Chapter 22, Section 1 - Ocean Currents Section Objectives Intro Surface Currents Factors Affecting Ocean Currents Global Wind Belts (you should draw and label a diagram of the global wind belts) The Coriolis
10% water in the world is tied up in the surface ocean currents. (above the pycnocline) Primary source is wind: Westerlies, Trades, Polar Easterlies
 Primary source is wind: Westerlies, Trades, Polar Easterlies") Oceanography Chapter 9 10% water in the world is tied up in the surface ocean currents. (above the pycnocline) Primary source is wind: Westerlies, Trades, Polar Easterlies Coriolis deflects winds (and
Oceanography Chapter 9 10% water in the world is tied up in the surface ocean currents. (above the pycnocline) Primary source is wind: Westerlies, Trades, Polar Easterlies Coriolis deflects winds (and
Wind in the Atmosphere
 Lesson 2 Wind in the Atmosphere ESSENTIAL QUESTION What is wind? By the end of this lesson, you should be able to explain how energy provided by the sun causes atmospheric movement, called wind. p 6.ESS2.2,
Wisconsin 511 Traveler Information Annual Usage Summary January 3, Wisconsin 511 Phone Usage ( )
") Wisconsin 511 Traveler Information 211 Annual Usage Summary January 3, 212 Overall to-date Summary 36 months of operation 1,16,63 total calls the 1 Million mark was passed on December 3, 212 3,627,527
Wisconsin 511 Traveler Information 211 Annual Usage Summary January 3, 212 Overall to-date Summary 36 months of operation 1,16,63 total calls the 1 Million mark was passed on December 3, 212 3,627,527
and the Link between Oceans, Atmosphere, and Weather
 Geography Worksheet Instructions Using a map, atlas, or any other materials your teacher suggests, label the following on the blank map provided. 1. Label East, West, North, and South. 2. Label the following
3 Global Winds and Local Winds
 CHAPTER 15 3 Global Winds and Local Winds SECTION The Atmosphere BEFORE YOU READ After you read this section, you should be able to answer these questions: What causes wind? What is the Coriolis effect?
A review of 2015 fatal collision statistics as of 31 December 2015
 A review of fatal collision statistics as of 31 December This report summarises the main trends in road fatalities that have emerged in. This has been prepared by the Road Safety Authority following analysis
3 Global Winds and Local Winds
 CHAPTER 6 3 Global Winds and Local Winds SECTION The Atmosphere BEFORE YOU READ After you read this section, you should be able to answer these questions: What causes wind? What is the Coriolis effect?
El Niño / Southern Oscillation (ENSO) and inter-annual climate variability
 and inter-annual climate variability") El Niño / Southern Oscillation (ENSO) and inter-annual climate variability seasonal cycle what is normal? monthly average conditions through a calendar year sea level pressure and surface winds surface
El Niño / Southern Oscillation (ENSO) and inter-annual climate variability seasonal cycle what is normal? monthly average conditions through a calendar year sea level pressure and surface winds surface
Ocean Motion. Ocean Currents. Before You Read. Read to Learn
 chapter 18 3 Ocean Motion section 2 Ocean Currents What You ll Learn the Coriolis effect what influences surface currents the temperature of coastal waters about density currents Before You Read Imagine
Chapter 10 Lecture Outline. The Restless Oceans
 Chapter 10 Lecture Outline The Restless Oceans Focus Question 10.1 How does the Coriolis effect influence ocean currents? The Ocean s Surface Circulation Ocean currents Masses of water that flow from one
SURFACE CURRENTS AND TIDES
 NAME SURFACE CURRENTS AND TIDES I. Origin of surface currents Surface currents arise due to the interaction of the prevailing wis a the ocean surface. Hence the surface wi pattern (Figure 1) plays a key
Summary of Lecture 10, 04 March 2008 Introduce the Hadley circulation and examine global weather patterns. Discuss jet stream dynamics jet streams
 Summary of Lecture 10, 04 March 2008 Introduce the Hadley circulation and examine global weather patterns. Discuss jet stream dynamics jet streams arise because the Coriolis force prevents Hadley-type
Current: large mass of continuously moving ocean water
 Ocean Currents Current: large mass of continuously moving ocean water Surface Currents--Wind Circulation These waters make up about 10% of all the water in the ocean. These waters are the upper 400 meters
Currents. History. Pressure Cells 3/13/17. El Nino Southern Oscillation ENSO. Teleconnections and Oscillations. Neutral Conditions
 Teleconnections and Oscillations Teleconnection climate anomalies being related to each other over a large scale Oscillations: Macroscale movement of atmospheric systems that can influence weather, climate,
2018 HR & PAYROLL Deadlines
 th (by payment date) EPAF 3rd PARTY FEEDS WTE Approval 2018 HR & PAYROLL s Normal Payroll day s 2017 B1-26 3 * 13-Dec-17 15-Dec-17 n/a n/a n/a 28-Dec-17 29-Dec-17 11:00 AM 16-Dec-2017 29-Dec-2017 JAN 2018
Global Winds AOSC 200 Tim Canty
 Global Winds AOSC 200 Tim Canty Class Web Site: http://www.atmos.umd.edu/~tcanty/aosc200 Topics for today: Global Wind Patterns Deserts Jet Stream Monsoons Ocean transport Ocean cycles Lecture 16 Oct 24
Global Winds and Local Winds
 Global Winds and Local Winds National Science Education Standards ES 1j What is the Coriolis effect? What are the major global wind systems on Earth? What Causes Wind? Wind is moving air caused by differences
APPENDIX B NOAA DROUGHT ANALYSIS 29 OCTOBER 2007
 APPENDIX B NOAA DROUGHT ANALYSIS 29 OCTOBER 2007 ENSO Cycle: Recent Evolution, Current Status and Predictions Update prepared by Climate Prediction Center / NCEP October 29, 2007 Outline Overview Recent
ENSO Cycle: Recent Evolution, Current Status and Predictions. Update prepared by Climate Prediction Center / NCEP 4 September 2012
 ENSO Cycle: Recent Evolution, Current Status and Predictions Update prepared by Climate Prediction Center / NCEP 4 September 2012 Outline Overview Recent Evolution and Current Conditions Oceanic Niño Index
Analysis of 2012 Indian Ocean Dipole Behavior
 Analysis of 2012 Indian Ocean Dipole Behavior Mo Lan National University of Singapore Supervisor: Tomoki TOZUKA Department of Earth and Planetary Science, University of Tokyo Abstract The Indian Ocean
Chapter 6. Atmospheric and Oceanic. Circulations. Circulations
 Chapter 6 Atmospheric and Oceanic Circulations Robert W. Christopherson Charlie Thomsen Winds: Transfer energy and mass (1) Balance energy equatorial energy surplus and polar energy deficit (2) Generate
OCN-201 Chemistry and Physics section
 Name: Class: _ Date: _ OCN-201 Chemistry and Physics section True/False Indicate whether the statement is true or false. 1. Because of the dissolved salt in seawater its freezing point is lower than that
Upwelling and Phytoplankton Productivity
 Name: Date: Guiding Questions: Upwelling and Phytoplankton Productivity How does nutrient concentration influence phytoplankton growth in coastal and open ocean waters? What and where are the upwelling
Atmosphere Circulation
 Atmosphere Circulation Winds What Causes Winds? Difference in air pressure due to unequal heating of the atmosphere. Temperatures vary according to the amount of sun it gets. Uneven heating of the Earth
Lornshill Academy. Geography Department Higher Revision Physical Environments - Atmosphere
 Lornshill Academy Geography Department Higher Revision Physical Environments - Atmosphere Physical Environments Atmosphere Global heat budget The earth s energy comes from solar radiation, this incoming
The student will be expected to demonstrate an understanding of the cause of winds and how winds affect climate.
 The student will be expected to demonstrate an understanding of the cause of winds and how winds affect climate. In this lesson you will: 2.3.1 Define the term prevailing winds. (k) 2.3.3 State the impact
Seasonal Circulation in the Yellow and the East China Seas driven by the monsoon winds
 Seasonal Circulation in the Yellow and the East China Seas driven by the monsoon winds Ig-Chan Pang 1 and Jae-Hong Moon 2 1 : Cheju National University 2 : Department of Earth System Science and Technology,
Sailing the Seas: Wind Driven Ocean Circulation Ocean Gyres
 Sailing the Seas: Wind Driven Ocean Circulation Ocean Gyres Ocean Currents What Happens at the Coast? Readings: Ch 9: 9.2-9.6, 9.8-9.13 Graphic: America's Cup sailboat race off Newport, Rhode Island. J.
Directed Reading. Section: Ocean Currents. a(n). FACTORS THAT AFFECT SURFACE CURRENTS
. FACTORS THAT AFFECT SURFACE CURRENTS") Skills Worksheet Directed Reading Section: Ocean Currents 1. A horizontal movement of water in a well-defined pattern is called a(n). 2. What are two ways that oceanographers identify ocean currents? 3.
Skills Worksheet Directed Reading Section: Ocean Currents 1. A horizontal movement of water in a well-defined pattern is called a(n). 2. What are two ways that oceanographers identify ocean currents? 3.
SIO 210 Problem Set 3 November 4, 2011 Due Nov. 14, 2011
 SIO 210 Problem Set 3 November 4, 2011 Due Nov. 14, 2011 1. At 20 N, both the ocean and the atmosphere carry approximately 2 PW of heat poleward, for a total of about 4 PW (see figure). If (at this latitude)
Air Pressure and Wind
 Air Pressure and Wind 19.1 Understanding Air Pressure Air Pressure Defined Air pressure is the pressure exerted by the weight of air. Air pressure is exerted in all directions down, up, and sideways. The
California Current Forage Fishes (Ranked by Biomass of the Group)
") California Current Forage Fishes (Ranked by iomass of the Group) Meso- and bathypelagic fishes - Many short-lived species (lanternfishes, deepsea smelts) Coastal pelagic and migratory fishes -7 mod-lived
California Current Forage Fishes (Ranked by iomass of the Group) Meso- and bathypelagic fishes - Many short-lived species (lanternfishes, deepsea smelts) Coastal pelagic and migratory fishes -7 mod-lived
Section 1. Global Wind Patterns and Weather. What Do You See? Think About It. Investigate. Learning Outcomes
 Chapter 5 Winds, Oceans, Weather, and Climate Section 1 Global Wind Patterns and Weather What Do You See? Learning Outcomes In this section, you will Determine the effects of Earth s rotation and the uneven
AOS 103. Week 4 Discussion
 AOS 103 Week 4 Discussion Starting from an atmospheric HIGH pressure center (e.g. for the subtropical Pacific) North Hemi 1) Deduce/draw/describe the geostrophic wind 2) Deduce/draw/describe the Ekman
Lesson: Atmospheric Dynamics
 Lesson: Atmospheric Dynamics By Keith Meldahl Corresponding to Chapter 8: Atmospheric Circulation Our atmosphere moves (circulates) because of uneven solar heating of the earth s surface, combined with
Lecture 24. El Nino Southern Oscillation (ENSO) Part 1
 Part 1") Lecture 24 El Nino Southern Oscillation (ENSO) Part 1 The most dominant phenomenon in the interannual variation of the tropical oceanatmosphere system is the El Nino Southern Oscillation (ENSO) over the
Lecture 24 El Nino Southern Oscillation (ENSO) Part 1 The most dominant phenomenon in the interannual variation of the tropical oceanatmosphere system is the El Nino Southern Oscillation (ENSO) over the
3. EXCEL FORMULAS & TABLES
 Fall 2017 CS130 - Excel Formulas & Tables 1 3. EXCEL FORMULAS & TABLES Fall 2017 Fall 2017 CS130 - Excel Formulas & Tables 2 Cell References Absolute reference - refer to cells by their fixed position.
McKnight's Physical Geography 11e
 Chapter 2 Lecture McKnight's Physical Geography 11e Lectures Chapter 5 Atmospheric Pressure and Wind Michael Commons Ohio Northern University Atmospheric Pressure and Wind The Nature of Atmospheric Pressure
Prevailing Winds. The Coriolis Effect
 Prevailing Winds 1. Wind: a movement of air in the atmosphere. Bill Nye wind (2 minutes) 2. Local or regional wind: occur in fairly small areas. 3. Prevailing winds: Major wind pattern that affect large
9/25/2014. Scales of Atmospheric Motion. Scales of Atmospheric Motion. Chapter 7: Circulation of the Atmosphere
 Chapter 7: Circulation of the Atmosphere The Atmosphere: An Introduction to Meteorology, 12 th Lutgens Tarbuck Lectures by: Heather Gallacher, Cleveland State University Scales of Atmospheric Motion Small-
Lecture 13. Global Wind Patterns and the Oceans EOM
 Lecture 13. Global Wind Patterns and the Oceans EOM Global Wind Patterns and the Oceans Drag from wind exerts a force called wind stress on the ocean surface in the direction of the wind. The currents
Midterm Exam III November 25, 2:10
 Midterm Exam III November 25, 2:10 25, 2:10 3:25 pm, HW714 Chapters 7 (7.12 7.17), 8 and 9 (through section 9.15, included) 60 multiple choice questions this exam constitutes 22% (only) of your total (overall)