Session 2b: Wind power spatial planning techniques
|
|
|
- Magnus May
- 5 years ago
- Views:
Transcription
1 Session 2b: Wind power spatial planning techniques IRENA Global Atlas Spatial planning techniques 2-day seminar Central questions we want to answer After having identified those areas which are potentially available for renewables, we want to estimate what the potential solar wind capacity per km² and in total is (W/km²), and, how much electricity (Wh/km²/a) can be generated in areas with different wind regimes. We also need to know which parameters are the most sensitive ones in order to identify the most important input parameters. 2
2 Site assessment (wind atlas data, wind speed (m/s) for certain height (m)) Exclusion of non-suitable land areas and adding of buffer zones Nature protected area Areas technically not suitable (high slope and above certain altitude, etc.) done Transport, supply and communication infrastructure Urban area (buffer zone: 8 10 hub height) Landscape, historic area, other nonusable land (glaciers, rivers, etc.) Areas potentially suitable for wind farms (km 2 ) Economic assessment Areas potentially suitable for wind farms (km 2 ) Wind speed extrapolation to turbine hub height Hub height (m) Roughness length or wind shear exponent Wind speed at hub height (m/s) Energy output calculation Power curve, wind turbine density (W/km 2 ), air density Weibull distribution (k, A) Electrical losses (%) Annual energy prod. (Wh/a/km 2 ) Wind capacity per area (W/km 2 ) Priority areas for wind power (km 2 ), potentially installed capacity (W), potentially generated energy (Wh/a) and costs Energy generation costs at specific site ( /Wh) Energy policy analysis Economic parameters (wind farm and grid connection) pendin ng CAPEX OPEX WACC Life time CAPEX = Capacity expenditu ure, OPEX = Operation expenditure, WACC = Weigh hted average cost of capital (depth, equity) RENAC Agenda 1. Overview on wind energy estimation 2. Formation of wind 3. Technical aspects we need to know 4. Spatial setup of wind farms 5. Estimating wind electricity yield 6. Worked example: Estimating wind capacity and yield at a given site 4

3 1. OVERVIEW ON WIND ENERGY ESTIMATION 5 Wind speed extrapolation Extrapolated wind speed at hub height Height of measured wind speed 6

4 Wind speed extrapolation also depends on surroundings Extrapolated wind speed at hub height Height of measured wind speed 7 Each turbine type has its characteristic power curve 8

5 At each site, wind has its own timely distribution Site A Average wind speed data is not sufficient, wind speed distribution is crucial! Site B 9 Estimating wind energy generation Estimation of wind energy generation depends on a large number of factors and should be carried out with great care. It is necessary to find a representative mix of suitable wind turbines in order to get a good estimate of the wind energy that could be produced. If there is, the resulting capacity factor (full-load hours) should be cross-checked with existing wind projects. If there already is a larger number of wind projects, one could alternatively use existing capacity factor information for further estimations. If data is not available a national measurement campaign may be advisable. 10
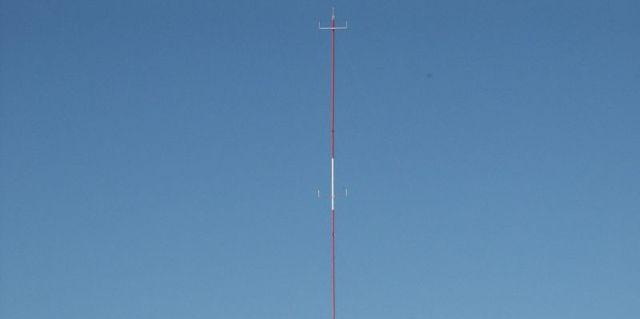
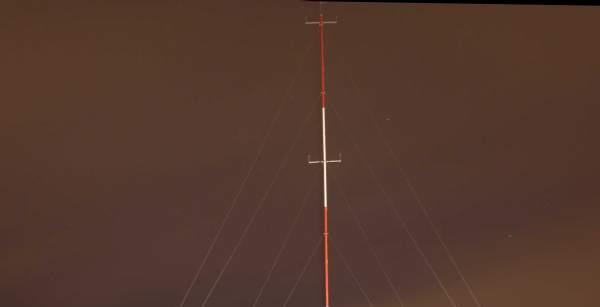
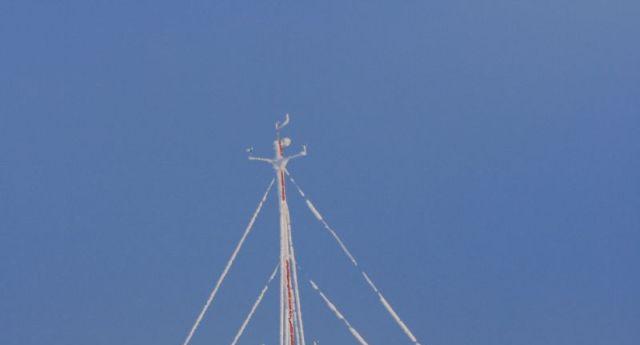
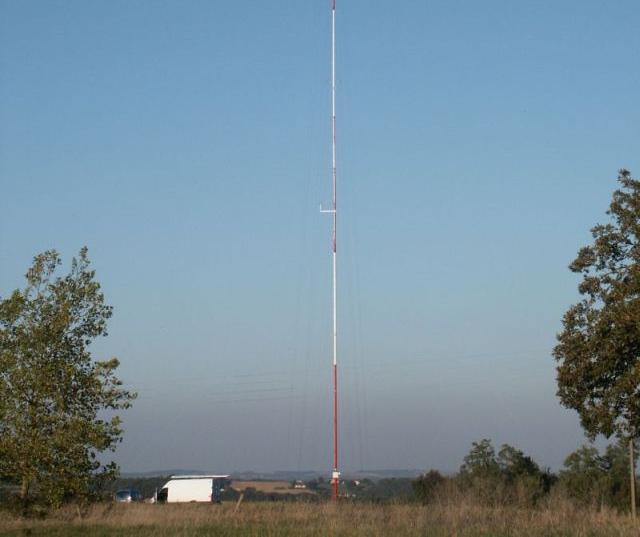
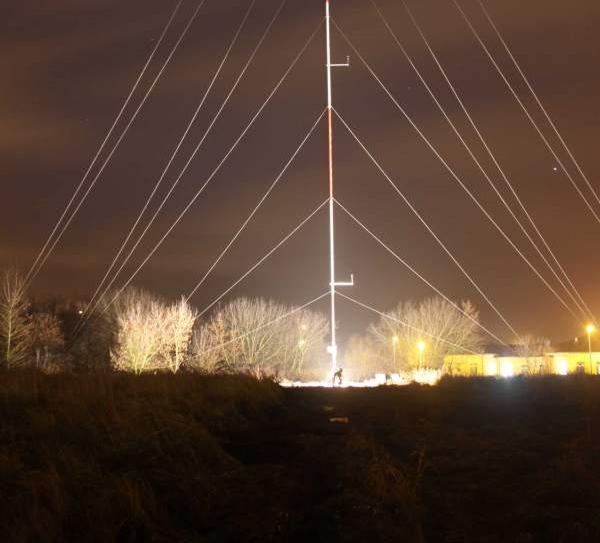
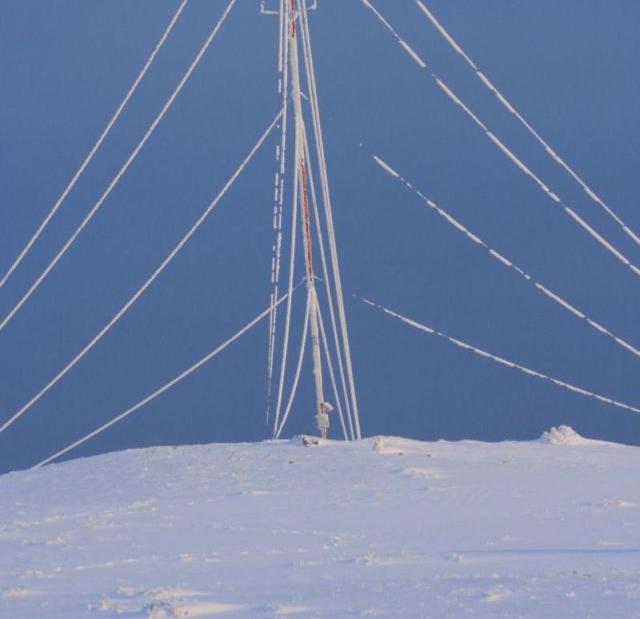
6 Wind measurement tube towers Source: FORMATION OF WIND 12
7 High and low pressure area High pressure area occurs when air becomes colder (winter high pressure areas can be quite strong and lasting). The air become heavier and sink towards the earth. Skies are usually clear. The airflow is clockwise (northern hemi). The air flows towards the low pressure area over the ground. Isobars Low pressure occurs when air becomes warmer. The air become lighter and rises. The pressure lowers towards the center and air flow is counterclockwise (northern hemi). Clouds will appear due to rising of the moist warm air and the weather will deteriorate. Air will flow back to the high pressure area at higher altitudes in the atmosphere. 13 Source: Mountain valley breeze 14


8 Sea-land breeze TECHNICAL ASPECTS WE NEED TO KNOW 16
 17 Roughness length Z 0 and wind shear To evaluate wind conditions in a landscape information on the")

9 Vertical wind shear profile and roughness of surface Heig ght Heig ght Profile above area with low roughness (sea, low grass) Profile above area with high roughness (forest, town) 17 Roughness length Z 0 and wind shear To evaluate wind conditions in a landscape information on the roughness is needed. The roughness classes or roughness lengths are specific for different landscapes. Wind shear: The fact that the wind profile is twisted towards a lower speed as we move closer to ground level, is usually called wind shear. Source: 18
![Roughness classes and roughness lengths (European wind atlas) Roughness class Roughness length Z 0 [m] Landscape type 0 0.0002 Water surface 0.5 0.](/docs-images/95/125365595/images/10-0.jpg "0024 Completely open terrain with a smooth surface, e.g. concrete runways in airports, mowed grass, etc. 1 0.03 Open agricultural area without fences and hedgerows and very scattered buildings.")
10 Roughness classes and roughness lengths (European wind atlas) Roughness class Roughness length Z 0 [m] Landscape type Water surface Completely open terrain with a smooth surface, e.g. concrete runways in airports, mowed grass, etc Open agricultural area without fences and hedgerows and very scattered buildings. Only softly rounded hills Agricultural land with some houses and 8 meters tall sheltering hedgerows with a distance of approx meters Agricultural land with some houses and 8 meters tall sheltering hedgerows with a distance of approx. 500 meters Agricultural land with many houses, shrubs and plants, or 8 metre tall sheltering hedgerows with a distance of approx. 250 meters Villages, small towns, agricultural land with many or tall sheltering hedgerows, forests and very rough and uneven terrain Larger cities with tall buildings Very large cities with tall buildings and skyscrapers 19 Calculating wind speed at different heights h 2 ln( h 2) 2 = 1 0 h 1 ln( ) 0 h 1 Where: h 1 : height [m] h 2 : height [m] v 1 : wind speed at h 1 [m/s] v 2 : wind speed at h 2 [m/s] z 0 : roughness length [m] 20
11 Sample wind speeds at different heights Wind speed increases with height above ground Profile depends on surface properties (roughness length, Z 0 ) 21 Site specific wind resource assessment for wind farm planning To calculate the annual energy production of a wind turbine the distribution of wind speeds is needed. It can be approximated by a Weibull equation with parameters A and K) h w (v) The distribution of wind directions is important for the siting of wind turbines in a wind farm. The wind rose shows probability of a wind from a certain sector. Wind speed distributions are measured for different wind direction sectors. 22
12 Weibull values at 50m, Canada** Period Mean Wind Speed Wind Power density Weibull shape parameter (k) Weibull scale parameter (A) Annual 9.22 m/s 831 W/m m/s Winter (DJF) m/s 1119W/m m/s Spring (MAM) 9.03 m/s 762 W/m m/s Summer (JJA) 7.86 m/s 473 W/m m/s Fall (SON) 9.44 m/s 827 W/m m/s **) Location: latitude = , longitude = Source:, 23 Weibull equation factors for different regions For regions with similar topography the k factors are also similar 1.2 < k < 1.7 Mountains 1.8 < k < 2.5 Typical North America and Europe 2.5 < k < 3.0 Where topography increases wind speeds 3.0 < k < 4.0 Winds in monsoon regions Scaling factor A is related to mean wind speed ( v avg ~ 0,8 0,9 A) Relation of mean wind v avg, k und A (mean wind v avg, calculation) Warning: Only rough values! On site monitoring is necessary! Source: J.liersch; KeyWindEnergy,


13 Wind measurements Synop measurements of meteorological stations at 10m above ground are often of limited accuracy and use for wind energy applications Dedicated 50m masts with at least 3 sensors at different heights are much more expensive but much better suited to derive data for wind energy. Most such measurements are operated privately and data may not be accessible. 25 Wind Atlas based on modeling A suitable number of high quality measurements is characterized for its local effects The measurements are combined into an atlas Sample: 3TIER s Global Wind Dataset 5km onshore wind speed at 80m height units in m/s Limitations for complex terrain and costal zones Map: IRENA Global Atlas; Data: 3TIER s Global Wind Dataset 26
14 Power of wind P = ½ x ρ x A x v 3 P = power of wind (Watt) ρ = air density (kg/m 3 ; kilogram per cubic meter) A = area (m 2 ; square meter) v = wind speed (m/s; meter per second) 27 Quick exercise: doubling of wind speed Let's double the wind speed and calculate what happens to the power of the swept rotor area. Assume length of rotor blades (radius) 25 m and air density kg/m^3). wind speed = 5 m wind speed = 10 m 28
15 Solution: doubling of wind speed Power of swept rotor calculated with 25 m rotor radius and kg/m^3 air density wind speed = 5 m/s wind speed = 10 m/s power = 150 kw power = 1200 kw Doubling of wind speed increases power by factor 8. Calculation: Power =0,5 * air density * (wind speed)^3 * blade length^2 * Power = 0,5 * 1,225 kg/m^3 * 5^3 m^3/s^3 * 25^2 m^2 * = 150 kw Power = 0,5 * 1,225 kg/m^3 * 10^3 m^3/s^3 * 25^2 m^2 * = kw Units:[kg/m^3 * ^3 m^3/s^3 * m^2 = Joule/s = W] SPATIAL SETUP OF WIND FARMS 30
 75 m blade, Siemens (year 2012) 60 m blade, Enercon (year 2008) 83.")
![5 m blade, Samsung (year 2014) 31 Swept area by rotor blades A = π x (½ D) ² A= swept rotor area [m] ² D = rotor diameter [m] π = 3.](/docs-images/95/125365595/images/16-1.jpg "1415 The power output of a wind turbine is directly related to the area swept by the rotor blades.")
16 Development wind turbine rotor diameter and hub height 81.6 m blade, Mitsubishi 80 m blade, Vestas (year 2013) 75 m blade, Siemens (year 2012) 60 m blade, Enercon (year 2008) 83.5 m blade, Samsung (year 2014) 31 Swept area by rotor blades A = π x (½ D) ² A= swept rotor area [m] ² D = rotor diameter [m] π = The power output of a wind turbine is directly related to the area swept by the rotor blades. The larger the diameter of its rotor blades, the more power the wind turbine can extract from the wind. The swept area is also called the 'capture area'. D The rotor diameter of most wind turbines is listed in specification sheets. 32


17 Wake effect Clouds form in the wake of the front row of wind turbines at the Horns Rev offshore wind farm in the North Sea Back-row wind turbines losing power relative to the front row Source: -leave-clouds-and-energy-inefficiency-their-wake Distance between turbines to reduce wake effects 5 rotor diameters Legend: Predominant wind direction 7 rotor diameters Position of wind turbine to be installed One rotor diameter in order to determine best position to install the desired wind turbines 34
18 Generator capacity, W Rotor diameter, m Specific capacity, W/m^2 Wind turbine manufacturer SIEMENS SWT 2, Nordex N100/ Vestas V90-2MW REPOWER 3,2M Vestas V126-3MW Nordex N100/ REPOWER MD SIEMENS SWT 2, Enercon E82-2, Enercon E82-3,0 35 Specific power of today s wind turbines (generator capacity devided by sweapt rotor area) Source: Molly,
19 Wind power capacity and annual energy generation estimation for an area e.g. with 25 km² Rated power of wind turbine, MW ,5 2,35 2,3 3 Rotor diameter of wind turbine, m Specific rated power per swept rotor area (W/m^2) Specific wind power capacity per land area, MW/ km^2; ***) ,40 5,40 7,05 7,14 7,93 9,77 12,75 Number of turbines in the area Installed wind power capacity, MW Annual energy production with capacity factor of 0,35; GWh/a ***) Assumptions: distance between wind turbines standing in main wind direction:7 rotor diameter; and standing in in rarely ocurring perpendicular wind direction: 5 times the rotor diameter Source: RENAC calculation ESTIMATING WIND ELECTRICITY YIELD 38
20 What needs to be done 1. Define a representative mix of suitable turbines (potenitally site-specific). 2. Get power curve information for all turbine types. 3. Extrapollate average wind speeds to applicable hub heights. 4. Choose the wind speed distribution curve which is most likely at given sites(s). 5. Calculate wind speed distributions for given hub heights. 6. Use wind speed distributions and power curves to calclulate representative wind energy yield(s). 39 Calculation scheme for wind energy yield using wind speed distributions and power curves E i = Annual energy yield of wind class [Wh, watthours], i = 1, 2, 3 n t i = duration of wind speeds at wind class [h/a, hours/year] P i (v i ) = Power of wind class v i of wind turbine power curve [Watt] v i = wind class [m/s] PN = Nominal power of WEC [kw] at nominal wind class v i [m/s] h i = relative wind class frequency in % 40 Source: J.liersch; KeyWindEnergy, 2009

21 Calculation scheme for annual energy production E i = P i (v i ) * t i E Σ = E 1 + E E n E Σ = Energy yield over one year J.liersch; KeyWindEnergy, Shape of different wind speed distributions Weibull distribution: shape factor k=1,25 and A= 8 m/s Weibull distribution: shape factor k=3 and A= 8 m/s 42
22 Sample power curves of wind turbines (82 m rotor diameter, 2 and 3 MW) Source: Enercon product information Worked example 6. ESTIMATING WIND CAPACITY AND YIELD AT A GIVEN SITE 44
 Retrieve average")


23 Wind energy yield estimation near Arusha Steps performed: 1) Retrieve average wind speed data from Global Atlas 2) Estimate electricity yield of one wind turbine 3) Estimate wind power capacity and potential wind energy per km² at given location 45 Retrieving average wind speed Average wind speed 7.2 m/s at 80 m height 46
24 Extrapolation to hub height Wind data provided for height: h 1 = 80 m Let s choose hub height: h 2 = 90 m Roughness length: z 0 = 0.1m h 2 h 1 Result: v 2 = 7.3 m/s Rough - ness class Roughness length Z 0 [m] Landscape type Agricultural land with some houses and 8 meters tall sheltering hedgerows with a distance of approx. 500 meters 2 = 1 ln( h 2 0 ) ln( h 1 0 ) Where: h 1 : height [m] h 2 : height [m] v 1 : wind speed at h 1 [m/s] v 2 : wind speed at h 2 [m/s] z 0 : roughness length [m] 47 Estimating wind speed distribution Deriving Weibull distribution Average wind speed: Assumption: monsoon climate k = 3.5 v 2 = v avg = 7.2 m/s Scaling factor: v avg = 0.9 * A A = v avg / 0.9 A = (v avg / 0.9) = (7.3 m/s) / 0.9 = 8.11 m/s 48
25 Resulting wind distribution number of Weibull probability hours at v i m/s v i (m/s) (%) per year , , , , E E Choosing the wind turbine We choose enercon E E v i (m/s) Output power of E , (kw)

26 Calculate power output per wind speed class v i (m/s) number of Output hours at v i power of m/s per E , year (kw) E , annual energy yield, (kwh/a) , , , , , , , , ,147, , ,371, ,283, , , , , , v=7.0 m/s: 1,439.5 h/a * 532 kw = 765,811 kwh/a Total energy: Summation over all wind classes = MWh/a 51 Estimating capacity per km² Rotor diameter d=82 m Distance d 1 primary wind direction: 7 rotor diameters = 7 * 82 m = 574 m Distance d 2 secondary wind direction: 5 rotor diameters = 5 * 82 m = 410 m Area needed for one turbine: 574 m * 410 m = 235,340 m² = 0.24 km² Capacity per km²: 2 MW/0.24 km² = 8.3 MW/km² 52
27 Estimating energy per km² and capacity factor Capacity per km²: 2 MW/0.24 km² = 8.3 MW/km² Energy generation per wind turbine: 6,603 MWh per turbine (E ) with 2 MW rated capacity, OR: 6,603 MWh / 2 MW 3,302 MWh / 1 MW Energy generated per km²: 3,302 MWh/MW * 8.3 MW/km² = 27,4 GWh/km²/a Capacity Factor: 3,302 MWh / 1 MW = 3,302 h 3,302 h / 8,760 h = 37.7% 53 Please remember The previous worked example is only a rough estimate and results are only true for the given assumptions (specific site, one turbine type, wind distribution assumptions, etc.) The calculated energy yield should be considered as ideal result. In real-life power output is likely to be slightly below these values due to downtimes (maintenance, grid outages), cabling and transformation losses, deviation from ideal distribution of wind turbines on the given site, etc. 54
28 Site assessment (wind atlas data, wind speed (m/s) for certain height (m)) Exclusion of non-suitable land areas and adding of buffer zones Nature protected area Areas technically not suitable (high slope and above certain altitude, etc.) done Transport, supply and communication infrastructure Urban area (buffer zone: 8 10 hub height) Landscape, historic area, other nonusable land (glaciers, rivers, etc.) Areas potentially suitable for wind farms (km 2 ) Economic assessment Areas potentially suitable for wind farms (km 2 ) Wind speed extrapolation to turbine hub height Hub height (m) done Roughness length or wind shear exponent Wind speed at hub height (m/s) Energy output calculation Power curve, wind turbine density (W/km 2 ), air density done Weibull distribution (k, A) Electrical losses (%) Annual energy prod. (Wh/a/km 2 ) Wind capacity per area (W/km 2 ) Priority areas for wind power (km 2 ), potentially installed capacity (W), potentially generated energy (Wh/a) and costs Energy generation costs at specific site ( /Wh) Energy policy analysis Economic parameters (wind farm and grid connection) pendin ng CAPEX OPEX WACC Life time CAPEX = Capacity expenditu ure, OPEX = Operation expenditure, WACC = Weigh hted average cost of capital (depth, equity) RENAC Thank you very much for your attention! Jens Altevogt Renewables Academy (RENAC) Phone altevogt@renac.de
Session 2: Wind power spatial planning techniques
 Session 2: Wind power spatial planning techniques IRENA Global Atlas Spatial planning techniques 2-day seminar Central questions we want to answer After having identified those areas which are potentially
Session 2a: Wind power spatial planning techniques. IRENA Global Atlas Spatial planning techniques 2-day seminar
 Session 2a: Wind power spatial planning techniques IRENA Global Atlas Spatial planning techniques 2-day seminar Central questions we want to answer After having identified those areas which are potentially
The Wind Resource: Prospecting for Good Sites
 The Wind Resource: Prospecting for Good Sites Bruce Bailey, President AWS Truewind, LLC 255 Fuller Road Albany, NY 12203 bbailey@awstruewind.com Talk Topics Causes of Wind Resource Impacts on Project Viability
WIND SHEAR, ROUGHNESS CLASSES AND TURBINE ENERGY PRODUCTION
 WIND SHEAR, ROUGHNESS CLASSES AND TURBINE ENERGY PRODUCTION M. Ragheb /18/17 INTRODUCTION At a height of about 1 kilometer the wind is barely affected by the surface of the Earth. In the lower atmospheric
Wind Resource Assessment for FALSE PASS, ALASKA Site # 2399 Date last modified: 7/20/2005 Prepared by: Mia Devine
 813 W. Northern Lights Blvd. Anchorage, AK 99503 Phone: 907-269-3000 Fax: 907-269-3044 www.aidea.org/wind.htm Wind Resource Assessment for FALSE PASS, ALASKA Site # 2399 Date last modified: 7/20/2005 Prepared
Outline. Wind Turbine Siting. Roughness. Wind Farm Design 4/7/2015
 Wind Turbine Siting Andrew Kusiak 2139 Seamans Center Iowa City, Iowa 52242-1527 andrew-kusiak@uiowa.edu Tel: 319-335-5934 Fax: 319-335-5669 http://www.icaen.uiowa.edu/~ankusiak Terrain roughness Escarpments
Sustainable Energy Science and Engineering Center. Wind Energy
 Wind Energy References Chapter 15 - Text Book Wind Energy, Explained by J.F. Manwell, J.G. McGowan and A.L. Rogers, John Wiley, 2002. Wind Energy Hand Book, T. Burton, D. Sharpe, N. Jenkins and E. Bossanyi,
Wind Resource Assessment for NOME (ANVIL MOUNTAIN), ALASKA Date last modified: 5/22/06 Compiled by: Cliff Dolchok
, ALASKA Date last modified: 5/22/06 Compiled by: Cliff Dolchok") 813 W. Northern Lights Blvd. Anchorage, AK 99503 Phone: 907-269-3000 Fax: 907-269-3044 www.akenergyauthority.org SITE SUMMARY Wind Resource Assessment for NOME (ANVIL MOUNTAIN), ALASKA Date last modified:
813 W. Northern Lights Blvd. Anchorage, AK 99503 Phone: 907-269-3000 Fax: 907-269-3044 www.akenergyauthority.org SITE SUMMARY Wind Resource Assessment for NOME (ANVIL MOUNTAIN), ALASKA Date last modified:
Chapter 2 Wind: Origin and Local Effects
 Chapter 2 Wind: Origin and Local Effects All renewable energy (except tidal and geothermal power), and even the energy in fossil fuels, ultimately comes from the sun. About 1 2 % of the energy coming from
Wind Resource Assessment for DEADHORSE, ALASKA
 813 W. Northern Lights Blvd. Anchorage, AK 99503 Phone: 907-269-3000 Fax: 907-269-3044 www.akenergyauthority.org Wind Resource Assessment for DEADHORSE, ALASKA Date last modified: 4/18/2006 Compiled by:
Wind Project Siting & Resource Assessment
 Wind Project Siting & Resource Assessment David DeLuca, Project Manager AWS Truewind, LLC 463 New Karner Road Albany, NY 12205 ddeluca@awstruewind.com www.awstruewind.com AWS Truewind - Overview Industry
Fontes Renováveis Não-Convencionais. Parte II
 Fontes Renováveis Não-Convencionais Parte II Prof. Antonio Simões Costa Prof. Tom Overbye, U. of Illinois Power in the Wind Consider the kinetic energy of a packet of air with mass m moving at velocity
Wind Resource Assessment for SAINT PAUL, ALASKA
 813 W. Northern Lights Blvd. Anchorage, AK 99503 Phone: 907-269-3000 Fax: 907-269-3044 www.akenergyauthority.org Wind Resource Assessment for SAINT PAUL, ALASKA Date last modified: 3/1/2006 Compiled by:
WIND DATA ANALYSIS AND WIND FLOW SIMULATION OVER LARGE AREAS
 Mathematical Modelling in Civil Engineering Vol. 10 No. 1 2014 Doi: 10.2478/mmce 2014 0005 WIND DATA ANALYSIS AND WIND FLOW SIMULATION OVER LARGE AREAS ANGEL TERZIEV- Lecturer, Assoc. Prof., PhD, Technical
RESOURCE DECREASE BY LARGE SCALE WIND FARMING
 ECN-RX--4-14 RESOURCE DECREASE BY LARGE SCALE WIND FARMING G.P. Corten A.J. Brand This paper has been presented at the European Wind Energy Conference, London, -5 November, 4 NOVEMBER 4 Resource Decrease
III. Wind Energy CHE 443 III. Wind Energy
 WIND ENERGY Wind energy is the kinetic energy of air moving from one place to another in the form of wind. Wind is created as the results of uneven heating of the earth by the sun: Warm air rises leaving
Wind Resource Assessment for CHEFORNAK, ALASKA
 813 W. Northern Lights Blvd. Anchorage, AK 99503 Phone: 907-269-3000 Fax: 907-269-3044 www.akenergyauthority.org Wind Resource Assessment for CHEFORNAK, ALASKA Date last modified: 3/15/2006 Compiled by:
Wind Project Siting and Permitting Blaine Loos
 Wind Project Siting and Permitting Blaine Loos Energy Project Analyst Center for Wind Energy at James Madison University Wind Project Siting and Permitting The Energy in Wind Resource Assessment (Macro-siting)
Wind Regimes 1. 1 Wind Regimes
 Wind Regimes 1 1 Wind Regimes The proper design of a wind turbine for a site requires an accurate characterization of the wind at the site where it will operate. This requires an understanding of the sources
Wind Resource Assessment for KING SALMON, ALASKA
 813 W. Northern Lights Blvd. Anchorage, AK 99503 Phone: 907-269-3000 Fax: 907-269-3044 www.akenergyauthority.org Wind Resource Assessment for KING SALMON, ALASKA Date last modified: 4/14/2006 Compiled
Wind resource assessment over a complex terrain covered by forest using CFD simulations of neutral atmospheric boundary layer with OpenFOAM
 Wind resource assessment over a complex terrain covered by forest using CFD simulations of neutral atmospheric boundary layer with OpenFOAM Nikolaos Stergiannis nstergiannis.com nikolaos.stergiannis@vub.ac.be
Inuvik Wind Monitoring Update 2016
 Inuvik Wind Monitoring Update 2016 Source: MACA Prepared for By Jean Paul Pinard, P. Eng., PhD. 703 Wheeler St., Whitehorse, Yukon Y1A 2P6 Tel. (867) 336 2977; Email jpp@northwestel.net March 31, 2016
Wind Farm Power Performance Test, in the scope of the IEC
 Wind Farm Power Performance Test, in the scope of the IEC 61400-12.3 Helder Carvalho 1 (helder.carvalho@megajoule.pt) Miguel Gaião 2 (miguel.gaiao@edp.pt) Ricardo Guedes 1 (ricardo.guedes@megajoule.pt)
Computational Fluid Dynamics
 Computational Fluid Dynamics A better understanding of wind conditions across the whole turbine rotor INTRODUCTION If you are involved in onshore wind you have probably come across the term CFD before
Site Assessment Report. Wind farm: Ascog Farm (GB)
") Site Assessment Report Energy Yield Estimation Wind farm: (GB) 3 x E- kw with 5m hh Imprint Publisher Copyright notice ENERCON GmbH 5 Aurich Germany Phone: +9 91 97- Fax: +9 91 97-19 E-mail: info@enercon.de
Site Assessment Report Energy Yield Estimation Wind farm: (GB) 3 x E- kw with 5m hh Imprint Publisher Copyright notice ENERCON GmbH 5 Aurich Germany Phone: +9 91 97- Fax: +9 91 97-19 E-mail: info@enercon.de
HOUTEN WIND FARM WIND RESOURCE ASSESSMENT
 CIRCE CIRCE Building Campus Río Ebro University de Zaragoza Mariano Esquillor Gómez, 15 50018 Zaragoza Tel.: 976 761 863 Fax: 976 732 078 www.fcirce.es HOUTEN WIND FARM WIND RESOURCE ASSESSMENT CIRCE AIRE
Exploring Wind Energy
 2013-2014 Exploring Wind Energy Student Guide SECONDARY Introduction to Wind What is Wind? Wind is simply air in motion. It is produced by the uneven heating of the Earth s surface by energy from the sun.
Kodiak, Alaska Site 1 Wind Resource Report for Kodiak Electric Association
 Kodiak, Alaska Site 1 Wind Resource Report for Kodiak Electric Association Report written by: Douglas Vaught, V3 Energy LLC, Eagle River, AK Date of report: August 23, 2006 Photo Doug Vaught General Site
Dick Bowdler Acoustic Consultant
 Dick Bowdler Acoustic Consultant 01383 882 644 077 8535 2534 dick@dickbowdler.co.uk WIND SHEAR AND ITS EFFECT ON NOISE ASSESSMENT OF WIND TURBINES June 2009 The Haven, Low Causeway, Culross, Fife. KY12
Power curves - use of spinner anemometry. Troels Friis Pedersen DTU Wind Energy Professor
 Power curves - use of spinner anemometry Troels Friis Pedersen DTU Wind Energy Professor Spinner anemometry using the airflow over the spinner to measure wind speed, yaw misalignment and flow inclination
Bankable Wind Resource Assessment
 Bankable Wind Resource Assessment Bankable Wind Resource Assessment 1.800.580.3765 WWW.TTECI.COM Pramod Jain, Ph.D. Presented to: DFCC Bank and RERED Consortia Members January 25 27, 2011 Colombo, Sri
Energy Output. Outline. Characterizing Wind Variability. Characterizing Wind Variability 3/7/2015. for Wind Power Management
 Energy Output for Wind Power Management Spring 215 Variability in wind Distribution plotting Mean power of the wind Betz' law Power density Power curves The power coefficient Calculator guide The power
Increased Project Bankability : Thailand's First Ground-Based LiDAR Wind Measurement Campaign
 Increased Project Bankability : Thailand's First Ground-Based LiDAR Wind Measurement Campaign Authors: Velmurugan. k, Durga Bhavani, Ram kumar. B, Karim Fahssis As wind turbines size continue to grow with
WindPRO version Nov 2012 Project:
 23/11/2012 15:21 / 1 WAsP interface - Main Result Calculation: WAsP Interface example Name for WAsP Site coordinates UTM NAD27 Zone: 14 East: 451,101 North: 5,110,347 Air density calculation mode Result
Wind Energy Resource and Technologies
 Wind Energy Resource and Technologies Dr. Ram Chandra DBT s Energy Bioscience Overseas Fellow Centre for Rural Development and Technology Indian Institute of Technology Delhi Hauz Khas, New Delhi 110 016
WIND RESOURCE ASSESSMENT FOR THE STATE OF WYOMING
 WIND RESOURCE ASSESSMENT FOR THE STATE OF WYOMING Performed by Sriganesh Ananthanarayanan under the guidance of Dr. Jonathan Naughton, Professor, Department of Mechanical Engineering University of Wyoming,
Wind Resource Assesment and Turbine Selection: Case Study for Mannar, Sri Lanka
 Wind Resource Assesment and Turbine Selection: Case Study for Mannar, Sri Lanka K.M.T.Kalpage, K.R.D. Peiris, K.A.I.R.P.Perera, M.G.C.I. Siriwardana, N.W.A. Lidula Department of Electrical Engineering
Tidal influence on offshore and coastal wind resource predictions at North Sea. Barbara Jimenez 1,2, Bernhard Lange 3, and Detlev Heinemann 1.
 Tidal influence on offshore and coastal wind resource predictions at North Sea Barbara Jimenez 1,2, Bernhard Lange 3, and Detlev Heinemann 1. 1 ForWind - Center for Wind Energy Research, University of
Lopez Community Land Trust. Final Wind Energy Report
 Lopez Community Land Trust Final Wind Energy Report July 20th, 2007 Prepared by: Terrance Meyer P.E. Rose Woofenden 1 Table of Contents 1.0 INTRODUCTION 4 FIGURE 1.1 VESTAS TURBINE AT HULL, MA PROJECT
Scoping analysis of the potential yield of the Hollandse Kust (noord) wind farm and the influence on the existing wind farms in the proximity
 wind farm and the influence on the existing wind farms in the proximity") Scoping analysis of the potential yield of the Hollandse Kust (noord) wind farm and the influence on the existing wind farms in the proximity B.H. Bulder E.T.G. Bot G. Bedon April 2018 ECN-E--18-033 Executive
Scoping analysis of the potential yield of the Hollandse Kust (noord) wind farm and the influence on the existing wind farms in the proximity B.H. Bulder E.T.G. Bot G. Bedon April 2018 ECN-E--18-033 Executive
Terms and Definitions for Small Wind Site Assessor
 Terms and Definitions for Small Wind Site Assessor AEO/ AEP: Annual energy output, also known as AEP, annual energy production of the wind electric system. Alpha: Surface friction coefficient, used to
WindProspector TM Lockheed Martin Corporation
 WindProspector TM www.lockheedmartin.com/windprospector 2013 Lockheed Martin Corporation WindProspector Unparalleled Wind Resource Assessment Industry Challenge Wind resource assessment meteorologists
Wind Power. Kevin Clifford METR 112 April 19, 2011
 Wind Power Kevin Clifford METR 112 April 19, 2011 Outline Introduction Wind Turbines Determining Wind Power Output The Price of Wind Power Wind Power Availability across the World and US California Wind
Workshop Session 1: Resources, technology, performance
 IBC 3rd Annual Wind Energy Conference Adelaide February 2004 Workshop Session 1: Resources, technology, performance Iain MacGill and Hugh Outhred School of Electrical Engineering and Telecommunications
Buckland Wind Resource Report
 Buckland Wind Resource Report By: Douglas Vaught, P.E., V3 Energy LLC, Eagle River, Alaska Date: September 17, 2010 Buckland met tower; D. Vaught photo Contents Summary... 2 Test Site Location... 2 Photographs...
windnavigator Site Analyst Report
 windnavigator Site Analyst Report for Central NY Created for Stephen Meister April 27, 2010 ID NUMBER: N2-128 AWS Truepower, LLC Albany - Barcelona - Bangalore p: +1.518.21.00 e: info@awstruepower.com
Torrild - WindSIM Case study
 Torrild - WindSIM Case study Note: This study differs from the other case studies in format, while here another model; WindSIM is tested as alternative to the WAsP model. Therefore this case should be
Influence of the Number of Blades on the Mechanical Power Curve of Wind Turbines
 European Association for the Development of Renewable Energies, Environment and Power quality International Conference on Renewable Energies and Power Quality (ICREPQ 9) Valencia (Spain), 15th to 17th
Wind Power Potential Assessment of Complex Terrain at RGPV Hill Top
 IJIRST International Journal for Innovative Research in Science & Technology Volume 1 Issue 10 March 2015 ISSN (online): 2349-6010 Wind Power Potential Assessment of Complex Terrain at RGPV Hill Top Syed
Comparison of flow models
 Comparison of flow models Rémi Gandoin (remga@dongenergy.dk) March 21st, 2011 Agenda 1. Presentation of DONG Energy 2. Today's presentation 1. Introduction 2. Purpose 3. Methods 4. Results 3. Discussion
Stefan Emeis
 The Physics of Wind Park Optimization Stefan Emeis stefan.emeis@kit.edu INSTITUTE OF METEOROLOGY AND CLIMATE RESEARCH, Photo: Vattenfall/C. Steiness KIT University of the State of Baden-Wuerttemberg and
Site Description: LOCATION DETAILS Report Prepared By: Tower Site Report Date
 Wind Resource Summary for Holyoke Site Final Report Colorado Anemometer Loan Program Monitoring Period:: 6/21/26 /6/27 Report Date: December 2, 27 Site Description: The site is 17.4 miles south of the
Farm Energy IQ. Farms Today Securing Our Energy Future. Wind Energy on Farms
 Farm Energy IQ Farms Today Securing Our Energy Future Wind Energy on Farms Farm Energy IQ Wind Energy on Farms Ed Johnstonbaugh, Penn State Extension Objectives of this Module At the conclusion of this
Site Summary. Wind Resource Summary. Wind Resource Assessment For King Cove Date Last Modified: 8/6/2013 By: Rich Stromberg & Holly Ganser
 Site Summary Wind Resource Assessment For King Cove Date Last Modified: 8/6/2013 By: Rich Stromberg & Holly Ganser Station ID: 2857 Latitude: 55 7 45.8 N Longitude: 162 16 10.6 W Tower Type: 30 m NRG Tall
3D Nacelle Mounted Lidar in Complex Terrain
 ENERGY 3D Nacelle Mounted Lidar in Complex Terrain PCWG Hamburg, Germany Paul Lawson 25.03.2015 1 DNV GL 125.03.2015 SAFER, SMARTER, GREENER Agenda Introduction and Project Background Lidar Specifications
Wind farm performance
 Wind farm performance Ali Marjan Wind Energy Submission date: June 2016 Supervisor: Lars Sætran, EPT Norwegian University of Science and Technology Department of Energy and Process Engineering Wind
PROJECT CYCLOPS: THE WAY FORWARD IN POWER CURVE MEASUREMENTS?
 Title Authors: Organisation PROJECT CYCLOPS: THE WAY FORWARD IN POWER CURVE MEASUREMENTS? Simon Feeney(1), Alan Derrick(1), Alastair Oram(1), Iain Campbell(1), Gail Hutton(1), Greg Powles(1), Chris Slinger(2),
Valerijs Bezrukovs, Vladislavs Bezrukovs Ventspils University College Latvia. WREF2012 Denver, CO May 13-17, 2012
 Valerijs Bezrukovs, Vladislavs Bezrukovs Ventspils University College Latvia WREF2012 Denver, CO May 13-17, 2012 Baltic countries 2 Currently rise of WPP development in Baltic countries. Attractive for
LES* IS MORE! * L ARGE E DDY S IMULATIONS BY VORTEX. WindEnergy Hamburg 2016
 LES* IS MORE! * L ARGE E DDY S IMULATIONS BY VORTEX WindEnergy Hamburg 2016 OUTLINE MOTIVATION Pep Moreno. CEO, BASIS Alex Montornés. Modelling Specialist, VALIDATION Mark Žagar. Modelling Specialist,
Chapter: Atmosphere Section 3: Air Movement
 Table of Contents Chapter: Atmosphere Section 3: Air Movement We will learn about: -Air Movement=Wind -Why different latitudes on Earth will receive different amounts of Solar Energy -The Coriolis Effect
ESB Ocean Energy Projects
 MRIA, February 2013 ESB Ocean Energy Projects Opportunities in an All-Islands Market John Fitzgerald ESB Ocean Energy Developing new lines of business for ESB and Ireland 200M Cleantech Fund Home Energy
Validation of Measurements from a ZephIR Lidar
 Validation of Measurements from a ZephIR Lidar Peter Argyle, Simon Watson CREST, Loughborough University, Loughborough, United Kingdom p.argyle@lboro.ac.uk INTRODUCTION Wind farm construction projects
Site Description: Tower Site
 Wind Resource Summary for Elizabeth Site Final Report Colorado Anemometer Loan Program Monitoring Period: 7/3/6 /15/7 Report Date: December 22, 7 Site Description: The site is.6 miles northeast of the
Wind Projects: Optimizing Site Selection
 Wind Projects: Optimizing Site Selection ECOWAS Regional Workshop on Wind Energy Babul Patel, Principal Alain Rosier, Vice President Nexant, Inc. Praia, Cape Verde November 4-5, 2013 Basic Criteria for
Rural Small Wind Energy:
 Rural Small Wind Energy: Resource Overview and System Components Phil Hofmeyer, Ph.D. Asst. Professor of Renewable Energy Morrisville State College MVCC Small Wind Energy Conference June 27, 2009 Hi, I
On the use of rotor equivalent wind speed to improve CFD wind resource mapping. Yavor V. Hristov, PhD Plant Performance and Modeling Vestas TSS
 On the use of rotor equivalent wind speed to improve CFD wind resource mapping Yavor V. Hristov, PhD Plant Performance and Modeling Vestas TSS Firestorm- Number 53 on Top500 list from June 2011 14664 processors
Conditions for Offshore Wind Energy Use
 Carl von Ossietzky Universität Oldenburg Institute of Physics Energy Meteorology Group Detlev Heinemann Conditions for Offshore Wind Energy Use Detlev Heinemann ForWind Carl von Ossietzky Universität Oldenburg
Flow modelling hills complex terrain and other issues
 Flow modelling hills, complex terrain and other issues Modelling approaches sorted after complexity Rules of thumbs Codes and standards Linear model, 1 st order turbulence closure LINCOM/Wasp Reynolds-averaged
LiDAR Application to resource assessment and turbine control
 ENERGY LiDAR Application to resource assessment and turbine control Dr. Avishek Kumar The New Zealand Wind Energy Conference 13 th April 2016 1 SAFER, SMARTER, GREENER Agenda What is LiDAR? Remote Sensing
renewable energy projects by renewable energy people
 renewable energy projects by renewable energy people Our Services Full lifecycle services across renewable energy sectors 2 Time variant energy yield analysis A case study Presenter: Daniel Marmander Date:
Wake effects at Horns Rev and their influence on energy production. Kraftværksvej 53 Frederiksborgvej 399. Ph.: Ph.
 Wake effects at Horns Rev and their influence on energy production Martin Méchali (1)(*), Rebecca Barthelmie (2), Sten Frandsen (2), Leo Jensen (1), Pierre-Elouan Réthoré (2) (1) Elsam Engineering (EE)
Energy Procedia 00 (2013) International Conference on Alternative Energy in Developing Countries and Emerging Economies
 International Conference on Alternative Energy in Developing Countries and Emerging Economies") Energy Procedia 00 (2013) 000 000 Energy Procedia www.elsevier.com/locate/procedia 2013 International Conference on Alternative Energy in Developing Countries and Emerging Economies Wind Energy Projection
Energy Procedia 00 (2013) 000 000 Energy Procedia www.elsevier.com/locate/procedia 2013 International Conference on Alternative Energy in Developing Countries and Emerging Economies Wind Energy Projection
Expertise, Innovation and reduction of cost of energy: Vestas experience
 Expertise, Innovation and reduction of cost of energy: Vestas experience Nicolas Wolff, VP General Manager Vestas France Conference on Cost of Wind Energy, Embassy of Germany in Paris 15 November 2012
Full Classification acc. to IEC for SoDAR AQ510 Wind Finder. Vincent Camier, Managing Director, Ammonit Measurement GmbH
 Full Classification acc. to IEC 61400-12-1 for SoDAR AQ510 Wind Finder Vincent Camier, Managing Director, Ammonit Measurement GmbH Ammonit Company Profile German company, based in Berlin +25 years of know-how
That is why. April 24, 2008
 That is why Page 1 Our Vision: Wind, Oil and Gas Page 2 Our Product R&D and manufacture Assembly and testing Sales and planning Transport Installation Maintenance A 100% focused value chain Producing turbines
McKnight's Physical Geography 11e
 Chapter 2 Lecture McKnight's Physical Geography 11e Lectures Chapter 5 Atmospheric Pressure and Wind Michael Commons Ohio Northern University Atmospheric Pressure and Wind The Nature of Atmospheric Pressure
Air Pressure and Wind
 Air Pressure and Wind 19.1 Understanding Air Pressure Air Pressure Defined Air pressure is the pressure exerted by the weight of air. Air pressure is exerted in all directions down, up, and sideways. The
Kake, Alaska Wind Resource Report
 Kake, Alaska Wind Resource Report Kake met tower, photo provided by SEACC January 6, 2012 Douglas Vaught, P.E. V3 Energy, LLC Eagle River, Alaska Kake, Alaska Met Tower Wind Resource Report Page 2 Project
Yellowknife Area Wind Potential
 Yellowknife Area Wind Potential Prepared for by Jean-Paul Pinard, P. Eng., PhD. 703 Wheeler St., Whitehorse, Yukon Y1A 2P6 Tel. (867) 336-2977; Email jpp@northwestel.net, and Annika Trimble (Ed.), Aurora
Wind Speed and Energy at Different Heights on the Latvian Coast of the Baltic Sea
 J. Energy Power Sources Vol. 1, No. 2, 2014, pp. 106-113 Received: July 1, 2014, Published: August 30, 2014 Journal of Energy and Power Sources www.ethanpublishing.com Wind Speed and Energy at Different
Wind Turbines. Figure 1. Wind farm (by BC Hydro)
") Wind Turbines Figure 1. Wind farm (by BC Hydro) Purpose Observe the operation of a wind turbine at different wind speeds Contextualize the size of an industrial wind turbine Introduction and Theory Humans
Wind Turbines Figure 1. Wind farm (by BC Hydro) Purpose Observe the operation of a wind turbine at different wind speeds Contextualize the size of an industrial wind turbine Introduction and Theory Humans
Wind Farm Blockage: Searching for Suitable Validation Data
 ENERGY Wind Farm Blockage: Searching for Suitable Validation Data James Bleeg, Mark Purcell, Renzo Ruisi, and Elizabeth Traiger 09 April 2018 1 DNV GL 2014 09 April 2018 SAFER, SMARTER, GREENER Wind turbine
VERTICALLY AND HORIZONTALLY MOUNTED WIND MILLS. Wind Energy Production in Tampere University of Applied Sciences
 VERTICALLY AND HORIZONTALLY MOUNTED WIND MILLS Wind Energy Production in Tampere University of Applied Sciences Ekaterina Evdokimova Bachelor s thesis May 2013 Degree Programme in Environmental Engineering
Criteria for wind farm noise: Lmax and Lden
 Criteria for wind farm noise: Lmax and Lden F. Van Den Berg University of Groningen - Science & Society Group, Nijenborgh 4, 9747AG Groningen, Netherlands fvdberg@ggd.amsterdam.nl 4043 Wind turbine noise
V MW. Exceptional performance and reliability at high-wind-speed sites. vestas.com
 V90-3.0 MW Exceptional performance and reliability at high-wind-speed sites vestas.com We deliver on the promise of wind power SUPERIOR YIELD AT HIGH-WIND-SPEED SITES High standards for weight and performance
AN ISOLATED SMALL WIND TURBINE EMULATOR
 AN ISOLATED SMALL WIND TURBINE EMULATOR Md. Arifujjaman Graduate Student Seminar: Master of Engineering Faculty of Engineering and Applied Science Memorial University of Newfoundland St. John s, NL, Canada
Welcome to the world of wind energy. Site Selection. Dr. D. V. Kanellopoulos OPWP Renewable Energy Training Program December 2016 Muscat, Oman
 Welcome to the world of wind energy Site Selection Dr. D. V. Kanellopoulos OPWP Renewable Energy Training Program 11-14 December 2016 Muscat, Oman 1 The role of topography in wind resource Strong winds
Reference wind speed anomaly over the Dutch part of the North Sea
 Reference wind speed anomaly over the Dutch part of the North Sea A.J. Brand This report has been presented at the European Offshore Wind 2009 Conference, Stockholm, 4-6 September, 2009 ECN-M--09-28 2
PGF. Pressure Gradient. Wind is horizontal movement of the air or other word air in motion. Forces affecting winds 2/14/2017
 Winds Wind is horizontal movement of the air or other word air in motion. Forces affecting winds 1. Pressure gradient force a. High pressure flows to low pressure b. Pressure gradient = difference in pressure
Kodiak, Alaska Site 1 Wind Resource Report
 Kodiak, Alaska Site 1 Wind Resource Report Report written by: Douglas Vaught, P.E., V3 Energy LLC, Eagle River, AK Date of report: March 16, 2007 Photo by Doug Vaught, V3 Energy LLC Summary Information
Windcube FCR measurements
 Windcube FCR measurements Principles, performance and recommendations for use of the Flow Complexity Recognition (FCR) algorithm for the Windcube ground-based Lidar Summary: As with any remote sensor,
How Does A Wind Turbine's Energy Production Differ from Its Power Production? 1
 Siting Wind Power: Wind Power Curves & Community Considerations (Teacher Notes) (Assessing the Feasibility of Wind Power for Pennsylvania) Notes on Part 1 A Beaufort scale is included on the next page
Offshore Micrositing - Meeting The Challenge
 Offshore Micrositing - Meeting The Challenge V. Barth; DEWI GmbH, Oldenburg English Introduction Offshore wind is increasingly gaining importance in the wind energy sector. While countries like the UK
Chapter. Air Pressure and Wind
 Chapter Air Pressure and Wind 19.1 Understanding Air Pressure Air Pressure Defined Air pressure is the pressure exerted by the weight of air. 19.1 Understanding Air Pressure Air Pressure Defined Air pressure
REMOTE SENSING APPLICATION in WIND ENERGY
 REMOTE SENSING APPLICATION in WIND ENERGY Siraj Ahmed Professor & Head Department of Mechanical Engineering Maulana Azad National Iinstitute of Technology Bhopal, India sirajahmed@manit.ac.in Contents
Energy capture performance
 Energy capture performance Cost of energy is a critical factor to the success of marine renewables, in order for marine renewables to compete with other forms of renewable and fossil-fuelled power generation.
July Interim Report. National Institute of Wind Energy (NIWE) Wind Resource Assessment & Offshore Unit Chennai, India.
 Wind Resource Assessment & Offshore Unit Chennai, India.") Interim Report (First Offshore Lidar wind data analysis) July 2018 Prepared by National Institute of Wind Energy (NIWE) Wind Resource Assessment & Offshore Unit Chennai, India. W I N D R E S O U R C E
Interim Report (First Offshore Lidar wind data analysis) July 2018 Prepared by National Institute of Wind Energy (NIWE) Wind Resource Assessment & Offshore Unit Chennai, India. W I N D R E S O U R C E
Atmospheric Forces and Force Balances METR Introduction
 Atmospheric Forces and Force Balances METR 2021 Introduction In this lab you will be introduced to the forces governing atmospheric motions as well as some of the common force balances. A common theme
Santa Ana Winds. Surface weather map showing typical Santa Ana conditions.
 Santa Ana Winds Surface weather map showing typical Santa Ana conditions. High Desert Elevation ~1500-2000 ft Santa Ana Winds ~1500 meters 0 meters Santa Ana Winds ~875 mb ~1500 meters ~875 mb Horizontal
IMPLICATIONS OF THE WEIBULL K FACTOR IN RESOURCE ASSESSMENT
 IMPLICATIONS OF THE WEIBULL K FACTOR IN RESOURCE ASSESSMENT Mathias Thamhain a, Dr. Brandon Storm b a EAPC Sur SRL, Fitz Roy 1466 PB D, 1414 Ciudad Autónoma de Buenos Aires, Argentina, m.thamhain@eapcwindenergy.com,