The Physical Oceanography of the Bras d Or Lakes
|
|
|
- Elwin Scott
- 6 years ago
- Views:
Transcription
1 PROC. N.S. INST. SCI. (2002) Volume 42, Part 1, pp The Physical Oceanography of the Bras d Or Lakes Brian Petrie 1 and Gary Bugden Ocean Sciences Division Department of Fisheries and Oceans Bedford Institute of Oceanography P. O. Box 1006, Dartmouth, N. S., Canada B2Y 4A2 In the Bras d Or Lakes the mean water circulation for the spring to fall seasons consists of a surface flow towards the ocean and a subsurface flow into the Lakes. The outflow from the Lakes is about 1100 m 3 s -1. Vertical exchanges and flushing times throughout the Lakes and their effects on oxygen distribution are discussed. Currents at some locations in the Lakes are frequently so weak that they cannot turn the rotors of conventional current meters; at other sites, they can be so strong that they rival flows in the Bay of Fundy. Of note are observations from Barra Strait and the Great Bras d Or Channel that feature maximum flows of about 1 and 3 m s -1, dominated by strong semi-diurnal tidal currents. Temperature and salinity change markedly from Sydney Bight into the Lakes and vertically within the Lakes. Sea level variations caused by tides decrease rapidly from the entrance to the Lakes along the Great Bras d Or Channel. On the other hand, low frequency fluctuations are only slightly attenuated. Surface wave data from the North Basin and Bras d Or Lake compare reasonably well with equations that relate wind speed and fetch to significant wave height. The long-term mean ice cover for the Lakes is derived from 30 years of data. Below (above) normal winter air temperatures are related to above (below) normal ice cover. Dans les lacs Bras d Or, la circulation moyenne de l eau du printemps à l automne consiste en un écoulement de surface en direction de l océan et un écoulement en profondeur vers l intérieur des lacs. Le débit sortant du lac est d environ m 3 s -1. On discute ici des échanges verticaux et du temps de renouvellement des eaux du lac, ainsi que de leurs effets sur la distribution d oxygène. En certains endroits du lac, les courants sont souvent si faibles qu ils n actionnent pas les rotors des courantomètres; en d autres endroits, ils peuvent être si forts qu ils rivalisent avec ceux de la baie de Fundy. À noter que des observations en provenance du détroit de Barra et du chenal Great Bras d Or indiquent des courants maximaux d environ 1 et 3 m s -1, dominés par de forts courants de marée semidiurne. La température et la salinité changent nettement entre la baie de Sydney et les lacs, ainsi que verticalement au sein de ces derniers. Les variations du niveau de la mer dues aux marées diminuent rapidement à partir de l entrée des lacs le long du chenal Great Bras d Or, mais les fluctuations de basse fréquence sont quant à elles à peine atténuées. Les données de vagues dans le bassin North et les lacs Bras d Or montrent une comparaison assez bonne avec la relation théorique entre la vitesse du vent, la portée du vent et la hauteur significative des vagues. La couverture de glace moyenne à long terme est calculée à partir de trente ans de données. Les températures hivernales de l air inférieures (supérieures) à la normale sont associées à une couverture de glace supérieure (inférieure) à la normale. Introduction The Bras d Or Lakes are connected to Sydney Bight and the Atlantic Ocean by a 30 km long, narrow, shallow passage, the Great Bras d Or Channel (Fig 1). The channel has an average width of about 1.3 km, an average depth of about 19.5 m and a maximum depth of 95 m. The most severe restriction is at the mouth of the channel where it opens onto Sydney Bight. There the width is only 320 m, the maximum depth is 16.2 m, and the cross-sectional area is 2400 m 2. It is through this small opening that most of the water exchange between the Lakes and the ocean must occur. The 8 km long Little Bras d Or Channel, the only other permanently open connection to the ocean, is even more restrictive. It is less than 100 m wide and 5 m deep on average. It does not appear to play a major role in the temperature and salinity 1 Author to whom correspondence should be addressed

, wave rider buoys (x) and ship-based")
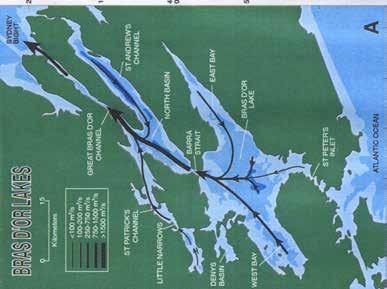
2 10 PETRIE and BUGDEN Fig 1 Map of the Bras d Or Lakes with place names used in the text. Sites of tide gauges (solid dot), moorings measuring current, temperature and salinity (solid triangle), wave rider buoys (x) and ship-based temperature and salinity stations (open dot, dashed line) are shown.
3 PHYSICAL OCEANOGRAPHY 11 distributions in the Lakes (Gurbutt and Petrie, 1995). A lock on St. Peter s Inlet on the southern side of Bras d Or Lake is opened occasionally to allow vessels to enter or leave the Lakes. Before the St. Peter s Canal was completed in 1869 after 15 years of digging, blasting and drilling, ships were hauled across the isthmus to the Lakes on skids. The major obstacle encountered during the construction was a solid granite hill 20 m high (Parks Canada, 2001). The interior of the Lakes consists of several interconnected basins and channels with a maximum depth of 280 m in St. Andrew s Channel. Two passages of note are Barra Strait which controls the exchange between the North Basin and Bras d Or Lake, and Little Narrows which separates Whycocomagh Bay from St. Patrick s Channel. The Lakes have a shoreline of about 1000 km excluding islands (from 1: digital charts), total surface area of about 1.07 billion m 2, and a volume of approximately 32 billion m 3. The restricted exchange with the Atlantic Ocean, freshwater inflow, and the exchange of heat between the atmosphere and the water are major factors influencing the circulation, temperature and salinity of the Bras d Or Lakes. The physical oceanography of the Lakes involves the circulation, both the average currents and the fluctuating currents caused by tides, wind and freshwater inflow, the distribution of temperature, salinity and density, the variations of sea level, mixing within the Lakes, surface waves and ice cover. These processes also affect other variables including the distribution of nutrients and dissolved oxygen in the water, the movement of sediments, the dispersion of pollutants and consequently water quality, and coastal erosion. A knowledge and understanding of these physical processes are fundamental to responsible and effective management of the Lakes. In the following sections, we present brief discussions of the mean circulation of the Lakes, mixing processes and upwelling, flushing times for the separate basins of the Lakes, the distribution of temperature and salinity, tidal and non-tidal currents and sea level changes, surface waves and ice cover. Mean Circulation The Bedford Institute of Oceanography conducted broad scale surveys of the Lakes from 1972 to 1974, making measurements of temperature, salinity, and dissolved oxygen concentrations from ships and small boats (Krauel 1975a, b). In addition, recording instruments were moored at depths ranging from 4 to 183 m below the surface in the spring and summer of 1973 and These current meters measured speed and direction of water flow at 13 locations throughout the Lakes; each record was about 1 month long. Seven sites were occupied only once, 4 sites twice, and 2 sites three times. Twenty eight records were collected in 1973, 21 in Sea level recorders were also placed at 9 shore locations at the same time. These data were used by Gurbutt and Petrie (1995) to derive a picture of the mean water circulation in the Lakes for the spring, summer and fall seasons. There were too few data from the winter to extend the circulation into that season. Moreover, during the winter, the Lakes are frequently covered completely by ice, a condition that could profoundly affect the circulation by cutting off direct contact with atmospheric forcing. The circulation in the upper (0-10 m) and lower (10-50 m or bottom if less than 50 m) layers of the Lakes are shown schematically in Fig 2A, B. The thickness of the lines depicting the currents is proportional to the amount of water transported. The thicker the line the greater the quantity of water moving, and vice versa.


4 12 PETRIE and BUGDEN Fig 2A Map of the near-surface circulation in the Bras d Or Lakes. The thickness of the line is proportional to the strength of the flow. (B) Map of the sub-surface (approximately m) circulation in the Bras d Or Lakes. The thickness of the line is proportional to the strength of the flow.
5 PHYSICAL OCEANOGRAPHY 13 Beginning in the southwestern region of the Lakes, the surface layer flows from West and East Bays, the former about 3 times stronger than the latter, and joins the currents in Bras d Or Lake to form a strong flow through Barra Strait into the North Basin. This flow then combines with weaker flows from St. Andrew s and St. Patrick s Channels to form a near-surface current through the Great Bras d Or Channel that discharges into Sydney Bight (Fig 2A). The surface circulation carries the freshwater runoff from the Lakes into the ocean. The sub-surface circulation is almost a carbon copy of the near-surface flow but in the opposite direction (Fig 2B). In the Great Bras d Or Channel, the sub-surface current moves from Sydney Bight into the North Basin, St. Andrew s and St. Patrick s Channels. The current in North Basin flows through Barra Strait into Bras d Or Lake and then into West and East Bays. The sub-surface flows carry relatively salty water from Sydney Bight into the Lakes. The circulation shown in Fig 2A, B must conserve mass; i.e., for each layer in each area of the Lakes, the mass of water entering a layer must equal the mass of water leaving. The flows can be either horizontal, from one area to an adjacent area, or vertical, from one layer to another within the same region of the Lakes. Carried to an extreme, if mass conservation did not hold then, over time, the Lakes would either drain completely, if more water flowed out than in, or flood the adjacent countryside, if the opposite were true. Similar conservation principles hold for salt and heat. If the amount of salt in the Lakes remains constant, the quantity entering the system must balance the amount leaving. If the total salt content in the Lakes is increasing, more must come in then leave and vice versa. The water temperatures in the Lakes depend on balances between the sources or sinks of heat; e.g., in spring and summer there is a net transfer of heat from the atmosphere to the Lakes, in winter the opposite is true. The flow from Sydney Bight generally brings colder water into the Lakes. Gurbutt and Petrie (1995) applied these conservation principles to derive the mean water circulation. The term estuarine is often used to characterize the pattern of circulation just described for a semi-enclosed area that has significant freshwater inflow. Accompanying this characteristic circulation of outflow in the upper layer and inflow in an underlying layer is a distribution of surface salinity that has the freshest water within the Lakes and increasing salinity towards the ocean. The sub-surface salinity follows the same pattern. Mixing and Upwelling Turbulent processes mix the surface layer waters with the sub-surface waters as they flow past each other; in the case of the mean circulation in the Lakes, the layers are moving in opposite directions. The fresher and generally warmer waters of the surface layer mix into the sub-surface layer causing it to warm and become less salty. At the same time, the sub-surface waters are mixed into the surface layer making it saltier and cooler. Mixing enhances the estuarine circulation in the Lakes. If the less dense freshwater flowing into the Lakes was not mixed with the underlying saltier waters, it would simply flow out as a thin surface layer. The discharge into the Lakes would be balanced by the outflow to the ocean. Think of the freshwater as a dye. As mixing and consequently the salinity of the upper layer increases, the freshwater is effectively diluted by the saltier waters; therefore more of this diluted mixture must flow out into the ocean in order to balance the freshwater inflow. That is, the surface component of estuarine
6 14 PETRIE and BUGDEN circulation must strengthen. By the same token, the underlying layer has lost salt to the upper layer, which must be compensated by inflow of salty water from the ocean. Mixing can be caused by a number of mechanisms such as wind forcing, tides and bottom friction, and estuarine-induced current shear. Any mechanism that causes one layer of water to move at a different speed or direction than an adjacent layer is capable of generating mixing. On the other hand, a process, such a freshwater inflow, that increases the density contrast between surface and sub-surface waters will tend to suppress mixing. In fact, for freshwater inflow, there is a competition between the tendency to increase the vertical density contrast which inhibits mixing and the tendency to increase the velocity differences between layers that enhances mixing. In their model of the Lakes circulation, Gurbutt and Petrie (1995) divided the vertical currents between 2 layers into 2 components. The first component, the exchange has equal values in both directions, i.e., as much water is mixed from the surface to the sub-surface layer as is mixed from the sub-surface to the surface layer. The second component represented a net flow from one layer to another: upwelling if it was from the sub-surface to the surface layer, downwelling if it was in the opposite direction. The mixing between layers varies strongly throughout the Lakes as is indicated in Fig 3A. In this diagram, we have plotted the exchange between the surface and sub-surface layers divided by the volume of the latter. This gives a measure of the strength of the mixing from the surface to sub-surface layer. The strongest mixing by far occurs in the Great Bras d Or Channel, where the intensity is about 100 to 150 times greater than in Whycocomagh Bay, East Bay and St. Andrews Channel, and times more than in St. Patrick s Channel, West Bay, North Basin and Bras d Or Lake. The primary factor that contributes to the strong mixing in the Great Bras d Or Channel is the current associated with the semi-diurnal lunar tide. Gurbutt and Petrie (1995) also identified Barra Strait as another area where intense mixing occurs. The mixing between the fresher surface layer and the sub-surface layer reduces the sub-surface layer s salinity; furthermore, because the sub-surface flow is inward from the ocean, some of the freshwater is carried back into the Lakes. Mixing also brings generally highly oxygenated water from the surface to the layers below. Other water-borne materials would behave in a similar fashion. Two areas of the Lakes, North Basin and St. Andrew s Channel, have deep, isolated basins with depths exceeding 200 m. Gurbutt and Petrie (1995) incorporated these deep regions as distinct compartments in their model and derived the mixing rates that best fit the existing data (Fig 3B). The mixing in these areas is about 10 and 20 times less than the mixing between the surface and sub-surface layers in the Great Bras d Or Channel. In these deep basins, the currents are generally weak, reducing the potential for vigorous mixing. In addition to mixing between layers, there can also be a net flow from one to the other. As indicated earlier, if the flow is from the sub-surface layer to the surface layer, it is called upwelling, simply because of the upward transport of water. If the net flow is in the opposite direction, it is called downwelling. Fig 3C shows that in most areas of the Lakes, upwelling prevails and is strongest in North Basin and Bras d Or Lake. It is somewhat weaker in the other areas. Whycocomagh Bay (east and west) is separated from St. Patrick s Channel by a shallow sill, which effectively isolates the deep areas of the Basin from the rest of the Lakes. This geometry strongly inhibits net flow from one layer to the other. For this reason, Gurbutt and Petrie (1995) assumed that the net flow from the sub-surface to the surface layer in Whycocomagh Bay was zero when they derived their circulation maps. It is evident that downwelling prevails in the Great Bras d Or Channel (Fig 3C). According to the model, the vertical transport of water is greater in this region than in any other part of the Lakes.
7 PHYSICAL OCEANOGRAPHY 15 Fig 3 (A) Vertical exchange between the surface and sub-surface layers in the Bras d Or Lakes. (B) Vertical exchange between the sub-surface and deep layers of the Lakes. (C) Upwelling (positive) or downwelling (negative) from the sub-surface to the surface layers of the Lakes.
8 16 PETRIE and BUGDEN Flushing Times One way to establish 'flushing time' is to assume that a dye is put into an area of the Lakes. Allow the circulation and mixing that occur in the Lakes to dilute the dye until its average value reaches a predetermined level. In oceanography, this level is often set at 0.37 of the initial concentration. The time it takes to reach this value is called the flushing time. Gurbutt et al. (1993) used their model of circulation and mixing to estimate the flushing times for the major regions of the Lakes. The longest flushing times of approximately 2 years were for the sub-surface layers in east and west Whycocomagh Bay, and about 260 days for the deepest basin in St. Andrew s Channel. The shortest flushing times of about 1.5 days were for the surface and sub-surface layers in the Great Bras d Or Channel. These results are not surprising given the discussion of the mixing and upwelling above. The decrease in concentration (beginning with a value of 1) over 300 days for the sub-surface layer of Whycocomagh Bay (west), and the deep layers of the North Basin and St. Andrew s Channel is shown in Fig 4. There is a relatively rapid rate of dilution at the start, followed by a more gradual decline. What are the implications of these results? Short flushing times can quickly disperse water-borne pollutants and keep a region of the Lakes well oxygenated. On the other hand, a long flushing time means that dilution of a water-borne contaminant occurs more slowly and that the supply of highly oxygenated waters to a region is reduced. Fig 4 The change of concentration of a dye inserted into the deepest layers of the model of Gurbutt and Petrie (1995). Initial concentration was 1, all areas were run separately.
9 PHYSICAL OCEANOGRAPHY 17 Gurbutt and Petrie (1995) considered the effects that flushing times would have on the oxygen concentrations throughout the Lakes. At a given temperature and salinity, there is a limit to the amount of oxygen that ocean water can hold in the dissolved form. At the maximum dissolved oxygen concentration, the water is said to be 100% saturated. However, at the surface, growing marine plants, wave action and turbulence will often lead to oxygen concentrations that exceed this level; the water is then super-saturated, i.e., exceeding 100%. Below the oxygen-rich surface layer, oxygen is depleted through fish respiration, benthic uptake (processes related to the bottom sediments), and oxidation of organic material in the water column. This last process is the most significant in the Lakes. On this basis, Gurbutt and Petrie (1995) predicted that the deeper half of both the eastern and western regions of Whycocomagh Bay would be anoxic, i.e, have no dissolved oxygen whatsoever. Oxygen concentrations in the deep areas of St. Andrew s Channel should be reduced by 20-50% and in the deep part of the North Basin by 5-15%. In fact, data have indicated that the deep part of the western half of Whycocomagh Bay was anoxic and probably has been in that state for a long time (Fig 5A). The eastern half of the Bay had concentrations reduced by as much as 70% of their maximum potential value, the deep areas of St. Andrew s Channel (Fig 5B) and North Basin were reduced by 20-45% and 5-10% of their maximum potential concentrations. These successful comparisons between model results and observations indicate that the model could be used to examine large scale, long-term pollution issues within the Lakes. Fig 5 (A) Oxygen percent saturation variation with depth for the western half of Whycocomagh Bay. (B) Oxygen percent saturation for St. Andrew s Channel. Note the oxygen values for the 1974 data are from discrete samples and are determined by Winkler titration. The 1996 observations are from a YSI sensor mounted on the conductivity-temperature-depth (CTD) recording instrument.

10 18 PETRIE and BUGDEN Freshwater Inflow One of the major forces that contributes to the circulation in the Lakes is freshwater inflow. The Lakes do not have a single dominant river source. Rather, there are a number of small rivers and brooks that supply the freshwater. In addition, the surface area of the Lakes is a sizable fraction of the land drainage area. Direct rainfall on the Lakes surface and evaporation from it must be considered when determining the total inflow. Gurbutt et al. (1993) used gauged river inflow measurements, drainage basin areas and the area of the Lakes (for rainfall or evaporation) to determine an annual cycle of freshwater inflow. The annual cycle features a strong pulse of freshwater in the spring associated mainly with snow and ice melt and the tendency for greater rainfall during this season (Fig 6). The monthly average inflow in April and May reaches almost 250 m 3 s -1. There is also a secondary peak in November-December of about 170 m 3 s -1. The weakest inflow occurs during the summer months of July-September at a rate of just above 50 m 3 s -1. This pattern of the annual cycle is typical of the eastern Canadian region. Fig 6 Monthly mean freshwater inflow into the Bras d Or Lakes. The overall magnitude of the freshwater inflow is small and would take nearly 7 years to replace the volume of water in the entire Lakes. Despite its relatively weak inflow, the freshwater does have a significant effect on the salinity of the Lakes as we shall see in the next section. This again relates to the restrictive connection between the Lakes and the ocean that controls the amount of saline water that can enter the system.

 is on the left hand side of each panel, East Bay (EB) on the right, with Great Bras d Or Channel (GB d Or Chn), North Basin (NB), Barra Strait, and Bras d Or Lake (B d Or L) in")
11 PHYSICAL OCEANOGRAPHY 19 Distribution of Temperature and Salinity The distributions of temperature and salinity in the Lakes for May and July are shown in Fig 7. The left side of each figure corresponds to Sydney Bight; moving to the right, the data come from the Great Bras d Or Channel, the North Basin, through Barra Strait into Bras d Or Lake and finish in East Bay. The locations of the stations are shown in Fig 1. Fig 7 Temperature and salinity sections for the Bras d Or Lakes (A) May 1974 and (B) July Sydney Bight (SB) is on the left hand side of each panel, East Bay (EB) on the right, with Great Bras d Or Channel (GB d Or Chn), North Basin (NB), Barra Strait, and Bras d Or Lake (B d Or L) in between. A line in Fig 1 shows the track of the line of stations. The position of each station where data were collected is shown as a dot and number at the top of each panel.
12 20 PETRIE and BUGDEN During winter, water temperatures fall to roughly 0 o C in the Lakes. By May, surface temperatures are about 6 o C, but the deeper waters remain close to 0 o C. Temperatures in the Great Bras d Or Channel show less change with depth than in other parts of the Lakes. This is probably because of the enhanced mixing in this region. Surface salinity in May changes significantly from Sydney Bight where it is about 30 (a salinity of 30 represents 30 gm of salt in 1 kg of seawater) at the surface, to less than 21 in North Basin, and 20.5 in East Bay. This surface salinity front (large change in a short horizontal distance) reflects the influence of the freshwater inflow into the confined area of the Lakes. Salinity at depth in North Basin is about 25. The average salinity of the Lakes is about 22, substantially less than an equivalent region in Sydney Bight. Given the volume of the Lakes though this adds up to a substantial quantity of salt, 7X10 11 kg of salt. Warming occurs through the spring and summer so that by July, surface temperatures can exceed 16 o C. The change of temperature with depth increases for most of the Lakes but remains smallest in the Great Bras d Or Channel. Temperature in the deep North Basin is less than 1 o C and salinity is about In East Bay, salinity has increased from its May values, perhaps because the inflow of freshwater has decreased from the spring runoff associated with snow melt and the general increase of rainfall at this time of the year. The influence of the limited exchange with the ocean manifests itself again as a strong change of salinity along the Great Bras d Or Channel. Another perspective of the temperature and salinity distributions in the Lakes is gained by examining those properties at a fixed depth (Fig 8). Two surveys, one in May 1974 and the other in September 1996 had sufficient spatial coverage to allow reasonable mapping of the temperature and salinity in approximately the upper 2 m over most of the surface of the Lakes. Some interesting features and contrasts are evident. Lower temperatures and higher salinities are seen at the mouth of Great Bras d Or Channel for both surveys. In the September survey, the near-surface temperature was highest in St. Andrew s and St. Patrick s Channels, decreased into Bras d Or Lake and was lowest in East Bay. It is possible that the low temperatures in East Bay were caused by upwelling driven by local winds when these measurements were taken. Also prominent is the decrease of salinity along St. Patrick s Channel into Whycocomagh Bay. A similar decrease, but not as large, occurs between North Basin and Bras d Or Lake through Barra Strait. The lowest near-surface salinities were recorded in Denys Basin which is connected to Bras d Or Lake through a very restricted passage. This restriction limits the influence of ocean waters in the Basin. In May 1974, the highest temperatures and the lowest salinities were found in Whycocomagh Bay at the head of St. Patrick s Channel. The central part of Bras d Or Lake featured the lowest temperatures. Apart from St. Patrick s and the Great Bras d Or Channels, the salinity differences were not large throughout the rest of the Lakes. The May 1974 survey did not make measurements in Denys Basin. Infrared sensors on satellites provide estimates of sea surface temperature for the world s oceans. However the spatial resolution of these sensors is about 1 km, comparable to the widths of the channels in the Lakes. Thus the estimates of sea surface temperature for those areas are contaminated by land effects. We examined a broad range of sea surface temperature products and found that temperatures were only available for the central parts of the North Basin and Bras d Or Lake. How deep do the surface features in Fig 8 penetrate below the surface? For temperature and salinity it depends on the time of the year and on the location within the Lakes (e.g., see Fig 7). For the entire area of the Lakes, we calculated the monthly average depth where the temperature differs from the surface value by 1 o C (Fig 9). We
13 PHYSICAL OCEANOGRAPHY Near surface Temperature, Sept Near surface Salinity, Sept Latitude Latitude Longitude Near surface Temperature, May Longitude Near surface Salinity, May Fig Longitude 4 Latitude Latitude Longitude 16 Near-surface (approximately the upper 2 m) temperature and salinity from ship surveys in 1996 and Note that the colour scale changes for each panel and the white areas indicate no data were available to interpolate the temperature and salinity fields. shall refer to this as the mixed layer depth. Data availability restricted the estimations to the May-November period. The results make sense when compared to other areas. In spring and summer we expect the mixed layer depth to be shallow because the heating from the sun is confined to the near-surface waters and winds are generally weak, thereby reducing the potential for turbulence. The mixed layer depth is about 4 m for the May to August period with a standard deviation of about 7 m (Fig 9). The
14 22 PETRIE and BUGDEN Fig 9 Depth of the mixed layer defined as the mean depth where the temperature changes by 1 o C from the surface value. The standard deviation is also shown; it provides a measure of the scatter of the individual layer depths about the mean. standard deviation indicates that there is significant variability of this depth throughout the Lakes, reflecting in part the tidal mixing, and consequently deeper mixed layers, that occurs in areas such as the Great Bras d Or Channel and Barra Strait. Towards the end of the summer and in the early fall, solar heating decreases, and winds and the frequency of storms generally increase. Thus there is the potential to deepen the mixed layer. That is indeed what is observed (Fig 9). By November, the layer is on average about 22 m deep and still exhibits considerable variability, reflected in the standard deviation of about 24 m. It is evident from Fig 7 that the temperature and salinity properties throughout the Lakes change markedly during the summer period. Continuous records from the Great Bras d Or Channel and Barra Strait for (Fig 10), indicate that substantial changes occur during the year (see Fig 1 for locations). The salinity in the year-long record from Great Bras d Or Channel ranges from about 22 to 29 (Fig 10A). With a maximum near-surface salinity daily change of 5; this gives a spiky appearance to the record. There are also longer term changes evident such as the overall decrease of salinity from winter to spring. This is related to the increased freshwater inflow in the latter period (Fig 6). The cause of the rapid variations becomes evident when a shorter portion of the same record is examined (Fig 10B). The plot shows that there are approximately two large changes of salinity during a day. This variation is caused by the strong tidal currents
 Start of the salinity time series shown in (A). (C) Temperature time series from Barra Strait.")
15 PHYSICAL OCEANOGRAPHY 23 Fig 10 (A) Salinity time series from the Great Bras d Or Channel. There are two records separated by a gap. The first record is from a depth of 4 m, the second from 3 m. (B) Start of the salinity time series shown in (A). (C) Temperature time series from Barra Strait. The first record, from 4 m, runs from June to early October,1998; the second, from 10 m, runs from October 1998 until April 1999.
16 24 PETRIE and BUGDEN moving the salinity front at the mouth of Great Bras d Or Channel (Fig 7) back and forth past the sensor. On one part of the cycle, the sensor measures water whose properties are more characteristic of Sydney Bight; the flow then reverses and 6 h later the sensor measures water with properties shifted towards those of the Bras d Or Lakes. The annual cycle of temperature at Barra Strait for is shown in Fig 10C. Peak temperatures of about 23 o C were reached in mid-august and decreased to a minimum of about 0.25 o C in late February. Observations suggest that the changes in the deep basins are very small, even over periods as long as 75 y. In Fig 11 we show data from St. Andrew s Channel for depths equal to or greater than 100 m. The earliest observations are from 1924, the latest from 2000 with large gaps between years until the late 1990s. The data indicate that the temperatures range from 1 to 1 o C with a median value of about 0.33 o C; salinity has a range of about 24.8 to 26.5 with a median value of The coolest temperatures and highest salinities are generally for the years 1924 and The warmest temperatures and the lowest salinities were for the years These observations were compared to the variations of Sydney air temperatures and freshwater runoff from the nearby gauged Northeast Margaree River. The variations generally fit, high air temperatures led to high deep water temperatures, and low freshwater input led to high deep salinities and vice versa. These results indicate the importance of local processes, as well as inflow from Sydney Bight, in determining the properties of the deep waters of the Lakes. There is a striking contrast between deep waters in the Lakes and the adjacent ocean. The temperature and salinity of waters at the same depth from the Laurentian Channel east of Sydney Bight, the nearest area with water depths comparable to St. Andrew s Channel, are about 5.8 o C and These values are substantially higher than the 0.33 o C and for temperature and salinity observed in St. Andrew s Channel. Two processes probably are most prominent in setting the deep water properties in the Lakes: local winter convection and advection, i.e. flow, from Sydney Bight with strong mixing occurring in the Great Bras d Or Channel. During winter convection, cooling causes the near surface waters to become more dense than the waters below them. The denser waters sink and fill up the deep areas of the Lakes. Water from Sydney Bight is modified as it enters the Lakes through the Great Bras d Or Channel and, if sufficiently dense, flushes the deeper areas of the Lakes, replacing the water that was present there. Currently a program is underway to determine the relative strengths of these two processes. Currents in the Bras d Or Lakes Current observations were made by Krauel (1975a) during the Bras d Or Lakes surveys in 1973 and Recording current meters were mounted on a mooring cable and suspended above an anchor by a sub-surface float. In the open areas of the Lakes, the currents were generally so weak that for a large percentage of the time no flow was registered. In the Great Bras d Or Channel and Barra Strait, the currents were so strong that the moorings were tilted, a process that can lead to poor instrument performance and degraded data quality. In addition, depending on the strength of the current, the instruments would record at different depths: strong flows cause large mooring tilts, pushing the instrument deeper. This can make the data difficult to interpret. In , bottom-sited acoustic Doppler current meters were moored in Barra Strait and just inside the mouth of the Great Bras d Or Channel (Fig 1) These
17 PHYSICAL OCEANOGRAPHY 25 Fig 11 (A) Temperature and (B) salinity data from St. Andrew s Channel for depths equal to or greater than 100 m, spanning the years
18 26 PETRIE and BUGDEN instruments sit on the bottom and measure the current by transmitting an upward pulse of sound and recording its echo reflected by small organisms and particles in the overlying water. If the echo has a higher (lower) frequency than the original sound, the reflecting particle is moving with the current towards (away from) the instrument. This change in sound frequency is known as the Doppler Shift. Four separate beams of sound are used so that the current speed and direction can be resolved. The return signals are processed in the instrument and estimates of the currents for each 1 m vertical interval are recorded. This instrument provides estimates of the current over most of the water depth without the problems that arise from tilting of ordinary meters. A sample of the current records from the Great Bras d Or Channel and Barra Strait illustrate the characteristics of the flow (Fig 12A, B; a negative sign means the water is flowing into the Lakes). At both locations a strong tidal component is evident as the rapid change of the along channel current approximately every 12 h (semi-diurnal) over the length of the record. The tidal component is considerably stronger in the Great Bras d Or Channel with currents ranging from about 250 cm s -1 to about 150 cm s -1 (Fig 12A). The time series of current is biased towards the inflow side of the figure, i.e., most of the negative values are larger than the positive ones. This indicates that the average flow at this depth, 18.5 m, is into the Lakes. At Barra Strait the flows range from about 40 to 40 cm s -1 ; however, at the depth (3.9 m) of this series, the bias is generally positive (Fig 12B), i.e. the 3.9 m flow is out of the Lakes. These records run from the fall of 1998 to the spring of Fig 13 shows the mean, along channel currents and the amplitude associated with the tidal currents at both locations. In the Great Bras d Or Channel, the mean flow is out of the Lakes at 4.5 m (Fig 13A). Below 4.5 m, the current is into the Lakes. The current meter is unable to estimate the flow in the upper 4 m because of inherent technical limitations. However, Fig 12 Current meter records from (A) 18.5 m depth inside the mouth of the Great Bras d Or Channel and (B) from 3.9 m depth in Barra Strait in November, Note that a positive value indicates flow from the Lakes to the ocean and vice versa.
19 PHYSICAL OCEANOGRAPHY 27 the flow in the 0-4 m range must be strongly out of the Lakes, otherwise they would fill with water and overflow the shore. As noted earlier, there must be a balance between inflow and outflow, in fact the outflow should exceed the inflow on average by the amount of freshwater that runs into the Lakes. On the other hand, at Barra Strait the mean flow is strongly out of the Lakes in the upper 14 m, 11 cm s -1 at 4 m depth. The flow then oscillates between positive and negative values from 15 to 44 m (Fig 13C). We think that the mean flow from 0 to 4 m is still out of the Lakes. The imbalance seen here indicates that we have not sampled the Strait adequately. It probably means that we should have had current meters at more locations across the Strait. The semi-diurnal tidal amplitudes in the Great Bras d Or Channel are about 90 cm s -1 at all depths (Fig 13B). There are a number of different tidal components that have periods of about 12 hours. The amplitude shown in the figure is the combined flow caused by all of the semi-diurnal components (discussed in more detail in the next section). The amplitudes are considerably smaller in Barra Strait, varying from about 5 to 20 cm s -1 (Fig 13D). The strong variation with depth is caused in part because the Fig 13 (A) Mean current along the channel axis for the period November 1998 April 1999 for the Great Bras d Or Channel. (B) Amplitude of the semi-diurnal tidal currents for the Great Bras d Or Channel. (C) Same as (A) except for Barra Strait, October 1998 April (D) Same as (B) except for Barra Strait, October 1998 April 1999.
20 28 PETRIE and BUGDEN instrument was placed in a relatively deep hole in the middle of the Strait. The currents in the Great Bras d Or Channel are notable by any standard. The flows on occasion approach 3 m s -1. In the Canadian east coast region, similar currents are generally only seen in the Bay of Fundy. These strong currents cause considerable mixing in the Great Bras d Or Channel; the currents in Barra Strait, though weaker, still have the potential to generate significant mixing. Associated with the strong tidal currents are changes in sea level that have a distinct character in the Lakes. Sea Level in the Bras d Or Lakes Tidal Elevations The effect of tides and the problem of sea level prediction in the Bras d Or Lakes has intrigued the public for a long time. The Yachtsman s Guide to the Bras d Or Lakes (1987) contains the interesting and puzzling statement: tidal predictions are a matter of consternation. In a number of instances the lunar component of our semi-diurnal tidal area defies the 12-hour period by as much as 5 days at Barra Strait. Before dealing with this statement, we shall first indicate the dominant tidal component in the Lakes and also examine non-tidal influences affecting sea level. The tides in the oceans are caused by the gravitational attraction of the sun and the moon. The orbits of the sun-moon-earth system follow complicated but predictable patterns that give rise to a number of tidal components with different periods of variability. The tides in the Bras d Or Lakes are not the result of direct sun-moon gravitational forcing on the lake waters but rather are a response to the tides in Sydney Bight. The tides in Sydney Bight have 5 major components (or constituents) that are called M 2, N 2, S 2, K 1, and O 1 with amplitudes of 36.8, 7.6, 10.9, 7.7, and 8.2 cm respectively. The first 3, known as semi-diurnal tides, have periods of roughly one half a day (i.e., they have 2 high and 2 low values each day), the last 2, called diurnal tides, have periods of approximately one day. The largest one by far is the M 2 tide (period hours) which is the principal lunar constituent (the one mentioned by The Yachtsman s Guide to the Bras d Or Lakes) and is caused by the moon s gravitational attraction on the world s oceans. We consider only this major component in the following discussion. The amplitude of the M 2 tide decreases rapidly as it enters the Great Bras d Or Channel (Fig 14A). The tide at Big Bras d Or is reduced by more than one half (to 16 cm), compared to its amplitude at North Sydney of 36.8 cm. By Seal Island Bridge it has decreased again to 7.3 cm. The M 2 tide continues to decrease as it moves farther into the Lakes having amplitudes of 4 cm at Iona and 3 cm at Baddeck. There is no appreciable tide at Whycocomagh. In the Bras d Or Lake, at Marble Mountain, Johnstown Harbour and Eskasoni, this component is remarkably constant at about 4.5 cm, slightly larger than in the North Basin. Not only does the amplitude of the principal component of the tides decrease as it enters the Lakes but the time of high water associated with it varies markedly relative to the tide at North Sydney (Fig 14B). In the Great Bras d Or Channel, high water occurs earlier than it does at North Sydney by as much as 30 min. This lead is caused primarily by the strong frictional effects in the Channel (see Petrie 1999; Proudman 1953). At Baddeck and Iona the tide is approximately 3 h later than at North Sydney, and finally in the Bras d Or Lake it is about 4 h later. Over most of the Lakes, the time of high water is considerably later than it is in North Sydney. Petrie (1999) modelled the M 2 tidal component and showed that friction and the geometry of the Lakes were the major contributors to the variations of tidal amplitude and timing.
21 PHYSICAL OCEANOGRAPHY 29 Conceptually the response of the tides in the Lakes inside of Great Bras d Or Channel can be thought of in the following way. In Sydney Bight, sea level associated with the M 2 tide is changing from high to low then back to high every hours. Consider the case when the tide in the Bight is rising. This change enters the Lakes primarily through the Great Bras d Or Channel. However, the Channel is narrow and generally shallow; in order to change the water level in the Lakes by the same amount as in Sydney Bight, the currents must be strong. As we saw in the last section, the currents are very strong in some places. But strong currents generate a lot of turbulence or friction as they flow over the rough ocean bottom. This friction opposes the flow of Fig 14 (A) Amplitude (cm) of the M 2 tide in Sydney Bight and progressively farther into the Lakes. (B) Delay (hours) of the tide behind high tide at North Sydney.
22 30 PETRIE and BUGDEN water into the Lakes causing a loss of energy; consequently, the tidal amplitude in the Lakes is not as large as it is in Sydney Bight. Even when sea level is starting to fall in Sydney Bight, it still can be higher than it is in the Lakes because the tidal amplitude there is not as large. Water will continue to flow into the Lakes, raising the sea level more. Therefore, high water in the Lakes will occur later than high water in Sydney Bight. When sea level in Sydney Bight falls below the level in the Lakes, the tidal currents will reverse and flow out of the Lakes. Non-tidal Variations of Sea Level The tides are not the only cause of sea level variations in the Bras d Or Lakes. Changes in atmospheric pressure, winds and sea level variations in the Gulf of St. Lawrence that move into Sydney Bight are also major factors. Atmospheric pressure changes over Sydney Bight were responsible for large fluctuations in sea level detected by the gauges that were moored in the Lakes in 1973 and 1974 (Petrie, 1999). The response of the ocean to atmospheric pressure changes is known as the inverted barometer effect because higher (lower) pressure leads to lower (higher) sea level. The time scales for these changes to occur are generally from several days to weeks. For the Bras d Or Lakes, this mechanism works as follows. High atmospheric pressure over Sydney Bight and the Bras d Or Lakes region tends to push the water towards areas of the ocean where the atmospheric pressure is lower. Weather systems are generally large, so the low pressure region could be thousands of kilometers distant. It is however, easier to move water away from the Bight than from the Lakes because the Great Bras d Or Channel restricts the movement of water out of the latter. Sea level thus falls first in Sydney Bight, leaving sea level in the Lakes higher. The difference in sea level causes water to flow from the Lakes into the Bight until a balance is reached. If, over the next few days, the atmospheric pressure in the region decreases, the process will reverse. Sea level will rise in Sydney Bight faster than in the Lakes, a sea level difference will be generated and water will flow into the Lakes through Great Bras d Or Channel. Thus, sea level in the Lakes responds to sea level variations in Sydney Bight. Fig 15A, B show sea level records from North Sydney and Seal Island. The tidal and non-tidal variations (Fig 15A) behave quite differently; the former, primarily made up of the M 2 tide and seen as the rapid, spike-like changes in the diagram, decreases markedly between Sydney Bight and Seal Island. As discussed above, they continue to decrease with distance into the Lakes. However, it is apparent that the non-tidal variations do not decrease much between North Sydney and Seal Island. This is more clearly illustrated in Fig 15B where the tides have been removed from the record. The more gradual changes seen in the North Sydney record decrease by a very small amount in the Great Bras d Or Channel. In examining all of the records from the interior of the Lakes, Petrie (1999) found that the maximum reduction of the non-tidal variations (to be more precise, variations that have periods longer than 1 day) was about 15%. Therefore, the non-tidal sea level variations retain at least 85% of their magnitude as they move into the Lakes. Moreover, within the Lakes, these variations have been observed to be up to 50 cm, about 10 times larger than the tides. The cause of much of the slowly-varying sea level changes seen in Fig 15B is apparent when the atmospheric pressure is compared to the sea level records. In Fig 15, the atmospheric pressure variations have been inverted; i.e. high values are plotted downward, low values are plotted upward. Most of the fluctuations seen in the inverted atmospheric pressure corresponds to the sea level data from North Sydney and the Lakes. Why are the tides reduced so drastically yet the non-tidal variations pass into the Lakes largely unaffected? The key to understanding this is to recall how rapidly the
23 PHYSICAL OCEANOGRAPHY 31 variations occur. The tides change over a day (diurnal) or half day (semi-diurnal). For M 2, this means that sea level goes from its lowest to highest point in 6.21 h. In order for sea level in the Lakes to respond to these changes, water must flow very rapidly through the Great Bras d Or Channel, first into the Lakes as sea level in Sydney Bight increases, then out as sea level falls. The friction that takes energy out of the tides is considerably more for currents with a high velocity than for those with a low velocity. (Technically if a current doubles, its frictional effect increases by four times.) Thus, friction becomes very important in decreasing the flow and the vertical movement of the sea surface. Consequently, there is a strong reduction of the elevation changes Fig 15 (A) Sea level records from North Sydney and Seal Island in (B) The same records after the tides have been removed. Also shown is the negative of the atmospheric pressure variation after the mean value has been subtracted, i.e. it is the inverted atmospheric pressure. Note in both figures the Seal Island record has been offset for clarity as has the atmospheric pressure in (B).
24 32 PETRIE and BUGDEN associated with the tides. On the other hand, sea level variations associated with non-tidal changes, such as from the inverted barometer effect, occur more gradually, over many days or even weeks (Fig 15B). The currents associated with these changes are much smaller than those associated with the tides since there is more time to move the water into and out of the Lakes. As a result, the frictional losses are not large and the sea level changes are only slightly smaller in the Lakes than they are in Sydney Bight. Petrie (1999) gives a more rigorous, mathematical explanation of this phenomenon. Returning to the statement from The Yachtsman s Guide to the Bras d Or Lakes we can speculate that the authors thought that only tides caused water level variations in the Lakes. They did not realize that non-tidal changes can be larger and vary more slowly. Perhaps they matched the highest predicted tide at North Sydney with the highest observed water level in the Lakes. Surface waves Surface waves, the rapid vertical movement of the water s surface caused by wind, are another form of sea level variation. On the Lakes, their periods (the time between successive peaks or troughs at a fixed point) are primarily in the 2-4 second range. Environment Canada placed a wave rider buoy in the North Basin in 1992 and in the Bras d Or Lake in 1993 (Fig 1). Both moorings recorded for about 6 months from the spring to the fall. Wave heights (the distance from the wave trough to its crest) were measured and their characteristics summarized every hour. One of the parameters recorded by the buoys was the significant wave height (SWH). The SWH is determined by averaging the highest one-third of all the waves recorded in a specified time interval. Wave height generally increases with the strength of the wind, its duration, and with the distance that it blows over the water from land to the buoy site. This distance is called the fetch. In the North Basin, the fetch for the dominant wind direction in the records was 11 km; in the Bras d Or Lake, the fetch was 28 km. For the same wind strength and duration, we expect larger waves in Bras d Or Lake than in the North Basin because of the former s longer fetch. The results from the observation program are shown in Fig 16A, B. Note that the resolution of the SWH is 0.1 m, i.e., there are only values at 0, 0.1, 0.2 m etc. It is also traditional to use the wind speed in knots rather than metric units. The solid dots are the individual estimates of SWH, 3951 points in 1992 and 3891 points in The open circles connected by a line are the median values of wind speed plotted at every interval of 0.1 meters of SWH. The median is the value, such that half the values are greater, half are less. The broken line is the predicted relationship from a formulation of Bretschneider (e.g., Khandekar (1989)). The waves in the North Basin are smaller than those in the Bras d Or Lake for the same wind speed (Fig 16A, B). This is expected given that the fetch in the latter is greater. The idealized model gives qualitatively reasonable results but it generally overestimates the SWH in North Basin compared to the observations. In the Lake, the model agrees well with the observed median wave height. A more complete comparison would involve separating the wave parameters according to the wind direction. For each wind direction a separate model result would be calculated since the fetch changes and would be compared with the observed SWH. However, the relationships in Fig 16 can serve as a good guide for predicting the SWH in the Bras d Or Lakes. Ice Cover in the Bras d Or Lakes Over the past 3 years ( ), the winters have been relatively mild and consequently ice cover over the Lakes has been below normal. On the other hand,
25 PHYSICAL OCEANOGRAPHY 33 we know that the flights of the Silver Dart relied on the ice of Baddeck Bay to serve as a runway for the first powered flights in the British Empire. It is apparent that ice cover varies substantially from year to year. Clearly a long time is required to collect enough observations to establish the average winter ice cover. Environment Canada has been compiling ice statistics for the east coast since the early 1960s. We have used their maps of ice cover collected over 30 years to calculate the mean conditions for different areas of the Lakes. These have been combined to give Fig 16 (A) Observed significant wave height (solid dot) for the North Basin as a function of wind speed. The medians of the observed values (solid line with open dots) and the predicted significant wave heights for a fetch of 6 nautical miles (broken line) are also shown. (B) Observed, median and predicted significant waves heights for a fetch of 15 nautical miles for the Bras d Or Lake.

26 34 PETRIE and BUGDEN weekly estimates for the percentage of the areas north and south of Barra Strait that are covered by ice (Fig 17A, B). The areas north of the Strait include St. Patrick s, St. Andrew s and the Great Bras d Or Channels, and North Basin; East and West Bays, Bras d Or Lake and Denys Basin comprise the areas south of the Strait. On average, ice cover begins to develop in January in both regions, although there are occasions when some cover occurs in December. The peak is reached in early March, with generally greater cover for a longer period in the region north of Barra Strait. Ice cover begins to decease rapidly in April and has generally disappeared by the first week of May. Variations occur from year to year as noted above. One might expect that the air temperature plays a fundamental role in the extent of ice cover. In Fig 18, we show the December to February temperature anomaly at Baddeck plotted against the February to March ice cover. During a normal winter, the temperature anomaly at Baddeck is zero, i.e., it is equal to its long-term average December to February temperature. A warmer than normal winter has a positive anomaly, a colder than normal winter a negative anomaly. Average winters generally give rise to 70% ice cover on the Lakes. For colder than normal temperatures (negative anomalies), cover generally increases, reaching 100% for some years. Warmer than normal winters typically have less than 70% ice cover. Fig 17 (A) Percentage of surface area north of Barra Strait covered by ice on average based on 30 years of data collected by the Atmospheric Environment Service. (B) Percentage of surface area south of Barra Strait covered by ice.
Lesson: Ocean Circulation
 Lesson: Ocean Circulation By Keith Meldahl Corresponding to Chapter 9: Ocean Circulation As this figure shows, there is a connection between the prevailing easterly and westerly winds (discussed in Chapter
Chapter 10 Lecture Outline. The Restless Oceans
 Chapter 10 Lecture Outline The Restless Oceans Focus Question 10.1 How does the Coriolis effect influence ocean currents? The Ocean s Surface Circulation Ocean currents Masses of water that flow from one
The ocean water is dynamic. Its physical
 CHAPTER MOVEMENTS OF OCEAN WATER The ocean water is dynamic. Its physical characteristics like temperature, salinity, density and the external forces like of the sun, moon and the winds influence the movement
SIO 210 Introduction to Physical Oceanography Mid-term examination November 4, 2013; 50 minutes
 SIO 210 Introduction to Physical Oceanography Mid-term examination November 4, 2013; 50 minutes Closed book; one sheet of your own notes is allowed. A calculator is allowed. (100 total points.) Possibly
Nortek Technical Note No.: TN-021. Chesapeake Bay AWAC Evaluation
 Nortek Technical Note No.: TN-021 Title: Chesapeake Bay AWAC Evaluation Last Edited: October 5, 2004 Authors: Eric Siegel-NortekUSA, Chris Malzone-NortekUSA, Torstein Pedersen- Number of Pages: 12 Chesapeake
13. TIDES Tidal waters
 Water levels vary in tidal and non-tidal waters: sailors should be aware that the depths shown on the charts do not always represent the actual amount of water under the boat. 13.1 Tidal waters In tidal
Chapter. The Dynamic Ocean
 Chapter The Dynamic Ocean An ocean current is the mass of ocean water that flows from one place to another. 16.1 The Composition of Seawater Surface Circulation Surface Currents Surface currents are movements
Winds and Ocean Circulations
 Winds and Ocean Circulations AT 351 Lab 5 February 20, 2008 Sea Surface Temperatures 1 Temperature Structure of the Ocean Ocean Currents 2 What causes ocean circulation? The direction of most ocean currents
Lecture Outlines PowerPoint. Chapter 15 Earth Science, 12e Tarbuck/Lutgens
 Lecture Outlines PowerPoint Chapter 15 Earth Science, 12e Tarbuck/Lutgens 2009 Pearson Prentice Hall This work is protected by United States copyright laws and is provided solely for the use of instructors
The Composition of Seawater
 The Composition of Seawater Salinity Salinity is the total amount of solid material dissolved in water. Most of the salt in seawater is sodium chloride, common table salt. Element Percent Element Percent
Deep Water Currents Lab
 Deep Water Currents Lab Background: Anyone visiting the seashore is struck by the constant motion of water traveling on the surface of the ocean in the form of waves. But beneath the ocean's surface, water
Appendix 5: Currents in Minas Basin. (Oceans Ltd. 2009)
") Appendix 5: Currents in Minas Basin (Oceans Ltd. 29) Current in Minas Basin May 1, 28 March 29, 29 Submitted To: Minas Basin Pulp and Power P.O. Box 41 53 Prince Street Hansport, NS, BP 1P by 22, Purdy
Appendix 5: Currents in Minas Basin (Oceans Ltd. 29) Current in Minas Basin May 1, 28 March 29, 29 Submitted To: Minas Basin Pulp and Power P.O. Box 41 53 Prince Street Hansport, NS, BP 1P by 22, Purdy
Chapter 11 Tides. A tidal bore is formed when a tide arrives to an enclosed river mouth. This is a forced wave that breaks.
 Chapter 11 Tides A tidal bore is formed when a tide arrives to an enclosed river mouth. This is a forced wave that breaks. Tidal range can be very large Tide - rhythmic oscillation of the ocean surface
Figure 4, Photo mosaic taken on February 14 about an hour before sunset near low tide.
 The Impact on Great South Bay of the Breach at Old Inlet Charles N. Flagg and Roger Flood School of Marine and Atmospheric Sciences, Stony Brook University Since the last report was issued on January 31
170 points. 38 points In your textbook, read about modern oceanography. For each item write the word that meets the description.
 Ch 15 Earth s Oceans SECTION 15.1 An Overview of Oceans 38 points In your textbook, read about modern oceanography. For each item write the word that meets the description. (5 points) 1. German research
The Movement of Ocean Water. Currents
 The Movement of Ocean Water Currents Ocean Current movement of ocean water that follows a regular pattern influenced by: weather Earth s rotation position of continents Surface current horizontal movement
Introduction to Physical Oceanography STUDENT NOTES Date: 1. What do you know about solar radiation at different parts of the world?
 Introduction to Physical Oceanography STUDENT NOTES Date: 1 Warm up What do you know about solar radiation at different parts of the world? What affect does the tilt of the Earth have on the northern and
7.4 Temperature, Salinity and Currents in Jamaica Bay
 7.4 Temperature, Salinity and Currents in Jamaica Bay Arnold Gordon, Bruce Huber and Robert Houghton 7.4.1 INTRODUCTION Jamaica Bay stratification is weakly indicative of a shallow, tidally active environment,
EARTH, PLANETARY, & SPACE SCIENCES 15 INTRODUCTION TO OCEANOGRAPHY. LABORATORY SESSION #6 Fall Ocean Circulation
 EARTH, PLANETARY, & SPACE SCIENCES 15 INTRODUCTION TO OCEANOGRAPHY LABORATORY SESSION #6 Fall 2017 Ocean Circulation The focus of the Lab this week is circulation of the ocean and atmosphere. Here, you
OCEANOGRAPHY STUDY GUIDE
 OCEANOGRAPHY STUDY GUIDE Chapter 2 Section 1 1. Most abundant salt in ocean. Sodium chloride; NaCl 2. Amount of Earth covered by Water 71% 3. Four oceans: What are they? Atlantic, Pacific, Arctic, Indian
THE RESPONSE OF THE GULF OF MAINE COASTAL CURRENT SYSTEM TO LATE-SPRING
 THE RESPONSE OF THE GULF OF MAINE COASTAL CURRENT SYSTEM TO LATE-SPRING NORTHEASTERLY WIND FORCING Neal R Pettigrew and Huijie Xue School of Marine Sciences University of Maine, Orono ME 04469 The Gulf
What is an Estuary? Importance of Estuaries. Importance of Estuaries. Importance of Estuaries
 Oceanography 101, Richard Strickland Lecture 20 What is an Estuary? Portion of the ocean that is semi-enclosed by land and diluted by freshwater runoff All estuaries are embayments But embayments without
Chapter 2. Turbulence and the Planetary Boundary Layer
 Chapter 2. Turbulence and the Planetary Boundary Layer In the chapter we will first have a qualitative overview of the PBL then learn the concept of Reynolds averaging and derive the Reynolds averaged
Chapter 22, Section 1 - Ocean Currents. Section Objectives
 Chapter 22, Section 1 - Ocean Currents Section Objectives Intro Surface Currents Factors Affecting Ocean Currents Global Wind Belts (you should draw and label a diagram of the global wind belts) The Coriolis
Section 1. Global Wind Patterns and Weather. What Do You See? Think About It. Investigate. Learning Outcomes
 Chapter 5 Winds, Oceans, Weather, and Climate Section 1 Global Wind Patterns and Weather What Do You See? Learning Outcomes In this section, you will Determine the effects of Earth s rotation and the uneven
Ocean Motion Notes. Chapter 13 & 14
 Ocean Motion Notes Chapter 13 & 14 What is a Wave? Wave: movement of energy through a body of water How are Waves Caused? Caused mostly by wind Wind blowing on the water transmits energy to the water Size
Section 6. The Surface Circulation of the Ocean. What Do You See? Think About It. Investigate. Learning Outcomes
 Chapter 5 Winds, Oceans, Weather, and Climate Section 6 The Surface Circulation of the Ocean What Do You See? Learning Outcomes In this section, you will Understand the general paths of surface ocean currents.
Questions # 4 7 refer to Figure # 2 (page 321, Fig )
") Shoreline Community College OCEANOGRAPHY 101 Fall 2006 Sample Exam # 3 Instructor: Linda Khandro Questions # 1 3 refer to Figure # 1 (page 284, Fig 11.7) 1. At which position is the moon in its new moon
Shoreline Community College OCEANOGRAPHY 101 Fall 2006 Sample Exam # 3 Instructor: Linda Khandro Questions # 1 3 refer to Figure # 1 (page 284, Fig 11.7) 1. At which position is the moon in its new moon
Currents measurements in the coast of Montevideo, Uruguay
 Currents measurements in the coast of Montevideo, Uruguay M. Fossati, D. Bellón, E. Lorenzo & I. Piedra-Cueva Fluid Mechanics and Environmental Engineering Institute (IMFIA), School of Engineering, Research
Earth s oceans covers 71 % _ of the planet s surface. In reality, Earth s ocean waters are all. interconnected as part of a single large global ocean.
 Ocean Motion Met 101: Introduction to the World's Oceans Produced by The COMET Program Geography: Name Pd. Earth s oceans covers 71 % _ of the planet s surface. In reality, Earth s ocean waters are all
SURFACE CURRENTS AND TIDES
 NAME SURFACE CURRENTS AND TIDES I. Origin of surface currents Surface currents arise due to the interaction of the prevailing wis a the ocean surface. Hence the surface wi pattern (Figure 1) plays a key
A Hare-Lynx Simulation Model
 1 A Hare- Simulation Model What happens to the numbers of hares and lynx when the core of the system is like this? Hares O Balance? S H_Births Hares H_Fertility Area KillsPerHead Fertility Births Figure
Duckies have been found in Hawaii, Alaska, S. America, Scotland, Washington state and Australia as of 2012.
 Duckies have been found in Hawaii, Alaska, S. America, Scotland, Washington state and Australia as of 2012. We learned that it takes 3 years to complete one circuit of the North Pacific Gyre flow in the
Introduction to Oceanography OCE 1001
 Introduction to Oceanography OCE 1001 Lecture Notes Chantale Bégin & Jessica Fry Version 2.1 10. Ocean Circulation (Trujillo, Chapter 7) Major ocean currents are stable and predictable; they have been
(20 points) 1. ENSO is a coupled climate phenomenon in the tropical Pacific that has both regional and global impacts.
 1. ENSO is a coupled climate phenomenon in the tropical Pacific that has both regional and global impacts.") SIO 210 Problem Set 4 Answer key December 1, 2014 Due Dec. 12, 2014 (20 points) 1. ENSO is a coupled climate phenomenon in the tropical Pacific that has both regional and global impacts. (2 points) a)
SIO 210 Problem Set 4 Answer key December 1, 2014 Due Dec. 12, 2014 (20 points) 1. ENSO is a coupled climate phenomenon in the tropical Pacific that has both regional and global impacts. (2 points) a)
Wednesday, September 20, 2017 Reminders. Week 3 Review is now available on D2L (through Friday) Exam 1, Monday, September 25, Chapters 1-4
 Exam 1, Monday, September 25, Chapters 1-4") Wednesday, September 20, 2017 Reminders Week 3 Review is now available on D2L (through Friday) Exam 1, Monday, September 25, Chapters 1-4 PLEASE don t memorize equations, but know how to recognize them
Wednesday, September 20, 2017 Reminders Week 3 Review is now available on D2L (through Friday) Exam 1, Monday, September 25, Chapters 1-4 PLEASE don t memorize equations, but know how to recognize them
Ocean Layers. Based on sunlight penetration: Based on water density: Sunlight (photosynthesis is possible) Twilight Midnight
 Twilight Midnight") PART 3 Ocean Layers Based on sunlight penetration: Sunlight (photosynthesis is possible) Twilight Midnight Based on water density: Mixed layer Pycnocline (rapid change of themperature/salinity) Deep ocean
PART 3 Ocean Layers Based on sunlight penetration: Sunlight (photosynthesis is possible) Twilight Midnight Based on water density: Mixed layer Pycnocline (rapid change of themperature/salinity) Deep ocean
Please find our detailed response to Reviewer 2 below. Reviewer comments are in black and our responses are in blue.
 Re: Biogeosciences manuscripb bg-2017-428 Author Comment in response to Review 2 Dear Editor and Reviewers: We would like to thank Reviewer 2 for their thorough review of the manuscript. Reviewer 2 felt
page - Laboratory Exercise #5 Shoreline Processes
 page - Laboratory Exercise #5 Shoreline Processes Section A Shoreline Processes: Overview of Waves The ocean s surface is influenced by three types of motion (waves, tides and surface currents). Shorelines
Oceanography 10. Tides Study Guide (7A)
") Tides Study Guide (Topic 7A) page 1 Oceanography 10 Name: Tides Study Guide (7A) Note: Do not forget to include the units of your answers. 1. Use the tide chart below to determine the height and time of
Tides Study Guide (Topic 7A) page 1 Oceanography 10 Name: Tides Study Guide (7A) Note: Do not forget to include the units of your answers. 1. Use the tide chart below to determine the height and time of
Wednesday, September 27, 2017 Test Monday, about half-way through grading. No D2L Assessment this week, watch for one next week
 Wednesday, September 27, 2017 Test Monday, about half-way through grading No D2L Assessment this week, watch for one next week Homework 3 Climate Variability (due Monday, October 9) Quick comment on Coriolis
OCN201 Spring14 1. Name: Class: Date: True/False Indicate whether the statement is true or false.
 Name: Class: _ Date: _ OCN201 Spring14 1 True/False Indicate whether the statement is true or false. 1. Short residence time elements are uniformly distributed in the oceans 2. Thermohaline circulation
Geostrophic and Tidal Currents in the South China Sea, Area III: West Philippines
 Southeast Asian Fisheries Development Center Geostrophic and Tidal Currents in the South China Sea, Area III: West Philippines Anond Snidvongs Department od Marine Science, Chulalongkorn University, Bangkok
Chapter 9 Insolation control of monsoons 2004/4/15
 Chapter 9 Insolation control of monsoons 2004/4/15 Introduction Monsoon circulations exist on Earth today because the land responds to seasonal changes in solar radiation much more quickly than does the
Greenhouse Effect Activity
 Greenhouse Effect Activity Objectives: The student will: 1. Read and use weather instruments. 2. Collect and record temperature readings. 3. Describe the concept of the greenhouse effect. Materials: Fish
Chapter 7 Weather and Climate
 Chapter 7 Weather and Climate *Describe what weather is, what affects it, and where it occurs. *Explain the connection between air pressure and wind. * *Many factors affect a region s weather. * *atmosphere
3.6 Magnetic surveys. Sampling Time variations Gradiometers Processing. Sampling
 3.6 Magnetic surveys Sampling Time variations Gradiometers Processing Sampling Magnetic surveys can be taken along profiles or, more often, on a grid. The data for a grid is usually taken with fairly frequent
V. SEA and LAND BREEZES:
 V. SEA and LAND BREEZES: A. Pressure largely reflects the weight of overlying air, owing to gravity, and is proportional to mass. Therefore pressure decreases with height. 1. Remember, surface pressure
Ocean Currents that Redistribute Heat Globally
 Ocean Currents that Redistribute Heat Globally Ocean Circulation Ocean Currents Fig. CO7 OCEAN CURRENTS Surface ocean currents are similar to wind patterns: 1. Driven by Coriolis forces 2. Driven by winds
Name Date L.O: SWBAT explain what breezes, planetary winds, ocean currents & monsoons are.
 Name Date L.O: SWBAT explain what breezes, planetary winds, ocean currents & monsoons are. 1. A cool breeze is blowing toward the land from the ocean on a warm, cloudless summer day. This condition is
OCN 201 Lab Fall 2009 OCN 201. Lab 9 - El Niño
 OCN 201 Lab Fall 2009 OCN 201 Lab 9 - El Niño El Niño is probably one of the most widely publicized oceanic phenomena. If there s one single reason for that it s probably the fact that El Niño s presence
The Impact on Great South Bay of the Breach at Old Inlet Charles N. Flagg School of Marine and Atmospheric Sciences, Stony Brook University
 The Impact on Great South Bay of the Breach at Old Inlet Charles N. Flagg School of Marine and Atmospheric Sciences, Stony Brook University The previous report provided a detailed look at the conditions
OCN-201 Chemistry and Physics section
 Name: Class: _ Date: _ OCN-201 Chemistry and Physics section True/False Indicate whether the statement is true or false. 1. Because of the dissolved salt in seawater its freezing point is lower than that
CHAPTER 7 Ocean Circulation
 1 2 3 4 5 6 7 8 9 10 11 12 13 14 CHAPTER 7 Ocean Circulation Words Ocean currents Moving seawater Surface ocean currents Transfer heat from warmer to cooler areas Similar to pattern of major wind belts
Midterm Exam III November 25, 2:10
 Midterm Exam III November 25, 2:10 25, 2:10 3:25 pm, HW714 Chapters 7 (7.12 7.17), 8 and 9 (through section 9.15, included) 60 multiple choice questions this exam constitutes 22% (only) of your total (overall)
Write about this. Have you ever experienced a very strong wind gust? What happened? Have you ever felt a gentle breeze? What did it feel like?
 Write about this. Have you ever experienced a very strong wind gust? What happened? Have you ever felt a gentle breeze? What did it feel like? How wind works Winds flow on earth based on differences in
MAR 555 Lecture 20: Coastal Tides
 MAR 555 Lecture 20: Coastal Tides Tides caused by the resulting gravitational and centrifugal forces is called equilibrium tide. They can be expressed using the harmonic functions as N semi! e(semi) =
The movement of ocean water is a powerful thing. Waves created
 16. Waves and Tides Section 16. 1 FOCUS Key Concepts From where do ocean waves obtain their energy? What three factors affect the characteristics of a wave? How does energy move through a wave? What force
Monday, October 2, Watch for new assessment (Week 4/5 review) TA s have your tests, please see key (at course website)
 TA s have your tests, please see key (at course website)") Monday, October 2, 2017 Watch for new assessment (Week 4/5 review) TA s have your tests, please see key (at course website) Homework 3 Due date Wednesday, Oct 11 (8 pm) Be ready to watch another important
Monday, October 2, 2017 Watch for new assessment (Week 4/5 review) TA s have your tests, please see key (at course website) Homework 3 Due date Wednesday, Oct 11 (8 pm) Be ready to watch another important
COMPARISON OF DEEP-WATER ADCP AND NDBC BUOY MEASUREMENTS TO HINDCAST PARAMETERS. William R. Dally and Daniel A. Osiecki
 COMPARISON OF DEEP-WATER ADCP AND NDBC BUOY MEASUREMENTS TO HINDCAST PARAMETERS William R. Dally and Daniel A. Osiecki Surfbreak Engineering Sciences, Inc. 207 Surf Road Melbourne Beach, Florida, 32951
WIND SPEED LENGTH OF TIME WIND BLOWS (Duration) DISTANCE OVER WHICH IT BLOWS (Fetch)
 DISTANCE OVER WHICH IT BLOWS (Fetch)") WAVES Up and down movement of ocean surface Transportation of energy across the water over vast distances If not stopped by anything, waves can travel entire oceans Size and speed depend upon: WIND SPEED
WAVES Up and down movement of ocean surface Transportation of energy across the water over vast distances If not stopped by anything, waves can travel entire oceans Size and speed depend upon: WIND SPEED
Directed Reading. Section: Ocean Currents. a(n). FACTORS THAT AFFECT SURFACE CURRENTS
. FACTORS THAT AFFECT SURFACE CURRENTS") Skills Worksheet Directed Reading Section: Ocean Currents 1. A horizontal movement of water in a well-defined pattern is called a(n). 2. What are two ways that oceanographers identify ocean currents? 3.
Skills Worksheet Directed Reading Section: Ocean Currents 1. A horizontal movement of water in a well-defined pattern is called a(n). 2. What are two ways that oceanographers identify ocean currents? 3.
Lecture 13 El Niño/La Niña Ocean-Atmosphere Interaction. Idealized 3-Cell Model of Wind Patterns on a Rotating Earth. Previous Lecture!
 Lecture 13 El Niño/La Niña Ocean-Atmosphere Interaction Previous Lecture! Global Winds General Circulation of winds at the surface and aloft Polar Jet Stream Subtropical Jet Stream Monsoons 1 2 Radiation
Equilibrium Model of Tides
 Tides Outline Equilibrium Theory of Tides diurnal, semidiurnal and mixed semidiurnal tides spring and neap tides Dynamic Theory of Tides rotary tidal motion larger tidal ranges in coastal versus open-ocean
A STUDY OF THE PHYSICAL ENVIRONMENT AND WATER CIRCULATION IN FARWA LAGOON, LIBYA
 131 A STUDY OF THE PHYSICAL ENVIRONMENT AND WATER CIRCULATION IN FARWA LAGOON, LIBYA 1 2 M. GERGES and A. DURGHAM 1 UNESCO E:x:pex>t at MRC 2Marine Scientist at MB.C, TX'ipoU, Libya, S.P.L.A.J. ABSTRACT
FINAL REPORT APPENDIX A. Physical Description of the Shubenacadie River
 FINAL REPORT APPENDIX A Physical Description of the Shubenacadie River Smart Solutions for Engineering, Science and Computing Physical Description of the Shubenacadie River Martec Technical Report # TR-07-12
SOME WATER CHARACTERISTICS OF ESTUARIES IN INDONESIA
 SOME WATER CHARACTERISTICS OF ESTUARIES IN INDONESIA by HENK L. UKTOLSEYA 1 ABSTRACT This paper describes the results obtained during several hydro-oceanographical observations of some estuaries in Indonesia
Water circulation in Dabob Bay, Washington: Focus on the exchange flows during the diurnal tide transitions
 Water circulation in Dabob Bay, Washington: Focus on the exchange flows during the diurnal tide transitions Jeong-in Kang School of Oceanography University of Washington (206) 349-7319 nortiumz@u.washington.edu
Ocean Circulation. Si Hui Lee and Frances Wen. You can access ME at
 Ocean Circulation Si Hui Lee and Frances Wen You can access ME at http://tinyurl.com/oceancirculation Earth - the blue planet - 71% area covered by the oceans - 3/4 of ocean area between 3000-6000m deep
The Coriolis force, geostrophy, Rossby waves and the westward intensification
 Chapter 3 The Coriolis force, geostrophy, Rossby waves and the westward intensification The oceanic circulation is the result of a certain balance of forces. Geophysical Fluid Dynamics shows that a very
The Ocean is a Geophysical Fluid Like the Atmosphere. The Physical Ocean. Yet Not Like the Atmosphere. ATS 760 Global Carbon Cycle The Physical Ocean
 The Physical Ocean The Ocean is a Geophysical Fluid Like the Atmosphere Three real forces: Gravity Pressure gradients Friction Two apparent forces: Coriolis and Centrifugal Geostrophic & Hydrostatic balances
WOODFIBRE LNG VESSEL WAKE ASSESSMENT
 Woodfibre LNG Limited WOODFIBRE LNG VESSEL WAKE ASSESSMENT Introduction Woodfibre LNG Limited (WLNG) intends to build a new LNG export terminal at Woodfibre, Howe Sound, British Columbia. WLNG has engaged
Garrett McNamara, Portugal, 30 Jan What is a wave?
 Waves Garrett McNamara, Portugal, 30 Jan 2013 What is a wave? Waves transmit a disturbance / energy from one part of a material to another. The energy is transmitted without substantial movement of the
OCN 201 Tides. Tsunamis, Tides and other long waves
 OCN 201 Tides Tsunamis, Tides and other long waves Storm surges Caused by winds and low atmospheric pressure associated with large storms Can raise sea surface by up to 25 ft, bottom contours magnify effect
The Causes of Ocean Circulation
 Activity 1 The Causes of Ocean Circulation Goals In this activity you will: Understand the effect of the wind on the movement of water at the ocean surface. Understand the effect of the Coriolis force
PROPERTIES OF NEARSHORE CURRENTS
 Terry Hendricks PROPERTIES OF NEARSHORE CURRENTS During this past year, we have initiated a program to obtain a better understanding of the properties of the currents flowing over the nearshore shelf area
Undertow - Zonation of Flow in Broken Wave Bores
 Lecture 22 Nearshore Circulation Undertow - Zonation of Flow in Broken Wave Bores In the wave breaking process, the landward transfer of water, associated with bore and surface roller decay within the
Assessment Schedule 2016 Earth and Space Science: Demonstrate understanding of processes in the ocean system (91413)
") NCEA Level 3 Earth & Space Science (91413) 2016 page 1 of 6 Assessment Schedule 2016 Earth and Space Science: Demonstrate processes in the ocean system (91413) Evidence Statement Q Evidence with with Excellence
NCEA Level 3 Earth & Space Science (91413) 2016 page 1 of 6 Assessment Schedule 2016 Earth and Space Science: Demonstrate processes in the ocean system (91413) Evidence Statement Q Evidence with with Excellence
Make a Marigram. Overview: Targeted Alaska Grade Level Expectations: Objectives: Materials: Whole Picture: Grades 9-12
 Make a Marigram Overview: In this lesson, students briefly examine the use of acoustics for data collection then use Microsoft Excel to analyze tide gauge data. Basic knowledge of Microsoft Excel is recommended.
What is a wave? Even here the wave more or less keeps it s shape and travelled at a constant speed. YouTube. mexicanwave.mov
 Waves What is a wave? Waves transmit a disturbance / energy from one part of a material to another. The energy is transmitted without substantial movement of the material. Waves occur in lots of places,
RECTIFICATION OF THE MADDEN-JULIAN OSCILLATION INTO THE ENSO CYCLE
 RECTIFICATION OF THE MADDEN-JULIAN OSCILLATION INTO THE ENSO CYCLE By William S. Kessler and Richard Kleeman Journal of Climate Vol.13, 1999 SWAP, May 2009, Split, Croatia Maristella Berta What does give
MAR 110 LECTURE #16 Tides
 MAR 110: Lecture 16 Outline Tides 1 MAR 110 LECTURE #16 Tides Tides Are Waves Tidal wave energy is concentrated at periods of approximately 12 and 24 hours. (ItO) Equilibrium Tidal Forcing The theoretical
Lecture 5.1 Surface Ocean Circulation. Image from Daily Mail Newspaper, UK
 Lecture 5.1 Surface Ocean Circulation Image from Daily Mail Newspaper, UK Announcements Midterm is Thursday, consists of 25 multiple choice, 3 pages short answer questions No Scantron needed Calculators,
SECTION 2 HYDROLOGY AND FLOW REGIMES
 SECTION 2 HYDROLOGY AND FLOW REGIMES In this section historical streamflow data from permanent USGS gaging stations will be presented and discussed to document long-term flow regime trends within the Cache-Bayou
Sea and Land Breezes METR 4433, Mesoscale Meteorology Spring 2006 (some of the material in this section came from ZMAG)
") Sea and Land Breezes METR 4433, Mesoscale Meteorology Spring 2006 (some of the material in this section came from ZMAG) 1 Definitions: The sea breeze is a local, thermally direct circulation arising from
Sea and Land Breezes METR 4433, Mesoscale Meteorology Spring 2006 (some of the material in this section came from ZMAG) 1 Definitions: The sea breeze is a local, thermally direct circulation arising from
TRIAXYS Acoustic Doppler Current Profiler Comparison Study
 TRIAXYS Acoustic Doppler Current Profiler Comparison Study By Randolph Kashino, Axys Technologies Inc. Tony Ethier, Axys Technologies Inc. Reo Phillips, Axys Technologies Inc. February 2 Figure 1. Nortek
Tides Unit III: Real Tides (2 pts)
") T. James Noyes, El Camino College Tides Unit III: Real Tides (Topic 7A-3) page 1 Name: Section: Tides Unit III: Real Tides (2 pts) Real Tides Real tides can differ significantly from the predictions of
T. James Noyes, El Camino College Tides Unit III: Real Tides (Topic 7A-3) page 1 Name: Section: Tides Unit III: Real Tides (2 pts) Real Tides Real tides can differ significantly from the predictions of
E4014 Construction Surveying. Hydrographic Surveys
 E4014 Construction Surveying Hydrographic Surveys Charts And Maps Hydrographic Chart an information medium and a tool for maritime traffic for the safety and ease of navigation contains information on
9.3. Storing Thermal Energy. Transferring Thermal Energy
 9.3 If you have been to a beach on a hot summer day, you have likely cooled off by going for a dip in the water. The water, which is cooler than you are, removes thermal energy from your body, making you
SIO 210 MIDTERM, 26 October 2009.
 SIO 210 MIDTERM, 26 October 2009. Please mark your answers on the attached answer sheet, and turn in ONLY THE ANSWER SHEET. Donʼt forget to put your name on the answer sheet!! Here are some constants,
Atmospheric & Ocean Circulation- I
 Atmospheric & Ocean Circulation- I First: need to understand basic Earth s Energy Balance 1) Incoming radiation 2) Albedo (reflectivity) 3) Blackbody Radiation Atm/ Ocean movement ultimately derives from
Wave Motion. interference destructive interferecne constructive interference in phase. out of phase standing wave antinodes resonant frequencies
 Wave Motion Vocabulary mechanical waves pulse continuous periodic wave amplitude period wavelength period wave velocity phase transverse wave longitudinal wave intensity displacement amplitude phase velocity
Module 3, Investigation 1: Briefing 1 What are the effects of ENSO?
 Background The changing temperatures of the tropical Pacific Ocean affect climate variability all over Earth. Ocean warming and cooling dramatically affect human activities by changing weather patterns
ATMOSPHERIC CIRCULATION
 Name ATMOSPHERIC CIRCULATION (adapted from Dr. S. Postawko, U. of Ok.) INTRODUCTION Why does the wind blow? Why do weather systems in the mid-latitudes typically move from west to east? Now that we've
Ocean Current Worksheet
 Ocean Current Worksheet Temperature Affects and Surface Currents: Surface waters of the Earth s oceans are forced to move, primarily by winds. Where winds blow in the same direction for a long period of
1 Currents. TAKE A LOOK 2. Read a Map In what direction does the Gulf Stream flow?
 CHAPTER 5 1 Currents SECTION The Movement of Ocean Water BEFORE YOU READ After you read this section, you should be able to answer these questions: What factors affect ocean currents? Why are ocean currents
GEOGRAPHY - STD 8 [ ] Q1.
![GEOGRAPHY - STD 8 [ ] Q1.](/thumbs/84/90631870.jpg "GEOGRAPHY - STD 8 [ ] Q1.") GEOGRAPHY - STD 8 Movements of Oceans [2016-2017] Q1. Name the two types of regular movements in the oceans. Ans. The regular movements in the ocean are of two types: 1. Horizontal Ocean currents 2. Vertical
GEOGRAPHY - STD 8 Movements of Oceans [2016-2017] Q1. Name the two types of regular movements in the oceans. Ans. The regular movements in the ocean are of two types: 1. Horizontal Ocean currents 2. Vertical
Types of Estuaries and Mixing Patterns. Mrs. Stahl Marine Science Honors
 Types of Estuaries and Mixing Patterns Mrs. Stahl Marine Science Honors Coastal Plain Form between glacial periods, when water from melting glaciers raises the sea level and floods coastal plains and low
Advanced Hydraulics Prof. Dr. Suresh A. Kartha Department of Civil Engineering Indian Institute of Technology, Guwahati
 Advanced Hydraulics Prof. Dr. Suresh A. Kartha Department of Civil Engineering Indian Institute of Technology, Guwahati Module - 4 Hydraulic Jumps Lecture - 1 Rapidly Varied Flow- Introduction Welcome
Undertow - Zonation of Flow in Broken Wave Bores
 Nearshore Circulation Undertow and Rip Cells Undertow - Zonation of Flow in Broken Wave Bores In the wave breaking process, the landward transfer of water, associated with bore and surface roller decay