Chapter 19 Air Pressure and Wind
|
|
|
- Jeffrey James
- 6 years ago
- Views:
Transcription

1 Chapter 19 Air Pressure and Wind Section 1 Understanding Air Pressure Key Concepts Describe how air pressure is exerted on objects. What happens to the mercury column of a barometer when air pressure changes? What is the ultimate energy source for wind? How does the Coriolis effect influence free-moving objects? Vocabulary air pressure barometer pressure gradient Coriolis effect jet stream Of the various elements of weather and climate, changes in air pressure are the least noticeable. When you listen to a weather report, you probably focus on precipitation, temperature, and humidity. Most people don t wonder about air pressure. Although you might not perceive hour-to-hour and day-to-day variations in air pressure, they are very important in producing changes in our weather. For example, variations in air pressure from place to place can generate winds like those shown in Figure 1. The winds, in turn, bring change in temperature and humidity. Air pressure is one of the basic weather elements and is an important factor in weather forecasting. Air pressure is closely tied to the other elements of weather in a cause-and-effect relationship. Figure 1 These palm trees in Corpus Christi, Texas, are buffeted by hurricane-force winds. Air Pressure Defined Air pressure is simply the pressure exerted by the weight of air above. Average air pressure at sea level is about 1 kilogram per square centimeter. This pressure is roughly the same pressure that is produced by a column of water 10 meters in height. You can calculate that the air pressure exerted on the top of a 50-centimeter-by-100- centimeter school desk exceeds 5000 kilograms, which is about the mass of a 50-passenger school bus. Why doesn t the desk collapse under the weight of the air above it? Air pressure is exerted in all directions down, up, and sideways. The air pressure pushing down on an object exactly balances the air pressure pushing up on the object. Imagine a tall aquarium that has the same dimensions as the desktop in the previous example. When this aquarium is filled to a height of 10 meters, the water pressure at the bottom equals 1 atmosphere, or 1 kilogram per square

2 centimeter. Now imagine what will happen if this aquarium is placed on top of a student desk so that all the force is directed downward. The desk collapses because the pressure downward is greater than the pressure exerted in the other directions. When the desk is placed inside the aquarium and allowed to sink to the bottom, however, the desk does not collapse in the water because the water pressure is exerted in all directions, not just downward. The desk, like your body, is built to withstand the pressure of 1 atmosphere. Measuring Air Pressure When meteorologists measure atmospheric pressure, they use a unit called the millibar. Standard sea-level pressure is millibars. You might have heard the phrase inches of mercury, which is used by the media to describe atmospheric pressure. This expression dates from 1643, when Torricelli, a student of the famous Italian scientist Galileo, invented the mercury barometer. A barometer is a device used for measuring air pressure (bar = pressure, metron = measuring instrument). Torricelli correctly described the atmosphere as a vast ocean of air that exerts pressure on us and all objects around us. To measure this force, he filled a glass tube, closed at one end, with mercury. He then put the tube upside down into a dish of mercury, as shown in Figure 2A. The mercury flowed out of the tube until the weight of the column was balanced by the pressure that the atmosphere exerted on the surface of the mercury in the dish. In other words, the weight of mercury in the column (tube) equaled the weight of the same size column of air that extended from the ground to the top of the atmosphere. Figure 2 A Mercury Barometer Standard atmospheric pressure at sea level is inches of mercury. B Aneroid Barometer The recording mechanism provides a continuous record of pressure changes over time. Applying Concepts Why would a continuous record help weather forecasters? When air pressure increases, the mercury in the tube rises. When air pressure decreases, so does the height of the mercury column. With some improvements, the mercury barometer is still the standard instrument used today for measuring air pressure. The need for a smaller and more portable instrument for measuring air pressure led to the development of the aneroid barometer. The aneroid barometer uses a metal chamber with some air removed. This partially emptied chamber is extremely sensitive to variations in air pressure. It changes shape and compresses as the air pressure

3 increases, and it expands as the pressure decreases. One advantage of the aneroid barometer is that it can be easily connected to a recording device, shown in Figure 2B. The device provides a continuous record of pressure changes with the passage of time. Factors Affecting Wind As important as vertical motion is, far more air moves horizontally, the phenomenon we call wind. What causes wind? Wind is the result of horizontal differences in air pressure. Air flows from areas of higher pressure to areas of lower pressure. You may have experienced this flow of air when opening a vacuum-packed can of coffee or tennis balls. The noise you hear is caused by air rushing from the higher pressure outside the can to the lower pressure inside. Wind is nature s way of balancing such inequalities in air pressure. The unequal heating of Earth s surface generates pressure differences. Solar radiation is the ultimate energy source for most wind. If Earth did not rotate, and if there were no friction between moving air and Earth s surface, air would flow in a straight line from areas of higher pressure to areas of lower pressure. But both factors do exist so the flow of air is not that simple. Three factors combine to control wind: pressure differences, the Coriolis effect, and friction. Pressure Differences Wind is created from differences in pressure the greater these differences are, the greater the wind speed is. Over Earth s surface, variations in air pressure are determined from barometric readings taken at hundreds of weather stations. These pressure data are shown on a weather map, like the one in Figure 3, using isobars. Isobars are lines on a map that connect places of equal air pressure. The spacing of isobars indicates the amount of pressure change occurring over a given distance. These pressure changes are expressed as the pressure gradient. Q: What is the lowest barometric pressure ever recorded? A: All of the lowest recorded barometric pressures have been associated with strong hurricanes. The record for the United States is 888 millibars (26.20 inches) measured during Hurricane Gilbert in September The world s record, 870 millibars (25.70 inches), occurred during Typhoon Tip, a Pacific hurricane, in October Although tornadoes undoubtedly have produced even lower pressures, they have not been accurately measured. Figure 3 Isobars The distribution of air pressure is shown on weather maps using isobar lines. Wind flags indicate wind speed and direction. Winds blow toward the station circles. Interpreting Visuals Use the data on this map to explain which pressure cell, high or low, has the fastest wind speeds.

4 A steep pressure gradient, like a steep hill, causes greater acceleration of a parcel of air. A less steep pressure gradient causes a slower acceleration. Closely spaced isobars indicate a steep pressure gradient and high winds. Widely spaced isobars indicate a weak pressure gradient and light winds. The pressure gradient is the driving force of wind. The pressure gradient has both magnitude and direction. Its magnitude is reflected in the spacing of isobars. The direction of force is always from areas of higher pressure to areas of lower pressure and at right angles to the isobars. Friction affects wind speed and direction. The Coriolis effect affects wind direction only. Coriolis Effect The weather map in Figure 3 shows typical air movements associated with high- and low-pressure systems. Air moves out of the regions of higher pressure and into the regions of lower pressure. However, the wind does not cross the isobars at right angles as you would expect based solely on the pressure gradient. This change in movement results from Earth s rotation and has been named the Coriolis effect. The Coriolis effect describes how Earth s rotation affects moving objects. All free-moving objects or fluids, including the wind, are deflected to the right of their path of motion in the Northern Hemisphere. In the Southern Hemisphere, they are deflected to the left. The reason for this deflection is illustrated in Figure 4. Imagine the path of a rocket launched from the North Pole toward a target located on the equator. The true path of this rocket is straight, and the path would appear to be straight to someone out in space looking down at Earth. However, to someone standing on Earth, it would look as if the rocket swerved off its path and landed 15 degrees to the west of its target. This slight change in direction happens because Earth would have rotated 15 degrees to the east under the rocket during a one-hour flight. The counterclockwise rotation of the Northern Hemisphere causes path deflection to the right. In the Southern Hemisphere, the clockwise rotation produces a similar deflection, but to the left of the path of motion. Figure 4 The Coriolis Effect Because Earth rotates 15 each hour, the rocket s path is curved and veers to the right from the North Pole to the equator. Calculating How many degrees does Earth rotate in one day? The apparent shift in wind direction is attributed to the Coriolis effect. This deflection: 1) is always directed at right angles to the direction of airflow; 2) affects only wind direction and not wind speed; 3) is affected by wind speed the stronger the wind, the greater the deflection; and 4) is strongest at the poles and weakens toward the equator, becoming nonexistent at the equator. Friction The effect of friction on wind is important only within a few kilometers of Earth s surface. Friction acts to slow air movement, which changes wind direction. To illustrate friction s effect on wind direction, first think about a situation in which friction does not play a role in wind s direction.

5 When air is above the friction layer, the pressure gradient causes air to move across the isobars. As soon as air starts to move, the Coriolis effect acts at right angles to this motion. The faster the wind speed, the greater the deflection is. The pressure gradient and Coriolis effect balance in high-altitude air, and wind generally flows parallel to isobars, as shown in Figure 5A. The most prominent features of airflow high above the friction layer are the jet streams. Jet streams are fast-moving rivers of air that travel between 120 and 240 kilometers per hour in a west-to-east direction. One such jet stream is situated over the polar front, which is the zone separating the cool polar air from warm subtropical air. Jet streams originally were encountered by high-flying bombers during World War II. Figure 5 A Upper-level wind flow is balanced by the Coriolis effect and pressure gradient forces. B Friction causes surface winds to cross isobars and move toward lower pressure areas. For air close to Earth s surface, the roughness of the terrain determines the angle of airflow across the isobars. Over the smooth ocean surface, friction is low, and the angle of airflow is small. Over rugged terrain, where the friction is higher, winds move more slowly and cross the isobars at greater angles. As shown in Figure 5B, friction causes wind to flow across the isobars at angles as great as 45 degrees. Slower wind speeds caused by friction decrease the Coriolis effect. Section 2 Pressure Centers and Winds Key Concepts Describe how winds blow around pressure centers in the Northern and Southern Hemispheres. What are the air pressure patterns within cyclones and anticyclones? How does friction control net flow of air around a cyclone and an anticylone? How does the atmosphere attempt to balance the unequal heating of Earth s surface? Vocabulary cyclone anticyclone trade winds westerlies polar easterlies polar front monsoon


6 Pressure centers are among the most common features on any weather map. By knowing just a few basic facts about centers of high and low pressure, you can increase your understanding of present and forthcoming weather. You can make some weather generalizations based on pressure centers. For example, centers of low pressure are frequently associated with cloudy conditions and precipitation. By contrast, clear skies and fair weather may be expected when an area is under the influence of high pressure, as shown in Figure 6. Figure 6 These sunbathers at Cape Henlopen, Delaware, are enjoying weather associated with a high-pressure center. Highs and Lows Lows, or cyclones (kyklon = moving in a circle) are centers of low pressure. Highs, or anticyclones, are centers of high pressure. In cyclones, the pressure decreases from the outer isobars toward the center. In anticyclones, just the opposite is the case the values of the isobars increase from the outside toward the center. Cyclonic and Anticyclonic Winds You learned that the two most significant factors that affect wind are the pressure gradient and the Coriolis effect. Winds move from higher pressure to lower pressure and are deflected to the right or left by Earth s rotation. When the pressure gradient and the Coriolis effect are applied to pressure centers in the Northern Hemisphere, winds blow counterclockwise around a low. Around a high, they blow clockwise. Notice the wind directions in Figure 7. Figure 7 This map shows cyclonic and anticyclonic winds in the Northern Hemisphere.

7 In the Southern Hemisphere, the Coriolis effect deflects the winds to the left. Therefore, winds around a low move clockwise. Winds around a high move counterclockwise. In either hemisphere, friction causes a net flow of air inward around a cyclone and a net flow of air outward around an anticyclone. Weather and Air Pressure Rising air is associated with cloud formation and precipitation, whereas sinking air produces clear skies. Imagine a surface low-pressure system where the air is spiraling inward. Here the net inward movement of air causes the area occupied by the air mass to shrink a process called horizontal convergence. Whenever air converges (or comes together) horizontally, it must increase in height to allow for the decreased area it now occupies. This increase in height produces a taller and heavier air column. A surface low can exist only as long as the column of air above it exerts less pressure than does the air in surrounding regions. This seems to be a paradox a low-pressure center causes a net accumulation of air, which increases its pressure. In order for a surface low to exist for very long, converging air at the surface must be balanced by outflows aloft. For example, surface convergence could be maintained if divergence, or the spreading out of air, occurred above the low at a rate equal to the inflow below. Figure 8 shows the relationship between surface convergence (inflow) and divergence (outflow) needed to maintain a low-pressure center. Surface convergence around a cyclone causes a net upward movement. Because rising air often results in cloud formation and precipitation, a low-pressure center is generally related to unstable conditions and stormy weather. Figure 8 Air spreads out, or diverges, above surface cyclones, and comes together, or converges, above surface anticyclones. Applying Concepts Why is fair weather associated with a high? Like cyclones, anticyclones also must be maintained from above. Outflow near the surface is accompanied by convergence in the air above and a general sinking of the air column, as shown in Figure 8. Weather Forecasting Now you can see why weather reports emphasize the locations and possible paths of cyclones and anticyclones. The villain in these reports is always the low-pressure center, which can produce bad weather in any season. Lows move in roughly a west-to-east direction across the United States, and they require a few days, and sometimes more than a week, for the journey. Their paths can be somewhat unpredictable, making accurate estimation of their movement difficult. Because surface conditions are linked to the conditions of the air above, it is important to understand total atmospheric circulation.

8 Global Winds The underlying cause of wind is the unequal heating of Earth s surface. In tropical regions, more solar radiation is received than is radiated back to space. In regions near the poles the opposite is true less solar energy is received than is lost. The atmosphere balances these differences by acting as a giant heat-transfer system. This system moves warm air toward high latitudes and cool air toward the equator. On a smaller scale, but for the same reason, ocean currents also contribute to this global heat transfer. Global circulation is very complex, but you can begin to understand it by first thinking about circulation that would occur on a non-rotating Earth. Reading Checkpoint (a)how does the atmosphere balance the unequal heating of Earth s surface? Non-Rotating Earth Model On a hypothetical non-rotating planet with a smooth surface of either all land or all water, two large thermally produced cells would form, as shown in Figure 9. The heated air at the equator would rise until it reached the tropopause the boundary between the troposphere and the stratosphere. The tropopause, acting like a lid, would deflect this air toward the poles. Eventually, the upper-level airflow would reach the poles, sink, spread out in all directions at the surface, and move back toward the equator. Once at the equator, it would be reheated and begin its journey over again. This hypothetical circulation system has upper-level air flowing toward the pole and surface air flowing toward the equator. Figure 9 Circulation on a Non-Rotating Earth A simple convection system is produced by unequal heating of the atmosphere. Relating Cause And Effect Why would air sink after reaching the poles? Rotating Earth Model If the effect of rotation were added to the global circulation model, the two-cell convection system would break down into smaller cells. Figure 10 illustrates the three pairs of cells that would carry on the task of redistributing heat on Earth. The polar and tropical cells retain the characteristics of the thermally generated convection described earlier. The nature of circulation at the middle latitudes, however, is more complex. Near the equator, rising air produces a pressure zone known as the equatorial low a region characterized by abundant precipitation. As shown in Figure 10, the upper-level flow from the equatorial low reaches 20 to 30

9 degrees, north or south latitude, and then sinks back toward the surface. This sinking of air and its associated heating due to compression produce hot, arid conditions. The center of this zone of sinking dry air is the subtropical high, which encircles the globe near 30 degrees north and south latitude. The great deserts of Australia, Arabia, and the Sahara in North Africa exist because of the stable dry conditions associated with the subtropical highs. Figure 10 Circulation on a Rotating Earth This model of global air circulation proposes three pairs of cells. Interpreting Diagrams Describe the patterns of air circulation at the equatorial and subpolar lows. At the surface, airflow moves outward from the center of the subtropical high. Some of the air travels toward the equator and is deflected by the Coriolis effect, producing the trade winds. Trade winds are two belts of winds that blow almost constantly from easterly directions. The trade winds are located between the subtropical highs and the equator. The remainder of the air travels toward the poles and is deflected, generating the prevailing westerlies of the middle latitudes. The westerlies make up the dominant west-to-east motion of the atmosphere that characterizes the regions on the poleward side of the subtropical highs. As the westerlies move toward the poles, they encounter the cool polar easterlies in the region of the subpolar low. The polar easterlies are winds that blow from the polar high toward the subpolar low. These winds are not constant winds like the trade winds. In the polar region, cold polar air sinks and spreads toward the equator. The interaction of these warm and cool air masses produces the stormy belt known as the polar front. This simplified global circulation is dominated by four pressure zones. The subtropical and polar highs are areas of dry subsiding (sinking) air that flows outward at the surface, producing the prevailing winds. The low-pressure zones of the equatorial and subpolar regions are associated with inward and upward airflow accompanied by clouds and precipitation. Influence of Continents The only truly continuous pressure belt is the subpolar low in the Southern Hemisphere. Here the ocean is uninterrupted by landmasses. At other latitudes, particularly in the Northern Hemisphere where landmasses break up the ocean surface, large seasonal temperature differences disrupt the pressure pattern. Large landmasses, particularly Asia, become cold in the winter when a seasonal high-pressure system develops. From this highpressure system, surface airflow is directed off the land. In the summer, landmasses are heated and develop lowpressure cells, which permit air to flow onto the land as shown in Figure 11. These seasonal changes in wind direction are known as the monsoons. During warm months, areas such as India experience a flow of warm, water-

10 laden air from the Indian Ocean, which produces the rainy summer monsoon. The winter monsoon is dominated by dry continental air. A similar situation exists to a lesser extent over North America. Figure 11 Average Surface Pressure and Associated Global Circulation for July. The ITCZ line stands for the Intertropical Convergence Zone. Section 3 Regional Wind Systems Key Concepts What causes local winds? Describe the general movement of weather in the United States. What happens when unusually strong, warm ocean currents flow along the coasts of Ecuador and Peru? How is a La Niña event triggered? Vocabulary prevailing wind anemometer El Niño Circulation in the middle latitudes is complex and does not fit the convection system described for the tropics. Between about 30 and 60 degrees latitude, the general west-to-east flow, known as the westerlies, is interrupted by migrating cyclones and anticyclones. In the Northern Hemisphere, these pressure cells move from west to east around the globe. Local Winds Small-scale winds produced by a locally generated pressure gradient are known as local winds. The local winds are caused either by topographic effects or by variations in surface composition land and water in the immediate area. Land and Sea Breezes In coastal areas during the warm summer months, the land surface is heated more intensely during the daylight hours than an adjacent body of water is heated. As a result, the air above the land surface heats, expands, and rises, creating an area of lower pressure. As shown in Figure 12, a sea breeze then develops because cooler air over the


11 water at higher pressure moves toward the warmer land and low pressure air. The breeze starts developing shortly before noon and generally reaches its greatest intensity during the mid- to late afternoon. These relatively cool winds can be a moderating influence on afternoon temperatures in coastal areas. Figure 12 Sea Breeze During daylight hours, the air above land heats and rises, creating a local zone of lower air pressure. At night, the reverse may take place. The land cools more rapidly than the sea, and a land breeze develops, as shown in Figure 13. The cooler air at higher pressures over the land moves to the sea, where the air is warmer and at lower pressures. Small-scale sea breezes also can develop along the shores of large lakes. People who live in a city near the Great Lakes, such as Chicago, recognize this lake effect, especially in the summer. They are reminded daily by weather reports of the cool temperatures near the lake as compared to warmer outlying areas. Figure 13 Land Breeze At night, the land cools more rapidly than the sea, generating an offshore flow called a land breeze. Inferring How would the isobar lines be oriented if there was no air pressure change across the land-water boundary? Valley and Mountain Breezes A daily wind similar to land and sea breezes occurs in many mountainous regions. During daylight hours, the air along the slopes of the mountains is heated more intensely than the air at the same elevation over the valley floor. Because this warmer air on the mountain slopes is less dense, it glides up along the slope and generates a valley breeze, as shown in Figure 14A. The occurrence of these daytime upslope breezes can often be identified by the cumulus clouds that develop on adjacent mountain peaks.

12 Figure 14 A Valley Breeze Heating during the day generates warm air that rises from the valley floor. B Mountain Breeze After sunset, cooling of the air near mountain slopes can result in cool air moving into the valley. After sunset, the pattern may reverse. The rapid cooling of the air along the mountain slopes produces a layer of cooler air next to the ground. Because cool air is denser than warm air, it moves downslope into the valley. Such a movement of air, illustrated in Figure 14B, is called a mountain breeze. In the Grand Canyon at night, the sound of cold air rushing down the sides of the canyon can be louder than the sound of the Colorado River below. The same type of cool air drainage can occur in places that have very modest slopes. The result is that the coldest pockets of air are usually found in the lowest spots. Like many other winds, mountain and valley breezes have seasonal preferences. Although valley breezes are most common during the warm season when solar heating is most intense, mountain breezes tend to be more dominant in the cold season. How Wind Is Measured Two basic wind measurements direction and speed are particularly important to the weather observer. Winds are always labeled by the direction from which they blow. A north wind blows from the north toward the south. An east wind blows from the east toward the west. The instrument most commonly used to determine wind direction is the wind vane, shown in the upper right of Figure 15. Wind vanes commonly are located on buildings, and they always point into the wind. The wind direction is often shown on a dial connected to the wind vane. The dial indicates wind direction, either by points of the compass N, NE, E, SE, etc. or by a scale of 0 to 360. On the degree scale, 0 or 360 are north, 90 is east, 180 is south, and 270 is west. Wind Direction When the wind consistently blows more often from one direction than from any other, it is called a prevailing wind. Recall the prevailing westerlies that dominate circulation in the middle latitudes. In the United States, the westerlies consistently move weather from west to east across the continent. Along within this general eastward flow are cells of high and low pressure with the characteristic clockwise and counterclockwise flows. As a result, the winds associated with the westerlies, as measured at the surface, often vary considerably from day to day and from place to place. In contrast, the direction of airflow associated with the trade winds is much more consistent. Wind Speed Shown in the upper left of Figure 15, a cup anemometer (anemo = wind,metron = measuring instrument) is commonly used to measure wind speed. The wind speed is read from a dial much like the speedometer of an automobile. Places where winds are steady and speeds are relatively high are potential sites for tapping wind energy.


13 Figure 15 Wind Vane and Cup Anemometer Interpreting Photographs How does the position of a wind vane tell you which direction the wind is blowing? El Niño and La Niña Look at Figure 16. The cold Peruvian current flows toward the equator along the coasts of Ecuador and Peru. This flow encourages upwelling of cold nutrient-filled waters that are the primary food source for millions of fish, particularly anchovies. Near the end of the year, however, a warm current that flows southward along the coasts of Ecuador and Peru replaces the cold Peruvian current. During the nineteenth century, the local residents named this warm current El Niño ( the child ) after the Christ child because it usually appeared during the Christmas season. Normally, these warm countercurrents last for a few weeks and then give way to the cold Peruvian flow again. Figure 16 Normal Conditions Trade winds and strong equatorial ocean currents flow toward the west. El Niño At irregular intervals of three to seven years, these warm countercurrents become unusually strong and replace normally cold offshore waters with warm equatorial waters. Scientists use the term El Niño for these episodes of ocean warming that affect the eastern tropical Pacific. The onset of El Niño is marked by abnormal weather patterns that drastically affect the economies of Ecuador and Peru. As shown in Figure 17, these unusually strong undercurrents accumulate large quantities of warm water that block the upwelling of colder, nutrient-filled water. As a result, the anchovies starve, devastating the local fishing industry. At the same time, some inland areas that are normally arid receive an abnormal amount of rain. Here, pastures and cotton fields have yields far above the average. These climatic fluctuations have been known for

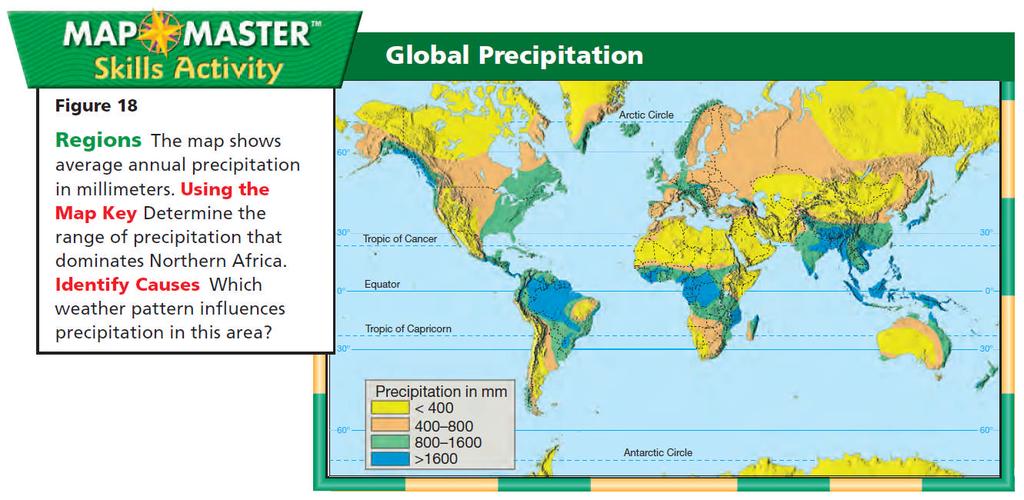
14 years, but they were originally considered local phenomena. It now is understood that El Niño is part of the global circulation and that it affects the weather at great distances from Peru and Ecuador. Figure 17 El Niño Warm countercurrents cause reversal of pressure patterns in the western and eastern Pacific. When an El Niño began in the summer of 1997, forecasters predicted that the pool of warm water over the Pacific would displace the paths of both the subtropical and midlatitude jet streams, as shown in Figure 17. The jet streams steer weather systems across North America. As predicted, the subtropical jet brought rain to the Gulf Coast. Tampa, Florida, received more than three times its normal winter precipitation. The mid-latitude jet pumped warm air far north into the continent. As a result, winter temperatures west of the Rocky Mountains were significantly above normal. La Niña The opposite of El Niño is an atmospheric phenomenon known as La Niña. Once thought to be the normal conditions that occur between two El Niño events, meteorologists now consider La Niña an important atmospheric phenomenon in its own right. Researchers have come to recognize that when surface temperatures in the eastern Pacific are colder than average, a La Niña event is triggered that has a distinctive set of weather patterns. A typical La Niña winter blows colder than normal air over the Pacific Northwest and the northern Great Plains. At the same time, it warms much of the rest of the United States. The Northwest also experiences greater precipitation during this time. During the La Niña winter of , a world-record snowfall for one season occurred in Washington State. La Niña impact can also increase hurricane activity. A recent study concluded that the cost of hurricane damages in the United States is 20 times greater in La Niña years as compared to El Niño years. The effects of both El Niño and La Niña on world climate are widespread and vary greatly. These phenomena remind us that the air and ocean conditions of the tropical Pacific influence the state of weather almost everywhere. Global Distribution of Precipitation Figure 18 shows that the tropical region dominated by the equatorial low is the rainiest region on Earth. It includes the rain forests of the Amazon basin in South America and the Congo basin in Africa. In these areas, the warm, humid trade winds converge to yield abundant rainfall throughout the year. In contrast, areas dominated by the subtropical high-pressure cells are regions of extensive deserts. Variables other than pressure and wind complicate the pattern. For example, the interiors of large land masses commonly experience decreased precipitation. However, you can explain a lot about global precipitation if you apply your knowledge of global winds and pressure systems.
15
Air Pressure and Wind
 Air Pressure and Wind 19.1 Understanding Air Pressure Air Pressure Defined Air pressure is the pressure exerted by the weight of air. Air pressure is exerted in all directions down, up, and sideways. The
Chapter. Air Pressure and Wind
 Chapter Air Pressure and Wind 19.1 Understanding Air Pressure Air Pressure Defined Air pressure is the pressure exerted by the weight of air. 19.1 Understanding Air Pressure Air Pressure Defined Air pressure
18.1 Understanding Air Pressure 18.1 Understanding Air Pressure Air Pressure Defined Measuring Air Pressure Air pressure barometer
 18.1 Understanding Air Pressure 18.1 Understanding Air Pressure Air Pressure Defined Air pressure is the pressure exerted by the weight of air. Air pressure is exerted in all directions down, up, and sideways.
Lecture Outlines PowerPoint. Chapter 18 Earth Science 11e Tarbuck/Lutgens
 Lecture Outlines PowerPoint Chapter 18 Earth Science 11e Tarbuck/Lutgens 2006 Pearson Prentice Hall This work is protected by United States copyright laws and is provided solely for the use of instructors
Chapter 13 Lecture Outline. The Atmosphere in Motion
 Chapter 13 Lecture Outline The Atmosphere in Motion Understanding Air Pressure Air pressure is the force exerted by weight of air above Weight of the air at sea level 14.7 psi or 1 kg/cm 2 Decreases with
Foundations of Earth Science, 6e Lutgens, Tarbuck, & Tasa
 Foundations of Earth Science, 6e Lutgens, Tarbuck, & Tasa The Atmosphere in Motion Foundations, 6e - Chapter 13 Stan Hatfield Southwestern Illinois College Atmospheric pressure Force exerted by the weight
Factors Affecting Wind
 Understanding Air Pressure Average air pressure at sea level is about 1 kg per cm 2 (14.7 lbs/in 2 ) Roughly the same pressure that is produced by a column of water 10 m (33 ft) high The pressurized suits
Chapter 6: Atmospheric Pressure, Wind, and Global Circulation
 Discovering Physical Geography Third Edition by Alan Arbogast Chapter 6: Atmospheric Pressure, Wind, and Global Circulation Factors That Influence Air Pressure Air Pressure is the measured weight of air
Air Pressure and Wind. Goal: Explain the formation of wind based on differences in air pressure
 Air Pressure and Wind Goal: Explain the formation of wind based on differences in air pressure What is Air Pressure? Reminder: Air pressure is thickest near Earth s surface and becomes thinner as we move
C irculation in the middle latitudes is complex and does not fit the
 19.3 Regional Wind Systems Section 19.3 1 FOCUS Key Concepts What causes local winds? Describe the general movement of weather in the United States. What happens when unusually strong, warm ocean currents
Winds and Ocean Circulations
 Winds and Ocean Circulations AT 351 Lab 5 February 20, 2008 Sea Surface Temperatures 1 Temperature Structure of the Ocean Ocean Currents 2 What causes ocean circulation? The direction of most ocean currents
McKnight's Physical Geography 11e
 Chapter 2 Lecture McKnight's Physical Geography 11e Lectures Chapter 5 Atmospheric Pressure and Wind Michael Commons Ohio Northern University Atmospheric Pressure and Wind The Nature of Atmospheric Pressure
Small- and large-scale circulation
 The Earth System - Atmosphere II Small- and large-scale circulation Atmospheric Circulation 1. Global atmospheric circulation can be thought of as a series of deep rivers that encircle the planet. 2. Imbedded
Meteorology I Pre test for the Second Examination
 Meteorology I Pre test for the Second Examination MULTIPLE CHOICE 1. A primary reason why land areas warm up more rapidly than water areas is that a) on land, all solar energy is absorbed in a shallow
ESCI 107 The Atmosphere Lesson 11 Global Circulation
 Reading: Meteorology Today, Chapter 10 THE GLOBAL CIRCULATION ESCI 107 The Atmosphere Lesson 11 Global Circulation Latitudinal heat imbalance The tropics receive more radiation than they emit. The polar
Meteorology. Circle the letter that corresponds to the correct answer
 Chapter 7 Worksheet 2 Meteorology Name: Circle the letter that corresponds to the correct answer 1) Which of the following factors contributes to the general subsidence in the latitude zone 20 degrees
Summary of Lecture 10, 04 March 2008 Introduce the Hadley circulation and examine global weather patterns. Discuss jet stream dynamics jet streams
 Summary of Lecture 10, 04 March 2008 Introduce the Hadley circulation and examine global weather patterns. Discuss jet stream dynamics jet streams arise because the Coriolis force prevents Hadley-type
Full Name: Class: Period: Date:
 Topic/Objective: Essential Question: Full Name: Class: Period: Date: Tutor Use Only: Air Pressure and Wind (Chapter 19) Air Pressure the weight of the atmosphere pushing down on the Earth exerting a force
Section 1. Global Wind Patterns and Weather. What Do You See? Think About It. Investigate. Learning Outcomes
 Chapter 5 Winds, Oceans, Weather, and Climate Section 1 Global Wind Patterns and Weather What Do You See? Learning Outcomes In this section, you will Determine the effects of Earth s rotation and the uneven
The atmospheric circulation system
 The atmospheric circulation system Key questions Why does the air move? Are the movements of the winds random across the surface of the Earth, or do they follow regular patterns? What implications do these
ATOMOSPERIC PRESSURE, WIND & CIRCULATION
 ATOMOSPERIC PRESSURE, WIND & CIRCULATION A. INTRODUCTION Important because: pressure patterns drive wind patterns which in turn drive oceanic circulation patterns o atmospheric & oceanic circulation: major
Atmospheric and Oceanic Circulation
 Atmospheric and Oceanic Circulation 1) The eruption of Mount Pinatubo in June 1991 A) lofted several million tons of ash, dust, and SO2 into the atmosphere. B) was tracked by AVHRR instruments aboard Earth-orbiting
ATMOSPHERIC CIRCULATION. WIND = The horizontal movement of air. Results from the differences in air pressure. Always moves from HIGH to LOW.
 ATMOSPHERIC CIRCULATION WIND = The horizontal movement of air. Results from the differences in air pressure. Always moves from HIGH to LOW. Pressure differences result from variations in temperature. AIR
9/25/2014. Scales of Atmospheric Motion. Scales of Atmospheric Motion. Chapter 7: Circulation of the Atmosphere
 Chapter 7: Circulation of the Atmosphere The Atmosphere: An Introduction to Meteorology, 12 th Lutgens Tarbuck Lectures by: Heather Gallacher, Cleveland State University Scales of Atmospheric Motion Small-
3 Global Winds and Local Winds
 CHAPTER 15 3 Global Winds and Local Winds SECTION The Atmosphere BEFORE YOU READ After you read this section, you should be able to answer these questions: What causes wind? What is the Coriolis effect?
SIO20 - Midterm Examination 2 v1 Winter Section A. Circle the letter corresponding to the best answer. (1 point each)
") NAME: Section A. Circle the letter corresponding to the best answer. (1 point each) 1. Rainbows result from: a. refraction and reflection of sunlight by water droplets b. reflection of sunlight by oceans
NAME: Section A. Circle the letter corresponding to the best answer. (1 point each) 1. Rainbows result from: a. refraction and reflection of sunlight by water droplets b. reflection of sunlight by oceans
Lornshill Academy. Geography Department Higher Revision Physical Environments - Atmosphere
 Lornshill Academy Geography Department Higher Revision Physical Environments - Atmosphere Physical Environments Atmosphere Global heat budget The earth s energy comes from solar radiation, this incoming
Meteorology. Circle the letter that corresponds to the correct answer
 Chapter 6 Worksheet 2 Meteorology Name: Circle the letter that corresponds to the correct answer 1) A steep pressure gradient: a. produces light winds. b. produces strong winds. c. is only possible in
3 Global Winds and Local Winds
 CHAPTER 6 3 Global Winds and Local Winds SECTION The Atmosphere BEFORE YOU READ After you read this section, you should be able to answer these questions: What causes wind? What is the Coriolis effect?
Chapter 6. Atmospheric and Oceanic. Circulations. Circulations
 Chapter 6 Atmospheric and Oceanic Circulations Robert W. Christopherson Charlie Thomsen Winds: Transfer energy and mass (1) Balance energy equatorial energy surplus and polar energy deficit (2) Generate
Introduction to Oceanography OCE 1001
 Introduction to Oceanography OCE 1001 Lecture Notes Chantale Bégin & Jessica Fry Version 2.1 10. Ocean Circulation (Trujillo, Chapter 7) Major ocean currents are stable and predictable; they have been
Section 3: Atmospheric Circulation
 Section 3: Atmospheric Circulation Preview Key Ideas The Coriolis Effect Global Winds Local Winds Maps in Action Key Ideas Explain the Coriolis effect. Describe the global patterns of air circulation,
Lecture 13 El Niño/La Niña Ocean-Atmosphere Interaction. Idealized 3-Cell Model of Wind Patterns on a Rotating Earth. Previous Lecture!
 Lecture 13 El Niño/La Niña Ocean-Atmosphere Interaction Previous Lecture! Global Winds General Circulation of winds at the surface and aloft Polar Jet Stream Subtropical Jet Stream Monsoons 1 2 Radiation
Chapter 10: Global Wind Systems
 Chapter 10: Global Wind Systems Three-cell model of atmospheric circulation Intertropical Convergence Zone (ITCZ) Typical surface wind patterns Upper-level pressure and winds Climatological sea-level pressure
Lesson: Atmospheric Dynamics
 Lesson: Atmospheric Dynamics By Keith Meldahl Corresponding to Chapter 8: Atmospheric Circulation Our atmosphere moves (circulates) because of uneven solar heating of the earth s surface, combined with
Chapter 7 Weather and Climate
 Chapter 7 Weather and Climate *Describe what weather is, what affects it, and where it occurs. *Explain the connection between air pressure and wind. * *Many factors affect a region s weather. * *atmosphere
Section 6. The Surface Circulation of the Ocean. What Do You See? Think About It. Investigate. Learning Outcomes
 Chapter 5 Winds, Oceans, Weather, and Climate Section 6 The Surface Circulation of the Ocean What Do You See? Learning Outcomes In this section, you will Understand the general paths of surface ocean currents.
Atmosphere Circulation
 Atmosphere Circulation Winds What Causes Winds? Difference in air pressure due to unequal heating of the atmosphere. Temperatures vary according to the amount of sun it gets. Uneven heating of the Earth
Wednesday, September 20, 2017 Reminders. Week 3 Review is now available on D2L (through Friday) Exam 1, Monday, September 25, Chapters 1-4
 Exam 1, Monday, September 25, Chapters 1-4") Wednesday, September 20, 2017 Reminders Week 3 Review is now available on D2L (through Friday) Exam 1, Monday, September 25, Chapters 1-4 PLEASE don t memorize equations, but know how to recognize them
Wednesday, September 20, 2017 Reminders Week 3 Review is now available on D2L (through Friday) Exam 1, Monday, September 25, Chapters 1-4 PLEASE don t memorize equations, but know how to recognize them
PHYSICAL GEOGRAPHY. By Brett Lucas
 PHYSICAL GEOGRAPHY By Brett Lucas ATMOSPHERIC PRESSURE AND WIND Atmospheric Pressure and Wind Atmospheric Processes The Nature of Wind General Circulation of the Atmosphere Modifications of General Circulation
6.1 Introduction to Weather Weather air mass Weather factors Temperature Pressure What is wind? Wind Convection in the atmosphere Thermals thermal
 6.1 Introduction to Weather Weather is a term that describes the condition of the atmosphere in terms of temperature, atmospheric pressure, wind, and water. The major energy source for weather events is
Atmospheric Circulation
 Atmospheric Circulation Why do we say Earth's temperature is moderate? It may not look like it, but various processes work to moderate Earth's temperature across the latitudes. Atmospheric circulation
The General Circulation and El Niño. Dr. Christopher M. Godfrey University of North Carolina at Asheville
 The General Circulation and El Niño Dr. Christopher M. Godfrey University of North Carolina at Asheville Global Circulation Model Air flow broken up into 3 cells Easterlies in the tropics (trade winds)
Global Winds and Local Winds
 Global Winds and Local Winds National Science Education Standards ES 1j What is the Coriolis effect? What are the major global wind systems on Earth? What Causes Wind? Wind is moving air caused by differences
CHAPTER 6 Air-Sea Interaction
 CHAPTER 6 Air-Sea Interaction What causes Earth s seasons? Tilt (23.5 ) responsible for seasons 2011 Pearson Education, Inc. Distribution of Solar Energy Distribution of Solar Energy Atmosphere absorbs
CHAPTER 8 WIND AND WEATHER MULTIPLE CHOICE QUESTIONS
 CHAPTER 8 WIND AND WEATHER MULTIPLE CHOICE QUESTIONS 1. is the movement of air measured relative to the Earth's surface. a. Gravity b. The pressure gradient force c. The Coriolis Effect d. The centripetal
Lecture 13 March 24, 2010, Wednesday. Atmospheric Pressure & Wind: Part 4
 Lecture 13 March 24, 2010, Wednesday Atmospheric Pressure & Wind: Part 4 Synoptic scale winds Mesoscale winds Microscale winds Air-sea interactions The largest synoptic scale wind. Monsoon: Arabic for
Ocean Currents that Redistribute Heat Globally
 Ocean Currents that Redistribute Heat Globally Ocean Circulation Ocean Currents Fig. CO7 OCEAN CURRENTS Surface ocean currents are similar to wind patterns: 1. Driven by Coriolis forces 2. Driven by winds
Enviro Sci 1A03 Quiz 3
 Enviro Sci 1A03 Quiz 3 Question 1 (1 point) Which of the following measure wind direction and speed? Question 1 options: a) aerovane b) anemometer c) wind vane d) all of the above Question 2 (1 point)
Wind Patterns on Earth
 Wind Patterns on Earth What causes air to move? Air pressure differences causes air to move. These differences in air pressure at the same altitude is caused by uneven heating of the Earth s surface. With
Carolina TM Coriolis Effect and Atmospheric Circulation Kit STUDENT GUIDE
 Name: Date: Mods: Carolina TM Coriolis Effect and Atmospheric Circulation Kit STUDENT GUIDE Background Global air circulation is a major influence on the world's climates. Air circulation is caused by
Review for the second quarter. Mechanisms for cloud formation
 Review for the second quarter Mechanisms for cloud formation 1 Rising air expands and cools; Sinking air compresses and warms. (18) (24) Dry adiabatic lapse rate (10 o C/km): the rate of temperature decrease
Isaac Newton ( )
") Introduction to Climatology GEOGRAPHY 300 Isaac Newton (1642-1727) Tom Giambelluca University of Hawai i at Mānoa Atmospheric Pressure, Wind, and The General Circulation Philosophiæ Naturalis Principia
Introduction to Climatology GEOGRAPHY 300 Isaac Newton (1642-1727) Tom Giambelluca University of Hawai i at Mānoa Atmospheric Pressure, Wind, and The General Circulation Philosophiæ Naturalis Principia
3 Global Winds and Local Winds
 CHAPTER 1 3 Global Winds and Local Winds SECTION The Atmosphere BEFORE YOU READ After you read this section, you should be able to answer these questions: What causes wind? What is the Coriolis effect?
Chapter 8. Circulation of The Atmosphere
 Chapter 8 Circulation of The Atmosphere Scales of Atmospheric Motion Atmospheric circulations are broken-down into different scales bases on physical size and duration. Macroscale This is the largest scale,
PGF. Pressure Gradient. Wind is horizontal movement of the air or other word air in motion. Forces affecting winds 2/14/2017
 Winds Wind is horizontal movement of the air or other word air in motion. Forces affecting winds 1. Pressure gradient force a. High pressure flows to low pressure b. Pressure gradient = difference in pressure
Lesson: Ocean Circulation
 Lesson: Ocean Circulation By Keith Meldahl Corresponding to Chapter 9: Ocean Circulation As this figure shows, there is a connection between the prevailing easterly and westerly winds (discussed in Chapter
Greenhouse Effect Activity
 Greenhouse Effect Activity Objectives: The student will: 1. Read and use weather instruments. 2. Collect and record temperature readings. 3. Describe the concept of the greenhouse effect. Materials: Fish
Weather and Climate. Climate the situation of the atmosphere during a long period of time and a big surface.
 Weather and Climate Weather and Climate Weather the situation of the atmosphere during a short period of time and a small surface of the Earth. It is very irregular and changes a lot. Climate the situation
Chapter 7: Circulation And The Atmosphere
 Chapter 7: Circulation And The Atmosphere Highly integrated wind system Main Circulation Currents: series of deep rivers of air encircling the planet Various perturbations or vortices (hurricanes, tornados,
Prevailing Winds. The Coriolis Effect
 Prevailing Winds 1. Wind: a movement of air in the atmosphere. Bill Nye wind (2 minutes) 2. Local or regional wind: occur in fairly small areas. 3. Prevailing winds: Major wind pattern that affect large
Wednesday, September 27, 2017 Test Monday, about half-way through grading. No D2L Assessment this week, watch for one next week
 Wednesday, September 27, 2017 Test Monday, about half-way through grading No D2L Assessment this week, watch for one next week Homework 3 Climate Variability (due Monday, October 9) Quick comment on Coriolis
Wind is caused by differences in air pressure created by changes in temperature and water vapor content.
 Topic 8: Weather Notes, Continued Workbook Chapter 8 Wind is caused by differences in air pressure created by changes in temperature and water vapor content. Wind blows from high pressure areas to low
Topic 3. : Atmospheric Pressure and Wind System
 Topic 3. : Atmospheric Pressure and Wind System Compiled by M S Jadhav, Assistant Professor in Geography, Ahmadnagar College, Ahmednagar. Note: This document is only for SYBA student as class notes and
Earth s Atmosphere. Air Currents
 CHAPTER 12 Earth s Atmosphere LESSON 3 Air Currents What do you think? Read the two statements below and decide whether you agree or disagree with them. Place an A in the Before column if you agree with
Local Winds. Please read Ahrens Chapter 10
 Local Winds Please read Ahrens Chapter 10 Scales of Motion Microscale: meters Turbulent eddies Formed by mechanical disturbance or convection Lifetimes of minutes Mesoscale: km s to 100 s of km s Local
CHAPTER 7 Ocean Circulation
 1 2 3 4 5 6 7 8 9 10 11 12 13 14 CHAPTER 7 Ocean Circulation Words Ocean currents Moving seawater Surface ocean currents Transfer heat from warmer to cooler areas Similar to pattern of major wind belts
In Search of the Source of Wind.
 In Search of the Source of Wind Role of Wind in the Voyage Atmospheric Pressure The Weight of Atmospheric Air on Earth Gravitational force helps Air to remain on Earth Variations in the Atmospheric Pressure
Read each slide, some slides have information to record on your organizer. Some slides have numbers that go with the question or red and underlined
 Read each slide, some slides have information to record on your organizer. Some slides have numbers that go with the question or red and underlined to use for answering the questions. Essential Question:
REMINDERS: UPCOMING REVIEW SESSIONS: - Thursday, Feb 27, 6:30-8:00pm in HSS 1330
 REMINDERS: Midterm 2: Friday, February 28 - lecture material covering chapters 6, 7, and 15 (since first midterm and through Wed lecture) - same Format as first midterm UPCOMING REVIEW SESSIONS: - Thursday,
Earth s Atmosphere. Earth s atmosphere is a key factor in allowing life to survive here.
 Chapter 10.2 Earth s Atmosphere Earth s atmosphere is a key factor in allowing life to survive here. This narrow band of air has the right ingredients and maintains the correct temperature, to allow life
Nevis Hulme Gairloch High School John Smith Invergordon Academy. Gairloch High School / Invergordon Academy
 Nevis Hulme Gairloch High School John Smith Invergordon Academy 1 Gairloch High School / Invergordon Academy ATMOSPHERIC CIRCULATION The Three Cell Model Global Winds The ITCZ The purpose of this presentation
Name Date L.O: SWBAT explain what breezes, planetary winds, ocean currents & monsoons are.
 Name Date L.O: SWBAT explain what breezes, planetary winds, ocean currents & monsoons are. 1. A cool breeze is blowing toward the land from the ocean on a warm, cloudless summer day. This condition is
Topic 4 Temperature, Atmospheric Circulation and Climate. Temperature Concepts and Measurement 10/2/2017. Thermometer and Instrument Shelter
 Topic 4 Temperature, Atmospheric Circulation and Climate Temperature Controls Global Temp. Patterns Atmospheric Circulation Primary High and Low Pressure Areas Global Circulation Model Local Winds Ocean
Applied Earth Science Climate Exam Practice Questions Page 1
 Name: 1. Which combination of climate factors generally results in the coldest temperatures? A) low elevation and low latitude B) low elevation and high latitude C) high elevation and low latitude D) high
Unit Test Study Guide:
 Name: Homeroom: Date: Unit 6: Meteorology Study Guide Unit Test Study Guide: Atmosphere & Weather Use the summary points below as a resource to help you study for our unit test Monday! EARTH S ATMOSPHERE:
Lecture 5: Climate Tapestry. Sea/Land Breeze. Thermal Energy to Kinetic Energy
 Lecture 5: Climate Tapestry JS JP Thermal Energy to Kinetic Energy Hadley Cell Ferrel Cell (driven by eddies) Pressure and Wind Global Wind Patterns Polar Cell L H L H Effect of Earth s Rotation On Winds
Atmospheric Circulation. Recall Vertical Circulation
 Today s topics: Atmospheric circulation: generation of wind patterns on a rotating Earth Seasonal patterns of climate: Monsoons and El Niño Tropical Cyclones: Hurricanes and typhoons Atmospheric Circulation
AT350 EXAM #2 November 18, 2003
 AT350 EXAM #2 November 18, 2003 Name and ID: Enter your name and student ID number on the answer sheet and on this exam. Record your answers to the 50 questions by using a No. 2 pencil to completely fill
El Niño Lecture Notes
 El Niño Lecture Notes There is a huge link between the atmosphere & ocean. The oceans influence the atmosphere to affect climate, but the atmosphere also influences the ocean, which can also affect climate.
Write answers on your own paper. A. the Sun B. the Moon C. Earth s gravity D. Earth s rotation
 The tmosphere Write answers on your own paper 1. What is the primary energy source that drives all weather events, including precipitation, hurricanes, and tornados?. the Sun. the Moon C. Earth s gravity
Chapter 22, Section 1 - Ocean Currents. Section Objectives
 Chapter 22, Section 1 - Ocean Currents Section Objectives Intro Surface Currents Factors Affecting Ocean Currents Global Wind Belts (you should draw and label a diagram of the global wind belts) The Coriolis
Atmospheric & Ocean Circulation-
 Atmospheric & Ocean Circulation- Overview: Atmosphere & Climate Atmospheric layers Heating at different latitudes Atmospheric convection cells (Hadley, Ferrel, Polar) Coriolis Force Generation of winds
Wind in the Atmosphere
 Lesson 2 Wind in the Atmosphere ESSENTIAL QUESTION What is wind? By the end of this lesson, you should be able to explain how energy provided by the sun causes atmospheric movement, called wind. p 6.ESS2.2,
IX. Upper Ocean Circulation
 IX. Upper Ocean Circulation World Ocean Covers 71% of Earth s surface Contains 97% of surface water Arctic Ocean NH: 61% ocean, 39% land Pacific Ocean Atlantic Ocean Southern Ocean Indian Ocean SH: 81%
Atmospheric Circulation. Recall Vertical Circulation
 Today s topics: Atmospheric circulation: generation of wind patterns on a rotating Earth Seasonal patterns of climate: Monsoons and Sea Breezes Tropical Cyclones: Hurricanes and typhoons Atmospheric Circulation
Wind and Wind Patterns
 Wind and Wind Patterns What is Weather? Weather is the condition of Earth s atmosphere at a particular time and place. What is Wind? Wind is air moving across the surface of the Earth. It can move horizontally
Local and Global Winds
 PART 2 Wind Local and Global Winds Wind is the horizontal movement of air. All wind is caused by air pressure differences due to the uneven heating of Earth's surface, which sets convection currents in
THE ATMOSPHERE. WEATHER and CLIMATE. The Atmosphere 10/12/2018 R E M I N D E R S. PART II: People and their. weather. climate?
 R E M I N D E R S Two required essays are due by Oct. 30, 2018. (A third may be used for extra credit in place of a Think Geographically essay.) ESSAY TOPICS (choose any two): Contributions of a noted
Lecture 15 General Circulation of the Atmosphere and Ocean
 Lecture 15 General Circulation of the Atmosphere and Ocean Non-rotating model of atmospheric general circulation Hadley (1735) Cell is induced by uneven distribution of solar heating. Conceptual models
- terminology. Further Reading: Chapter 07 of the text book. Outline. - characteristics of ENSO. -impacts
 (1 of 14) Further Reading: Chapter 07 of the text book Outline - terminology - characteristics of ENSO -impacts (2 of 14) Today: Introduction We want to look at another source of variability in the atmosphere
Wind and Air Pressure
 Wind and Air Pressure When air moves above the surface of the Earth, it is called wind. Wind is caused by differences in air pressure. When a difference in pressure exists, the air will move from areas
TOPICS YOU NEED TO KNOW
 ATMO 101 Introduction to Meteorology Midterm Study Sheet Chapters 6, 7, 8 and 10 Exam Thursday 3/23/2017 Vocabulary Words for True and False, and Multiple Choice You are responsible for the following words:
3/6/2001 Fig. 6-1, p.142
 First GOES 11 image http://visible earth.nasa.g ov/view_rec. php?id=190 Air-born dust from the Sahara Desert, Feb. 2001 Fig. 6-CO, p.140 dust from China over Japan. 3/5/2001 FIGURE 6.1 A model of the atmosphere
Lecture 8: Pressure and Wind
 Lecture 8: Pressure and Wind Pressure Distribution Forces Affect Wind Earth s Rotation Coriolis Force Geostrophic Balance Energy (Heat) The first law of thermodynamics Air Temperature Air Pressure Air
Module 3, Investigation 1: Briefing 1 What are the effects of ENSO?
 Background The changing temperatures of the tropical Pacific Ocean affect climate variability all over Earth. Ocean warming and cooling dramatically affect human activities by changing weather patterns
3/22/11. General Circulation of the Atmosphere. General Circulation of the Atmosphere
 Chapter 10 General refers to the average air flow, actual winds will vary considerably. Average conditions help identify driving forces. The basic cause of the general circulation is unequal heating of
Lecture 24. El Nino Southern Oscillation (ENSO) Part 1
 Part 1") Lecture 24 El Nino Southern Oscillation (ENSO) Part 1 The most dominant phenomenon in the interannual variation of the tropical oceanatmosphere system is the El Nino Southern Oscillation (ENSO) over the
Lecture 24 El Nino Southern Oscillation (ENSO) Part 1 The most dominant phenomenon in the interannual variation of the tropical oceanatmosphere system is the El Nino Southern Oscillation (ENSO) over the
6.9B verify through investigations that thermal energy moves in a predictable pattern from warmer to cooler 6.5B recognize that a limited number of
 6.9B verify through investigations that thermal energy moves in a predictable pattern from warmer to cooler 6.5B recognize that a limited number of elements comprise the largest portion of oceans and atmosphere
What is Wind? Winds are caused by differences in air pressure. This is horizontal movement of air of high pressure to low pressure. Unequal heating of
 What is Wind? Winds are caused by differences in air pressure. This is horizontal movement of air of high pressure to low pressure. Unequal heating of the atmosphere. Measuring Wind Wind direction is determined