Sonic Detection and Ranging (SODAR) Data Collection and Evaluation Report
|
|
|
- Sheila Hensley
- 6 years ago
- Views:
Transcription
1 Sonic Detection and Ranging (SODAR) Data Collection and Evaluation Report Bolt Mountain, Pocahontas Land Corporation, B&L Excavating Bolt Mountain, Wyoming County, West Virginia (Data Evaluation Period: June 25, 2014 to March 31, 2015) Compiled by: Marshall University Center for Environmental, Geotechnical and Applied Sciences (CEGAS) Under Direction of: West Virginia Division of Energy Funded by: Appalachian Regional Commission West Virginia Division of Energy July, 2015
2 Table of Contents 1.0 Introduction Project Location and Site Conditions Data Collection Description SODAR Configuration SODAR Data Filtering and Performance Results Wind Trends in Region Findings Calculated to Specific Wind Turbine Energy Output Conclusions and Recommendations 4 Attachments Attachment A Site Location Map Site Photos SecondWind Site Information Form and Checklist Attachment B Windographer Monthly Reports Windographer Summary Report Wind Turbine Energy Output Summaries
3 1.0 Introduction Marshall University s Center for Environmental, Geotechnical and Applied Sciences (CEGAS) partnered with the West Virginia Division of Energy to perform initial screening and wind resource data collection to assess wind development opportunities at selected surface mine properties in West Virginia using Sonic Detection and Ranging technologies. Funding for this study provided under joint partnership from the Appalachian Regional Commission and the West Virginia Division of Energy. 1.1 Project Location and Site Conditions The site is located at the Pocahontas Land Corporation, B&L Excavating quarry operations, located near Bolt, Raleigh County, West Virginia. The SODAR unit was physically in Wyoming County along a ridgeline that forms the Wyoming/Raleigh County border. Wind resource data collection occurred on the site at Latitude , Longitude , at an elevation of 3,185 feet (971 meters) above mean sea level. This area is along a ridgeline with active quarry operations. On each side of the ridgeline surface mine operations have taken and are taking place. A site location map is provided in Attachment A. The immediately surrounding area consists of dormant quarry property with active quarry within quarter of a mine. Minimal ground vegetation is present, and various species of trees cover the ridgeline outside the boundary of the quarry. Trees are at various ages, and are generally 10 to 60 feet tall. The main access road is located northwest of the SODAR location, with occasional traffic and/or related noise from quarry mine operations. B&L Excavating leases the property for quarry operations. The tract where the SODAR was located is owned by Pocahontas Land Corporation. This property owner owns several thousand acres in the area. 1.2 Data Collection Description Wind resource data was collected using a Triton Sonic Wind Profiler, manufactured by SecondWind, utilizing Sonic Detection and Ranging (SODAR) technology. Data collection occurred between June 25, 2014 and March 31, Photos showing the Triton unit and surrounding area are included in Attachment A. The Triton unit was set up per SecondWind recommendations, including leveling of the unit to within operating condition (within 3 degrees of level), and proper directional orientation of the unit using Global Positioning System and magnetic compass equipment. The Triton unit is oriented properly when the south sound beam is positioned to within a few degrees of South. A Site Information Form and Checklist was 1
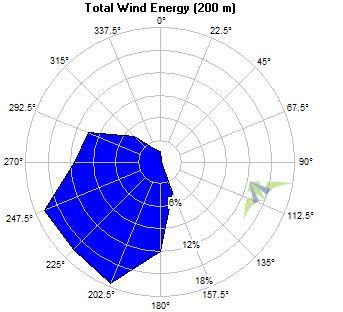
4 completed during initial setup, which records site conditions, including nearby surface features, site noise, and unit operation parameter checks. A copy of the Site Information Forms and Checklists are included in Attachment A. 1.3 SODAR Configuration The Triton Sonic Wind Profiler utilizes a hexagonal 36-speaker array to transmit high frequency acoustic pulses, or chirps, and measures how they scatter and return to the unit. Sources of scattering are irregularities in wind velocities, air temperature and density, causing acoustic refractive index changes. By measuring the Doppler shifted frequency of the returned signal or echo, the SODAR determines wind speed and direction at various altitudes. Additional information on Triton Sonic Wind Profiler s operational details is available at: The SODAR unit saves records on 10-minute intervals. Each record includes data from 10 heights, ranging from 40 meters to 200 meters above ground surface. Data collected includes wind direction, horizontal and vertical wind speeds, turbulence, and general weather parameters, including temperature and barometric pressure. 2.0 SODAR Data Filtering and Performance Using guidelines provided by Second Wind, SODAR data was filtered to remove low-quality data before analysis was performed. For this study, a 85% wind speed quality factor, as recommended by Second Wind, was used. During the time frame for this study, the SODAR unit operated during most of the period. The unit had a period of off and on operation between mid-december and late February due to mechanical issues. A Vaisala technician worked on the unit on two separate occasions and continuous service was restored in early March. 3.0 Results All data collected during the study was exported into Windographer software for data analysis. Windographer is a wind data analysis program that reads data files directly from SODAR wind profilers and performs a number of calculations, including wind shear, turbulence intensity, extreme wind speeds, and wind turbine energy production. Windographer software version, Version , released in August of 2013, was used for data analysis. Wind speed mean averages at various elevations above the ground surface ranged from 3.51 meters per second (m/s) at 40 meters, increasing consistently to just over 7.39 m/s at 200 meters. Wind direction 2
5 was predominantly from the west, with mean wind directions generally West-Southwest. The following table, summarized from Windographer data analysis, provides a summary of wind speed, wind direction, vertical wind speed, and power density estimates at specified elevations from 40 to 200 meters above existing ground surface: Elevation Above Ground Surface (819 m) Wind Speed (m/s, mean) Wind Direction (degrees, mean) Vertical Wind Speed (m/s, mean) Power Density (W/m 2, mean) 40 Meters Meters Meters Meters Meters Meters Meters Meters Meters Meters Monthly wind speed and wind direction graphs are provided in Appendix B. Also in Appendix B is a Data Summary Report, which includes wind frequency, mean wind speed, and total wind energy rose diagrams, plus project period wind speed and diurnal wind speed profiles. A complete SODAR data collection package is available upon request to the West Virginia Division of Energy. 4.0 Wind Trends in Region During the study time period, AWS Truepower s wind trends bulletin showed that winds in the study region were above average during the 3 rd and 4 th quarters of 2014 and slightly below average during the 1 st quarter of
6 5.0 Findings Calculated to Specific Wind Turbine Energy Output Three wind turbines were selected for comparison of energy output based on the findings from this data collection period. The three units selected are representative of small, medium, and large-scale wind turbines that may be utilized for small to large-scale wind power generation. Each turbine was selected with an appropriate hub height and energy output calculated using Windographer software. The following table summarizes turbine properties and associated energy output and related information: Wind Turbine Model Number Rated Power (kw) Hub Height (meters) Hub Height Wind Speed (m/s) Mean Net Power Output (kw) Net Capacity Factor (%) Endurance G Vestas V GE 2.5xl 2, Complete wind turbine comparison summaries are provided in Attachment B. 6.0 Conclusions and Recommendations Wind resource data collection occurred between June 25, 2014 and March 31, Late Spring and Summer months normally experience lower than yearly average wind speeds; winter months normally experience the highest wind speeds for a given 1-year period. These expected results were observed at the Bolt Mountain site. Recorded wind resource data and associated net capacity factors were below levels normally associated with commercial wind energy development standards. Based on data collected, commercial wind energy generation at this site is not recommended. Output from small-scale wind energy generation appears to be similar to commercial scale; however, in remote locations, the use of wind energy may be more economical than establishing traditional power infrastructure. This class of wind turbines are favorable for use by a single business, and/or for residential energy generation use. 4
7 ATTACHMENT A Site Location Map Site Photos SecondWind Site Information Form and Checklist
8 Bolt Mountain SODAR Site Map. Boone Raleigh!. Wyoming Sources: Esri, DeLorme, NAVTEQ, USGS, NRCAN, METI, ipc, TomTom Miles Legend!. SODAR County Boundary


9 Top View: SODAR unit looking North Bottom View: SODAR unit looking South


10 Top View: SODAR unit looking East Bottom View: SODAR unit looking West
11 Site Information Form & Checklist 1. Triton Information Triton Site Name: Bolt Mtn. (Wyoming-Raleigh County Border) Triton Owner: Marshall University Install Date: Triton Serial #: Triton Model: Circle/Highlight: STD HP 6/25/ HR Personnel Present: G. Carico and J. Wolfe (CEGAS), Terry St.Clair (B&L Excavating) Surrounding Site Description (i.e. Windfarm, Forest, Field etc.) Road Access Description (i.e. 4WD required) Gate Key Location/Security Details Front Door Lock Details (Combo or Key Location) 2. Site Information Rock quarry with forestland surrounding site Gravel road. 4x4 not required unless heavy snow. Locked gate. Access provided by B&L Excavating Master Lock (same key required for security gate entrance) Property Management Contacts B&L Excavating, Phone (Office in Lynco, WV) 3. Fixed Object Vista Table Description of Object Azimuth (Deg) Distance (ft) Height of Object (ft) Rock quarry wall NW, N & NE 150 ft ft Same Trees E 60 ft About 30 ft max Same Trees SW 90 ft About 30 ft max Same Relative Elevation to Triton (m)
12 4. Installation Checklist Item Unit Value Mechanical Inspection Exterior Warning Sign Cover Removed (Heater Only) Triton Properly Oriented Triton Secured List Damage/Defects None none Record Azimuth of B-Beam (deg mag) Method (i.e. earth anchors, trailer, snow platform, etc.) NA B-beam South Trailer, Fence Batteries Charged (>12.7V) Record voltage level, V - DC 13.7 Solar Panels Installed, Connected # of Panels 2 Solar Panels Charging V - DC 15.2 Antifreeze Fluid Level (Heater Only) none 1/2 Full Propane Tanks installed Tank capacity and level No (to be installed later in 2014) Propane Leak Test (Heater Only) Operator Panel: GPS Operator Panel: SENSORS Operator Panel: SUPPLIES Operator Panel: SD CARD Operator Panel: HEATER Operator Panel: NOTA (self-test) Operator Panel: ARRAY Operator Panel: SODAR Operator Panel: SNR Operator Panel: INTERNET Operator Panel: TSP Operator Panel: SKYSERVE Take Photos or Videos Ambient Noise Level Ambient Noise Description none NA Red/Green/Rapid/Off green Red/Green/Rapid/Off Green and then Orange Blinking Red/Green/Rapid/Off green Red/Green/Rapid/Off green Off/NA NA Red/Green/Rapid/Off/NA green Red/Green/Rapid/Off green Red/Green/Rapid/Off green Red/Green/Rapid/Off green Red/Green/Rapid/Off green Red/Green/Rapid/Off green Red/Green/Rapid/Off Pictures of 360deg site and Anchored Triton green Photos on file db minimal (i.e. Birds, Crickets, Highway) Birds and occasional vehicles Triton Information (1) Section Complete Site Information (2) Section Complete Fixed Obstacle Vista Table (3) Complete none None none None none None Installer's Signature: Date: 6/25/2014 Installer's Name (print): George Carico Installer's ID #: Rev5 March 2010
13 ATTACHMENT B Windographer Monthly Reports Windographer Summary Report Wind Turbine Energy Output Summaries

14 Monthly Report: Bolt Mountain Page 1 of 1 Report Settings Report Created: 7/2/ :41 using Windographer Report Period: June 2014 Wind Speed Data Wind Direction Data Temperature Data


15 Monthly Report: Bolt Mountain Page 1 of 1 Report Settings Report Created: 7/2/ :42 using Windographer Report Period: July 2014 Wind Speed Data Wind Direction Data Temperature Data


16 Monthly Report: Bolt Mountain Page 1 of 1 Report Settings Report Created: 7/2/ :42 using Windographer Report Period: August 2014 Wind Speed Data Wind Direction Data Temperature Data


17 Monthly Report: Bolt Mountain Page 1 of 1 Report Settings Report Created: 7/2/ :42 using Windographer Report Period: September 2014 Wind Speed Data Wind Direction Data Temperature Data


18 Monthly Report: Bolt Mountain Page 1 of 1 Report Settings Report Created: 7/2/ :43 using Windographer Report Period: October 2014 Wind Speed Data Wind Direction Data Temperature Data


19 Monthly Report: Bolt Mountain Page 1 of 1 Report Settings Report Created: 7/2/ :43 using Windographer Report Period: November 2014 Wind Speed Data Wind Direction Data Temperature Data


20 Monthly Report: Bolt Mountain Page 1 of 1 Report Settings Report Created: 7/2/ :44 using Windographer Report Period: December 2014 Wind Speed Data Wind Direction Data Temperature Data


21 Monthly Report: Bolt Mountain Page 1 of 1 Report Settings Report Created: 7/2/ :44 using Windographer Report Period: January 2015 Wind Speed Data Wind Direction Data Temperature Data


22 Monthly Report: Bolt Mountain Page 1 of 1 Report Settings Report Created: 7/2/ :44 using Windographer Report Period: February 2015 Wind Speed Data Wind Direction Data Temperature Data


23 Monthly Report: Bolt Mountain Page 1 of 1 Report Settings Report Created: 7/2/ :45 using Windographer Report Period: March 2015 Wind Speed Data Wind Direction Data Temperature Data
24 Summary Report: Bolt Mountain Page 1 of 6 Data Set Properties Report Created: 7/2/ :37 using Windographer Filter Settings: <Unflagged data> Variable Latitude N Longitude W Elevation 3185 ft Start date 6/25/ :00 End date 3/31/ :00 Duration 9.2 months Length of time step 10 minutes Calm threshold 0 m/s Mean temperature 7.79 C Mean pressure mbar Mean air density kg/m³ Power density at 50m 70 W/m² Wind power class 1 (Poor) Power law exponent Surface roughness 12 m Roughness class 5.97 Roughness description Urban Value


25 Summary Report: Bolt Mountain Page 2 of 6 Wind Speed and Direction

26 Summary Report: Bolt Mountain Page 3 of 6 Wind Shear
27 Summary Report: Bolt Mountain Page 4 of 6 Turbulence Intensity
28 Summary Report: Bolt Mountain Page 5 of 6 Data Column Properties Number Label Units Height Possible Records Valid Records Recovery Rate (%) Mean Min Max Std. Dev 1 Date and Time <Intentionally blank> 40,248 40, Date 40,248 40, m Wind Direction 40 m 40,248 36, m Wind Speed m/s 40 m 40,248 36, m Wind Vert m/s 40,248 36, Quality (Station Height 40m) % 40,248 36, m Wind Direction 50 m 40,248 35, m Wind Speed m/s 50 m 40,248 35, m Wind Vert m/s 40,248 35, Quality (Station Height 50m) % 40,248 35, m Wind Direction 60 m 40,248 35, m Wind Speed m/s 60 m 40,248 35, m Wind Vert m/s 40,248 35, Quality (Station Height 60m) % 40,248 35, m Wind Direction 80 m 40,248 34, m Wind Speed m/s 80 m 40,248 34, m Wind Vert m/s 40,248 34, Quality (Station Height 80m) % 40,248 34, m Wind Direction 100 m 40,248 32, m Wind Speed m/s 100 m 40,248 32, m Wind Vert m/s 40,248 32, Quality (Station Height 100m) % 40,248 32, m Wind Direction 120 m 40,248 29, m Wind Speed m/s 120 m 40,248 29, m Wind Vert m/s 40,248 29, Quality (Station Height 120m) % 40,248 29, m Wind Direction 140 m 40,248 25, m Wind Speed m/s 140 m 40,248 25, m Wind Vert m/s 40,248 25, Quality (Station Height 140m) % 40,248 25, m Wind Direction 160 m 40,248 20, m Wind Speed m/s 160 m 40,248 20, m Wind Vert m/s 40,248 20, Quality (Station Height 160m) % 40,248 20, m Wind Direction 180 m 40,248 16, m Wind Speed m/s 180 m 40,248 16, m Wind Vert m/s 40,248 16, Quality (Station Height 180m) % 40,248 16, m Wind Direction 200 m 40,248 11, m Wind Speed m/s 200 m 40,248 11, m Wind Vert m/s 40,248 11, Quality (Station Height 200m) % 40,248 11, m Wind Turbulence m/s 40,248 19, m Wind Turbulence m/s 40 m 40,248 21, m Wind Turbulence m/s 50 m 40,248 22, m Wind Turbulence m/s 60 m 40,248 24, m Wind Turbulence m/s 80 m 40,248 24, m Wind Turbulence m/s 100 m 40,248 23, m Wind Turbulence m/s 120 m 40,248 21, m Wind Turbulence m/s 140 m 40,248 17, m Wind Turbulence m/s 160 m 40,248 13, m Wind Turbulence m/s 180 m 40,248 10,
29 Summary Report: Bolt Mountain Page 6 of 6 Number Label Units Height Possible Records Valid Records Recovery Rate (%) Mean Min Max Std. Dev 53 Turbu. Quality (Station Height 40m) m/s 200 m 40,248 19, Turbu. Quality (Station Height 50m) % 40,248 21, Turbu. Quality (Station Height 60m) % 40,248 22, Turbu. Quality (Station Height 80m) % 40,248 24, Turbu. Quality (Station Height 100m) % 40,248 24, Turbu. Quality (Station Height 120m) % 40,248 23, Turbu. Quality (Station Height 140m) % 40,248 21, Turbu. Quality (Station Height 160m) % 40,248 17, Turbu. Quality (Station Height 180m) % 40,248 13, Turbu. Quality (Station Height 200m) % 40,248 10, Date (1) 40,248 40, ,015 2,014 2, Ambient Temp C 40,248 38, Barometric Pressure mbar 40,248 38, TiltX  40,248 38, Azimuth  40,248 38, TiltY  40,248 38, Humidity % 40,248 38, Noise Level-A db 40,248 38, Noise Level-B db 40,248 38, Noise Level-C db 40,248 38, Speaker Power W 40,248 38, Core Power W 40,248 38, PWM Power W 40,248 38, Solar Power W 40,248 38, CPU Power W 40,248 38, Modem Power W 40,248 38, Heater Temp  C 40,248 38, Mirror Temp  C 40,248 38, Internal Temp  C 40,248 38, CPU Temp  C 40,248 38, VibrationY g 40,248 38, VibrationX g 40,248 38, Battery V 40,248 38, Beep Volume db 40,248 38, Air Density kg/m³ 40,248 40, m Wind Speed WPD W/m² 40,248 11, , m Wind Speed WPD W/m² 40,248 16, , m Wind Speed WPD W/m² 40,248 20, , m Wind Speed WPD W/m² 40,248 25, , m Wind Speed WPD W/m² 40,248 29, , m Wind Speed WPD W/m² 40,248 32, , m Wind Speed WPD W/m² 40,248 34, , m Wind Speed WPD W/m² 40,248 35, , m Wind Speed WPD W/m² 40,248 35, , m Wind Speed WPD W/m² 40,248 36, ,

30
31

32
Site Description: Tower Site
 Wind Resource Summary for Elizabeth Site Final Report Colorado Anemometer Loan Program Monitoring Period: 7/3/6 /15/7 Report Date: December 22, 7 Site Description: The site is.6 miles northeast of the
Wind Resource Assessment for NOME (ANVIL MOUNTAIN), ALASKA Date last modified: 5/22/06 Compiled by: Cliff Dolchok
, ALASKA Date last modified: 5/22/06 Compiled by: Cliff Dolchok") 813 W. Northern Lights Blvd. Anchorage, AK 99503 Phone: 907-269-3000 Fax: 907-269-3044 www.akenergyauthority.org SITE SUMMARY Wind Resource Assessment for NOME (ANVIL MOUNTAIN), ALASKA Date last modified:
813 W. Northern Lights Blvd. Anchorage, AK 99503 Phone: 907-269-3000 Fax: 907-269-3044 www.akenergyauthority.org SITE SUMMARY Wind Resource Assessment for NOME (ANVIL MOUNTAIN), ALASKA Date last modified:
Site Description: LOCATION DETAILS Report Prepared By: Tower Site Report Date
 Wind Resource Summary for Holyoke Site Final Report Colorado Anemometer Loan Program Monitoring Period:: 6/21/26 /6/27 Report Date: December 2, 27 Site Description: The site is 17.4 miles south of the
Site Summary. Wind Resource Summary. Wind Resource Assessment For King Cove Date Last Modified: 8/6/2013 By: Rich Stromberg & Holly Ganser
 Site Summary Wind Resource Assessment For King Cove Date Last Modified: 8/6/2013 By: Rich Stromberg & Holly Ganser Station ID: 2857 Latitude: 55 7 45.8 N Longitude: 162 16 10.6 W Tower Type: 30 m NRG Tall
Wind Resource Assessment for CHEFORNAK, ALASKA
 813 W. Northern Lights Blvd. Anchorage, AK 99503 Phone: 907-269-3000 Fax: 907-269-3044 www.akenergyauthority.org Wind Resource Assessment for CHEFORNAK, ALASKA Date last modified: 3/15/2006 Compiled by:
Kodiak, Alaska Site 1 Wind Resource Report for Kodiak Electric Association
 Kodiak, Alaska Site 1 Wind Resource Report for Kodiak Electric Association Report written by: Douglas Vaught, V3 Energy LLC, Eagle River, AK Date of report: August 23, 2006 Photo Doug Vaught General Site
Wind Project Siting and Permitting Blaine Loos
 Wind Project Siting and Permitting Blaine Loos Energy Project Analyst Center for Wind Energy at James Madison University Wind Project Siting and Permitting The Energy in Wind Resource Assessment (Macro-siting)
Buckland Wind Resource Report
 Buckland Wind Resource Report By: Douglas Vaught, P.E., V3 Energy LLC, Eagle River, Alaska Date: September 17, 2010 Buckland met tower; D. Vaught photo Contents Summary... 2 Test Site Location... 2 Photographs...
M. Mikkonen.
 Wind study by using mobile sodar technology M. Mikkonen Oulu University of Applied Sciences, School of Engineering, Oulu, Finland t3mimi00@students.oamk.com Abstract In this paper is presented a concept
Atqasuk Wind Resource Report
 Atqasuk Wind Resource Report Report by: Douglas Vaught, P.E., V3 Energy LLC, Eagle River, Alaska Date of Report: August 26, 2010 Atqasuk met tower; D. Vaught photo Contents Summary... 2 Test Site Location...
Wind Project Siting & Resource Assessment
 Wind Project Siting & Resource Assessment David DeLuca, Project Manager AWS Truewind, LLC 463 New Karner Road Albany, NY 12205 ddeluca@awstruewind.com www.awstruewind.com AWS Truewind - Overview Industry
WIND DATA REPORT. Vinalhaven
 WIND DATA REPORT Vinalhaven January - December, 2003 Prepared for Fox Islands Electric Cooperative by Anthony L. Rogers May 12, 2004 Report template version 1.1 Renewable Energy Research Laboratory 160
The Wind Resource: Prospecting for Good Sites
 The Wind Resource: Prospecting for Good Sites Bruce Bailey, President AWS Truewind, LLC 255 Fuller Road Albany, NY 12203 bbailey@awstruewind.com Talk Topics Causes of Wind Resource Impacts on Project Viability
Testing and Validation of the Triton Sodar
 Testing and Validation of the Triton Sodar September 24, 2008 AWEA Resource Assessment Workshop Ron Nierenberg, Consulting Meteorologist Liz Walls, Second Wind Inc. Ron Consulting Nierenberg Meteorologist
Kodiak, Alaska Site 1 Wind Resource Report
 Kodiak, Alaska Site 1 Wind Resource Report Report written by: Douglas Vaught, P.E., V3 Energy LLC, Eagle River, AK Date of report: March 16, 2007 Photo by Doug Vaught, V3 Energy LLC Summary Information
Wind Resource Assessment for DEADHORSE, ALASKA
 813 W. Northern Lights Blvd. Anchorage, AK 99503 Phone: 907-269-3000 Fax: 907-269-3044 www.akenergyauthority.org Wind Resource Assessment for DEADHORSE, ALASKA Date last modified: 4/18/2006 Compiled by:
Wind Resource Assessment for SAINT PAUL, ALASKA
 813 W. Northern Lights Blvd. Anchorage, AK 99503 Phone: 907-269-3000 Fax: 907-269-3044 www.akenergyauthority.org Wind Resource Assessment for SAINT PAUL, ALASKA Date last modified: 3/1/2006 Compiled by:
Wind Resource Assessment for FALSE PASS, ALASKA Site # 2399 Date last modified: 7/20/2005 Prepared by: Mia Devine
 813 W. Northern Lights Blvd. Anchorage, AK 99503 Phone: 907-269-3000 Fax: 907-269-3044 www.aidea.org/wind.htm Wind Resource Assessment for FALSE PASS, ALASKA Site # 2399 Date last modified: 7/20/2005 Prepared
Wind Data Verification Report Arriga 50m
 Page 1 of 11 Site Name Site Details 9531 - Arriga 5m Arriga 5m Date/Time of report generation 27/11/212 4:22 PM Site Number 9531 Mast Height 5m Mast Location 32568 E 811256 N Coordinate System UTM 55K
Pitka s Point, Alaska Wind Resource Report
 Pitka s Point, Alaska Wind Resource Report Pitka s Point met tower, photo by Doug Vaught April 25, 2012 Douglas Vaught, P.E. V3 Energy, LLC Eagle River, Alaska Page 2 Summary The wind resource measured
WCA Wind Research Project Report
 WCA Wind Research Project Report Steven Selvaggio Hasz Consulting Company Whitestone Community Association Presented to: Alaska Energy Authority September 25 Table of Contents I. Project Overview II. Results
Wind Resource Assessment for KING SALMON, ALASKA
 813 W. Northern Lights Blvd. Anchorage, AK 99503 Phone: 907-269-3000 Fax: 907-269-3044 www.akenergyauthority.org Wind Resource Assessment for KING SALMON, ALASKA Date last modified: 4/14/2006 Compiled
WIND DATA REPORT. Paxton, MA
 WIND DATA REPORT Paxton, MA September 1 2003 November 30 2003 by James F. Manwell Anthony F. Ellis Kai Wu April 15, 2004 Renewable Energy Research Laboratory 160 Governors Drive, www.ceere.org/rerl (413)
windnavigator Site Analyst Report
 windnavigator Site Analyst Report for Central NY Created for Stephen Meister April 27, 2010 ID NUMBER: N2-128 AWS Truepower, LLC Albany - Barcelona - Bangalore p: +1.518.21.00 e: info@awstruepower.com
Saint Mary s, Alaska Wind Resource Report (for Pitka s Point and Saint Mary s met towers)
") Saint Mary s, Alaska Wind Resource Report (for Pitka s Point and Saint Mary s met towers) Report written by: Douglas Vaught, P.E., V3 Energy, LLC Date of Report: February 9, 2009 Doug Vaught photo Summary
Saint Mary s, Alaska Wind Resource Report (for Pitka s Point and Saint Mary s met towers) Report written by: Douglas Vaught, P.E., V3 Energy, LLC Date of Report: February 9, 2009 Doug Vaught photo Summary
WIND DATA REPORT. Paxton, MA
 WIND DATA REPORT Paxton, MA July 1, 2011 September 30, 2011 Prepared for Massachusetts Clean Energy Center 55 Summer Street, 9th Floor Boston, MA 02110 by Eric Morgan James F. Manwell Anthony F. Ellis
Draft Kivalina Wind Resource Report
 Draft Kivalina Wind Resource Report Kivalina aerial photo by Doug Vaught, July 2011 May 31, 2012 Douglas Vaught, P.E. dvaught@v3energy.com V3 Energy, LLC Eagle River, Alaska Draft Kivalina Wind Resource
3D Nacelle Mounted Lidar in Complex Terrain
 ENERGY 3D Nacelle Mounted Lidar in Complex Terrain PCWG Hamburg, Germany Paul Lawson 25.03.2015 1 DNV GL 125.03.2015 SAFER, SMARTER, GREENER Agenda Introduction and Project Background Lidar Specifications
A Wind Profiling Platform for Offshore Wind Measurements and Assessment. Presenter: Mark Blaseckie AXYS Technologies Inc.
 A Wind Profiling Platform for Offshore Wind Measurements and Assessment Presenter: Mark Blaseckie AXYS Technologies Inc. Any Sensor, Any Telemetry, Any Environment Founded in 1974 Part of the AXYS Group
WIND DATA REPORT. Bourne Water District
 WIND DATA REPORT Bourne Water District July to September 2010 Prepared for Massachusetts Clean Energy Center 55 Summer Street, 9th Floor Boston, MA 02110 by Dylan Chase James F. Manwell Utama Abdulwahid
Kake, Alaska Wind Resource Report
 Kake, Alaska Wind Resource Report Kake met tower, photo provided by SEACC January 6, 2012 Douglas Vaught, P.E. V3 Energy, LLC Eagle River, Alaska Kake, Alaska Met Tower Wind Resource Report Page 2 Project
LONG TERM SITE WIND DATA ANNUAL REPORT. Mass Turnpike Authority Blandford, MA
 LONG TERM SITE WIND DATA ANNUAL REPORT Mass Turnpike Authority Blandford, MA July 1, 2012 June 30, 2013 Prepared for Massachusetts Clean Energy Center 55 Summer Street, 9th Floor Boston, MA 02110 by Dylan
WindPRO version Nov 2012 Project:
 23/11/2012 15:21 / 1 WAsP interface - Main Result Calculation: WAsP Interface example Name for WAsP Site coordinates UTM NAD27 Zone: 14 East: 451,101 North: 5,110,347 Air density calculation mode Result
WIND DATA REPORT. Swan s Island, ME
 WIND DATA REPORT Swan s Island, ME June 1, 2009 August 31, 2009 Prepared for US Department of Energy by Daniel T. Grip Utama Abdulwahid James F. Manwell Anthony F. Ellis September 17, 2009 Report template
Characterization of winds through the rotor plane using a phased array SODAR and recommendations for future work
 Publications (E) Energy 2-2010 Characterization of winds through the rotor plane using a phased array SODAR and recommendations for future work Regina Anne Deola Sandia National Laboratories Follow this
Test Summary Report Giraffe 2.0 Hybrid Wind-Solar Power Station - for wind: according to IEC Annex M - for solar: measurement report
 Contact person Tanja Tränkle 2016-06-29 4P05805-R01 rev. 1 1 (7) Safety +46 10 516 57 19 Tanja.Trankle@sp.se Innoventum AB Morgan Widung / Marcus Ulmefors Turning Torso office 275 Lilla Varvsgatan 14 211
National Renewable Energy Laboratory. Wind Resource Data Summary Guam Naval Ordnance Annex Data Summary and Retrieval for November 2009
 National Renewable Energy Laboratory Wind Resource Data Summary Guam Naval Ordnance Annex Data Summary and Retrieval for November 2009 Prepared for: National Renewable Energy Laboratory 1617 Cole Boulevard
Quinhagak, Alaska Wind Resource Report
 Report prepared by: Douglas Vaught, V3 Energy LLC, Eagle River, AK Date of report: November 21, 2006 Photo: Doug Vaught Quinhagak Meteorological Tower Data Synopsis Wind power class (measured to date)
WindProspector TM Lockheed Martin Corporation
 WindProspector TM www.lockheedmartin.com/windprospector 2013 Lockheed Martin Corporation WindProspector Unparalleled Wind Resource Assessment Industry Challenge Wind resource assessment meteorologists
Egegik, Alaska Wind Resource Assessment Report
 Egegik, Alaska Wind Resource Assessment Report Egegik met tower, photo by Douglas Vaught February 23, 2017 Douglas Vaught, P.E. V3 Energy, LLC www.v3energy.com Egegik, Alaska Wind Resource Assessment Report
Inuvik Wind Monitoring Update 2016
 Inuvik Wind Monitoring Update 2016 Source: MACA Prepared for By Jean Paul Pinard, P. Eng., PhD. 703 Wheeler St., Whitehorse, Yukon Y1A 2P6 Tel. (867) 336 2977; Email jpp@northwestel.net March 31, 2016
WIND DATA REPORT. Mt. Tom
 WIND DATA REPORT Mt. Tom September 1, 2003 November 31, 2003 Prepared for Massachusetts Technology Collaborative 7 North Drive Westborough, MA 0181 by James F. Manwell Anthony F. Ellis Taylor Geer January
WIND RESOURCE ASSESSMENT FOR THE STATE OF WYOMING
 WIND RESOURCE ASSESSMENT FOR THE STATE OF WYOMING Performed by Sriganesh Ananthanarayanan under the guidance of Dr. Jonathan Naughton, Professor, Department of Mechanical Engineering University of Wyoming,
Levelock, Alaska Wind Resource Assessment Report
 Levelock, Alaska Wind Resource Assessment Report Levelock met tower, photo by Douglas Vaught January 25, 2017 Douglas Vaught, P.E. V3 Energy, LLC Anchorage, Alaska Levelock, Alaska Wind Resource Assessment
WIND DATA REPORT. Mt. Lincoln Pelham, MA
 WIND DATA REPORT Mt. Lincoln Pelham, MA May 2009 to April 2010 Prepared for Massachusetts Department of Energy Resources 100 Cambridge Street, Suite 1020 Boston, MA 02114 by Jonathan D. Black James F.
High Ping Rate Profile Water Mode 12
 Application Note FSA-014 (October 2008) Revised October 2008 High Ping Rate Profile Water Mode 12 Introduction Water Mode 12 is the result of the continued evolution of the signal processing within our
Lopez Community Land Trust. Final Wind Energy Report
 Lopez Community Land Trust Final Wind Energy Report July 20th, 2007 Prepared by: Terrance Meyer P.E. Rose Woofenden 1 Table of Contents 1.0 INTRODUCTION 4 FIGURE 1.1 VESTAS TURBINE AT HULL, MA PROJECT
WIND DATA REPORT. Ragged Mt Maine
 WIND DATA REPORT Ragged Mt Maine December 1 st 2007 to February 29 th 2007 by James R. Browning James F. Manwell Utama Abdulwahid Anthony F. Ellis April 10, 2008 Report template version 3.1 Renewable Energy
Offshore Wind Turbine Wake Characterization using Scanning Doppler Lidar
 Offshore Wind Turbine Wake Characterization using Scanning Doppler Lidar R. Krishnamurthy a, J. Reuder b, B. Svardal c, H.J.S. Fernando a, J. B. Jakobsen d a University of Notre-Dame, Notre-Dame, Indiana
Vortex Flow Meter Wafer or Flange Connection. - Steam - Liquid - Gas
 Vortex Flow Meter Wafer or Flange Connection - Steam - Liquid - Gas Working Principle & Circuit Diagram Working Principle When a column body placed in flowing fluids in pipe, a series of vortices will
Session 2a: Wind power spatial planning techniques. IRENA Global Atlas Spatial planning techniques 2-day seminar
 Session 2a: Wind power spatial planning techniques IRENA Global Atlas Spatial planning techniques 2-day seminar Central questions we want to answer After having identified those areas which are potentially
Wind Projects: Optimizing Site Selection
 Wind Projects: Optimizing Site Selection ECOWAS Regional Workshop on Wind Energy Babul Patel, Principal Alain Rosier, Vice President Nexant, Inc. Praia, Cape Verde November 4-5, 2013 Basic Criteria for
Session 2: Wind power spatial planning techniques
 Session 2: Wind power spatial planning techniques IRENA Global Atlas Spatial planning techniques 2-day seminar Central questions we want to answer After having identified those areas which are potentially
Shaktoolik, Alaska Wind Resource Report
 Report written by: Douglas Vaught, P.E., V3 Energy, LLC Date of Report: November 3, 2008 Photo Doug Vaught V3 Energy, LLC 1 Summary Information The wind resource in Shaktoolik shows very good potential
Windcube FCR measurements
 Windcube FCR measurements Principles, performance and recommendations for use of the Flow Complexity Recognition (FCR) algorithm for the Windcube ground-based Lidar Summary: As with any remote sensor,
LONG TERM SITE WIND DATA QUARTERLY REPORT. Bishop and Clerks
 LONG TERM SITE WIND DATA QUARTERLY REPORT Bishop and Clerks April 1, 2012 June 30, 2012 Prepared for Massachusetts Clean Energy Center 55 Summer Street, 9th Floor Boston, MA 02110 by Frederick Letson James
Kisimigiuktuk Hill (Kivalina), Alaska Wind Resource Assessment and Wind Flow Modeling Report
, Alaska Wind Resource Assessment and Wind Flow Modeling Report") Kisimigiuktuk Hill (Kivalina), Alaska Wind Resource Assessment and Wind Flow Modeling Report Kisimigiuktuk Hill and Kivalina, Google Earth image with WAsP model wind speed overlay, view south May 26, 2017
Kisimigiuktuk Hill (Kivalina), Alaska Wind Resource Assessment and Wind Flow Modeling Report Kisimigiuktuk Hill and Kivalina, Google Earth image with WAsP model wind speed overlay, view south May 26, 2017
LONG TERM SITE WIND DATA QUARTERLY REPORT. Bishop and Clerks
 LONG TERM SITE WIND DATA QUARTERLY REPORT Bishop and Clerks January 1, 2012 March 31, 2012 Prepared for Massachusetts Clean Energy Center 55 Summer Street, 9th Floor Boston, MA 02110 by Frederick Letson
7 th International Conference on Wind Turbine Noise Rotterdam 2 nd to 5 th May 2017
 7 th International Conference on Wind Turbine Noise Rotterdam 2 nd to 5 th May 2017 Sound power level measurements 3.0 ir. L.M. Eilders, Peutz bv: l.eilders@peutz.nl ing. E.H.A. de Beer, Peutz bv: e.debeer@peutz.nl
Lely Aircon LA30 Wind turbine
 Lely Aircon LA30 Wind turbine Summary Details for Performance, Duration and Acoustic Measurements Lely Aircon 30 Wind Turbine UK MCS Certification Summary List of contents 1. List of included Amendments...
Lake Michigan Wind Assessment Project Data Summary and Analysis: October 2012
 Grand Valley State University ScholarWorks@GVSU Monthly Buoy Report Offshore Wind Project 1-1- Lake Michigan Wind Assessment Project Data Summary and Analysis: October Lake Michigan Offshore Wind Assessment
Comparison of flow models
 Comparison of flow models Rémi Gandoin (remga@dongenergy.dk) March 21st, 2011 Agenda 1. Presentation of DONG Energy 2. Today's presentation 1. Introduction 2. Purpose 3. Methods 4. Results 3. Discussion
Chevak, Alaska Wind Resource Report
 Report prepared by: Douglas Vaught, V3 Energy LLC, Eagle River, AK Date of report: February 21, 2007 Photo: Doug Vaught Summary Information Chevak has an outstanding wind resource for wind power development.
Sontek RiverSurveyor Test Plan Prepared by David S. Mueller, OSW February 20, 2004
 Sontek RiverSurveyor Test Plan Prepared by David S. Mueller, OSW February 20, 2004 INTRODUCTION Sontek/YSI has introduced new firmware and software for their RiverSurveyor product line. Firmware changes
WIND DATA REPORT. Mass Turnpike Authority Blandford, MA
 WIND DATA REPORT Mass Turnpike Authority Blandford, MA October 2011 December 2011 Prepared for Massachusetts Clean Energy Center 55 Summer Street, 9th Floor Boston, MA 02110 by Preeti Verma James F. Manwell
Oldman 2 Wind Farm Limited
 Decision 22676-D01-2017 Spring 2017 Post-Construction Sound Survey at Receptors B, J and K August 1, 2017 Alberta Utilities Commission Decision 22676-D01-2017 Proceeding 22676 Application 22676-A001 August
WIND DATA REPORT. Bishop and Clerks
 WIND DATA REPORT Bishop and Clerks March 1, 2004 May 31, 2004 Prepared for Massachusetts Technology Collaborative 75 North Drive Westborough, MA 01581 by James F. Manwell Anthony L. Rogers Anthony F. Ellis
Currents measurements in the coast of Montevideo, Uruguay
 Currents measurements in the coast of Montevideo, Uruguay M. Fossati, D. Bellón, E. Lorenzo & I. Piedra-Cueva Fluid Mechanics and Environmental Engineering Institute (IMFIA), School of Engineering, Research
Wind Regimes 1. 1 Wind Regimes
 Wind Regimes 1 1 Wind Regimes The proper design of a wind turbine for a site requires an accurate characterization of the wind at the site where it will operate. This requires an understanding of the sources
Wind Resource Assessment Østerild National Test Centre for Large Wind Turbines
 Downloaded from orbit.dtu.dk on: Jan 21, 2018 Wind Resource Assessment Østerild National Test Centre for Large Wind Turbines Hansen, Brian Ohrbeck; Courtney, Michael; Mortensen, Niels Gylling Publication
WIND DATA REPORT. Quincy DPW, MA
 WIND DATA REPORT Quincy DPW, MA March 1 st 2007 to May 31 st 2007 Prepared for Massachusetts Technology Collaborative 75 North Drive Westborough, MA 01581 by James R. Browning James F. Manwell Anthony
Nikolski, Alaska Wind Resource Report
 Report written by: Douglas Vaught, P.E., V3 Energy LLC, Eagle River, AK Date of report: March 27, 2007 Photo by Mia Devine, Alaska Energy Authority V3 Energy LLC 1 of 30 Summary Information Nikolski has
OPERATIONAL USE OF A WIND PROFILER FOR AVIATION METEOROLOGY ABSTRACT
 OPERATIONAL USE OF A WIND PROFILER FOR AVIATION METEOROLOGY Miguel Angel Pelacho, Darío Cano, Eugenio Ayensa Spanish Agency of Meteorology (AEMET) Parque del Buen Retiro, Apdo. 285, 28080-MADRID E-mail:
Terms and Definitions for Small Wind Site Assessor
 Terms and Definitions for Small Wind Site Assessor AEO/ AEP: Annual energy output, also known as AEP, annual energy production of the wind electric system. Alpha: Surface friction coefficient, used to
Gambell, Alaska Wind Resource Report
 Report written by: Douglas Vaught, V3 Energy LLC, Eagle River, AK Date of report: October 5, 2006 Photo Doug Vaught General Site Information Site number 0030 Site Description Gambell, Alaska Latitude/longitude
CONSTRUCTION OF LNG RECEIVING TERMINAL ON THE SAINT LAWRENCE TIDAL CURRENT CONDITIONS IN THE LEVIS AREA
 RABASKA PROJECT CONSTRUCTION OF LNG RECEIVING TERMINAL ON THE SAINT LAWRENCE TIDAL CURRENT CONDITIONS IN THE LEVIS AREA FINAL REPORT MARCH 2006 N/Réf. : 24237.360 3075, ch. des Quatre-Bourgeois Sainte-Foy
Atmospheric air density analysis with Meteo- 40S wind monitoring system
 MATEC Web of Conferences, 7 (7) DOI:./ matecconf/77 IManE&E 7 Atmospheric air density analysis with Meteo- S wind monitoring system Dănuț Zahariea,*, and Dorin Emil Husaru Gheorghe Asachi Technical University
New Stuyahok-Ekwok Intertie Route Wind Power Site Options
 New Stuyahok-Ekwok Intertie Route Wind Power Site Options November 30, 2015 Douglas Vaught, P.E. V3 Energy, LLC Anchorage, Alaska www.v3energy.com New Stuyahok-Ekwok Intertie Wind Power Site Options Page
Meteorological Measurements OWEZ
 Meteorological Measurements OWEZ Half year report - 01-07-2008-31-12-2008 H. Korterink P.J. Eecen J.W. Wagenaar ECN-E--09-018 OWEZ_R_121_20080701-20081231_WIND_RESOURCE_2008_2 Abstract NoordzeeWind carries
Outline. Wind Turbine Siting. Roughness. Wind Farm Design 4/7/2015
 Wind Turbine Siting Andrew Kusiak 2139 Seamans Center Iowa City, Iowa 52242-1527 andrew-kusiak@uiowa.edu Tel: 319-335-5934 Fax: 319-335-5669 http://www.icaen.uiowa.edu/~ankusiak Terrain roughness Escarpments
Define transverse waves and longitudinal waves. Draw a simple diagram of each
 AP Physics Study Guide Chapters 11, 12, 24 Waves, Sound, Light & Interference Name Write the equation that defines each quantity, include units for all quantities. wave speed-wavelength equation natural
Meteorological Measurements OWEZ
 Meteorological Measurements OWEZ Half year report 01-01-2008-30-06-2008 H. Korterink P.J. Eecen ECN-E--08-062 OWEZ_R_121_20080101-20080630_wind_resource_2008_1 Abstract NoordzeeWind carries out an extensive
Clark s Point, Alaska Wind Resource Report
 Report written by: Douglas Vaught, P.E., V3 Energy, LLC Photo Doug Vaught Summary Information The wind resource study in Clark s Point indicates excellent potential for the development of wind power to
Anemometry. Anemometry. Wind Conventions and Characteristics. Anemometry. Wind Variability. Anemometry. Function of an anemometer:
 Anemometry Anemometry Function of an anemometer: Measure some or all of the components of the wind vector In homogeneous terrain, vertical component is small express wind as -D horizontal vector For some
LONG TERM SITE WIND DATA ANNUAL REPORT. Paxton, MA
 LONG TERM SITE WIND DATA ANNUAL REPORT Paxton, MA July 1, 2012 June 30, 2013 Prepared for Massachusetts Clean Energy Center Summer Street, 9th Floor Boston, MA 021 by Dylan D. Chase James F. Manwell Anthony
Minimal influence of wind and tidal height on underwater noise in Haro Strait
 Minimal influence of wind and tidal height on underwater noise in Haro Strait Introduction Scott Veirs, Beam Reach Val Veirs, Colorado College December 2, 2007 Assessing the effect of wind and currents
GNX 20/21. Owner s Manual
 GNX 20/21 Owner s Manual Table of Contents Introduction...1 Device Overview... 1 Using the Race Timer... 1 Profiles... 1 Selecting a Profile... 1 Restoring Profiles to their Default Settings... 1 Instrument
N. Robinson and A. Pyne
 ISSN 0375 8192 March 2004 Antarctic Data Series No 26 WATER COLUMN CURRENT PROFILE ANALYSIS FROM BENEATH THE MCMURDO ICE SHELF AT WINDLESS BIGHT AND UNDER THE SEA ICE IN GRANITE HARBOUR, ANTARCTICA N.
Full Classification acc. to IEC for SoDAR AQ510 Wind Finder. Vincent Camier, Managing Director, Ammonit Measurement GmbH
 Full Classification acc. to IEC 61400-12-1 for SoDAR AQ510 Wind Finder Vincent Camier, Managing Director, Ammonit Measurement GmbH Ammonit Company Profile German company, based in Berlin +25 years of know-how
Dick Bowdler Acoustic Consultant
 Dick Bowdler Acoustic Consultant 01383 882 644 077 8535 2534 dick@dickbowdler.co.uk WIND SHEAR AND ITS EFFECT ON NOISE ASSESSMENT OF WIND TURBINES June 2009 The Haven, Low Causeway, Culross, Fife. KY12
Increased Project Bankability : Thailand's First Ground-Based LiDAR Wind Measurement Campaign
 Increased Project Bankability : Thailand's First Ground-Based LiDAR Wind Measurement Campaign Authors: Velmurugan. k, Durga Bhavani, Ram kumar. B, Karim Fahssis As wind turbines size continue to grow with
Session 2b: Wind power spatial planning techniques
 Session 2b: Wind power spatial planning techniques IRENA Global Atlas Spatial planning techniques 2-day seminar Central questions we want to answer After having identified those areas which are potentially
REMOTE SENSING APPLICATION in WIND ENERGY
 REMOTE SENSING APPLICATION in WIND ENERGY Siraj Ahmed Professor & Head Department of Mechanical Engineering Maulana Azad National Iinstitute of Technology Bhopal, India sirajahmed@manit.ac.in Contents
PARK - Main Result Calculation: PARK calculation (5 x 166m, + LT CORR + MITIGATION) N.O. Jensen (RISØ/EMD)
 N.O. Jensen (RISØ/EMD)") PRK - Main Result Calculation: PRK calculation (5 x V15 @ 166m, + LT CORR + MITIGTION) Wake Model N.O. Jensen (RISØ/EMD) Calculation Settings ir density calculation mode Result for WTG at hub altitude
PRK - Main Result Calculation: PRK calculation (5 x V15 @ 166m, + LT CORR + MITIGTION) Wake Model N.O. Jensen (RISØ/EMD) Calculation Settings ir density calculation mode Result for WTG at hub altitude
Visualize Nitrogen Gas Consumption
 Air Flow Monitor EWA2 SERIES Conforming to EMC Directive (all models) & Pressure Equipment Directive (AEWA2150/2200 only) Visualize Nitrogen Gas Consumption Small pipe size as Well as Air Consumption!
Yellowknife Area Wind Potential
 Yellowknife Area Wind Potential Prepared for by Jean-Paul Pinard, P. Eng., PhD. 703 Wheeler St., Whitehorse, Yukon Y1A 2P6 Tel. (867) 336-2977; Email jpp@northwestel.net, and Annika Trimble (Ed.), Aurora
July Interim Report. National Institute of Wind Energy (NIWE) Wind Resource Assessment & Offshore Unit Chennai, India.
 Wind Resource Assessment & Offshore Unit Chennai, India.") Interim Report (First Offshore Lidar wind data analysis) July 2018 Prepared by National Institute of Wind Energy (NIWE) Wind Resource Assessment & Offshore Unit Chennai, India. W I N D R E S O U R C E
Interim Report (First Offshore Lidar wind data analysis) July 2018 Prepared by National Institute of Wind Energy (NIWE) Wind Resource Assessment & Offshore Unit Chennai, India. W I N D R E S O U R C E
Power curves - use of spinner anemometry. Troels Friis Pedersen DTU Wind Energy Professor
 Power curves - use of spinner anemometry Troels Friis Pedersen DTU Wind Energy Professor Spinner anemometry using the airflow over the spinner to measure wind speed, yaw misalignment and flow inclination
Background Preliminary Review... 3
 January 23, 2012 Evaluation of Prop osed NRWC Wind Farm on Lo cal Micro climate: Preliminary Review & Work Plan For: Debbie Zimmerman Chief Executive Officer Grap e Growers of Ontario P.O. Box 100 Vineland
Physics 1520, Spring 2014 Quiz 1A, Form: A
 Physics 1520, Spring 2014 Quiz 1A, Form: A Name: Date: Section 1. Multiple Choice 1. The image below shows two different types of sinusoidal waves produced on a slinky. Which wave is the same type of wave