THE INTERACTION BETWEEN SAILING YACHTS IN FLEET AND MATCH RACING SITUATIONS
|
|
|
- Maria Reeves
- 6 years ago
- Views:
Transcription

1 THE INTERACTION BETWEEN SAILING YACHTS IN FLEET AND MATCH RACING SITUATIONS P.J. Richards, Yacht Research Unit, University of Auckland, New Zealand N. Aubin, École Navale, France D.J. Le Pelley, Yacht Research Unit, University of Auckland, New Zealand SUMMARY The interaction between yachts sailing upwind close hauled is investigated in the wind tunnel through measurement of the forces and moments on a balance mounted key boat which is experiencing interference from one or two opponent boats. For most of the tests the boats were set at an apparent wind angle of 25 and a heel angle of 25. In addition the variation of forces and moments on the key boat, in isolation, were measured over a range of apparent wind angles and the drive to side force ratio is subsequently used as an indicator of the effective apparent wind angle when an interfering boat is present. The data from two boat testing was analysed to show that much of the reduction in drive force is due to changes in wind angle rather than wind pressure. These changes in angle and wind pressure are shown to be similar to those measured around an isolated yacht using two 3-component velocity measuring Cobra probes. With three boat interference there are too many possible position combinations to consider all of these and so tests focused on two starting line and two layline scenarios. The relative importance of each interfering yacht is investigated and the effects of separation on interference demonstrated. 1. INTRODUCTION AND BACKGROUND In an earlier paper Richards et al. (2013) presented wind tunnel measurements of the interaction between two yachts when sailing upwind and downwind, with both symmetric and asymmetric spinnakers. The correct location of the negative interference and severe negative interference zones was presented for each sailing situation. In particular they pointed out that the popular understanding of interference, as encapsulated in documents such as Racing Basics by Mark Johnson (1995), doesn t emphasise that the important wind vector is the apparent wind, relative to the yacht, which is calculated by the vector sum of the true wind and the reversed boat velocity. Although interference may be important during any leg of a race, it is often on the upwind legs where yachts are forced into closer proximity and hence this paper will focus on these upwind interactions. Initially two boat interference is studied in greater detail and then multiple boat interference is considered. Figure 1 shows an example of a two boat test, where the key boat, to the right, is mounted on the 6-component force balance, which sits below the black turntable, while the interfering yacht, with its white hull and sails, is moved to a variety of relative positions. For the current testing all yachts have been set up with 25 of heel and for most tests the apparent wind angle is 25. Figure 1 Two boat testing in the University of Auckland Twisted Flow Wind Tunnel
2 Marchaj (1982) provides a detailed discussion of situations similar to that shown in Figure 1, and points out that the key boat is in what is called the safe leeward position where it may experience both an increase in wind speed and a favourable change of local wind direction as a result of the windward yacht. In contrast he describes the position of the white yacht as the hopeless position, since almost any option will result in losses. He points out that the turbulent wake behind the sail when close-hauled is deflected away from the line of the apparent wind toward the stern. He also comments that the influence of the wind deflection and turbulence behind a yacht can be felt for up to ten boat lengths. Marchaj also reproduces some quantitative wind tunnel data collected by M.S. Hooper using J-class yacht models. The apparent wind angle (AWA, the angle between the apparent wind and yacht velocity vectors) for both yachts was 40 and the yachts were heeled 15. This AWA might typically occur when reaching, that is sailing approximately perpendicular to the true wind direction. The position of the interfering yacht was fixed while the interfered with yacht was moved about in relation to the fixed yacht. The data is presented as contours of the available drive force, component in the direction of motion, on the interfered with yacht as a percentage of the driving force which would be available in an undisturbed wind. The lowest percentages, down to 0-10%, were recorded along the line of the apparent wind downstream of the interfering yacht. Almost all downwind positions showed a loss of drive force which returned to nearly 100% one boat length either side of the centreline. Two regions of positive interference were identified. The strongest of these, with a gain of 20%, was located at the safe leeward position with the two models in-line across the apparent wind and with the interfered with yacht 0.6 boat lengths on the leeward side of the interfering yacht. The other region of positive interference (up to 5%) was half a boat length windward of the interfering model along the 60 direction (measured from the centreline of the interfering yacht). Caponnetto (1996) used a vortex lattice code to analyse the interference between two identical IACC yachts when sailing close-hauled with an AWA of 25. The heel angle was 0. In this study the key boat was fixed at the origin while a second boat has been positioned at various radii (R= 0.5, 1 and 2 mast heights (h)) for all angles around the key boat. At all three radii the lowest drive force and side force on the key boat occurred when the second boat was at an angle of 22 (measured from the bow in the same manner as the AWA) which is almost along the apparent wind line. At this angle the wake of the windward yacht crosses the key boat. With the second boat in this direction the ratio of the drive on the windward second boat to that on the leeward key boat is 4.8 for R=0.5h, 2.6 for R=1h and 2.0 for R=2h, which clearly shows the reduced interference as the yachts move apart. The results are also presented as the ratio of the drive force on the affected yacht to that for an isolated yacht sailing alone in free air. It is shown that when the yachts are moderately close to each other (R=1h) and the relative direction is 22 the ratio of 2.6 is produced by a 4% gain for the second boat and a 60% reduction in drive force for the key boat. The data shows that the key boat gets some positive interference if the second boat lies within a sector of ±60 of directly astern. Caponnetto (1996) points out the interesting observation that the drive force on the two interfering yachts is equal when the relative angle is 96 for all three separations considered. With this relative positioning two identical yachts could maintain the same speed and hence remain in the same orientation. However the data shows that in this case the drive force is 3% lower than an isolated yacht and so if they were both part of a fleet race then while they can match each other, they will be losing ground relative to other yachts. While most studies to date have only considered two boat interactions, Spenkuch et al. (2008) have proposed a lifting line method for modelling covering and blanketing effects for yacht fleet race simulations. With this approach the wake of an upwind sailing yacht is represented as a single heeled horseshoe vortex (and image) system. At each time step changes in vortex strength are convected into the wake as a pair of vortex line elements. These subsequently move in accordance with the local wind, self-induced velocity and velocity induced by the presence of the wakes of other yachts. The lifting line approach was compared with CFD results and showed good agreement for single and two yacht setups. While the method is intended for use in fleet race situations, no CFD results are included for situations involving more than two yachts. In Section 2 the important multiple yacht interference scenarios are discussed, while in Section 3 the wind tunnel modelling considerations are outline. Sections 4-6 deal with the results from 1, 2 and 3 boat testing. 2. FLEET AND MATCH RACING SENARIOS With either fleet or match races the course will typically take the form depicted in Figure 2 with the start line set up perpendicular to the true wind. The race will then consist of a number of windward and leeward legs. In this paper we will concentrate on interference between yachts during the upwind legs. With match racing the two yachts will often choose to be in close proximity to each other in order to avoid the chances of their opponent gaining a race winning advantage from being on the beneficial side of a wind shift. In fleet races it is almost impossible to cover all opponents and so interference effects tend to occur most frequently in situations such as: 1. At the starting line where all yachts are concentrated in a restricted area. 2. On occasions where a yacht on port tack encounters an opponent on starboard tack and is obliged to tack. 3. Along the lay lines leading up to the windward mark. In such situations the most likely interactions are between two boats, then three boats and least often more than three boats, which probably only occurs near the starting line. Even if there are several yachts in close proximity, the fact that interference effects tend to weaken with distance means that each boat is only significantly affected by those boats close to it and so this study will only consider 2 and 3 boat interactions.
3 True Wind Direction Starting line Start zone Figure 2 Classic fleet or match race course 3. WIND TUNNEL SETUP With wind tunnel testing of the interaction between yachts there are a number of factors which need to be considered and noted. These include: Since all models will be stationary, the situations modelled must represent two or more yachts moving with the same velocity vector. This means that the yachts must be on the same tack (port or starboard) and travelling at or near the same boat speed (V B ). Crossing situations cannot be accurately modelled. In reality the interactions between boats will mean that the forces on the various boats will be different and so one or more boats will slow down relative to the others. Fortunately the relative movements caused by these imbalances are quite slow with one yacht slowly pulling ahead of the other(s). This means that a passing manoeuvre can be considered to be a series of quasi-steady situations, where the yachts can be considered to be moving at almost the same speed, but with their relative positions changing. At the University of Auckland it is standard practice to carry our all testing on port tack. However, since all yachts are assumed to be symmetric, the results can be mirrored to represent starboard tack situations. Since the models are stationary the air movement generated by the wind tunnel represents the apparent wind (AWS), the vector sum of the true wind (TWS) and the reversed boat speed (-V B ) as illustrated in Figure 3. The University of Auckland wind tunnel is known as the Twisted Flow Wind Tunnel, but for the tests reported here the turning vanes, which create the twist, were not used. The twist in the apparent wind is created by the changes in the vector diagram with height, since the true wind speed increases with height whereas the boat speed remains constant. For off wind sailing conditions this twist can be significant but for the upwind conditions considered here the twist is at most a few degrees and hence can be ignored. This is fortunate since the vanes would interfere with many of the locations where we wish to place models.
4 In Section 6 two of starting line scenarios will be considered. As noted in Section 2 the starting line may be considered to be perpendicular to the true wind, which means that it will not lie directly across the wind tunnel but instead will be angled slightly. In many races the run to the starting line may be mistimed and so a yacht may have to shed speed in order to avoid crossing the starting line early. This means that the yachts on the starting line may in reality have a variety of forward speeds. However the ideal situation is that all yachts hit the starting line at full speed at exactly the right moment. It is this ideal situation which is modelled in the tests reported here. In order to minimise changes in sail shape, semi-rigid fibreglass sails have been used on all models. These sails generally have a more realistic upwind shape and while some trimming can be carried out they tend to be much less sensitive to unintended trim changes. Since the current investigation is concerned with general trends rather than a specific yacht in particular situations, the conditions chosen are intended to be generic. It has been assumed that the yacht will maximise its upwind velocity made good with a true wind angle (TWA) of 42 and that the yacht is then sailing at an apparent wind angle (AWA) of 25. Simple analysis of the velocity triangle, shown in Figure 3, shows that these angles correspond to the condition when the boat speed is about 70% of the true wind speed. Most monohull displacement yachts can achieve boat speed to true wind speed (V B /TWS) ratios higher than 0.7 at low wind speeds but will drop below this ratio as the wind speed strengthens. With the chosen angles the apparent wind speed (AWS) is 1.58 times the true wind speed and the starting line (assumed perpendicular to the true wind) is at an angle of 73 to the apparent wind (and hence the wind tunnel centreline). The heel angle was set to 25. The yacht model used as the key boat had a mast height of h=2.2m, sail area A=1.64 m 2 and hull length of L=1.5m. The other models were very similar. Figure 3 Velocity Vector Diagram 4. SINGLE YACHT TESTING In order to understand the interactions between yachts it is first necessary to understand the way in which the local flow conditions affect the forces on a yacht and the way the yacht affects the local flow field. For this reason two sets of single yacht tests have been conducted, one to determine the forces and moments on a yacht at a variety of apparent wind angles and the second to measure the flow field around the model. 4.1 Apparent wind angle effects on forces and moments In the first of these single model tests the balance mounted model was tested at apparent wind angles (AWA) from This range is deliberately asymmetric with the respect to the standard test AWA of 25 since the interactions are more likely to reduce the effective apparent wind angle than increase it. The general forces (F) and moments (M) have been reduced to coefficient form by using: C = F / qa and F C M qa 3/ 2 M = / (1) where q (=0.5ρ(AWS) 2 ) is the reference dynamic pressure based on the air density ρ and the Apparent Wind Speed, and A is the total sail area.
5 Figure 4 shows the variation of the primary force and moment coefficients with apparent wind angle. The sails were trimmed to maximise the drive force at AWA=25 and then remained in the same positions for other angles. Since the sails are made from fibreglass they retain their shape even when soft sails would distort due to back winding. As a result the data in Figure 4 is valid for the tests conducted but would be slightly different at low apparent wind angles with flexible sails. Force or Moment Coefficient C S = -3.84E-05x E-03x E-02x -1.22E-01 Side Force Roll Moment Drive Force Poly. (Side Force) AWA (degrees) Figure 4 Force and moment coefficients as a function of apparent wind angle For a particular trim the forces and moments on the yacht can be assumed to be a function of the effective apparent wind angle and the effective dynamic pressure. As a result the interaction between yachts can be considered to be a mixture of these two effects. Since the drive force reduces to zero more rapidly than the side force, the ratio of these forces can be used as an indicator of the effective apparent wind angle. The forces individually cannot be used for this purpose since they are modified by both changes in wind direction and strength. By using the drive/side force ratio the influence of the wind strength is removed and the results can then be used to indicate the effective apparent wind angle. In order to do this the apparent wind angle has been plotted against the drive/side force ratio and a polynomial fitted to this curve as shown in Figure 5. Once the effective apparent wind angle has been determined a corresponding side force coefficient can be obtained from the polynomial fitted to the curve in Figure 4. The measured side force can then be divided by the side force coefficient and the sail area in order to give an estimate of the effective wind dynamic pressure. In this way it is possible to differentiate between reductions in drive force caused by a change in wind direction from that caused by a reduction of wind pressure. AWA (degrees) AWA = x x x x Drive/Side Figure 5 Apparent wind angle as indicated by the drive/side force ratio


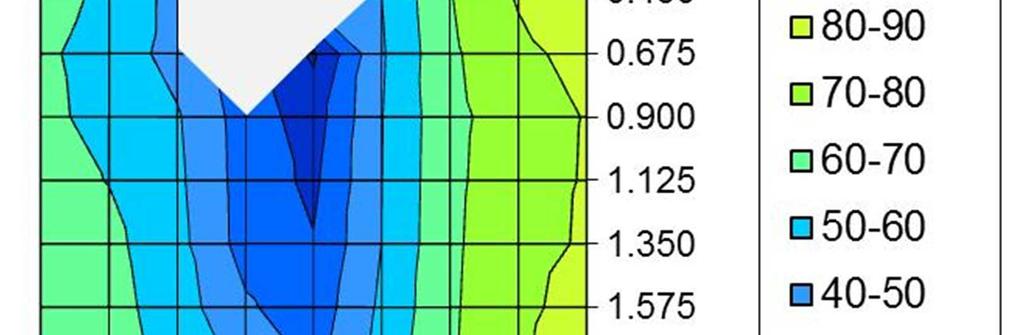
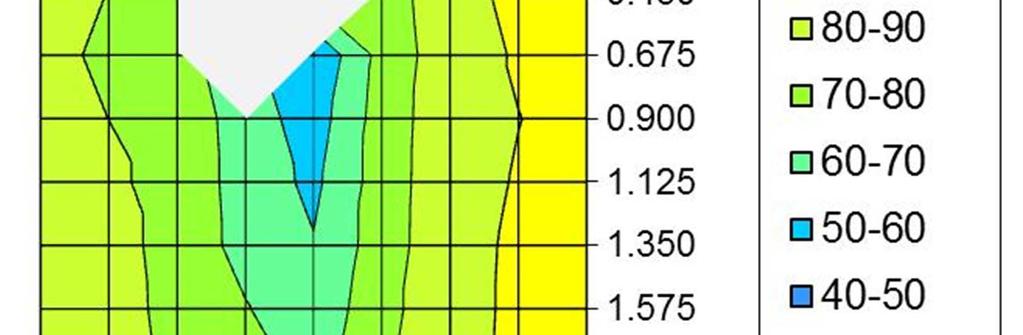
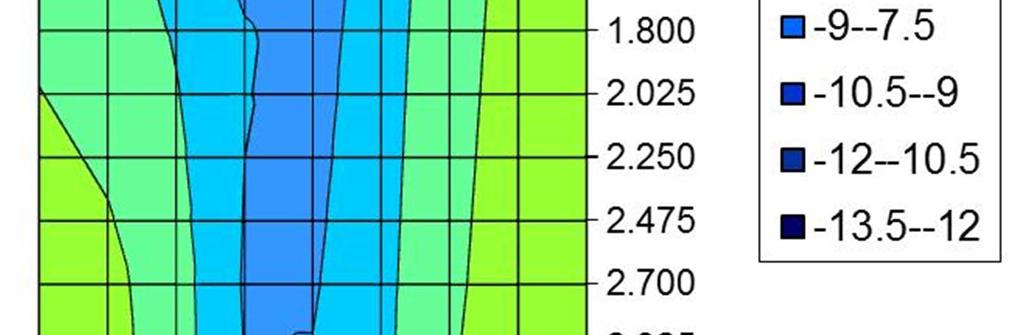
6 4.2 Modified Flow Field For the second single boat test two Cobra probes were mounted on a stand at heights of z=h/3 amd z=2h/3. These probes can measure the three components of the wind speed vector at moderate frequencies. For this test the model yacht was positioned well upstream in the wind tunnel and the probe stand moved in a regular grid around the model. Care was taken to make sure that the probe had the same alignment at all locations. There was a region close to the hull and below the heeled sails where the probes could not be positioned, this is indicated in Figure 6 by the blanked-out area around the hull. The data collected has been processed to give contour maps of the changes in the local apparent wind angle, the percentage strength of the wind dynamic pressure (q, based on the total wind speed at each point) and the local flow elevation angle, all relative to the values measured without the model present. The results, shown in Figure 6a & b, show that upstream of the yacht the flow is deflected slightly such that a yacht in that location would experience a small increase in the apparent wind angle, whereas downstream the changes in effective apparent wind angle are much larger and extend over a greater area. At the lower level the flow deflections are highest immediately downstream of the yacht and the centreline of the affected zone seems to lie between the upstream apparent wind direction (straight down the page) and the yacht s centreline. At the higher level the deflection angles are somewhat smaller, more localised and reach their maximum value some distance downstream. The most affected zone is also more aligned with the upstream apparent wind. Figures 6c & d both show a region of increase dynamic pressure on the windward side of the yacht. This can be associated with the circulation created around the sails. In addition at the lower level there is a clear wake region with reduced dynamic pressure, which at this level coincides with the greatest changes in local apparent wind angle. The elevation angles in Figures 6e & f indicate an upward flow on the windward side of the yacht and a downward flow on the leeward side. The strong vertical flows in Figure 6f indicate the presence of the tip vortex shed from the head of the sails and carried downstream by the apparent wind. It may be noted that the change from upward to downward flow is a roughly the same location as the largest changes in AWA in Figure 6b. Figure 6 Changes in local wind direction, strength and elevation angle at z=h/3 and 2h/3 (Continued on next page)


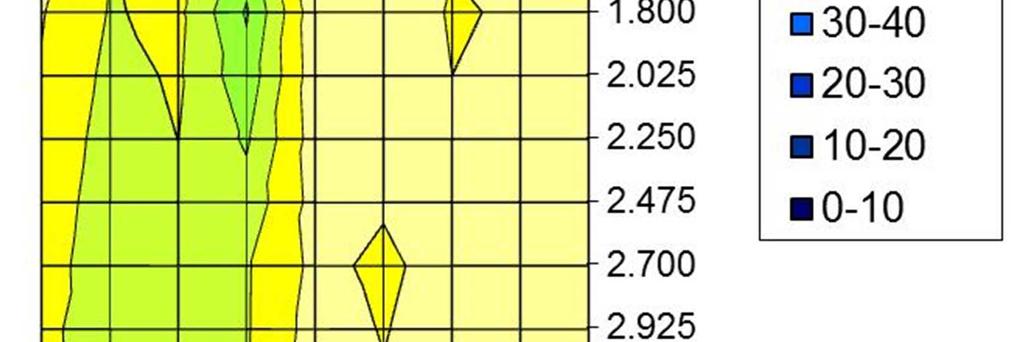
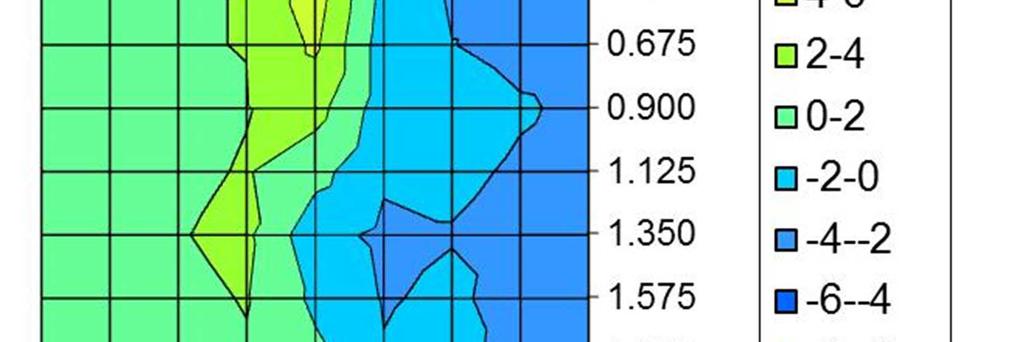
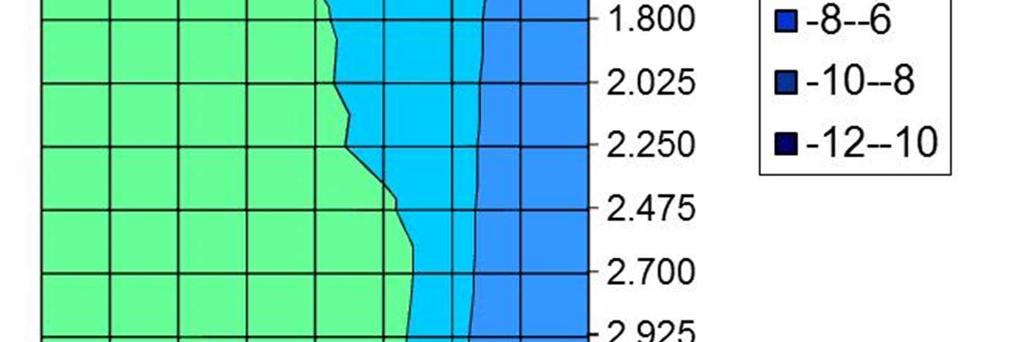
7 Figure 6 Changes in local wind direction, strength and elevation angle at z=h/3 and 2h/3

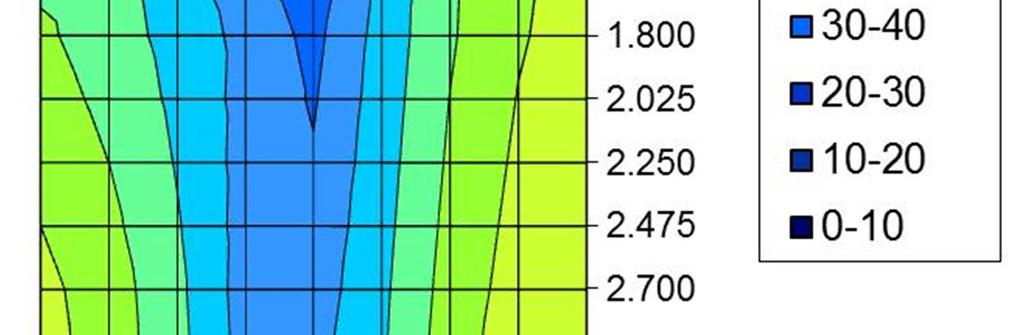
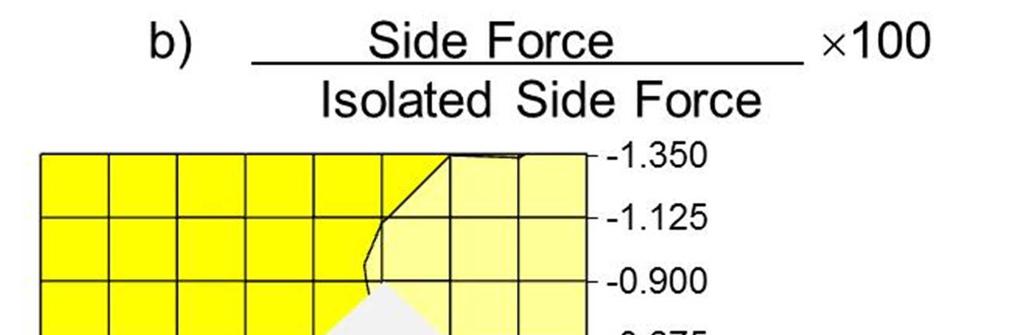
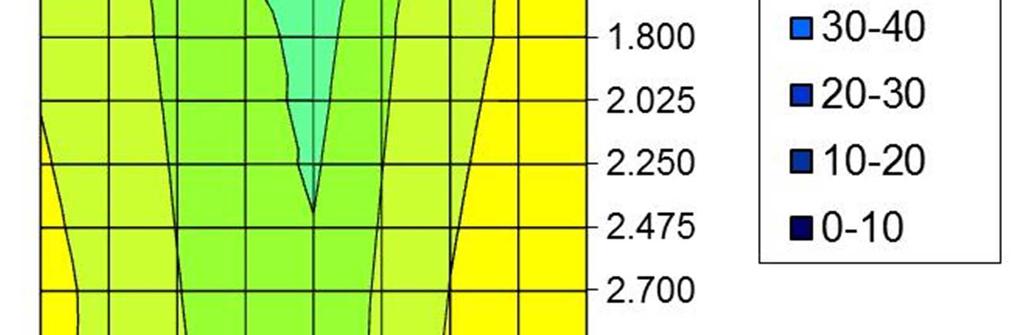
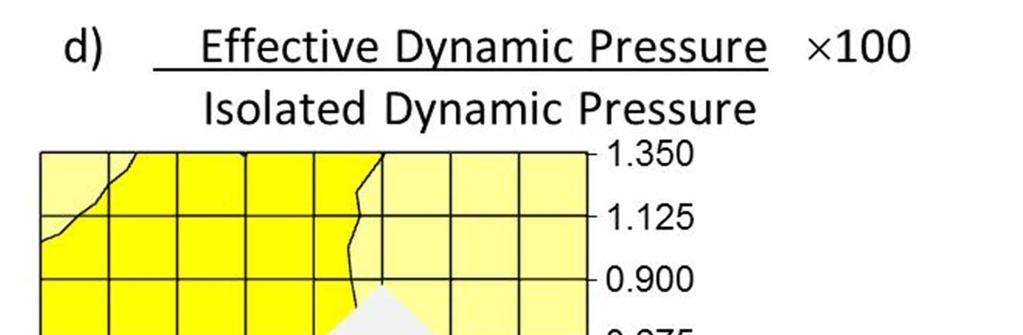
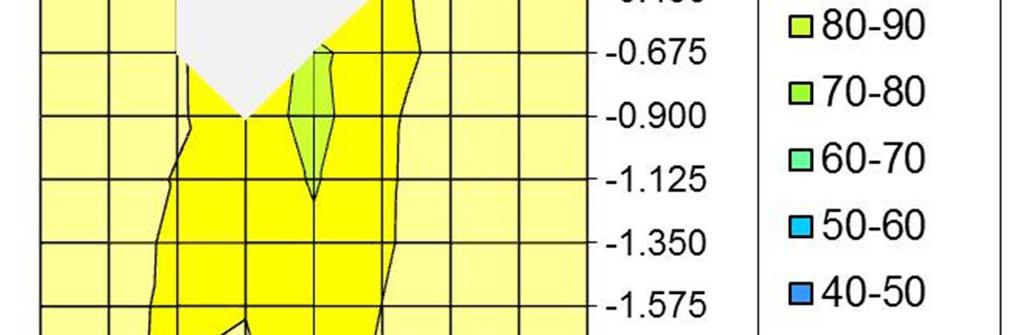
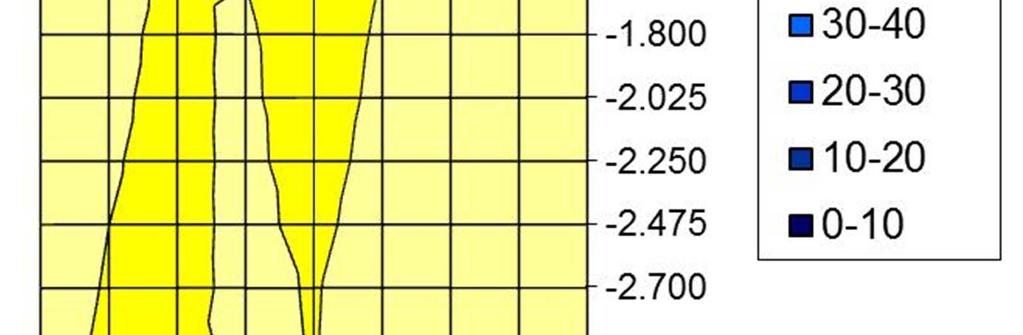
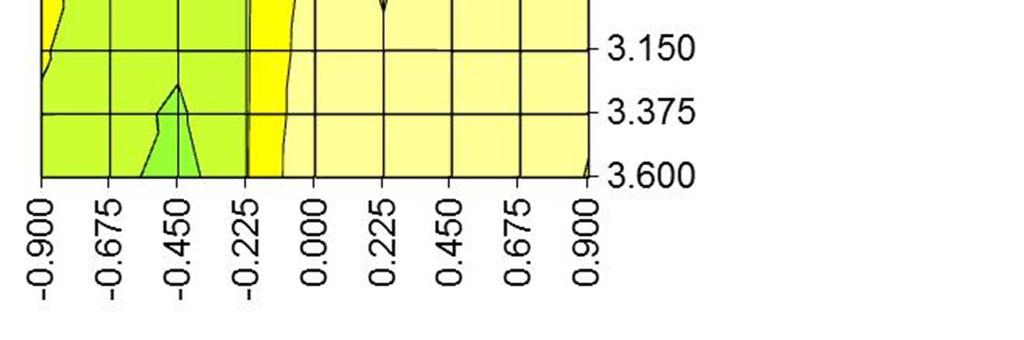
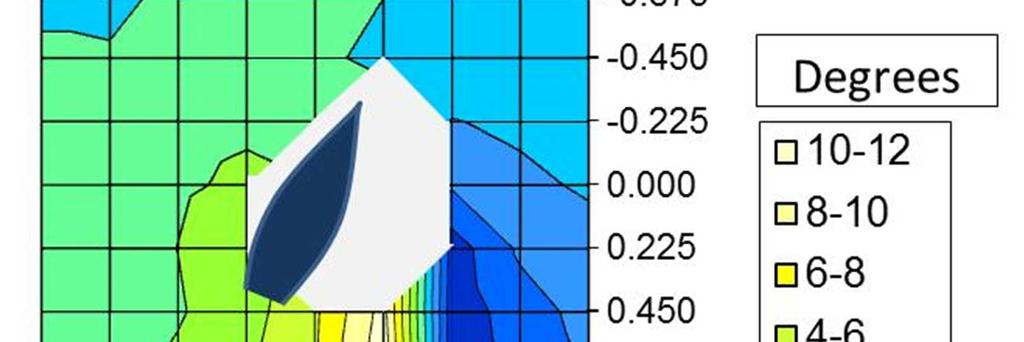
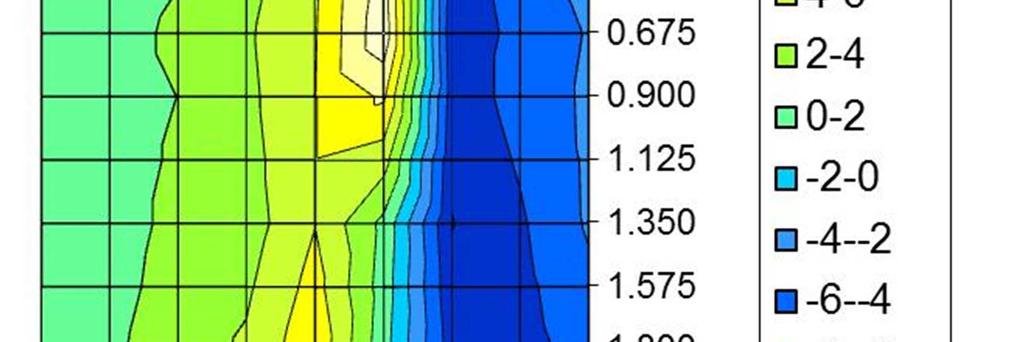
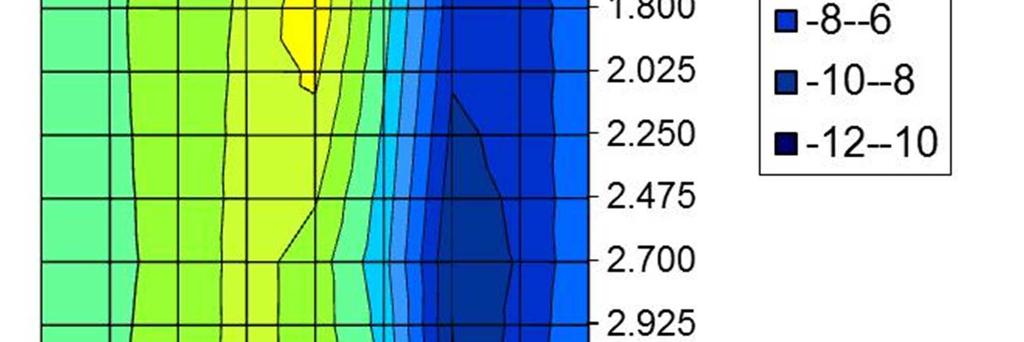
8 ` Figure 7 Reductions in a) Drive force, b) Side Force and d) Effective Dynamic pressure and c) changes in apparent wind angle for another yacht located at each point, when experiencing interference from the yacht shown.
9 5. TWO YACHT TESTING In a manner similar to the Cobra probe measurements, two boat testing has been conducted with one model mounted on the balance and the second model moved around it. The forces measured have then been processed in order to calculate the percentage of the isolated drive force and side force that occurs with interference. In order to relate these measurements with the flow field measurements the contour maps in Figures 7a & b show the percentage of the isolated values that are felt by another yacht at each location if it is affected by the one shown. This means that the yacht shown at point 0,0 is the interfering yacht. The results show that a yacht in the lee bow position experiences a slight increase in both the drive and side force. However if the yacht is in the wake of the interfering yacht then the drive force is reduced significantly and the side force to a lesser extent. The data has been analysed using the polynomials discussed in section 4.1 to determine whether the reductions indicate a change in wind direction or a reduction in wind strength. The results in Figures 7c & d show patterns similar to those in Figure 6, though since the forces on the model are an integral of the flows at all heights the indicated changes in apparent wind angle are less severe than measured at z=h/3, as seen in Figure 6a. It is worth noting that in the region where the drive force is reduced to a level between 20-30% of the isolated value (a 70-80% reduction), the indicated dynamic pressure reduction is in the 80-90% range (a 10-20% reduction). It therefore follows that most of the reduction is due to the adverse changes in wind direction. 6. THREE YACHT TESTING With more than two yachts interacting there are a huge number of possible combinations of relative positions and so it is almost impossible to consider all of these. As a consequence we will concentrate on two situations where multiple yachts are most likely to be in close proximity, namely the starting line and the layline. For each of these we will consider two slightly different scenarios and seek some guidelines on maximising relative gains, or at least minimising losses. 6.1 Starting line scenario 1 Key boat between two opponents In a fleet race situation it is inevitable that all of the yachts will try to be as close as possible to the starting line as the race begins and hence this places a constraint on their relative positions, which makes the number of possible combinations manageable. As stated earlier we will consider the ideal, if somewhat unrealistic, situation where all the yachts reach the line at the same time and at full speed. For most of the yachts this means that there will be one yacht to windward and another to leeward. In some cases the gap between neighbouring yachts may be quite small, while at other times these may be larger. Some of the obvious questions that arise for a skipper as he/she approaches a starting line might be: If he has a choice between a narrow gap and a wider gap, which one does he head for? If there is space should she keep close to the windward or the leeward neighbour? In order to test this situation three yacht models were set up on the starting line, the central yacht was the key boat mounted on the force balance, while the others were moved along the starting line as illustrated in Figure 8. For each position of the leeward yacht, the windward yacht was moved to a range of positions, making a 2D array of position combinations. In addition tests were conducted with only the windward yacht, representing a situation where the leeward boat is far away, and with only the leeward boat. The photograph in Figure 9 shows the three models in one of the close proximity situations. It may be observed that the wind tunnel start line, the white line under the bows of the models, isn t directly across the tunnel but, as discussed in Section 3, is at an angle of 73 to the tunnel centreline, so that it is effectively perpendicular to the true wind direction, while the tunnel centreline represents the apparent wind direction. Also visible in Figure 9 are the wooden frames used to support the two interfering models and for the windward boat there are also weights to stop the model from tipping over. Although these may cause some disturbance to the flow it was reasoned that their relatively small size and the fact that they are near ground level would mean that any disturbance would be negligible. True Wind Direction Figure 8 Starting line scenario 1, a yacht between two others.

10 Figure 9 Three boat interference testing in the wind tunnel. Figure 10 shows the results from this three boat study in terms of the Drive force interference factor which is defined as Drive force Drive Force Interference Factor = Drive force on an isolated yacht (2) With this definition, values over 1.0 indicate beneficial interference whereas values below 1.0 are detrimental to the performance of the central key boat. Included in the figure are two sets of two-boat data. The only curve which goes above 1.0 is for the no leeward boat (LB) case, where the windward boat (white hull in Figure 9) may cause both a beneficial change in wind direction and a slight increase in wind dynamic pressure. These beneficial effects are seen to be most significant when the two boats are close to each other. The other set of two boat data is that with no windward boat ( No WB ) which is displayed as the unconnected larger symbols down the right hand side of the graph. It can be clearly seen that the detrimental effects of the leeward boat are far more significant, with reductions to levels as low as 40% of the isolated drive force. While this negative interference also decreases with separation it is still having a marked effect when the yachts are 0.86h apart. 1.2 Drive Force Reduction due to changes in AWA No LB LB at 0.86h LB at 0.74h lb at 0.61h LB at 0.49h LB at 0.37h No 1.40 WB Distance in mast heights (h) between the windward opponent boat and the key boat Figure 10 Drive force interference due to yachts on either side. (Note: Larger symbols on the right-hand side indicate no windward boat and the upper line is the no leeward boat data)
11 The three-boat data in Figure 10 is arranged so that each line represents a particular leeward boat position while the horizontal position of the symbols indicates the simultaneous windward boat position. It shows that to a certain extent the effects from the windward and leeward boats are additive. For example if the leeward boat is at 0.86h, then bringing the windward boat close to the key boat partially improves the situation. However if the leeward boat is close to the key boat then the windward boat seems to have no beneficial effect, and possibly makes the situation slightly worse. Detailed analysis of the drive and side force data for this scenario shows that the vast majority of the effects are caused by changes in wind direction and that changes in wind strength never cause more than a 15% reduction in drive force. The overall picture that emerges from this test is that a skipper should maximise their separation from a leeward boat. If there is a choice between a wide and a narrow gap then head for the wide gap and err towards the windward end of that gap. Some advantage may be gained by getting close to a windward boat but there are dangers with this strategy, since while there are gains to be had in the lee bow position, if you are slightly early and have to shed speed as you approach the starting line then your relative position can rapidly change from one of advantage to severe disadvantage as you drop back into the wake of the windward yacht. 6.2 Starting line scenario 2 Key boat beside two opponents In the previous section it was shown that while a windward yacht can offer weak assistance, a leeward yacht can have a marked detrimental effect. Since on a starting line there will often be multiple yachts on each side of any boat, the question arises as to whether the yacht beyond the immediate neighbour has any significant influence? This has been investigated by placing the two interfering yachts either to windward or to leeward. A variety of positions for the nearest yacht were used, and with each of these a range of positions for the further away yacht tested, including removing the second yacht completely. The single interfering boat results are represented by the larger unconnected symbols in Figure 12. True Wind Direction OR Figure 11 Starting line scenario 2, two opponent to one side or the other Drive Force Interference Factor Closest boat -0.61h Closest boat h Closest boat h Closest boat 0.86h Closest boat 0.74 h Closest boat 0.61 h Closest boat 0.49 h Closest boat 0.37 h WIndward Leeward Distance in mast heights (h) between the furthest opponent boat and the key boat Figure 12 Drive force interference due to yachts on one side.(larger symbols indicate only one opponent boat)

12 The results in Figure 12 show a difference in influence for the second windward boat in comparison with a second leeward boat. With the windward boats the second boat doesn t appear to enhance the beneficial effect given by the single windward boat, and in fact appears to weaken the effect. In contrast a second leeward boat enhances the detrimental effect with all distance combinations. It isn t clear but there is a suggestion that there may be an optimal distance for the second leeward boat in terms of their combined effect. One possible explanation for this is that if the second boat is too close it adversely affects the one in the middle, so that it then has less effect on the key boat. It would be interesting to see if a third leeward opponent would enhance these adverse effects further, however the space in the wind tunnel and the availability of similar models meant that it was not possible to extend this study to more than two leeward yachts We therefore conclude that a second windward yacht has little influence and can be ignored, however a second leeward boat enhances the adverse effects and should be avoided if possible. The indications from an interference point of view are that the leeward end of the starting line is to be preferred, however factors such as the true wind not being quite perpendicular to the line, anticipated wind shifts etc. may negate this advantage. 6.3 Layline scenario 1 Key boat between two opponents The other upwind situation where yachts are frequently in close proximity is on the layline leading to the windward mark. In the wind tunnel the simulation is carried out for yachts rounding clockwise and leaving the mark to the starboard side. For this scenario the situation considered is one where the key boat is between two opponents, with each boat trailing the one in front of it by 1.5 boat lengths. The question considered is simply whether there is an advantage to be gained by erring to windward or leeward of the line being taken by the other two boats. Obviously a skipper would not choose to be on the leeward side if this resulted in not reaching the mark on the current tack as the two additional tacks required would mean a significant loss overall. For these tests the two opponent boats were always in line with each other and were moved along equal advantage lines which are perpendicular to the true wind and therefore angled in the same way as the starting line in the wind tunnel. The resulting situations are therefore equivalent to the key boat moving windward or leeward of the line taken by the leading and trailing yachts, as illustrated in Figure 13. Figure 13 Layline scenario 1, key boat between two opponents. The three boat drive force data is shown in Figure 14 along with data interpolated from the two boat testing for the situations where there is either one boat ahead or one boat behind. It is clear that the one ahead and one behind case is dominated by the presence of the leading yacht. In fact the drive force reductions with three boats are more severe than measured with just the boat ahead. From the two boat testing with only the boat behind one might expect some relief to be provided but this doesn t appear to be the case, instead things seem to be worse. It is possible that having three models in a line across the tunnel is deflecting the whole flow to the side in a manner that is not necessarily totally realistic. Although as noted by Marchaj (1982) A particularly bad position is one behind a number of yachts sailing on a close-hauled course. The helmsman of a following yacht will find himself facing a strongly deflected wind.. So it may be that the combined group is enhancing the detrimental effects on the key boat. In terms of strategy it can be concluded that with either one boat ahead or with one ahead and one behind it is better to err to windward of the direct layline. This would mean sailing a little further on the opposite tack before manoeuvring onto the lay line and thereby suffering something of a loss, but would then increase the drive force once the tack was completed. In addition since the major cause of the losses is a change in effective wind direction then sailing at a slightly higher true wind angle after the tack should increase the drive force and maintain speed, while the fact that the yacht is slightly beyond the layline will mean that the mark can still be reached while on this lower course.


13 1.2 Drive Force Interrference Factor One boat ahead, one behind One boat ahead One boat behind Windward Leeward Transverse distance between the KB centreline and opponent boat centreline in mast heights Figure 14 Drive force interference for the key boat on the layline with opponents ahead and behind. 6.4 Layline scenario 2 Key boat ahead of two opponents Figure 14 shows that there is a slight increase in drive force that can be gained from having an opponent behind. On occasions it may be possible to get onto a layline with two boats close behind you, as illustrated in Figure 15. The questions which then arise are: Do the two boats offer more assistance than the single boat behind? Is there an optimal position relative to those boats in term of maximising drive force? The particular situation tested assumed that the two opponents were 1.5 boat lengths behind the key boat and that they were in a position of equal advantage relative to each other. The two boats had one half-beam separation between the two hulls. The drive force interference results shown in Figure 16 show that the fractional increase in drive force is only of the same order as that to be gained from a single opponent. It also shows that the gain will be maximised by being on the leeward side of the central axis between the pair of opponents, either by being directly ahead of the more leeward opponent or slightly leeward of that line provided the mark can still be reached by taking that line. Figure 15 Layline scenario 2, key boat ahead of two opponents.
14 Centreline of leeward trailing yacht Figure 16 Drive force interference for the key boat on the layline with two opponents behind. 7. CONCLUSIONS The interaction between yachts sailing upwind close hauled has been investigated through wind tunnel measurement of the forces and moments on a balance mounted key boat which is experiencing interference from one or two opponent boats. The variation of forces and moments on the key boat, in isolation, were also measured over a range of apparent wind angles and the drive to side force ratio used as an indicator of the effective apparent wind angle when an interfering boat is present. The data from two boat testing shows that much of the reduction in drive force is due to changes in wind angle rather than wind pressure. These changes in angle and wind pressure are similar to those directly measured around an isolated yacht using Cobra probes. With three boat interference there are too many possible position combinations to consider all of these and so tests focused on two starting line and two layline scenarios. It has been shown that on a starting line with one opponent to windward and one opponent to leeward the interference is dominated by the adverse effects of the leeward boat. If the leeward boat is sufficiently remote then the windward boat can offer some relief. However if the two opponent boats are to windward then the small increase in drive force primarily depends on the proximity of the nearest of the two. With two boats to leeward the second boat enhances the adverse effects of the nearer boat. Two layline scenarios have also been considered and it was found that the most significant interference occurs if there is a yacht immediately ahead, in which case drive force losses can be minimised by erring to windward. REFERENCES Caponnetto, M., The aerodynamic interference between two boats sailing close-hauled, International Shipbuilding Progress, 44(439), , 1996 Johnson, M., Racing basics, available on-line at Marchaj, C.A., Sail theory and practice, Dodd Mead & Company, NY, Richards, P.J., Le Pelley, D.J., Jowett, D., Little, J., Detlefsen, O., (2013) A wind tunnel study of the interaction between two sailing yachts. 21st Chesapeake Yacht Sailing Symposium, Annapolis, USA, March, Spenkuch, T., Turnock, S., Scarponi, M., & Shenoi, A., Lifting line method for modelling covering and blanketing effects for yacht fleet race simulations, Proceedings 3rd High Performance Yacht Design Conference, Auckland, NZ, 1-4 December 2008.
THE 21 st CHESAPEAKE SAILING YACHT SYMPOSIUM ANNAPOLIS, MARYLAND, MARCH 2013
 THE 21 st CHESAPEAKE SAILING YACHT SYMPOSIUM ANNAPOLIS, MARYLAND, MARCH 2013 A wind tunnel study of the interaction between two sailing yachts P.J. Richards, D.J. Le Pelley, D. Jowett, J. Little, O. Detlefsen
Principles of Sailing
 Principles of Sailing This is a PowerPoint set of charts presented by Demetri Telionis on March 21, 2015 at the Yacht Club of Hilton Head Island. The aim of this presentation was to help the audience understand
Now we get to the really fun part of cat sailing, but first you need to know about apparent wind.
 Shelley Sailing Club Inc. Notes for informal catamaran training course, Alec Duncan, 14/3/2015 Part 4: Reaching and running Now we get to the really fun part of cat sailing, but first you need to know
A STUDY OF THE LOSSES AND INTERACTIONS BETWEEN ONE OR MORE BOW THRUSTERS AND A CATAMARAN HULL
 A STUDY OF THE LOSSES AND INTERACTIONS BETWEEN ONE OR MORE BOW THRUSTERS AND A CATAMARAN HULL L Boddy and T Clarke, Austal Ships, Australia SUMMARY CFD analysis has been conducted on a 100m catamaran hull
MOOLOOLABA YACHT CLUB YOUTH SAILING PROGRAM DRILL BOOK 1
 MOOLOOLABA YACHT CLUB YOUTH SAILING PROGRAM 2017 DRILL BOOK 1 Drill 1 -Diamond Topic: Boat handling Focus: Mark Rounding, Sets & Drops # of Boats required: Any # of marks required: 4 Set up a Diamond shape
Chapter 2 Hydrostatics and Control
 Chapter 2 Hydrostatics and Control Abstract A submarine must conform to Archimedes Principle, which states that a body immersed in a fluid has an upward force on it (buoyancy) equal to the weight of the
3D Turbulence at the Offshore Wind Farm Egmond aan Zee J.W. Wagenaar P.J. Eecen
 3D Turbulence at the Offshore Wind Farm Egmond aan Zee J.W. Wagenaar P.J. Eecen OWEZ_R_121_3Dturbulence_20101008 ECN-E--10-075 OCTOBER 2010 Abstract NoordzeeWind carries out an extensive measurement and
Numerical and Experimental Investigation of the Possibility of Forming the Wake Flow of Large Ships by Using the Vortex Generators
 Second International Symposium on Marine Propulsors smp 11, Hamburg, Germany, June 2011 Numerical and Experimental Investigation of the Possibility of Forming the Wake Flow of Large Ships by Using the
Results and Discussion for Steady Measurements
 Chapter 5 Results and Discussion for Steady Measurements 5.1 Steady Skin-Friction Measurements 5.1.1 Data Acquisition and Reduction A Labview software program was developed for the acquisition of the steady
SEMI-SPAN TESTING IN WIND TUNNELS
 25 TH INTERNATIONAL CONGRESS OF THE AERONAUTICAL SCIENCES SEMI-SPAN TESTING IN WIND TUNNELS S. Eder, K. Hufnagel, C. Tropea Chair of Fluid Mechanics and Aerodynamics, Darmstadt University of Technology
Pressure coefficient on flat roofs of rectangular buildings
 Pressure coefficient on flat roofs of rectangular buildings T. Lipecki 1 1 Faculty of Civil Engineering and Architecture, Lublin University of Technology, Poland. t.lipecki@pollub.pl Abstract The paper
AIR FLOW DISTORTION OVER MERCHANT SHIPS.
 AIR FLOW DISTORTION OVER MERCHANT SHIPS. M. J. Yelland, B. I. Moat and P. K. Taylor April 2001 Extended Abstract Anemometers on voluntary observing ships (VOS) are usually sited above the bridge in a region
A Hare-Lynx Simulation Model
 1 A Hare- Simulation Model What happens to the numbers of hares and lynx when the core of the system is like this? Hares O Balance? S H_Births Hares H_Fertility Area KillsPerHead Fertility Births Figure
THREE DIMENSIONAL STRUCTURES OF FLOW BEHIND A
 The Seventh Asia-Pacific Conference on Wind Engineering, November 8-12, 29, Taipei, Taiwan THREE DIMENSIONAL STRUCTURES OF FLOW BEHIND A SQUARE PRISM Hiromasa Kawai 1, Yasuo Okuda 2 and Masamiki Ohashi
Constant Acceleration: The physics of sailing
 Constant Acceleration: The physics of sailing Sailing gives examples of physics: Newton's laws, vector subtraction, Archimedes' principle and others. This support page from Physclips asks How can a boat
Measurement and simulation of the flow field around a triangular lattice meteorological mast
 Measurement and simulation of the flow field around a triangular lattice meteorological mast Matthew Stickland 1, Thomas Scanlon 1, Sylvie Fabre 1, Andrew Oldroyd 2 and Detlef Kindler 3 1. Department of
Navigation with Leeway
 Navigation with Leeway Leeway, as we shall use the term, means how much a vessel is pushed downwind of its intended course when navigating in the presence of wind. To varying extents, knowledge of this
Optimal Weather Routing Using Ensemble Weather Forecasts
 Optimal Weather Routing Using Ensemble Weather Forecasts Asher Treby Department of Engineering Science University of Auckland New Zealand Abstract In the United States and the United Kingdom it is commonplace
Shedding Light on Motion Episode 4: Graphing Motion
 Shedding Light on Motion Episode 4: Graphing Motion In a 100-metre sprint, when do athletes reach their highest speed? When do they accelerate at the highest rate and at what point, if any, do they stop
OPTIMISATION OF SPAN-WISE LIFT DISTRIBUTIONS FOR UPWIND SAILS
 3 rd High Performance Yacht Design Conference Auckland, -4 December, 8 OPTIMISATION OF SPAN-WISE LIFT DISTRIBUTIONS FOR UPWIND SAILS Peter Richards, pj.richards@auckland.ac.nz T. Junge, timm.junge@euroavia.de
STABILITY OF MULTIHULLS Author: Jean Sans
 STABILITY OF MULTIHULLS Author: Jean Sans (Translation of a paper dated 10/05/2006 by Simon Forbes) Introduction: The capsize of Multihulls requires a more exhaustive analysis than monohulls, even those
Study of Passing Ship Effects along a Bank by Delft3D-FLOW and XBeach1
 Study of Passing Ship Effects along a Bank by Delft3D-FLOW and XBeach1 Minggui Zhou 1, Dano Roelvink 2,4, Henk Verheij 3,4 and Han Ligteringen 2,3 1 School of Naval Architecture, Ocean and Civil Engineering,
WORLD SAILING PACKAGE OF TEST RULES FOR MATCH RACING UPDATED DECEMBER 2015 BRIEFING DOCUMENT
 WORLD SAILING PACKAGE OF TEST RULES FOR MATCH RACING Background UPDATED DECEMBER 2015 BRIEFING DOCUMENT This package of test rules is a collaborative effort across the Match Race Committee, Racing Rules
The effect of back spin on a table tennis ball moving in a viscous fluid.
 How can planes fly? The phenomenon of lift can be produced in an ideal (non-viscous) fluid by the addition of a free vortex (circulation) around a cylinder in a rectilinear flow stream. This is known as
Wind Flow Validation Summary
 IBHS Research Center Validation of Wind Capabilities The Insurance Institute for Business & Home Safety (IBHS) Research Center full-scale test facility provides opportunities to simulate natural wind conditions
The Physics of Water Ballast
 The Physics of Water Ballast Nick Newland recently wrote an informative article on water ballast for Water Craft magazine (Newland 2015). Following a discussion on the Swallow Boats Association Forum,
FORCE AND PRESSURE INVESTIGATION OF MODERN ASYMMETRIC SPINNAKERS
 FORCE AND PRESSURE INVESTIGATION OF MODERN ASYMMETRIC SPINNAKERS I M Viola, R G J Flay, Yacht Research Unit, Mechanical Engineering Department, The University of Auckland, New Zealand SUMMARY An innovative
SONAR SEMINAR 7/20/07 Peter Galloway GETTING READY
 PREPARATION Sanding/Fairing: SONAR SEMINAR 7/20/07 Peter Galloway GETTING READY Sand the entire boat with minimum 600 wet or dry. Use flat block to remove fiberglass imprint. Focus on front third of the
Influence of rounding corners on unsteady flow and heat transfer around a square cylinder
 Influence of rounding corners on unsteady flow and heat transfer around a square cylinder S. K. Singh Deptt. of Mech. Engg., M. B. M. Engg. College / J. N. V. University, Jodhpur, Rajasthan, India Abstract
Sea and Land Breezes METR 4433, Mesoscale Meteorology Spring 2006 (some of the material in this section came from ZMAG)
") Sea and Land Breezes METR 4433, Mesoscale Meteorology Spring 2006 (some of the material in this section came from ZMAG) 1 Definitions: The sea breeze is a local, thermally direct circulation arising from
Sea and Land Breezes METR 4433, Mesoscale Meteorology Spring 2006 (some of the material in this section came from ZMAG) 1 Definitions: The sea breeze is a local, thermally direct circulation arising from
SPECTRAL CHARACTERISTICS OF FLUCTUATING WIND LOADS ON A SEPARATE TWIN-BOX DECK WITH CENTRAL SLOT
 The Seventh Asia-Pacific Conference on Wind Engineering, November 8-, 009, Taipei, Taiwan SPECTRAL CHARACTERISTICS OF FLUCTUATING WIND LOADS ON A SEPARATE TWIN-BOX DEC WITH CENTRAL SLOT Le-Dong Zhu, Shui-Bing
10 (Racing) TIPS FOR PATIN SAILORS
 TIPS FOR PATIN SAILORS") 10 (Racing) TIPS FOR PATIN SAILORS 05 AUG 2007 NORTH SEA PATIN SAILORS BEACHCLUB DE WINDHAAN 1 1/ Course or Speed Scheme: (Figure 1) Correlation between wind direction, course and speed Example with a
10 (Racing) TIPS FOR PATIN SAILORS 05 AUG 2007 NORTH SEA PATIN SAILORS BEACHCLUB DE WINDHAAN 1 1/ Course or Speed Scheme: (Figure 1) Correlation between wind direction, course and speed Example with a
CASE STUDY FOR USE WITH SECTION B
 GCE A level 135/01-B PHYSICS ASSESSMENT UNIT PH5 A.M. THURSDAY, 0 June 013 CASE STUDY FOR USE WITH SECTION B Examination copy To be given out at the start of the examination. The pre-release copy must
Preliminary design of a high-altitude kite. A flexible membrane kite section at various wind speeds
 Preliminary design of a high-altitude kite A flexible membrane kite section at various wind speeds This is the third paper in a series that began with one titled A flexible membrane kite section at high
Row / Distance from centerline, m. Fan side Distance behind spreader, m 0.5. Reference point. Center line
 1 Standardisation of test method for salt spreader: Air flow experiments Report 7: Effect of crosswind on salt distribution by Jan S. Strøm, Consultant Aarhus University, Engineering Centre Bygholm, Test
Aerodynamic Terms. Angle of attack is the angle between the relative wind and the wing chord line. [Figure 2-2] Leading edge. Upper camber.
![Aerodynamic Terms. Angle of attack is the angle between the relative wind and the wing chord line. [Figure 2-2] Leading edge. Upper camber.](/thumbs/82/86661300.jpg "Aerodynamic Terms. Angle of attack is the angle between the relative wind and the wing chord line. [Figure 2-2] Leading edge. Upper camber.") Chapters 2 and 3 of the Pilot s Handbook of Aeronautical Knowledge (FAA-H-8083-25) apply to powered parachutes and are a prerequisite to reading this book. This chapter will focus on the aerodynamic fundamentals
Chapters 2 and 3 of the Pilot s Handbook of Aeronautical Knowledge (FAA-H-8083-25) apply to powered parachutes and are a prerequisite to reading this book. This chapter will focus on the aerodynamic fundamentals
Putting Report Details: Key and Diagrams: This section provides a visual diagram of the. information is saved in the client s database
 Quintic Putting Report Information Guide Putting Report Details: Enter personal details of the client or individual who is being analysed; name, email address, date, mass, height and handicap. This information
A Different Approach to Teaching Engine-Out Glides
 A ifferent Approach to Teaching Engine-Out Glides es Glatt, Ph., ATP/CFI-AI, AGI/IGI When student pilots begin to learn about emergency procedures, the concept of the engine-out glide is introduced. The
Dick Bowdler Acoustic Consultant
 Dick Bowdler Acoustic Consultant 01383 882 644 077 8535 2534 dick@dickbowdler.co.uk WIND SHEAR AND ITS EFFECT ON NOISE ASSESSMENT OF WIND TURBINES June 2009 The Haven, Low Causeway, Culross, Fife. KY12
Yacht Racing Rules Seminar Part III TACTICS
 Yacht Racing Rules Seminar Part III TACTICS slide show written by: Garry Cooke G.Cooke Tactics: The main topics covered here will be tactics for: Preparation Starting Upwind Downwind Lifts & Knocks Tactics:
Sailing Upwind. Section 14. Close-hauled. Starboard Tack. Port Tack Figure 14 1 Port Versus Starboard Tack. 14 Sailing Upwind 111
 14 ing Upwind 111 Section 14 ing Upwind Close-hauled. ing as close to the wind, or as directly into the wind, as possible. Also, on-the-wind or by-the-wind, beating. Cunningham (Rig). An arrangement of
The Call Book for Match Racing World Sailing Match Racing
 The Call Book for Match Racing 2017 2020 World Sailing Match Racing As the leading authority for the sport, World Sailing promotes and supports the protection of the environment in all sailing competition
Lab # 03: Visualization of Shock Waves by using Schlieren Technique
 AerE545 Lab # 03: Visualization of Shock Waves by using Schlieren Technique Objectives: 1. To get hands-on experiences about Schlieren technique for flow visualization. 2. To learn how to do the optics
Surrounding buildings and wind pressure distribution on a high rise building
 Surrounding buildings and wind pressure distribution on a high rise building Conference or Workshop Item Accepted Version Luo, Z. (2008) Surrounding buildings and wind pressure distribution on a high rise
No Description Direction Source 1. Thrust
 AERODYNAMICS FORCES 1. WORKING TOGETHER Actually Lift Force is not the only force working on the aircraft, during aircraft moving through the air. There are several aerodynamics forces working together
The Definite Guide to Optimist Trim
 The Definite Guide to Optimist Trim by Martin Gahmberg & the WB-Sails team The purpose of this tuning guide is to help you trim your WB sail optimally by learning the effects of the controls: How to change
Section V Sailing off the wind
 Section V Sailing off the wind 1 Sail shapes and flow patterns - off the wind a) Principles When reaching, it is maximum thrust which is important, and here the leech ribbons come into their own. Fig.43a
BoatWorks. (An Illustrated Sailing Primer) Table of Contents: 1. Basic Sailing Terminology: Boat Related Wind Related Other key terms
 Table of Contents: 1. Basic Sailing Terminology: Boat Related Wind Related Other key terms") BoatWorks (An Illustrated Sailing Primer) Table of Contents: 1. Basic Sailing Terminology: Boat Related Wind Related Other key terms 2. Sailing Basics: Points of Sail The Wind The Boat The Sails 3. Crew
BoatWorks (An Illustrated Sailing Primer) Table of Contents: 1. Basic Sailing Terminology: Boat Related Wind Related Other key terms 2. Sailing Basics: Points of Sail The Wind The Boat The Sails 3. Crew
PRE-START DO S AND DONT S by Dave Perry
 PRE-START S AND NT S by Dave Perry September, 2009 p. 2 of 5 Three Phases of the Pre-Start Some General Do s and Don t s The Entry One minute loops max in final 2:00 Tactician say we re in Blue say your
Ermenek Dam and HEPP: Spillway Test & 3D Numeric-Hydraulic Analysis of Jet Collision
 Ermenek Dam and HEPP: Spillway Test & 3D Numeric-Hydraulic Analysis of Jet Collision J.Linortner & R.Faber Pöyry Energy GmbH, Turkey-Austria E.Üzücek & T.Dinçergök General Directorate of State Hydraulic
SAMPLE MAT Proceedings of the 10th International Conference on Stability of Ships
 and Ocean Vehicles 1 Application of Dynamic V-Lines to Naval Vessels Matthew Heywood, BMT Defence Services Ltd, mheywood@bm tdsl.co.uk David Smith, UK Ministry of Defence, DESSESea-ShipStab1@mod.uk ABSTRACT
Study on Resistance of Stepped Hull Fitted With Interceptor Plate
 39 Study on Resistance of Stepped Hull Fitted With Interceptor Plate Muhamad Asyraf bin Abdul Malek, a, and J.Koto, a,b,* a) Department of Aeronautic, Automotive and Ocean Engineering, Faculty of Mechanical
THE TACOMA NARROWS BRIDGE FAILURE Revision A
 By Tom Irvine Email: tomirvine@aol.com December 29, 1999 THE TACOMA NARROWS BRIDGE FAILURE Revision A Introduction The original Tacoma Narrows Bridge was opened to traffic on July 1, 1940. It was located
OPERATIONAL AMV PRODUCTS DERIVED WITH METEOSAT-6 RAPID SCAN DATA. Arthur de Smet. EUMETSAT, Am Kavalleriesand 31, D Darmstadt, Germany ABSTRACT
 OPERATIONAL AMV PRODUCTS DERIVED WITH METEOSAT-6 RAPID SCAN DATA Arthur de Smet EUMETSAT, Am Kavalleriesand 31, D-64295 Darmstadt, Germany ABSTRACT EUMETSAT started its Rapid Scanning Service on September
NUMERICAL INVESTIGATION OF THE FLOW BEHAVIOUR IN A MODERN TRAFFIC TUNNEL IN CASE OF FIRE INCIDENT
 - 277 - NUMERICAL INVESTIGATION OF THE FLOW BEHAVIOUR IN A MODERN TRAFFIC TUNNEL IN CASE OF FIRE INCIDENT Iseler J., Heiser W. EAS GmbH, Karlsruhe, Germany ABSTRACT A numerical study of the flow behaviour
Characteristics of Pedestrian Level Wind Environment in Twisted Wind Flow around Isolated Buildings
 Characteristics of Pedestrian Level Wind Environment in Twisted Wind Flow around Isolated Buildings * X. Zhang ) A.U. Weerasuriya 2), K.T. Tse 3) and K.C.S. Kwok 4) ), 2) Department of Civil and Environmental
Flow Control of the Kite
 SAILING WORLD posted June 16, 2015 Flow Control of the Kite Symmetric spinnakers are often the most dynamic and challenging sail to trim perfectly. By understanding how they behave at different wind angles,
play the right side of the course that significantly reduces your options and flexibility.
 Starting Tips After preparing for the recent starting clinic held at AYC, I was able to dust off a few articles I have written in the past on starting. Here is the first installment of a two-article segment
AERODYNAMICS I LECTURE 7 SELECTED TOPICS IN THE LOW-SPEED AERODYNAMICS
 LECTURE 7 SELECTED TOPICS IN THE LOW-SPEED AERODYNAMICS The sources of a graphical material used in this lecture are: [UA] D. McLean, Understanding Aerodynamics. Arguing from the Real Physics. Wiley, 2013.
Investigation of Suction Process of Scroll Compressors
 Purdue University Purdue e-pubs International Compressor Engineering Conference School of Mechanical Engineering 2006 Investigation of Suction Process of Scroll Compressors Michael M. Cui Trane Jack Sauls
Lecture 7. More on BL wind profiles and turbulent eddy structures. In this lecture
 Lecture 7. More on BL wind profiles and turbulent eddy structures In this lecture Stability and baroclinicity effects on PBL wind and temperature profiles Large-eddy structures and entrainment in shear-driven
Flow analysis with nacellemounted
 Flow analysis with nacellemounted LiDAR E.T.G. Bot September 2016 ECN-E--16-041 Acknowledgement The work reported here is carried out in the TKI LAWINE project which is partially funded by the Dutch government
Computational Analysis of Cavity Effect over Aircraft Wing
 World Engineering & Applied Sciences Journal 8 (): 104-110, 017 ISSN 079-04 IDOSI Publications, 017 DOI: 10.589/idosi.weasj.017.104.110 Computational Analysis of Cavity Effect over Aircraft Wing 1 P. Booma
Application of Simulation Technology to Mitsubishi Air Lubrication System
 50 Application of Simulation Technology to Mitsubishi Air Lubrication System CHIHARU KAWAKITA *1 SHINSUKE SATO *2 TAKAHIRO OKIMOTO *2 For the development and design of the Mitsubishi Air Lubrication System
Race Management Policies for World Sailing Events Fleet Racing Updated for Oceania & Australian Laser Regattas
 Race Management Policies for World Sailing Events Fleet Racing Updated for Oceania & Australian Laser Regattas 31 Dec 2018 Principles in the revision Make the statements more the order in which they occur
 et al. [25], Noack et al. [26] for circular cylinder flows, Van Oudheusden [27] for square cylinder and Durgesh [28] for a flat plate model. The first two modes appear as phase-shifted versions of each
CRITERIA OF BOW-DIVING PHENOMENA FOR PLANING CRAFT
 531 CRITERIA OF BOW-DIVING PHENOMENA FOR PLANING CRAFT Toru KATAYAMA, Graduate School of Engineering, Osaka Prefecture University (Japan) Kentarou TAMURA, Universal Shipbuilding Corporation (Japan) Yoshiho
FIBA Guidelines for Referee Education Volume 2. Three-Person Officiating. Script
 FIBA Guidelines for Referee Education Volume 2 Three-Person Officiating Script DVD Volume 2, Three-Person Officiating Page 1 of 54 CONTENT INTRODUCTION 1. START OF THE GAME 1.1. Observation and Duties
THEORETICAL EVALUATION OF FLOW THROUGH CENTRIFUGAL COMPRESSOR STAGE
 THEORETICAL EVALUATION OF FLOW THROUGH CENTRIFUGAL COMPRESSOR STAGE S.Ramamurthy 1, R.Rajendran 1, R. S. Dileep Kumar 2 1 Scientist, Propulsion Division, National Aerospace Laboratories, Bangalore-560017,ramamurthy_srm@yahoo.com
Wake effects at Horns Rev and their influence on energy production. Kraftværksvej 53 Frederiksborgvej 399. Ph.: Ph.
 Wake effects at Horns Rev and their influence on energy production Martin Méchali (1)(*), Rebecca Barthelmie (2), Sten Frandsen (2), Leo Jensen (1), Pierre-Elouan Réthoré (2) (1) Elsam Engineering (EE)
A Different Game some ways the 2016 World Sailing Match Racing Test Rules change the game for sailors and umpires by Dave Perry
 January 15, 2016 (revised March 10, 2016 text changes in red) A Different Game some ways the 2016 World Sailing Match Racing Test Rules change the game for sailors and umpires by Dave Perry These notes
THE BRIDGE COLLAPSED IN NOVEMBER 1940 AFTER 4 MONTHS OF ITS OPENING TO TRAFFIC!
 OUTLINE TACOMA NARROWS BRIDGE FLOW REGIME PAST A CYLINDER VORTEX SHEDDING MODES OF VORTEX SHEDDING PARALLEL & OBLIQUE FLOW PAST A SPHERE AND A CUBE SUMMARY TACOMA NARROWS BRIDGE, USA THE BRIDGE COLLAPSED
Aerodynamic Measures for the Vortex-induced Vibration of π-shape Composite Girder in Cable-stayed Bridge
 Aerodynamic Measures for the Vortex-induced Vibration of π-shape Composite Girder in Cable-stayed Bridge *Feng Wang 1), Jialing Song 2), Tuo Wu 3), and Muxiong Wei 4) 1), 2, 3), 4) Highway School, Chang
Aalborg Universitet. Published in: Proceedings of Offshore Wind 2007 Conference & Exhibition. Publication date: 2007
 Aalborg Universitet Design Loads on Platforms on Offshore wind Turbine Foundations with Respect to Vertical Wave Run-up Damsgaard, Mathilde L.; Gravesen, Helge; Andersen, Thomas Lykke Published in: Proceedings
Incompressible Potential Flow. Panel Methods (3)
") Incompressible Potential Flow Panel Methods (3) Outline Some Potential Theory Derivation of the Integral Equation for the Potential Classic Panel Method Program PANEL Subsonic Airfoil Aerodynamics Issues
Incompressible Potential Flow Panel Methods (3) Outline Some Potential Theory Derivation of the Integral Equation for the Potential Classic Panel Method Program PANEL Subsonic Airfoil Aerodynamics Issues
ZIPWAKE DYNAMIC TRIM CONTROL SYSTEM OUTLINE OF OPERATING PRINCIPLES BEHIND THE AUTOMATIC MOTION CONTROL FEATURES
 ZIPWAKE DYNAMIC TRIM CONTROL SYSTEM OUTLINE OF OPERATING PRINCIPLES BEHIND THE AUTOMATIC MOTION CONTROL FEATURES TABLE OF CONTENTS 1 INTRODUCTION 3 2 SYSTEM COMPONENTS 3 3 PITCH AND ROLL ANGLES 4 4 AUTOMATIC
THE PERFORMANCE OF PLANING HULLS IN TRANSITION SPEEDS
 THE PERFORMANCE OF PLANING HULLS IN TRANSITION SPEEDS BY DOYOON KIM UNIVERSITY OF SOUTHAMPTON LIST OF CONTENTS AIM & OBJECTIVE HYDRODYNAMIC PHENOMENA OF PLANING HULLS TOWING TANK TEST RESULTS COMPUTATIONAL
INTRODUCTION TO NETWORK WIND 3 MOUNTING THE UNIT 14 SELECTING THE DISPLAY MODE 5 ABBREVIATIONS AND DEFINITIONS 17
 CONTENTS CONTENTS 1 INSTALLATION 14 GENERAL INTRODUCTION TO B&G NETWORK 2 SITING THE UNIT 14 INTRODUCTION TO NETWORK WIND 3 MOUNTING THE UNIT 14 EXAMPLE SYSTEMS USING NETWORK WIND 4 SPECIFICATION 16 SELECTING
Influence of wind direction on noise emission and propagation from wind turbines
 Influence of wind direction on noise emission and propagation from wind turbines Tom Evans and Jonathan Cooper Resonate Acoustics, 97 Carrington Street, Adelaide, South Australia 5000 ABSTRACT Noise predictions
7 th International Conference on Wind Turbine Noise Rotterdam 2 nd to 5 th May 2017
 7 th International Conference on Wind Turbine Noise Rotterdam 2 nd to 5 th May 2017 Sound power level measurements 3.0 ir. L.M. Eilders, Peutz bv: l.eilders@peutz.nl ing. E.H.A. de Beer, Peutz bv: e.debeer@peutz.nl
A Guide to Yacht Racing
 Guide to Yacht Racing Congratulations on choosing to go racing with Equinox Sailing. Yacht racing is one of the most exciting team sports around, requiring skill and team work. One-design yacht racing
FINAL REPORT. Wind Assessment for: NEW OFFICE BUILDING AT ESSENDON FIELDS Essendon, Victoria, Australia
 FINAL REPORT Wind Assessment for: NEW OFFICE BUILDING AT ESSENDON FIELDS Essendon, Victoria, Australia Prepared for: Essendon Fields Pty Ltd Essendon Fields House Level 2, 7 English Street Essendon Fields
HOW TO BECOME A FAST GUY II (Upwind Racing Tactics) By Bob Szczepanski
 By Bob Szczepanski") HOW TO BECOME A FAST GUY II (Upwind Racing Tactics) By Bob Szczepanski Racing Tactics We learned in Fast Guy (issue #166) that performance sail trim can be achieved by managing power in the main and jib.
HOW TO BECOME A FAST GUY II (Upwind Racing Tactics) By Bob Szczepanski Racing Tactics We learned in Fast Guy (issue #166) that performance sail trim can be achieved by managing power in the main and jib.
THERMALLING TECHNIQUES. Preface
 DRAFT THERMALLING TECHNIQUES Preface The following thermalling techniques document is provided to assist Instructors, Coaches and Students as a training aid in the development of good soaring skills. Instructors
AE Dept., KFUPM. Dr. Abdullah M. Al-Garni. Fuel Economy. Emissions Maximum Speed Acceleration Directional Stability Stability.
 Aerodynamics: Introduction Aerodynamics deals with the motion of objects in air. These objects can be airplanes, missiles or road vehicles. The Table below summarizes the aspects of vehicle performance
S0300-A6-MAN-010 CHAPTER 2 STABILITY
 CHAPTER 2 STABILITY 2-1 INTRODUCTION This chapter discusses the stability of intact ships and how basic stability calculations are made. Definitions of the state of equilibrium and the quality of stability
Point High. A Winning Strategy
 Point High A Winning Strategy Find the Wind. 877 has realized that a wind shift is allowing him to point much higher. Most of the rest of the fleet is continuing on its former course 996 is pointing high
1. A tendency to roll or heel when turning (a known and typically constant disturbance) 2. Motion induced by surface waves of certain frequencies.
 2. Motion induced by surface waves of certain frequencies.") Department of Mechanical Engineering Massachusetts Institute of Technology 2.14 Analysis and Design of Feedback Control Systems Fall 2004 October 21, 2004 Case Study on Ship Roll Control Problem Statement:
Department of Mechanical Engineering Massachusetts Institute of Technology 2.14 Analysis and Design of Feedback Control Systems Fall 2004 October 21, 2004 Case Study on Ship Roll Control Problem Statement:
A Study on the Effects of Wind on the Drift Loss of a Cooling Tower
 A Study on the Effects of Wind on the Drift Loss of a Cooling Tower Wanchai Asvapoositkul 1* 1 Department of Mechanical Engineering, Faculty of Engineering, King Mongkut s University of Technology Thonburi
INTERACTION BETWEEN WIND-DRIVEN AND BUOYANCY-DRIVEN NATURAL VENTILATION Bo Wang, Foster and Partners, London, UK
 INTERACTION BETWEEN WIND-DRIVEN AND BUOYANCY-DRIVEN NATURAL VENTILATION Bo Wang, Foster and Partners, London, UK ABSTRACT Ventilation stacks are becoming increasingly common in the design of naturally
E. Agu, M. Kasperski Ruhr-University Bochum Department of Civil and Environmental Engineering Sciences
 EACWE 5 Florence, Italy 19 th 23 rd July 29 Flying Sphere image Museo Ideale L. Da Vinci Chasing gust fronts - wind measurements at the airport Munich, Germany E. Agu, M. Kasperski Ruhr-University Bochum
Section 1 Types of Waves. Distinguish between mechanical waves and electromagnetic waves.
 Section 1 Types of Waves Objectives Recognize that waves transfer energy. Distinguish between mechanical waves and electromagnetic waves. Explain the relationship between particle vibration and wave motion.
NUMERICAL SIMULATION OF STATIC INTERFERENCE EFFECTS FOR SINGLE BUILDINGS GROUP
 NUMERICAL SIMULATION OF STATIC INTERFERENCE EFFECTS FOR SINGLE BUILDINGS GROUP Xing-qian Peng, Chun-hui Zhang 2 and Chang-gui Qiao 2 Professor, College of Civil Engineering, Huaqiao University, Quanzhou,
Wind Farm Blockage: Searching for Suitable Validation Data
 ENERGY Wind Farm Blockage: Searching for Suitable Validation Data James Bleeg, Mark Purcell, Renzo Ruisi, and Elizabeth Traiger 09 April 2018 1 DNV GL 2014 09 April 2018 SAFER, SMARTER, GREENER Wind turbine
An Investigation into the Capsizing Accident of a Pusher Tug Boat
 An Investigation into the Capsizing Accident of a Pusher Tug Boat Harukuni Taguchi, National Maritime Research Institute (NMRI) taguchi@nmri.go.jp Tomihiro Haraguchi, National Maritime Research Institute
CONSIDERATION OF DENSITY VARIATIONS IN THE DESIGN OF A VENTILATION SYSTEM FOR ROAD TUNNELS
 - 56 - CONSIDERATION OF DENSITY VARIATIONS IN THE DESIGN OF A VENTILATION SYSTEM FOR ROAD TUNNELS Gloth O., Rudolf A. ILF Consulting Engineers Zürich, Switzerland ABSTRACT This article investigates the
Your new Quantum asymmetrical. is designed and engineered to be. easy to set and trim. Fundamental. principals of asymmetrical trim are
 Asymmetrical Trim Guide Your new Quantum asymmetrical is designed and engineered to be easy to set and trim. Fundamental principals of asymmetrical trim are outlined in this guide. For more detailed information,
Percentage. Year. The Myth of the Closer. By David W. Smith Presented July 29, 2016 SABR46, Miami, Florida
 The Myth of the Closer By David W. Smith Presented July 29, 216 SABR46, Miami, Florida Every team spends much effort and money to select its closer, the pitcher who enters in the ninth inning to seal the
Racing Rules for Beginners. by Roger Cochran
 Racing Rules for Beginners by Roger Cochran June 2009 If you enjoy the excitement of sailing a catamaran, learning to race will make it even more fun. This handout is intended to provide the necessary
DESIGN #374 Farr 40 With Masthead Spinnakers
 DESIGN #374 Farr 40 With Masthead Spinnakers Farr Yacht Design, Ltd. Copyright June 26, 2006 P.O. Box 4964, Annapolis, MD 21403 USA Tel: (410) 267-0780 Fax: (410) 268-0553 E-mail: info@farrdesign.com DESCRIPTION