ASAP Satellite-based tropopause fold and mountain wave detection and validation
|
|
|
- Georgia Carpenter
- 6 years ago
- Views:
Transcription


, UW-Madison John R.")

1 ASAP Satellite-based tropopause fold and mountain wave detection and validation Tony Wimmers, Kristopher M. Bedka, Wayne Feltz, Nathan Uhlenbrock Cooperative Institute for Meteorological Satellite Studies (CIMSS), UW-Madison John R. Mecikalski, Todd A. Berendes, Udaysankar S. Nair University of Alabama in Huntsville 2005 NASA ASAP Science Meeting, Boulder, Colorado
2 Topics Synoptic-scale CAT prediction with the GOES water vapor channel Analysis of lee (mountain) wave turbulence with MODIS Automation of gravity wave detection and convectively induced turbulence at UAH (John)
3 CAT and tropopause folds Upper-air front 150 stratosphere 14 Pressure (hpa) subtropical air mass front tropopause polar air mass Height (km) (~100 km) From Shapiro, M. A. (1980): Turbulent mixing within tropopause folds as a mechanism for the exchange of chemical constituents between the stratosphere and the troposphere, J. Atmos. Sci., 37,


 (")
4 GOES specific humidity product WV AWV (WV channel) (specific humidity product)
5
6

7 Building a statistical model Operation of the Model latitude decreasing specific humidity longitude Cloud-masked
8 Building a statistical model Operation of the Model latitude decreasing specific humidity longitude Smoothed (σ = 0.30 )
9 Building a statistical model Operation of the Model latitude Gradient magnitude longitude
10 Building a statistical model Operation of the Model latitude longitude Laplacian zero-crossing
11 Building a statistical model Operation of the Model latitude decreasing specific humidity longitude Extend out 234 km toward the warm air mass
12 Building a statistical model Estimating dimensions of a fold AWV gradient magnitude above the threshold (K) (mean) Length of corresponding tropopause fold (km) Tropopause fold size and water vapor gradient are uncorrelated

13 Web product: Real-time pirep validation Pirep data is provided courtesy of NCAR Aviation Digital Data Service (ADDS)
 at FSL Unfortunately, it is mostly lower and")
14 Web product: Real-time TAMDAR validation TAMDAR (Tropospheric Airborne Meteorological Data Report) is part of the Great Lakes Field Experiment Data available from MADIS (Meteorological Assimilation Data Ingest System) at FSL Unfortunately, it is mostly lower and midtroposphere
15 Preliminary Results: Trop folding + CAT From inspection, the model definitely shows skill. So far, the connection between trop folds and CAT appears to be with light to moderate turbulence. The only cases connected to severe turbulence so far are when a tropopause fold creates a capping inversion that later gives way to rapid convection. It is uncertain how much of the predicted turbulence is actually clear (since much of it is under cloud, and the pireps usually don t report visibility). The model appears to validate pilot reports better than TAMDAR (automated) data, perhaps because TAMDAR data does not normally reach the upper troposphere.
16 Future work: Trop folding + CAT Begin the narrowing down areas of predicted CAT from the current collection (eliminate short folds and folds at weaker gradients). Validate with archived data. Try other fresh approaches as well (for example, do gradients alone predict some turbulence better than the modeled tropopause folds?)
17

18 Building a statistical model Lidar validation (TOPSE, 2000) Tropopause folds were measured at crossings of uppertroposphere air mass boundaries
19 Building a statistical model Hypothesis: Is flux and size of a TF proportional to the AWV gradient magnitude above a threshold?
20
21 Also mention: there is potential in studying the affect of plain gradients in the image
22 Introduction GOES imagery AWV product (surface) (upper troposphere ~8 km high)
23 Introduction Elements of Strat-Trop Exchange (STE) streamers (upper-tropospheric air mass boundary) 150 stratosphere 14 Cut-off Low Pressure (hpa) subtropical air mass Polar front (~100 km) tropopause polar air mass Height (km)
24 CAT-prediction with the GOES water vapor channel

25 Zenith angle bias on the water vapor channel
26 Temperature bias on the water vapor channel
27 Combined bias

28 Result: Specific humidity product


29 Building a statistical model Estimating dimensions of a fold The size and length of TFs observed in the lidar were estimated as trapezoids
 Maxima in NE Pacific and NW")
 Dropoff at 35-40 N Changes from")
30 Application to the spring ozone maximum Distribution of TF activity (Feb-May 2000) Maxima in NE Pacific and NW Atlantic around storm track Semi-permanent minimum over Hudson Bay (TOPSE) Dropoff at N Changes from Mar-Apr, Apr-May
31 Newell et al., 1997, Nature: (~80% of area) 1 km z x (free troposphere) (~11% of volume)
32 Total column ozone AWV-derived moisture troposphere stratosphere high ozone low ozone very low water vapor water vapor Total column ozone and AWV should be closely related (region of AWV response) tropopause break


33 Quantitative validation Gradient /tropopause fold relationship was confirmed quantitatively


34 Quantitative validation TOMS transects The same analysis was performed with Level 2 TOMS total ozone
35 Building a statistical model Estimating ozone in a fold ITGM (K) 3 2 R 2 = ITGM (K) 3 2 R 2 = 1E ozone in fold (kg/m) length of fold (std deg) ITGM Surprisingly, there is no relationship between the intensity of the AWV-derived humidity gradient and the size of the tropopause fold, even though the data shows a strong agreement between large gradients and the existence of tropopause folds.
36 Streamer fragmentation and tropopause folding in the GOES viewing domain JD 034

37 Streamer fragmentation and tropopause folding in the GOES viewing domain JD 034

38 Streamer fragmentation and tropopause folding in the GOES viewing domain JD 065

39 Streamer fragmentation and tropopause folding in the GOES viewing domain JD 086

40 Streamer fragmentation and tropopause folding in the GOES viewing domain JD 122

41 Streamer fragmentation and tropopause folding in the GOES viewing domain JD 144
42
43 Introduction TOPSE* campaign Feb 4 May 23, deg N 7 deployments 10 flights that measured air mass boundary crossings *Tropospheric Ozone Production about the Spring Equinox

44 Introduction TOPSE mission Lidar measurements of ozone

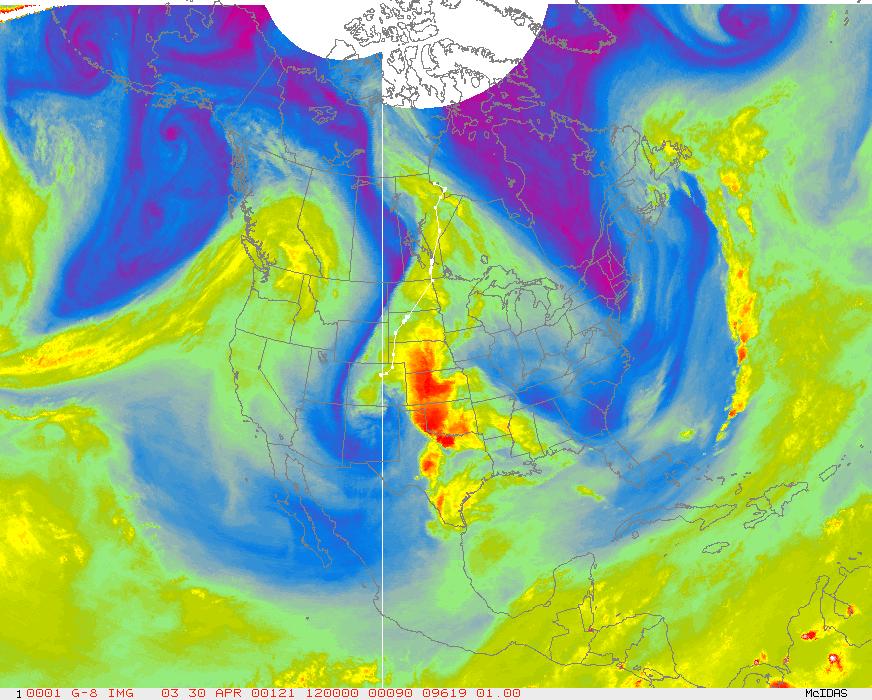
45 GOES WV, 1pm today

46 GOES WV UT specific humidity
Exercise: Satellite Imagery Analysis. 29 June 2016 Japan Meteorological Agency
 Exercise: Satellite Imagery Analysis 29 June 2016 Japan Meteorological Agency Contents 1. Fog/Stratiform Cloud 2. Cb (Cumulonimbus)/Cg (Cumulus congestus) 3. Upper-level Flow Jet stream, upper trough,
Prof. Geraint Vaughan. Centre for Atmospheric Science School of Earth, Atmospheric and Environmental Sciences. Bogdan Antonescu
 Upper-level fronts tropopause disturbances and convection Prof. Geraint Vaughan Centre for Atmospheric Science School of Earth, Atmospheric and Environmental Sciences Bogdan Antonescu the meteorological
Wind: Small Scale and Local Systems Chapter 9 Part 1
 Wind: Small Scale and Local Systems Chapter 9 Part 1 Atmospheric scales of motion Scales of atmospheric circulations range from meters or less to thousands of kilometers- millions of meters Time scales
Seasonal Evaluation of Temperature Inversion
 Seasonal Evaluation of Temperature Inversion Kandil, H A 1, Kader M M. A 2, Moaty, A A. 2, Elhadidi, B 3, Sherif, A.O. 3 The seasonal evaluation of the temperature inversion over Cairo-Egypt is examined
The Extratropical Tropopause Inversion Layer: Global Observations with GPS Data, and a Radiative Forcing Mechanism
 DECEMBER 2007 R A N D E L E T A L. 4489 The Extratropical Tropopause Inversion Layer: Global Observations with GPS Data, and a Radiative Forcing Mechanism WILLIAM J. RANDEL AND FEI WU National Center for
Assimilation of EOS Aura ozone data at the Global Modeling and Assimilation Office
 Assimilation of EOS Aura ozone data at the Global Modeling and Assimilation Office Kris Wargan, I. Stajner, L.-P. Chang, H. Hayashi, S. Pawson, L. Froidevaux, N. Livesey, and P. K. Bhartia Topics Assimilating
The Asian monsoon anticyclone and water vapor transport
 The Asian monsoon anticyclone and water vapor transport Bill Randel Atmospheric Chemistry Division NCAR Thanks to: Mijeong Park, Louisa Emmons 1 What is the monsoon anticyclone, and why is it interesting?
Envs, Geol, Phys 112: Global Climate. Energy-Atmosphere System Review Aguado & Bert, Ch. 1, 2, 3, 4, 5, 6, 9, 10
 Exam 1 Review Energy-Atmosphere System Review Aguado & Bert, Ch. 1, 2, 3, 4, 5, 6, 9, 10 Location on Earth (L04) Latitude & Longitude great circles, prime meridian, time zones, cardinal points, azimuth
The tropopause inversion layer and its link to the mixing layer
 The tropopause inversion layer and its link to the mixing layer Anne Kunz 12 P. Konopka 1, R. Müller 1, L. L. Pan 3, C. Schiller 1, F. Rohrer 2 Forschungszentrum Jülich ICG1: Stratosphere 1 / ICG2: Troposphere
Atmospheric Waves James Cayer, Wesley Rondinelli, Kayla Schuster. Abstract
 Atmospheric Waves James Cayer, Wesley Rondinelli, Kayla Schuster Abstract It is important for meteorologists to have an understanding of the synoptic scale waves that propagate thorough the atmosphere
ASSESSMENT OF SEA BREEZE CHARACTERISTICS FROM SODAR ECHOGRAMS
 ASSESSMENT OF SEA BREEZE CHARACTERISTICS FROM SODAR ECHOGRAMS SUNEETHA RANI. JUPUDI Prof. M. PURNACHANDRA RAO Department of Physics, Andhra University, Visakhapatnam, India. ABSTRACT The SODAR echograms
Study of ozone variability at equatorial latitude during severe geomagnetic storm
 Bull. Astr. Soc. India (2007) 35, 569 574 Study of ozone variability at equatorial latitude during severe geomagnetic storm Manohar Lal Equatorial Geophysical Research Laboratory, Indian Institute of Geomagnetism,
Strengthening of the tropopause inversion layer during the 2009 sudden stratospheric warming in the MERRA-2 analysis
 Strengthening of the tropopause inversion layer during the 009 sudden stratospheric warming in the MERRA- analysis K. Wargan and L. Coy Global Modeling and Assimilation Office Outline We use the MERRA-
Toward a global view of extratropical UTLS tracer distributions. SPARC GA Sept Michaela I. Hegglin University of Toronto, Canada
 Toward a global view of extratropical UTLS tracer distributions Michaela I. Hegglin University of Toronto, Canada SPARC General Assembly 2004: PERSPECTIVE Knowledge about UTLS tracer distributions was
Scales of Atmospheric Motion Scale Length Scale (m) Time Scale (sec) Systems/Importance Molecular (neglected)
 Time Scale (sec) Systems/Importance Molecular (neglected)") Supplement Wind, Fetch and Waves Scales of Atmospheric Motion Scale Length Scale (m) Time Scale (sec) Systems/Importance Molecular 10-7 - 10-2 10-1 (neglected) Coriolis not important Turbulent 10-2 10
Supplement Wind, Fetch and Waves Scales of Atmospheric Motion Scale Length Scale (m) Time Scale (sec) Systems/Importance Molecular 10-7 - 10-2 10-1 (neglected) Coriolis not important Turbulent 10-2 10
UTLS Asian monsoon anticyclone
 UTLS Asian monsoon anticyclone Dynamics and transport in the monsoon anticyclone Chemical variability linked to the monsoon Instability and eddy shedding; PV diagnostics Transport to stratosphere Eruption
Wind Patterns on Earth
 Wind Patterns on Earth What causes air to move? Air pressure differences causes air to move. These differences in air pressure at the same altitude is caused by uneven heating of the Earth s surface. With
s rm o ffect St e E ak L
 Lake Effect Storms Cold Air Moving Over Water Surface Steam Fog Cold air off continent moves over relatively warm water surface Fluxes of heat and moisture from water into air (bulk formulae): F ( ) H
Write answers on your own paper. A. the Sun B. the Moon C. Earth s gravity D. Earth s rotation
 The tmosphere Write answers on your own paper 1. What is the primary energy source that drives all weather events, including precipitation, hurricanes, and tornados?. the Sun. the Moon C. Earth s gravity
A Guide To Aviation Weather
 A Guide To Aviation Weather Richard D. Clark, Ph.D. Professor of Meteorology Student Assistants: Keith Liddick and Sam DeAlba Department of Earth Sciences Millersville University 16 NOV 2005 Outline Icing
Global observations of stratospheric gravity. comparisons with an atmospheric general circulation model
 Global observations of stratospheric gravity waves made with COSMIC GPS RO and comparisons with an atmospheric general circulation model S. P. Alexander 1, T. Tsuda 2, Y. Kawatani 3, M. Takahashi 4, K.
>>>>>>>>WHEN YOU FINISH <<<<<<<< Hand in the answer sheet separately.
 Instructor: Prof. Seiberling PHYSICS DEPARTMENT MET 1010 2nd Midterm Exam October 28, 2002 Name (print, last rst): Signature: On my honor, I have neither given nor received unauthorized aid on this examination.
Tropical temperature variance and wave-mean flow interactions derived from GPS radio occultation data
 Tropical temperature variance and wave-mean flow interactions derived from GPS radio occultation data Bill Randel 1, Mijeong Park 1, Peter Hitchcock 1 and Joowan Kim 2 1 NCAR, Boulder, CO USA 2 Kongju
6.28 PREDICTION OF FOG EPISODES AT THE AIRPORT OF MADRID- BARAJAS USING DIFFERENT MODELING APPROACHES
 6.28 PREDICTION OF FOG EPISODES AT THE AIRPORT OF MADRID- BARAJAS USING DIFFERENT MODELING APPROACHES Cecilia Soriano 1, Darío Cano 2, Enric Terradellas 3 and Bill Physick 4 1 Universitat Politècnica de
A Numerical Simulation of Convectively Induced Turbulence (CIT) above Deep Convection
 above Deep Convection") A Numerical Simulation of Convectively Induced Turbulence (CIT) above Deep Convection Jung-Hoon Kim and Hye-Yeong Chun Department of Atmospheric Sciences Yonsei University, Seoul, Korea 1. Introduction
A Numerical Simulation of Convectively Induced Turbulence (CIT) above Deep Convection Jung-Hoon Kim and Hye-Yeong Chun Department of Atmospheric Sciences Yonsei University, Seoul, Korea 1. Introduction
Measurement of Coastal & Littoral Toxic Material Tracer Dispersion. Dr. Robert E. Marshall T41 NSWCDD
 Measurement of Coastal & Littoral Toxic Material Tracer Dispersion Dr. Robert E. Marshall robert.e.marshall@navy.mil T41 NSWCDD Mouth of the Piankatank River Chesapeake Bay Model this for CB defense? Ground
Local Winds. Please read Ahrens Chapter 10
 Local Winds Please read Ahrens Chapter 10 Scales of Motion Microscale: meters Turbulent eddies Formed by mechanical disturbance or convection Lifetimes of minutes Mesoscale: km s to 100 s of km s Local
2.4. Applications of Boundary Layer Meteorology
 2.4. Applications of Boundary Layer Meteorology 2.4.1. Temporal Evolution & Prediction of the PBL Earlier, we saw the following figure showing the diurnal evolution of PBL. With a typical diurnal cycle,
REMINDERS: UPCOMING REVIEW SESSIONS: - Thursday, Feb 28, 6:30-8:00pm in CSB 002
 REMINDERS: Midterm 2: Friday, March 1 - Lecture material covering chapters 6, 7, and 15 (since first midterm and through Wed lecture) - Multiple Choice, a few Short Answers, a few Definitions - Practice
The impacts of explicitly simulated gravity waves on large-scale circulation in the
 The impacts of explicitly simulated gravity waves on large-scale circulation in the Southern Hemisphere. Linda Mudoni Department of Geological and Atmospheric Sciences October 2003 Introduction In the
Department of Physics, University of Toronto. Thanks: James Anstey, Stephen Beagley, Erich Becker, Michaela Hegglin, Paul Kushner
 Stratospheric Residual Circulation and Tropopause Structure Thomas Birner Theodore G. Shepherd Department of Physics, University of Toronto Thanks: James Anstey, Stephen Beagley, Erich Becker, Michaela
3 Global Winds and Local Winds
 CHAPTER 1 3 Global Winds and Local Winds SECTION The Atmosphere BEFORE YOU READ After you read this section, you should be able to answer these questions: What causes wind? What is the Coriolis effect?
18 Flight Hazards over High Ground
 18 Flight Hazards over High Ground meteorology 18.1 Mountain Effect on Fronts When a warm front passes a mountain range, the air, is lifted over the mountain and will strengthen the formation of cloud
Atmosphere Circulation
 Atmosphere Circulation Winds What Causes Winds? Difference in air pressure due to unequal heating of the atmosphere. Temperatures vary according to the amount of sun it gets. Uneven heating of the Earth
Atmospheric & Ocean Circulation-
 Atmospheric & Ocean Circulation- Overview: Atmosphere & Climate Atmospheric layers Heating at different latitudes Atmospheric convection cells (Hadley, Ferrel, Polar) Coriolis Force Generation of winds
Gravity wave breaking, secondary wave generation, and mixing above deep convection in a three-dimensional cloud model
 GEOPHYSICAL RESEARCH LETTERS, VOL. 33,, doi:10.1029/2006gl027988, 2006 Gravity wave breaking, secondary wave generation, and mixing above deep convection in a three-dimensional cloud model Todd P. Lane
J4.2 AUTOMATED DETECTION OF GAP WIND AND OCEAN UPWELLING EVENTS IN CENTRAL AMERICAN GULF REGIONS
 J4.2 AUTOMATED DETECTION OF GAP WIND AND OCEAN UPWELLING EVENTS IN CENTRAL AMERICAN GULF REGIONS Xiang Li*, University of Alabama in Huntsville Huntsville, AL D. K. Smith Remote Sensing Systems Santa Rosa,
ATMS 310 Tropical Dynamics
 ATMS 310 Tropical Dynamics Introduction Throughout the semester we have focused on mid-latitude dynamics. This is not to say that the dynamics of other parts of the world, such as the tropics, are any
Atmospheric dynamics and meteorology
 Atmospheric dynamics and meteorology B. Legras, http://www.lmd.ens.fr/legras II Potential vorticity, tropopause and baroclinic instability (supposed to be known: notions on the conservation of potential
Sea and Land Breezes METR 4433, Mesoscale Meteorology Spring 2006 (some of the material in this section came from ZMAG)
") Sea and Land Breezes METR 4433, Mesoscale Meteorology Spring 2006 (some of the material in this section came from ZMAG) 1 Definitions: The sea breeze is a local, thermally direct circulation arising from
Sea and Land Breezes METR 4433, Mesoscale Meteorology Spring 2006 (some of the material in this section came from ZMAG) 1 Definitions: The sea breeze is a local, thermally direct circulation arising from
THE ATMOSPHERE. WEATHER and CLIMATE. The Atmosphere 10/12/2018 R E M I N D E R S. PART II: People and their. weather. climate?
 R E M I N D E R S Two required essays are due by Oct. 30, 2018. (A third may be used for extra credit in place of a Think Geographically essay.) ESSAY TOPICS (choose any two): Contributions of a noted
Effect of Orography on Land and Ocean Surface Temperature
 Present and Future of Modeling Global Environmental Change: Toward Integrated Modeling, Eds., T. Matsuno and H. Kida, pp. 427 431. by TERRAPUB, 2001. Effect of Orography on Land and Ocean Surface Temperature
Development of SAR-Derived Ocean Surface Winds at NOAA/NESDIS
 Development of SAR-Derived Ocean Surface Winds at NOAA/NESDIS Pablo Clemente-Colón, William G. Pichel, NOAA/NESDIS Frank M. Monaldo, Donald R. Thompson The Johns Hopkins University Applied Physics Laboratory
Meteorology. Circle the letter that corresponds to the correct answer
 Chapter 7 Worksheet 2 Meteorology Name: Circle the letter that corresponds to the correct answer 1) Which of the following factors contributes to the general subsidence in the latitude zone 20 degrees
The Air-Sea Interaction. Masanori Konda Kyoto University
 2 The Air-Sea Interaction Masanori Konda Kyoto University 2.1 Feedback between Ocean and Atmosphere Heat and momentum exchange between the ocean and atmosphere Atmospheric circulation Condensation heat
Airborne measurements of gravity wave breaking at the tropopause
 GEOPHYSICAL RESEARCH LETTERS, VOL. 30, NO. 20, 2070, doi:10.1029/2003gl018207, 2003 Airborne measurements of gravity wave breaking at the tropopause James A. Whiteway, 1,6 Edward G. Pavelin, 2 Reinhold
Synthetic Aperture Radar imaging of Polar Lows
 Oslo Polar Low workshop 21-22 May 2012 Extended abstract Synthetic Aperture Radar imaging of Polar Lows Birgitte Furevik, Gunnar Noer and Johannes Röhrs met.no Forecasting polar lows is to a large degree
Mesoscale Meteorology
 Mesoscale Meteorology METR 4433 Spring 2015 3.4 Drylines The dryline is a mesoscale phenomena whose development and evaluation is strongly linked to the PBL. In this section, we will consider its general
GEOG112 - Assignment 2. Site A Site B Site C Temp ( C) Altitude (km) Temp ( C)
 Altitude (km) Temp ( C)") GEOG112 - Assignment 2 Name Spring 2019 18 pts possible Site A Site B Site C Temp ( C) Altitude (km) Temp ( C) Altitude (km) Temp ( C) Altitude (km) 24 0 30 0 15 0 10 1 18 1 4 1 14 2 14 2-3 2 9 3 8 3-7
GEOG112 - Assignment 2 Name Spring 2019 18 pts possible Site A Site B Site C Temp ( C) Altitude (km) Temp ( C) Altitude (km) Temp ( C) Altitude (km) 24 0 30 0 15 0 10 1 18 1 4 1 14 2 14 2-3 2 9 3 8 3-7
High Resolution Sea Surface Roughness and Wind Speed with Space Lidar (CALIPSO)
") High Resolution Sea Surface Roughness and Wind Speed with Space Lidar (CALIPSO) Yongxiang Hu NASA Langley Research Center Carl Weimer Ball Aerospace Corp. 1 CALIPSO Mission Overview CALIPSO seeks to improve
High Resolution Sea Surface Roughness and Wind Speed with Space Lidar (CALIPSO) Yongxiang Hu NASA Langley Research Center Carl Weimer Ball Aerospace Corp. 1 CALIPSO Mission Overview CALIPSO seeks to improve
Lecture 14. Heat lows and the TCZ
 Lecture 14 Heat lows and the TCZ ITCZ/TCZ and heat lows While the ITCZ/TCZ is associated with a trough at low levels, it must be noted that a low pressure at the surface and cyclonic vorticity at 850 hpa
The Polar Summer Tropopause Inversion Layer
 2572 J O U R N A L O F T H E A T M O S P H E R I C S C I E N C E S VOLUME 67 The Polar Summer Tropopause Inversion Layer WILLIAM J. RANDEL AND FEI WU National Center for Atmospheric Research,* Boulder,
Temperature, Humidity, and Wind at the Global Tropopause
 2248 MONTHLY WEATHER REVIEW VOLUME 127 Temperature, Humidity, and Wind at the Global Tropopause KLAUS P. HOINKA Institut für Physik der Atmosphäre, DLR, Wessling, Germany (Manuscript received 17 February
Synthetic aperture radar observations of sea surface signatures of atmospheric gravity waves over Southeast Asian coastal waters
 Synthetic aperture radar observations of sea surface signatures of atmospheric gravity waves over Southeast Asian coastal waters Werner Alpers Institute of Oceanography, University of Hamburg, Hamburg,
Atmospheric Circulation
 Atmospheric Circulation Why do we say Earth's temperature is moderate? It may not look like it, but various processes work to moderate Earth's temperature across the latitudes. Atmospheric circulation
OPERATIONAL AMV PRODUCTS DERIVED WITH METEOSAT-6 RAPID SCAN DATA. Arthur de Smet. EUMETSAT, Am Kavalleriesand 31, D Darmstadt, Germany ABSTRACT
 OPERATIONAL AMV PRODUCTS DERIVED WITH METEOSAT-6 RAPID SCAN DATA Arthur de Smet EUMETSAT, Am Kavalleriesand 31, D-64295 Darmstadt, Germany ABSTRACT EUMETSAT started its Rapid Scanning Service on September
Meteorology. Circle the letter that corresponds to the correct answer
 Chapter 6 Worksheet 2 Meteorology Name: Circle the letter that corresponds to the correct answer 1) A steep pressure gradient: a. produces light winds. b. produces strong winds. c. is only possible in
Horizontal distance, x
 Height, z z i pping Free Atmosphere Inversion Boundary Layer Troposphere ~11 km ~2 km Earth Horizontal distance, x Adapted from Meteorology for Scientists and Engineers A Technical Companion Book to C.
Airborne wind lidar campaigns for preparation of the Aeolus mission Oliver Reitebuch
 Airborne wind lidar campaigns for preparation of the Aeolus mission Oliver Reitebuch Fernando Chouza, Christian Lemmerz, Oliver Lux, Uwe Marksteiner, Stephan Rahm, Andreas Schäfler, Benjamin Witschas Institute
Chapter 8 Air Masses
 Chapter 8 Air Masses Air Masses - 1 1. An Air Mass is a large body of air usually about 1500 km across and several km thick, that has homogeneous physical properties. 2. The important physical properties
Unit Test Study Guide:
 Name: Homeroom: Date: Unit 6: Meteorology Study Guide Unit Test Study Guide: Atmosphere & Weather Use the summary points below as a resource to help you study for our unit test Monday! EARTH S ATMOSPHERE:
LOW LAYER WIND SHEAR OVER DAKAR
 LOW LAYER WIND SHEAR OVER DAKAR Dr Cheikh Sadibou SOW ASECNA Senior Meteorologist Abstract : Low layer wind shears are dangerous for planes. Their observation and study are one of the main fields where
Dynamics and variability of surface wind speed and divergence over mid-latitude ocean fronts
 Dynamics and variability of surface wind speed and divergence over mid-latitude ocean fronts Larry O Neill 1, Tracy Haack 2, and Simon de Szoeke 1 1 Oregon State University, Corvallis, OR 2 Naval Research
Coriolis Effect Movies
 Introduction to Oceanography Lecture 16: Wind 2 Wind speed and direction about 1.5 km above sea level By Trent Schindler (NASA) using satellite data. Public Domain https://svs.gsfc.nasa.gov/4571 Coriolis
Chapter 7: Circulation And The Atmosphere
 Chapter 7: Circulation And The Atmosphere Highly integrated wind system Main Circulation Currents: series of deep rivers of air encircling the planet Various perturbations or vortices (hurricanes, tornados,
Physical Geography. Physical Geography III of the United States and Canada. Formation of Great Lakes. Climates of North America. Definitions 2/21/2013
 Physical Geography III of the United States and Canada Ancient Glacial Lakes As the Ice Age ended, areas of North America beyond the terminal moraine were flooded with melt water Prof Anthony Grande AFG
ATMOSPHERIC CIRCULATION. WIND = The horizontal movement of air. Results from the differences in air pressure. Always moves from HIGH to LOW.
 ATMOSPHERIC CIRCULATION WIND = The horizontal movement of air. Results from the differences in air pressure. Always moves from HIGH to LOW. Pressure differences result from variations in temperature. AIR
Prevailing Winds. The Coriolis Effect
 Prevailing Winds 1. Wind: a movement of air in the atmosphere. Bill Nye wind (2 minutes) 2. Local or regional wind: occur in fairly small areas. 3. Prevailing winds: Major wind pattern that affect large
Key3: The Tropopause. Bernard Legras. Laboratoire de Météorologie Dynamique IPSL and ENS, Paris
 Key3: The Tropopause Bernard Legras Laboratoire de Météorologie Dynamique IPSL and ENS, Paris UTLS Summer School - Cargèse - 4 October 2005 THE TROPOPAUSE Definition and vertical structure Dynamical tropopause
Small Footprint Topo-Bathymetric LiDAR
 May 8, 2013 Small Footprint Topo-Bathymetric LiDAR PNAMP Remote Sensing Forum Russ Faux, Co-CEO, WSI Amar Nayegandhi, Manager of Elevation Technologies, Dewberry Colin Cooper, Senior Analyst, WSI Watershed
I. Atmosphere. Maintains a balance between the amount of heat absorbed from the Sun and the amount of heat that escapes back into space.
 Earth s Atmosphere 1-1 I Objectives: Identify the gases in Earthś atmosphere Describe the structures of Earthś atmosphere. Explain what causes air pressure. I. Atmosphere Maintains a balance between the
P2.17 OBSERVATIONS OF STRONG MOUNTAIN WAVES IN THE LEE OF THE MEDICINE BOW MOUNTAINS OF SOUTHEAST WYOMING
 P2.17 OBSERVATIONS OF STRONG MOUNTAIN WAVES IN THE LEE OF THE MEDICINE BOW MOUNTAINS OF SOUTHEAST WYOMING Larry D. Oolman 1, Jeffrey R. French 1, Samuel Haimov 1, David Leon 1, and Vanda Grubišić 2 1 University
Chapter 7 Weather and Climate
 Chapter 7 Weather and Climate *Describe what weather is, what affects it, and where it occurs. *Explain the connection between air pressure and wind. * *Many factors affect a region s weather. * *atmosphere
Influence of enhanced convection over Southeast Asia on blocking ridge and associated surface high over Siberia in winter
 5th Session of the East Asia winter Climate Outlook Forum (EASCOF-5), 8-10 November 2017, Tokyo, Japan Influence of enhanced convection over Southeast Asia on blocking ridge and associated surface high
RECTIFICATION OF THE MADDEN-JULIAN OSCILLATION INTO THE ENSO CYCLE
 RECTIFICATION OF THE MADDEN-JULIAN OSCILLATION INTO THE ENSO CYCLE By William S. Kessler and Richard Kleeman Journal of Climate Vol.13, 1999 SWAP, May 2009, Split, Croatia Maristella Berta What does give
Super-parameterization of boundary layer roll vortices in tropical cyclone models
 DISTRIBUTION STATEMENT A. Approved for public release; distribution is unlimited. Super-parameterization of boundary layer roll vortices in tropical cyclone models PI Isaac Ginis Graduate School of Oceanography
Standard atmosphere Typical height (m) Pressure (mb)
 Pressure (mb)") Standard atmosphere Pressure (mb) Typical height (ft) Typical height (m) 1013.25 0 0 1000 370 110 850 4780 1460 700 9880 3010 500 18280 5570 300 30050 9160 Whiteman 2000 Pressure decreases exponentially
Standard atmosphere Pressure (mb) Typical height (ft) Typical height (m) 1013.25 0 0 1000 370 110 850 4780 1460 700 9880 3010 500 18280 5570 300 30050 9160 Whiteman 2000 Pressure decreases exponentially
Characterization of Boundary-Layer Meteorology During DISCOVER-AQ
 Characterization of Boundary-Layer Meteorology During DISCOVER-AQ Daniel M. Alrick and Clinton P. MacDonald Sonoma Technology, Inc. Gary A. Morris St. Edward s University for Texas Air Quality Research
A Wet-Season Rainfall Climatology to Support Airline Arrivals at Key West Matthew Bloemer and Andy Devanas NWS WFO Key West, FL
 A Wet-Season Rainfall Climatology to Support Airline Arrivals at Key West Matthew Bloemer and Andy Devanas NWS WFO Key West, FL Introduction and Motivations The Island of Key West is served by an airport
Jackie May* Mark Bourassa. * Current affilitation: QinetiQ-NA
 Jackie May* Mark Bourassa * Current affilitation: QinetiQ-NA Background/Motivation In situ observations (ships and buoys) are used to validate satellite observations Problems with comparing data Sparseness
Short-period gravity waves over a high-latitude observation site: Rothera, Antarctica
 Short-period gravity waves over a high-latitude observation site: Rothera, Antarctica K. Nielsen, D. Broutman, M. Taylor, D. Siskind, S. Eckermann, K. Hoppel, R. Hibbins, M. Jarvis, N. Mitchell, J. Russell
Low level coastal jet
 MetOcean analysis of a low-level coastal jet off the Norwegian coast. EERA DeepWind'2014 Deep Sea Offshore Wind R&D Conference, Trondheim, 22-24 January 2014 Harokopio University Konstantinos Christakos,
Meteorology I Pre test for the Second Examination
 Meteorology I Pre test for the Second Examination MULTIPLE CHOICE 1. A primary reason why land areas warm up more rapidly than water areas is that a) on land, all solar energy is absorbed in a shallow
CHAPTER 9. More on meteorology
 CHAPTER 9 More on meteorology 1). Atmospheric Pressure Atmospheric pressure is the pressure with which the atmosphere acts downwards due to its weight. Pressure decreases with altitude because the column
Impact of Sea Breeze Fronts on Urban Heat Island & Air Quality in Texas
 Impact of Sea Breeze Fronts on Urban Heat Island & Air Quality in Texas Xiao-Ming Hu Center for Analysis and Prediction of Storms, School of Meteorology University of Oklahoma July 14, 2015 at LanZhou
Recent Atmospheric and Oceanic Circulation Changes Affecting Winter Weather in North America. Dr. Art Douglas Professor Emeritus Creighton University
 Recent Atmospheric and Oceanic Circulation Changes Affecting Winter Weather in North America Dr. Art Douglas Professor Emeritus Creighton University Outline 1. The 2018 El Nino: A Northern Hemisphere induced
10.2 Energy Transfer in the Atmosphere
 10.2 Energy Transfer in the Atmosphere Learning Outcomes Understand the different layers of the atmosphere Understand how energy moves in, out, and around our atmosphere er Composi
using GPS radio occultation data
 Tropopause altitude identification using GPS radio occultation data Huw Lewis, FORMOSAT-3/COSMIC Data Users Workshop, Boulder. 27 October 2009 Outline Tropopause measurements Radio Occultation data Results
Aircraft-based investigation of boundary-layer structures over the North Water Polynya and in summertime katabatic winds over northwest Greenland
 Aircraft-based investigation of boundary-layer structures over the North Water Polynya and in summertime katabatic winds over northwest Greenland T. Ernsdorf, G. Heinemann and C. Drüe University of Trier,
Weather Unit Study Guide
 Weather Unit Study Guide - 2018 Weather vs Climate What does weather measure? The condition of the earth's atmosphere at a particular time and place. How are climate and weather different? Climate is the
The Effects of Gap Wind Induced Vorticity, the ITCZ, and Monsoon Trough on Tropical Cyclogenesis
 The Effects of Gap Wind Induced Vorticity, the ITCZ, and Monsoon Trough on Tropical Cyclogenesis Heather M. Holbach and Mark A. Bourassa Center for Ocean-Atmospheric Prediction Studies Department of Earth,
Abrupt marine boundary layer changes revealed by airborne in situ and lidar measurements
 Abrupt marine boundary layer changes revealed by airborne in situ and lidar measurements David A. Rahn 1, Thomas R. Parish 2, and David Leon 2 1 Univeristy of Kansas 2 Univeristy of Wyoming Precision Atmospheric
A new mechanism of oceanatmosphere coupling in midlatitudes
 A new mechanism of oceanatmosphere coupling in midlatitudes Arnaud Czaja & Nicholas Blunt Imperial College, London Grantham Institute for Climate Change 1. Motivation Two key questions By which mechanism(s)
Atmospheric Dispersion, Transport and Deposition. Dispersion. Wind Speed. EOH 468 Spring 2008 Dr. Peter Bellin, CIH, Ph.D.
 Atmospheric Dispersion, Transport and Deposition EOH 468 Spring 2008 Dr. Peter Bellin, CIH, Ph.D. Dispersion Atmospheric process affect dilution. Wind speed and lapse rate impact on emissions. Planetary
10.6 The Dynamics of Drainage Flows Developed on a Low Angle Slope in a Large Valley Sharon Zhong 1 and C. David Whiteman 2
 10.6 The Dynamics of Drainage Flows Developed on a Low Angle Slope in a Large Valley Sharon Zhong 1 and C. David Whiteman 2 1Department of Geosciences, University of Houston, Houston, TX 2Pacific Northwest
Wind Project Siting and Permitting Blaine Loos
 Wind Project Siting and Permitting Blaine Loos Energy Project Analyst Center for Wind Energy at James Madison University Wind Project Siting and Permitting The Energy in Wind Resource Assessment (Macro-siting)
Gravity waves and bores. Material kindly provided by Dr. Steven Koch GSD NOAA (Boulder, CO)
") Gravity waves and bores Material kindly provided by Dr. Steven Koch GSD NOAA (Boulder, CO) Presented at Iowa State University 11 April 2005 What is a gravity wave? An oscillation caused by the displacement
Gravity waves and bores Material kindly provided by Dr. Steven Koch GSD NOAA (Boulder, CO) Presented at Iowa State University 11 April 2005 What is a gravity wave? An oscillation caused by the displacement
Chapter 6. Atmospheric and Oceanic. Circulations. Circulations
 Chapter 6 Atmospheric and Oceanic Circulations Robert W. Christopherson Charlie Thomsen Winds: Transfer energy and mass (1) Balance energy equatorial energy surplus and polar energy deficit (2) Generate
The Monsoon and Its Variability Prof. Sulochana Gadgil Centre for Atmospheric & Oceanic Sciences Indian Institute of Science Bangalore
 The Monsoon and Its Variability Prof. Sulochana Gadgil Centre for Atmospheric & Oceanic Sciences Indian Institute of Science Bangalore Lecture - 04 Background about the Atmosphere and Rotating Systems
Global Circulations. GEOG/ENST 2331 Lecture 15 Ahrens: Chapter 10
 Global Circulations GEOG/ENST 2331 Lecture 15 Ahrens: Chapter 10 Last lecture Microscale (turbulence) Mesoscale (land/sea breeze) Synoptic scale (monsoon) Global scale (3 cell circulation) Three Cell Model