WIND RESOURCE ASSESSMENT AND SITE SUITABILITY IN BANGLADESH USING WINDPRO AND WINDSIM
|
|
|
- Sarah Perry
- 6 years ago
- Views:
Transcription

1 WIND RESOURCE ASSESSMENT AND SITE SUITABILITY IN BANGLADESH USING WINDPRO AND WINDSIM Dissertation in partial fulfillment of the requirements for the degree of MASTER OF SCIENCE WITH A MAJOR IN ENERGY TECHNOLOGY WITH FOCUS ON WIND POWER Uppsala University Department of Earth Sciences, Campus Gotland Shafiul Murshed Maruf
2 WIND RESOURCE ASSESSMENT AND SITE SUITABILITY IN BANGLADESH USING WINDPRO AND WINDSIM Dissertation in partial fulfillment of the requirements for the degree of MASTER OF SCIENCE WITH A MAJOR IN ENERGY TECHNOLOGY WITH FOCUS ON WIND POWER Uppsala University Department of Earth Sciences, Campus Gotland Supervisor: Nikolaos Simisiroglou Examiner: Jens Nørkær Sørensen
3 Abstract The purpose of this thesis is to find suitable places in Bangladesh for wind power development and to promote for further studies in this scenario. In this thesis, three onshore places have been chosen for analyzing using powerful state of the art software tools. As through investigations, no published research paper has been found that shows CFD (Computational Fluid Dynamics) and WAsP engineering had been used to analyze site suitability and predict the potential for wind energy in Bangladesh. Two of three places are close to the coast line which prove that the sites are suitable for developing wind power project and initiate further studies too. WindPRO, WindSim, WAsP and WAsP Engineering are used for site suitability assessment, annual energy production estimations, wind resource mapping and site compliance. The whole process of methodology will be explained step by step using images with description. The important simulation results have been added in appendix. After running all simulations, two sites in coastal areas are highly potential for wind power development. And the other site also has potential too. The results in site compliance show that the local climate is suitable for installation of wind turbines. Bangladesh is far behind in terms of wind power development. Only 3 MW have been installed in coastal regions as a testbed. Bangladesh has a costal belt of around 724 km along the Bay of Bengal which is also included many islands in the border of Bangladesh territory. Geographically, strong south-south-east monsoon wind comes from Indian Ocean and after traveling a long distance over the water surface, enter into Asia over the coastal area of Bangladesh. According to a wind atlas data, produced by Denmark; Bangladesh has good wind resources over the land especially on the Bay of Bengal and its coastal line. All the studies on wind resources show that Bangladesh has not only penitential in offshore wind power as well as onshore base wind power projects. Only the coastal areas contain wind power potential is more than 20,000MW which can supply electricity whole Bangladesh 3 times over.
4 Acknowledgements I would like to thank a few people who have contributed to this thesis. First of all, I would like to thank my project supervisor Nikolaos Simisiroglou for his continuous guidance and advice, as well as the knowledge he shared which helped shape my thesis. I would like to thank WindSim and WindPRO support. Their responses and contacting helped me to answer few problems while doing the simulations in WindPRO and WindSim. I would like to thank the entire Wind Power Project Management (WPPM) faculty at Uppsala University Campus Gotland for their support throughout the course of the year and for making it a great experience. Finally, thanks to my friends and family and my classmates for inspirations.
5 Nomenclature AEP agl BMD CFD CFSR CO2 DTU GWh gws file IEC IPCC LIDAR map file MCP MWh NASA NCAR NCEP NOAA RANS SODAR SYNOP UNESCO WTG Annual Energy Production Above Ground Level Bangladesh Meteorological Department Computational Fluid Dynamics Climate Forecast System Reanalysis Carbon dioxide Technical University of Denmark Gigawatt hour WindSim terrine format file International Electrotechnical Commission Intergovernmental Panel on Climate Change Light Detection and Ranging WAsP terrine format file Measure Correlate Predict Megawatt hour National Aeronautics and Space Administration National Center for Atmospheric Research National Center for Environmental Prediction National Oceanic and Atmospheric Administration Reynolds-averaged Navier Stokes Sonic Detection and Ranging Surface synoptic observations United Nations Educational, Scientific and Cultural Organization Wind Turbine Generator wws/tws file WindSim climatology format file
6 Table of Contents Abstract... 3 Acknowledgements... 4 Nomenclature... 5 Table of Contents... 6 List of Figures... 7 List of Tables... 8 Introduction... 9 Literature review WindPRO WindSim WAsP WAsP Engineering Methodology WindPRO Calculations WindSim Uniform Grid Refinement Grid Results WindPRO WindSim Uniform grid Refinement grid Limitations and discussions Conclusions References Appendix Site A (Mongla Port) Site B (Chittagong coast line) Site C (Teknaf coast line)... 69
7 List of Figures Figure 1: World atlas with wind resource map with 10m agl. Bangladesh is in red circle in the figure. Figure 2: Average wind speed at 30 m agl. Figure 3: Three locations shown in map of south part of Bangladesh. Figure 4: Wind statistics data for chosen area in site B. Figure 5: Weibull distribution graph of CFSR2_E91.636_N Figure 6: The result window after calculate with WAsP and WAsP Engineering. Figure 7: Terrain elevation (m) (left) and roughness (m) (right), taken from uniform grid for 5000,000 max number of cells for Site B. Figure 8: Terrain inclination (deg) (left) and logarithmic roughness (m) (right), taken from uniform grid for site B for 5000,000 max number of cells. Figure 9: Residuals (left) and spot values (right) for sector 120 taken from uniform grid for site B for 5000,000 (max) number of cells. Figure 10: Horizontal grid resolution (left) and schematic view of the vertical grid resolution (right), taken from uniform grid for site B for 5000,000 cell simulation. Figure 11: Wind rose (left) and frequency distribution with Weibull fitting (right) for all sectors Taken from site B for cell simulation. Figure 12: Wind farm layout; triangles represent turbines, dots represent climatology object. Taken from uniform grid for for site B. Figure 13: Wind resource map from uniform grid for cells in site C top (left), cells in site B top (right) and cells in site A (down). Figure 14: Horizontal grid resolution (left) and schematic view of the vertical grid resolution (right), Taken from site B in refinement grid for cell simulation. Figure 15: Wind resource map from refinement grid for cells in site A top (left), cells in site B top (middle) and cells in site C (right). Figure 16: Wind information data for CFSR2_E89.591_N (Regression MCP using CFSR_E89.500_N22.500) for site A. Figure 17: Wind information data for CFSR2_E91.636_N for site B. Figure 18: Wind information data for BlendedSeaWinds E N for site C. Figure 19: Graph of AEP (in GWh) variation for different numbers of cells in the uniform grid for site A. Figure 20: Graph of AEP (in GWh) variation for different numbers of cells in the uniform grid for site B. Figure 21: Graph of AEP (in GWh) variation for different numbers of cells in the uniform grid for site C. Figure 22: Graph of AEP (in GWh) variation for different numbers of cells in the refinement grid for site A. Figure 23: Graph of AEP (in GWh) variation for different numbers of cells in the refinement grid for site B. Figure 24: Graph of AEP (in GWh) variation for different numbers of cells in the refinement grid for site C.
8 List of Tables Table 1: Site names and their coordinates. Table 2: Site names and their coordinates and no. of simulations. Table 3: Grid specifications for uniform configuration for site A (Mongla Port). Table 4: Grid specifications for uniform configuration for site B (Chittagong coast line). Table 5: Grid specifications for uniform configuration for site C (Teknaf coast line). Table 6: Distribution of the first 10 nodes in z-direction, relative to the ground, at the position with maximum and minimum elevation. Taken from uniform grid for site B for cell simulation. Table 7: Climatology characteristics including average wind speed (m/s) for all sectors, Weibull shape (k) and scale (A) parameters for all sectors taken from site B for cell simulation. Table 8: Average wind speed, frequency and Weibull shape (k) and scale (A) parameters versus sectors Taken from site B for cell simulation. Table 9: Turbine names, types and positions for site B. Table 10: AEP (in GWh) per turbine for the number of cells of for site B. Table 11: Grid specifications for refinement configuration for Site A. Table 12: Grid specifications for refinement configuration for Site B. Table 13: Grid specifications for refinement configuration for Site C. Table 14: AEP per turbine taken from site B in refinement grid for cells simulation. Table 15: AEP (in GWh) with details for site A (Mongla port). Table 16: Site compliance results for site A. Table 17: AEP (in GWh) with details for site B (Chittagong coast line). Table 18: Site compliance results for Site B. Table 19: AEP (in GWh) with details for site C (Teknaf coast line). Table 20: Site compliance results for Site C. Table 21: AEP for all uniform grid simulations for site A. Table 22: AEP for all uniform grid simulations for site B. Table 23: AEP for all uniform grid simulations for site C. Table 24: AEP for all refinement grid simulations for site A. Table 25: AEP for all refinement grid simulations for site B. Table 26: AEP for all refinement grid simulations for site C.
9 Introduction Climate change is one of the most demanding challenge for our civilization. There is no doubt about it and we also have a have strong scientific evidence that we are the cause of this phenomenon by adding extra CO2 in our atmosphere by burning fossil fuel for our daily life. According to the European Environment Agency, more than 80% of total greenhouse gas emissions in the EU-27 are caused by energy production, energy use by the factories and households, and transport sector. According to the IPCC 4 th Assessment Report, most of the observed increase in globally averaged temperatures since the mid-20th century is very likely due to the observed increase in anthropogenic greenhouse gas concentrations (Pachauri, 2007). According to IPCC 5 th Assessment Report, the temperature of this planet is already increased by 0.7 degree Celsius in past century and we are heading to warming the planet in 2 degree Celsius if we don t change our living style depending on fossil fuel (IPCC AR5, 2014). European Environment Agency set target for developed countries that 20% of the country s electricity should come from renewable energy by To tackle the climate change and increasing demand of electricity, we have to find other sustainable and renewable energy for future because renewable energy sources are inexhaustible, clean and free. These sources offer many environmental and economic benefits in compared to fossil fuel. That s why the renewable energy such as wind, solar, geothermal, wave and biomass has been growing rapidly worldwide. Among them, wind is one of the most effective of all renewable sources. Therefore wind is the most promising of all renewables and it is one of the fastest growing industry in the world. According to Global Wind Energy Council, at the end of 2014, total global installed capacity was 370GW, representing cumulative market growth of more than 16%, even though it s lower than the average growth rate over the last 10 years ( ) of almost 23%. Only in year 2014 alone, total newly installed wind power was around 50GW. (GWEC, 2015) Wind power is the fastest growing industry in the world which creates not only clean green energy but also more job opportunities. Although mankind has been using the wind energy since ancient
10 time, its use to produce electricity effectively by means of modern wind turbines is over two decades old. Bangladesh is a small country situated in south Asia bordered by the Bay of Bengal at the south, Myanmar at the south-east and India at the west, north and north-east. Its area 147,570 square km and population is about 152 million, about 80% of the country s population depends on traditional methods of agriculture for livelihood. In 2012, electricity production of Bangladesh was around 6500MW and about 72.5% of electricity comes from Natural Gas, 18% comes from oil, 5% electricity imported from Nepal and India, 3% from coal and almost 1.5% from renewable sources especially Hydro power. The energy demand for increasing population is 500MW every year. To meet the demand of the growing demand of electricity, government had to import from neighbor country like India and Nepal (Md. Tasbirul Islam, 2014). Utilization of wind energy in Bangladesh has been slow mainly due to lack of quality wind data. Recent measurements in some places have shown significant wind energy potentials in Bangladesh. The installed capacity is only around 3 MW and that too concentrated in the coastal region of the country. Now the government is involving in wind energy for country s future electricity supply. That s why many studies are going on right now to measuring the wind resources in different areas across the country mostly, in coastal areas. In this thesis project, three onshore places in Bangladesh have been selected (details in table 1) for conducting the investigation on wind resources and site suitability by using the state of the art software tools. No published research paper has been found that shows the wind data analysis with such powerful software tools like WindPRO, WindSim or WAsP Engineering. That s why this project holds the importance of future development of wind power in different places including offshore. This investigation may help in stimulating more research on wind power development in different parts of Bangladesh. There were few limitations while conducting this investigation. The met mast data which have been used to calculate the AEP, wind resources and site suitability are provided by EMD international through WindPRO software. No real-time met mast data had been used because of the complexity and out of reach. Also the met mast data that BMD collecting is mainly for weather

11 forecasting but not wind power development. Further study can be made by using the measurement from SODAR or LIDAR. They can measure the wind in different heights. Literature review Several authors such as M. J Khan, S. Mahoob 2004, Mominul islam, Quamrul islam, Mahbubul alam 2008, have performed wind resource assessment studies in Bangladesh using available wind data of Bangladesh focused on the coastal areas and some specific islands in Bangladesh. Researchers analyzed the available data provided by the Bangladesh metrological department, NOAA and NASA. The results show the potential of wind energy in the coastal belt of Bangladesh which is around 724 km along the Bay of Bengal and also in several islands which belong to Bangladesh territory. Strong wind blows over the coastal areas of Bangladesh coming from Indian oceans known as south east monsoon winds. A wind atlas has been generated and published by Technical University of Denmark, DTU Wind Energy, it is shown that there is good wind resources over the Bay of Bengal, its coast lines and over the main land of Bangladesh. The image below shows the wind resource map of the world with wind speed 10m agl. Figure 1: World atlas with wind resource map with 10m agl. Bangladesh is in red circle in the figure. Source: WAsP.dk, 2015.

12 Bangladesh Meteorological Department (BMD) has been collecting wind speed data from 1961 from numerous weather stations spread throughout the country. However as BMD typically collects wind data for weather forecasting purposes this data is unsuitable for wind energy assessment for three major reasons: Firstly, the measurement tower heights are too low i.e., around 5 10 m high, whereas wind turbines generally have higher hub heights m. Secondly, obstacles such as, buildings, houses and plantations, surround many of the weather stations. Thirdly, data recording mechanisms in many stations are not automated, therefore the chance of errors creeping into the data are high. Recently, several different local and international organizations 1 have started wind resource assessment projects 2 to find the potential of wind energy in Bangladesh. The National Center for Atmospheric Research (NCAR) and the National Center for Environmental Prediction Figure 2: Average wind speed at 30 m agl. Source: M.J. Khan, Institutes and Organizations: Bangladesh University of Engineering and Technology (BUET), Bangladesh Center for Advanced studies (BCAS), Local Government Engineering Department (LGED), Rural Electrification Board (REB), Bangladesh Council of Scientific and Industrial Research (BCSIR), Energy Technical Support Unit (ETSU, Harwell, UK), GTZ (Germany). 2 Programs: Wind Energy Resource Mapping (WERM), Wind Energy Study (WEST), Technical Expertise for Renewable Energy Application (TERNA), Solar and Wind Energy Resource Assessment (SWERA) supported by United Nations Environment Program (UNEP) and Global Environment Facility (GEF).
13 (NCEP) in a joint collaboration produced the worldwide wind resource map that shows the mean wind speed along the surface area over Bangladesh is 4 6 m/s at 30m agl as shown in Figure 2. Data analysis shows that the wind speed in the coastal areas are generally higher than in the inland, except the north east part of the country. The west part of the country has relatively higher winds than the east part. As may be seen from Figure 2 the wind speed at 30 m agl along the coast line is more than 5 m/s.in St. Martins Island, Kutubdia, Sandip, Cox s Bazar, Patenga, Bhola, Barguna, Dinajpur, Thakurgaon and Panchagar are feasible for wind energy. (M.J. Khan, 2003) locations of.wind speeds in north east side are above 4.5 m/s, therefore sites such as A B C (details in table 1) should be investigated. While inland wind speeds are around 3.5 m/s for most part of Bangladesh. So, the locations like St. Martins Island, Kutubdia, Sandip, Cox s Bazar, Patenga, Bhola, Barguna, Dinajpur, Thakurgaon and Panchagar are feasible for wind energy. (M.J. Khan, 2003) An area with good wind conditions is on the south west belt of Bangladesh where the mangrove forest Sundarbans is located. Sundarbans is the biggest mangrove forest in the world and it covers around square km which is mostly un-inhabited. It is a pristine forest which is extremely rich in biodiversity. However considering the wind power projects development in this area, the environmental impact will be high and the project will not be financially feasible. From Environmental perspective; The Sundarbans is a UNESCO World Heritage Site. The biodiversity in this forest is unique. There are many bird species migrate to Sundarbans during the winter month from Siberia. Offshore cables can be disaster for local marine life. Considering those facts, environmental impact will be high for wind power project in those areas. From financial perspective, there is not enough road access through the forest areas and the national grid is far from those areas. That s why, wind power project will not be financially feasible in those areas. However the south east side of Bangladesh is an area suitable for wind power development. For the reason that this part of the country has a sea port in addition to well-maintained road infrastructure and access to the surroundings national electricity grid. Therefore, the wind power projects will economical feasible in southern coast line. Roughly analysis shows that the coastal areas have potential of 20,000MW of electricity. The potential for onshore wind farms are additional and overall boosts the chance for wind power development in Bangladesh. (A.N.M. Mominul Islam Mukut, 2008).
14 Several software have been used to complete this thesis project. Like; WindPRO 2.9, WindSim 6.2, WAsP 11, WAsP Engineering 3.0, Windographer 3.3.8, Global Mapper 15.2, Google Earth Pro 7.2. Few of them have been described below: WindPRO 2.9 WindPRO is a wind farm development software used to plan, design and model wind farms. It s a numerical model used to simulate the vertical wind structure within the atmospheric boundary layer. WindPRO also based on diagnostic models which contain no time derivative and therefore specify the balance of quantities at a particular moment in time. It was first developed by Danish energy consultant EMD International A/S over 20 years ago in development of userfriendly software tools for wind energy project development. WindPRO is trusted by investment banks to create wind energy assessments used to determine financing for proposed wind farms. WindPRO has user-friendly interface where users are able to design wind farms, including wind turbine layouts and electrical design and also calculate the Annual energy production, turbine noise levels, turbine shadow flickers, visual constraints, turbine wake losses and site suitability. WindPRO uses wind flow modeling inputs from WAsP or CFD software. One key feature of WindPRO is that the program can be installed with different languages, and reports can be printed in a large number of languages. WindPRO modules description (which has been used in this thesis) Energy MCP: The Measure-Correlate-Predict (MCP) enables to calculate long term corrected wind data directly in WindPRO. The MCP module provides not only a direct access to different MCP-methods, but also provides reporting through overview-reports and detailed reports for each of the methods available. The global set of like NCEP/NCAR long-term reference data as well as SYNOP and METAR data is available for WindPRO users. The result from the MCP analysis is basically a wind statistic generated with WAsP based on a terrain description and the long term corrected site data. Then the data can be used directly for WAsP PARK calculations or wind resource map calculations.
15 PARK: Wind Farm energy calculation including array or wake losses based on one of the modules listed above. Turbulence and RIX calculations RESOURCE: Calculation and presentation of Wind Resource Maps and Annual energy production Loads SITE COMPLIENCE: Establishing a proper layout and selecting a suitable turbine model are important steps in developing a wind energy project. Wind turbines are designed for 20 years lifetime and according to a number of standard climatic design classes, e.g. the IEC classes IA or IIIC. The Roman numeral defines the wind speed class I, II or III and the letter defines the turbulence class A, B or C. Class IA is the strongest standard class and the least strong class is IIIC. Installing a turbine of the incorrect class on a site could result in premature structural failure and ruin a project. On the other hand installing a turbine from a class above that required could add unnecessary extra costs making a project financially unviable. This module helps the user determine which particular turbine class is suitable for a site and also identify critical risks of a project in terms of the various IEC classification measures. Wake models: N.O. Jensen Wake Model: The N.O. Jensen wake model is an empirical based linear expanding wake model. It was first described by N.O. Jensen in 1984 and was further developed to its present from in The wake model was first implemented in program Park developed by Risø and was later integrated into WAsP. The model is a single wake model that describes the wake in terms of an initial deficit and decay rate by an initial velocity deficit and a wake decay coefficient. Compared to more sophisticated models it was found to be generally in agreement in terms of results. Its differences from other similar models are: (Katić et al, 1986) o The wake velocity profile is described by assuming the wind velocity to be constant inside the wake instead of being a Gaussian distribution. o It allows for characteristic inputs from wind turbines, thereby allowing for different modelling of stall- and pitch-regulated turbines. o AEP estimates can be performed when coupled with the Wind Atlas method.
16 The standard method recommended by EMD follows the model that was created by N.O.Jensen from RISØ, but with small modifications that enables one to work with different WTG types and Hub Heights in the same layout. The basic equation for calculating the wake loss behind a rotor is: v = u [1 2 3 ( R R + αx )2 ] Where: v = the wind speed at a distance x behind of the rotor u = the free wind speed just upstream from the rotor R = the rotor radius α = the wake decay constant. 2/3 is an approximation of the Ct value. In calculation model, the actual Ct value is used for each wind speed interval. (WindPRO, 2015) WindPRO and WindSim shares the same Jensen wake model while calculate AEP. Jensen model has been used in this thesis for AEP calculation. (WindPRO, 2015) Eddy Viscosity Wake Model (J.F. Ainslie) 1986 The eddy viscosity wake model is based on the thin shear layer approximation of the Navier-Stokes equation. The approximation is based on the assumption of an axisymmetric, stationary, fully turbulent wake with zero circumferential velocity and negligible pressure gradients outside the wake region. The axisymmetric assumption allows a two-dimensional description of the wake. The model assumptions and equations as originally presented can be found in. Ainslie stated that the goal of the model formulation was to create a physical model to provide more detail of the flow processes, rather than simple models such as the N.O. Jensen model which are useful solely for calculating wake effects on wind farm power output. (David, 2006) G.C. Larsen Wake Model (EWTS II) 1999 The third wake model implemented in WindPRO is known as the G.C. Larsen wake model. The model was first described by Larsen in 1988 and again in The model was recommended
17 in the European Wind Turbine Standards II (EWTS II) 1999 report for use in wake loading calculations. The Larsen model is based on Prandtl s turbulent boundary equations (asymptotic version of NS equations) assuming similarity for the width and mean wind profile of the wake, and utilizes the mixing length theory for describing the turbulent stresses. Other simplifying assumptions are that the flow is incompressible and stationary whereas wind shear is neglected. (Larsen, 1988) WindPRO and WindSim shares the same Larsen wake model while calculating AEP. WindSim 6.2 WindSim was first developed by Vector AS, a consulting firm as an internal tool used to build the Norwegian Wind Atlas in collaboration with the Norwegian Meteorological Institute in The WindSim methodology was developed while simulating the local wind conditions along the challenging complex Norwegian coastline. After six years of on-going development, in-house use and rigorous testing the first commercial version of WindSim software was made available in Afterwards, it has grown steadily and WindSim is used by the wind energy industry leaders worldwide including GE Energy, Vestas, Siemens, Gamesa, Enercon, Repower, Suzlon, Nordex and many more (WindSim, 2015). WindSim is a Computational Fluid Dynamics (CFD) wind simulation software that includes 3D visualization. WindSim can be used for various purposes such as estimating and optimizing wind farm production and efficiency, mapping of wind resources and is especially useful if the site has a complex orography. WindSim uses non-linear flow model based on the partial differential Navier-Stokes equations. The equations describe fluid flows with more complete physics in terms of the laws of conservation of momentum, mass and energy (Nilsson and Ivanell, 2010). WindSim solves the averaged Navier-Stokes equations whereby only the mean flow is solved and all eddies are modeled together with effect of turbulence models on the mean flow. This is not exact and is also less accurate but is generally applicable. The ability to solve the non-linear transport equations for conservation of mass, momentum makes WindSim a suitable tool for simulations in both complex terrain, and in situations with complex local climatology (WindSim, 2015).
18 Wake Model 1 - Jensen Model WindPRO and WindSim shares the same Jensen wake model while calculate AEP. (The details about Jensen wake model has been described in WindPRO section) Jensen wake model has been used for this thesis for all AEP calculation in uniform and refinement grids. Wake Model 2 - Larsen Model The Larsen model is based on Prandtl s turbulent boundary equations (asymptotic version of NS equations) assuming similarity for the width and mean wind profile of the wake, and utilizes the mixing length theory for describing the turbulent stresses. Other simplifying assumptions are that the flow is incompressible and stationary whereas wind shear is neglected. WindPRO and WindSim shares the same Larsen wake model while calculating AEP. (Larsen 1988) Wake Model 3 - Ishihara Japanese Model This is a more recent model, suggested by Ishihara et al in After indicating that both Larsen s and Jensen s model underestimates the center line velocity deficits, it has implemented that the wake recovery rate should be a function of turbulence. (Ishihara et al 2004) According to WindSim Getting Started Guide (2010) WindSim has six modules for micro-siting. As a recommendation, the modules are to be performed in the correct order since each module depends on the other in the sequence of completion. On the other hand, as for the purpose of this project only 4 out of the 6 modules are utilized and it is not always necessary to execute all the modules. The six modules described by WindSim (2015) are as follows: Terrain - this module generates a 3D model of the area around the wind farm based on elevation and roughness data. One can model forested areas and physical objects, such as buildings, to include the influence these have on the wind flow. Wind Fields this module generates the wind database. The module simulates how the terrain affects local wind conditions in terms of speed-ups, direction shifts, and turbulence. Various physical and numerical models are available, with different strengths, e.g. with respect to computing speed or robustness. Objects in this module the placement of turbines and measurement points are done. Its fully interactive 3D interface is easy-to-use. A significant benefit of the 3D tool is that one can inspect
19 the visual layout of the wind farm from different distances and angles. Measurement data is given either as frequency distributions or as time histories. Results this module allows easy inspection of flow variables such as wind speed, directional shifts, turbulent intensity, and the vertical component of the wind. One can specify the heights above ground and the wind sectors of interested. Wind Resources in this module the wind resource map is established by weighting the wind database against measurements. If several measurements are available, the wind resource map will be based on all of them by interpolation. The wind resource map is the basis for the energy optimization. Energy in this module one can calculate the annual energy production (AEP) for each turbine within the wind farm with the inclusion of wake losses. WAsP 11 WAsP (Wind Atlas Analysis and Application Program) is the standard software tool for wind resource assessment used in industry for predicting the electricity productions. WAsP mainly use for complex terrain. This software is based on the linear flow model used to estimate the efficiency of wind farms and their production, to map the wind resources, for digital maps and gives information about topographic and orographic effects. WAsP is used for the vertical and horizontal extrapolation of wind climate statistics. It contains several models to describe the wind flow over different terrains and close to sheltering obstacles. Analysis of raw wind data: Allow users to analysis of any time-series of wind measurements which provide a statistical summary of the observed, site-specific wind climate. Generation of wind atlas data: Users can convert the analyzed wind data into a generalized wind climate or wind atlas data set. The wind atlas data sets are site-independent and the wind distributions have been reduced to certain standard conditions.
20 Wind climate estimation: This model can estimate the wind climate at any specific place and height by using the inverse method calculation as it used to generate a wind atlas. And input data is the descriptions of terrain around the predicted site. Estimation of wind power potential: Users can estimate the total energy content from the mean wind speeds calculated by this model. Also it can predict the actual energy production by using power curve of the specific wind turbine. Calculation of wind farm production: To calculate the power production of a wind turbine as well as annual energy production of the entire wind farm, this model can take input of the power and thrust coefficient curve on the wind turbine, wind farm layout and the wake models to calculate the net energy production. It also calculate the losses of energy causes of wakes (DTU 2015). WAsP Engineering 3.0 WAsP has been in introduced in 1987 by the Wind Energy Department at Risø National Laboratory as a powerful tool for wind data analysis, wind atlas generation, wind climate estimation and positioning of wind turbines. In 2001, WAsP engineering version 1.0, version 2.0 was released in 2004, and is now updated again to version 3.0. The purpose of WAsP Engineering is to support the estimation of loads on wind turbines and other civil engineering structures situated in complex terrain. WAsP Engineering can be used for: Extreme wind speeds: It can analyze 50 year wind data. If a wind turbine is well situated on a hill the mean wind speed and thereby the energy production can be increased significantly compared to that over flat terrain. Unfortunately, the 50 year wind will increase correspondingly, maybe calling for increased strength of the wings, tower or other parts of the turbine. Wind shears and wind profiles: Strong mean wind shears (large differences of the mean wind speed over the rotor) give large fluctuating loads and consequently fatigue on wind turbine blades, because the blades move through areas of varying wind speed. Turbulence. Turbulence (gusts of all sizes and shapes) causes dynamic loads on various civil engineering structures, including wind turbines. The strength of the turbulence varies from place
21 to place. Over land the turbulence is more intense than over the sea. Also the hills affect the structure of turbulence. We model various terrain dependent properties of turbulence. The mean flow model at the heart of WAsP Engineering have been used at Risø for more than 20 years. It has been used in many different contexts and a modified version is the central algorithm in WAsP. In addition, WAsP Engineering incorporates various new algorithms: A model for the description of roughness over water, a component to model the effect of roughness changes and orography on turbulence, and a procedure to estimate the 50-year storm over complex terrain. (DTU 2015).

22 Methodology 1. WindPRO Google Earth Pro has been used for choosing the area and for creating a background map with the same coordinate system as in WindPRO. The same process has been done for three specific locations shown in Table 1 with site name and their coordinates. The same method will be applied for all three locations step by step. Those three sites will be mention as Site A (Mongla Port), Site B (Chittagong Coast line) and Site C (Teknaf Coast line) for the readers convenience. Site name Coordinates Site A (Mongla port) 'N, 'E Site B (Chittagong coast line) 'N, 'E Site C (Teknaf coast line) 'N, 'E Table 1: Site names and their coordinates. Source: Google Earth Pro, 2015 Map creation by Google Earth Pro Before to start of the analysis, the map of the chosen area must be imported to WindPRO. After the process of import has been finished, site center has been defined by the coordinates which were obtained from Google Earth Pro. Three specific locations (southern part of Bangladesh) shown in Figure: 3 has been used chosen for analysis. Figure 3: Three locations shown in map of south part of Bangladesh. Source: Google Earth Pro, 2015.
23 Altitude classification To run wind calculation modules in WindPRO, altitude of three places must be known. The altitude maps can be found by online resources for the chosen area. Online data has been downloaded through WindPRO. TIN is used for altitude calculation settings. Altitude by different coordinates can be exported as a notepad file. There are options to use colors and presentation settings for altitudes on the map. The important part in this step is that it to be cared for calculation is the range of the data which was taken from online database. The line data component is defines the altitudes for the different coordinates and can be chosen according the area of interest for the calculations. This option imports the data from the existing SODAR/LIDAR/Meteorological mast nearer to the area of interest. In some cases it can be data from the monitoring units of the existing turbines. There have been provisions to adjust the changed measurement formats or units and long measurement periods for high time resolution automatically. There is an option incorporated to import the data through the online data and TIN specified was used for the altitude calculation settings. Once the specifications are set, the file that displays the altitude by different coordinates can be exported as a notepad file. The important part in this step is that it to be cared for calculation is the range of the data which was taken from the online database. In this project, the data must cover whole area chosen. In addition, some of the calculations require to take the data area around 100,000m from each side width and height. After downloading the height contour data from the online data source, altitude map was automatically created. Generating the wind statistics To collect wind data for any site, there are options in WindPRO to download or import wind data. The meteorological statistic is necessary for the various calculation modules of WindPRO. Once a meteo object had been created on the map, the object can be specified and modified according to the choice. There are various options to create meteo data for the project. It can be imported from one of the meteo export file from other projects on the same region. In addition, meteo data can be imported as a note file also. The meteorological data from Bangladesh Meteorological Department (BMD)

24 was not possible to collect to use in this thesis project. That s why the meteorological data was downloaded from online through WindPRO for three locations from different data sources 3. While downloading meteorological data from online the desire location appear with different colored dot on the map. Each color represent the different wind statistic from different source. Figure 4 below shows the meteorological data orientation in site B. Figure 4: Wind statistics data for chosen area in site B. Source: WindPRO 2.9, Based on the requirement and availability of nearest possible data, 4 different meteo objects data have been chosen from site B area. The important point for the choosing process is the correlation of the meteo objects. For making more accurate calculations, different meteo object must be correlated in each other. Two long term reference data CHITTAGONG_ (CV_MIL) _SYNOP_41-978_N22.270_E and BlendedSeaWinds_E91.750_N and two short term reference data CFSR2_E91.841_N and CFSR2_E91.636_N has been chosen and downloaded. And those two pair of long term and short term data has been used for measuredcorrelate prediction (MCP). Therefore, it will be used in this project for calculations. Meteo object provides various information about region s wind characteristics such as; Time series, Weibull distribution table, Wind Rose, turbulence information, wind speed relations, General x/y graph, 3 Sources: NCAR, NARR Basic, QSCAT, METAR, SYNOP, MERRA, CFSR-E, CFSR, CFSv2, Blended Coastal Winds, EMD-Global Wind Data.

25 Wind shear exponents etc. Figure 5 shows the Weibull distribution graph of CFSR2_E91.636_N meteorological data. Figure 5: Weibull distribution graph of CFSR2_E91.636_N Source: WindPRO 2.9, Roughness classification One of the other significant point for the calculation is the roughness classification of the chosen area. This process can be done manually by entering all the roughness class but it takes long time for big areas and it is impossible to observe big cities roughness classes by eyes. Therefore, the online roughness data was used for the calculation. WindPRO also allow to provide roughness data as line objects, it can be imported manually from.rsf or.wpo files. In addition, after downloading or importing the roughness data, the area size can be adjust to display with various colors, sizes, etc. for various presentation purposes. In order to make data more accurate, the coordinates are defined. The process also includes defining size of the area, for which the roughness data is to be mined. The area roughness can be exported as a file to use in another calculations. To obtain online data from database, online data option was used for three sites. While downloading online data, it was possible to enter various numbers to obtain right size of data from
26 online roughness database. Different resolution for the roughness map can be chosen for the area. To choose more compatible one for this project, two different data's were tried separately and finally one of them was chosen for calculation. When the roughness data was obtained, it must be exported as a line data. When the data was exported, roughness lines was automatically created as line objects on the map. The final case for roughness creation can be analyzed that different roughness class are displayed with various colors which provides us to understand roughness variation. Turbine Input Vestas V90 2.0MW with hub height of 95m wind turbine has been chosen for all three sites. 2 turbines for site A, 5 turbines for site B and 3 turbines for site C have been placed in designated places and each turbine has been placed with a distance between the turbines more than 5 rotor diameter. There has been this provision to choose and insert the different turbine for calculation purposes and hence deployed for this case study. MCP Correlations Few meteo objects have been downloaded for each site both short term and long term reference data. For example: two pairs of meteo have been chosen for site B, two long term reference data CHITTAGONG_ (CV_MIL) _SYNOP_41-978_N22.270_E and BlendedSeaWinds_E91.750_N and two short term reference data CFSR2_E91.841_N and CFSR2_E91.636_N One correlation have been made with combination of long term and short term data set, such as CHITTAGONG_ (CV_MIL) _SYNOP_41-978_N22.270_E and CFSR2_E18.818_N Same procedure has been done for site A and site C. After correlating, there are options to choose the predicting methods and regression method has been chosen in this case and the newly created meteo object has been saved for different calculations.
27 Calculations Before any calculation site data was applied on the map. In addition, Site data was placed on with the same coordinates of site center. STATGEN module has been chosen for the use of object. PARK Calculation To calculate the AEP for all turbines, PARK module has been run. As in input data, for wind distribution, 2 wind measurement data have been used, including newly created Regression MCP (generated by MCP method). PARK Calculation has been run in four separate way like: 1. 1 st wind measurement + No turbulence model + Wake Model: N.O. Jensen (RISØ/EMD) + 95m hub st wind measurement + Turbulence Model: G.C. Larsen/EWTS II: Wake Model: N.O. Jensen (EMD): m hub nd wind measurement + No turbulence model + Wake Model: N.O. Jensen (RISØ/EMD) + 95m hub nd wind measurement + Turbulence Model: G.C. Larsen/EWTS II: Wake Model: N.O. Jensen (EMD): m hub. Site Compliance For Site Compliance calculations the seven main checks and three optional checks required in site suitability assessments according to the IEC ed. 3 (2010) standard. Site Compliance calculations also helps identify critical risks in a wind farm project, and includes easy export of results to fulfill input required by most wind turbine manufacturers. For this calculation, long term data meteorological (exam: SYNOP) data is needed, for site B, CHITTAGONG_ (CV_MIL) _SYNOP_41-978_N22.270_E data has been used. Same procedure has followed for site A and Site C. WAsP and WAsP Engineering has been used for better prediction and preferable results.

28 After running the WAsP and WAsP Engineering calculations, the calculation window appears results with note like. - Red checks do not always exclude a WTG model/class as suitable. - Final suitability depends on fatigue trade-off between checks and manufacturers loads margins. - SITE COMPLIANCE does not fully model the trade-off and does not know the load margins. - Consult the manufacturer for final justification of suitability including trade-off and margins. The calculation results window shows like the image below, Figure 6. Figure 6: The result window after calculate with WAsP and WAsP Engineering. Source: WindPRO 2.9, 2015.
29 2. WindSim The simulations have been performed using two different grid types: 1. Uniform grid and 2. Refinement grid. All of the simulations include a terrain module, wind field module, object module, wind resources module and energy module have been run. The location of the three sites are same in WindPRO. Table 2 shows the three locations and their coordinates and the number of simulations have been performed for each site. Site name Coordinates Uniform Grid Refinement Total Grid Simulations Site A (Mongla port) 'N, 'E Site B (Chittagong coast line) 'N, 'E Site C (Teknaf coast line) 'N, 'E Table 2: Site names and their coordinates and no. of simulations. Source: Google Earth Pro, Before starting the simulations, the height contours and roughness for all sites have been previously exported from WindPRO as.map file. After exporting, these two file has been combined in a single file and selected as input of a command Convert terrain model. WindSim covert that.map file to.gws file. From that.gws file, WindSim picks the X and Y coordinates. 2.1 Uniform Grid For uniform grid (for site B), seven simulations have been performed with different cell numbers. The objective was to find a certain point where the AEP (Annual Energy Production) will not increase relative to increases in the number of cells. The height of the boundary layer has been set at 500 m, wind speed above boundary layer at 10 m/s, turbulence module set to standard and maximum number of iterations is 1000 and number of cells in Z direction is 40. Same procedure and values have been inputted for the other two sites.


30 Terrain Module: in this module the Coordinate System (for site B): Global and X values are ; and Y values are ; This creates a domain size of 33.35km * 37.05km. The underlying datasets for elevation and roughness have resolutions of 10 m. In Figure 7 below represents the elevation and roughness of site B. The blue color on the images refer the seabed or open water. Figure 7: Terrain elevation (m) (left) and roughness (m) (right), taken from uniform grid for 5000,000 max number of cells for Site B. Source: WindSim6.2, The complexity at the site depends on the changes in elevation and roughness. The complexity in elevation is visualized by the inclination angles which is a derived quantity expressing the first order derivatives of the Figure 8. The blue color refers seabed or open water. Figure 8: Terrain inclination (deg) (left) and logarithmic roughness (m) (right), taken from uniform grid for site B for 5000,000 max number of cells. Source: WindSim6.2, 2015.
 have been numerically solved.")
 and spot values (right) for sector 120 taken from uniform grid for site B for 5000,000")
 to drop below the defined convergence criteria")

31 Wind Field Module: The digital model represents the computational domain where the Reynolds averaged Navier Stokes equations (RANS) have been numerically solved. In total 12 simulations have been performed in order to have a 3D wind field for every 30 degree sector. Figure 9: Residuals (left) and spot values (right) for sector 120 taken from uniform grid for site B for 5000,000 (max) number of cells. For the graph of residuals, the purpose of the residuals (y-axis) to drop below the defined convergence criteria before iterations has been reached in maximum numbers. In the graph above, the convergence has been reached around 160 iterations. From the graph of spot values, we are examining velocity components (U1, V1, W1), turbulent kinetic energy (KE) and dissipation rate (EP). The idea is for these values to settle at a stable position. For the example above, this also seems to happen after about 160 iterations.

 in meters and the number of cells in (x, y, z) directions used in the uniform grid simulations for three sites. Total No.")
32 3D Model: The elevation and roughness data defined above is used to define the ground level of a three-dimensional domain divided in cells with a variable horizontal and vertical resolution. The grid is generated and optimized from the digital terrain model. Figure 10: Horizontal grid resolution (left) and schematic view of the vertical grid resolution (right), taken from uniform grid for site B for 5000,000 cell simulation. Source: WindSim 6.2, Table 3, 4 and 5 below shows the total number of cells, grid spacing (x, y) in meters and the number of cells in (x, y, z) directions used in the uniform grid simulations for three sites. Total No. Of cells Grid spacing (x,y) in (m) Number of cells (x,y,z) (93600) , , 45, (447480) , , 99, (908040) , , 141, ( ) , , 188, ( ) , , 241, ( ) , , 282, ( ) , , 282, 40 Table 3: Grid specifications for uniform configuration for site A (Mongla Port). Source: WindSim 6.2, 2015.
33 Total No. Of cells Grid spacing (x,y) in (m) Number of cells (x,y,z) (90000) , , 50, (473800) , , 115, (951920) , , 163, ( ) , , 218, ( ) , , 281, ( ) , , 327, ( ) , , 327, 40 Table 4: Grid specifications for uniform configuration for site B (Chittagong coast line). Source: WindSim 6.2, Total No. Of cells Grid spacing (x,y) in (m) Number of cells (x,y,z) (91200) , , 60, (452200) , , 133, (839840) , , 181, ( ) , , 249, ( ) , , 332, ( ) , , 332, ( ) , , 399, 40 Table 5: Grid specifications for uniform configuration for site C (Teknaf coast line). Source: WindSim 6.2, It is significant that as the number of cells increase in resolution, the grid spacing (x, y) reduces in size while the number of cells in (x, y) direction increases and the number of cells in the z direction is constant for all simulations in all sites. Table 6 below shows an example of the distribution of the first 10 nodes in the z-direction, relative to the ground, at the position with maximum and minimum elevation for the simulation of site B for cell simulation z-dist. max (m) z-dist. min (m) Table 6: Distribution of the first 10 nodes in z-direction, relative to the ground, at the position with maximum and minimum elevation. Taken from uniform grid for site B for cell simulation. Source: WindSim 6.2, 2015.
 file format.")

 and wind directions (sectors).")
 and frequency distribution with Weibull fitting (right) for all sectors.")
34 In table 6, the first cells in the z-direction the maximum distance ranges from 1.8 to 68.5 meters while the minimum distance ranges from 2.2 to 81.6 m. Object module: In this module, the wind climatology from site B CFSR2_E91.636_N has been exported previously from WindPRO as meteo data object (.txt) file format. Windographer has been used to convert the.txt file to.wws/.tws file format which is WindSim compatible file format. Vestas V90 2.0MW wind turbines have been used in all sites. In this case for site B, five turbines have been placed in exactly same places as for WindPRO. Same procedure has been repeated for other two sites. The average wind condition at any site is used to calculate the wind resources and possible AEP. A wind climatology is presented as a wind rose, giving the average wind speed distribution divided in velocity intervals (bins) and wind directions (sectors). The frequency distribution has been fitted to a Weibull distribution resulting in an average wind speed of 4.70 m/s, shape (k) = 2.19 and scale (A) = 5.24 shows below in table 7. The Figure 11 below shows the wind rose (left) and frequency distribution with Weibull fitting (right) for all sectors. Table 8 below shows Average wind speed, frequency and Weibull shape (k) and scale (A) parameters in 12 sectors. Climatology: Chittagong_Beach_CFSR2_E91.636_N Exported File name Chittagong_Beach_CFSR2_E91.636_N Exported Period, # records : : Position: easting, northing, z (agl) Average wind speed, Weibull k, A Table 7: Climatology characteristics including average wind speed (m/s) for all sectors, Weibull shape (k) and scale (A) parameters for all sectors taken from site B for cell simulation. Source: WindSim 6.2, Figure 11: Wind rose (left) and frequency distribution with Weibull fitting (right) for all sectors Taken from site B for cell simulation. Source: WindSim 6.2, 2015.

35 Average wind speed (m/s) Frequency (%) Weibull shape, k Weibull scale, A Table 8: Average wind speed, frequency and Weibull shape (k) and scale (A) parameters versus sectors Taken from site B for cell simulation. Source: WindSim 6.2, The layout of site B has been presented in Figure 12 below and all the turbine positions and specifications are given in Table 9. Turbine name Turbine type Hub height Easting Northing z Turbine1 Vestas V MW Turbine2 Vestas V MW Turbine3 Vestas V MW Turbine4 Vestas V MW Turbine5 Vestas V MW Table 9: Turbine names, types and positions for site B. Source: WindSim 6.2, Figure 12: Wind farm layout; triangles represent turbines, dots represent climatology object. Taken from uniform grid for for site B. Source: WindSim6.2, 2015.

, 4000000 cells in site B top (right) and 5000000 cells in site A (down). Source: WindSim 6.2, 2015.")
36 Wind Resources Module: The wind resource map is used to identify the high wind speed area based on the average wind speed. The wind resource map is created by the results of CFD. If there are several wind climatologies are available at ay site, the wind resource map will be created based on the inverse radial distance to each climatology. The height of the wind resource map has been set to 95m as same as the hub height of the turbine. Figure 13 below shows the wind resource map at hub height 95 m of three sites. Figure 13: Wind resource map from uniform grid for cells in site C top (left), cells in site B top (right) and cells in site A (down). Source: WindSim 6.2, Energy Module: To calculate the AEP of any wind farm by the predicted free stream wind speed distribution at the specified hub height of each turbine and the turbine s power curve (provided by manufacturer). The free stream wind speed distribution is obtained by the WindSim flow model and the long-term on-site wind conditions. Wake model 1 (Jensen model) has been used while calculating AEP for each site for each simulations.

 Average wind speed (m/s) Gross AEP (GWh/y) Wake Losses (%) AEP with wake losses (GWh/y) Full load hours (hours) Turbine1 Vestas V90 2.0 MW 1.225 5.530 3.")
37 A wind turbine extract energy from the wind. The wind speed downstream from the wind turbine is therefore reduced. As the flow proceeds further, the wake is spreading and recovers towards free stream conditions. The wake effect is calculated by the WindSim wake model. Then the potential energy production is obtained by taking into account the wake losses. Turbine name Turbine type Air density (kg/m3) Average wind speed (m/s) Gross AEP (GWh/y) Wake Losses (%) AEP with wake losses (GWh/y) Full load hours (hours) Turbine1 Vestas V MW Turbine2 Vestas V MW Turbine3 Vestas V MW Turbine4 Vestas V MW Turbine5 Vestas V MW Table 10: AEP (in GWh) per turbine for the number of cells of for site B. Source: WindSim 6.2, Refinement Grid For refinement grid (for site B), seven simulations have been performed with cell different numbers. The height of the boundary layer has been set at 500 m, wind speed above boundary layer at 10 m/s, turbulence module set to standard and maximum number of iterations is 1000 and number of cells in Z direction is 40. The coordinate system for refinement grid (for site B) X- range ; and Y-range: ; This creates a domain size of 4.90km * 4.17km. Same procedure has been repeated for other two sites too. Figure 14: Horizontal grid resolution (left) and schematic view of the vertical grid resolution (right), Taken from site B in refinement grid for cell simulation. Source: WindSim 6.2, 2015.
38 Table 11, 12 and 13 below shows the total number of cells, grid spacing (x, y) in meters and the number of cells in (x, y, z) directions used in the refinement grid simulations for three sites. Total No. Of cells Grid spacing (x,y) in (m) Number of cells (x,y,z) (99840) , , 52, (498520) , , 121, (998400) , , 175, ( ) , , 251, ( ) , , 311, ( ) , , 361, 40 Table 11: Grid specifications for refinement configuration for Site A. Source: WindSim 6.2, Total No. Of cells Grid spacing (x,y) in (m) Number of cells (x,y,z) (99960) , , 51, (49000) , , 35, (998400) , , 156, ( ) , , 218, (299800) , , 265, ( ) , , 307, ( ) , , 342, 40 Table 12: Grid specifications for refinement configuration for Site B. Source: WindSim 6.2, Total No. Of cells Grid spacing (x,y) in (m) Number of cells (x,y,z) (99360) , , (499800) , , 119, (996000) , , 166, ( ) , , 233, ( ) , , 286, ( ) , , 328, ( ) , , 366, 40 Table 13: Grid specifications for refinement configuration for Site C. Source: WindSim 6.2, 2015.
, 4000000 cells in site B top (middle) and 5000000 cells in site C (right). Source: WindSim 6.2, 2015.")
 Average wind speed (m/s) Gross AEP (GWh/y) Wake Losses (%) AEP with wake losses (GWh/y) Full load hours (hours) Turbine1 Vestas V90 2.0 MW 1.225 5.")

39 The wind field, object, wind resource and energy modules have been performed as shown above in uniform grid section. Wind resource map of three sites shown in image shown below. Figure 15: Wind resource map from refinement grid for cells in site A top (left), cells in site B top (middle) and cells in site C (right). Source: WindSim 6.2, In the energy module, wake model 1 (Jensen model) has been used while calculating AEP for each site in each simulations. AEP with details for each turbines shown below in table 14. Turbine name Turbine type Air density (kg/m3) Average wind speed (m/s) Gross AEP (GWh/y) Wake Losses (%) AEP with wake losses (GWh/y) Full load hours (hours) Turbine1 Vestas V MW Turbine2 Vestas V MW Turbine3 Vestas V MW Turbine4 Vestas V MW Turbine5 Vestas V MW Table 14: AEP per turbine taken from site B in refinement grid for cells simulation. Source: WindSim 6.2, 2015.
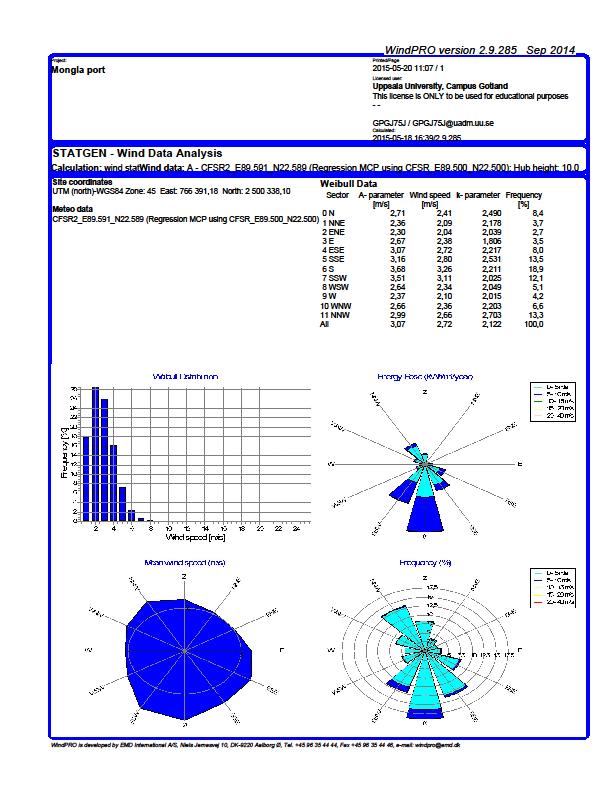
40 Results 1. WindPRO For all three sites, Vestas V90 2.0MW with hub height 95m has been used for calculations. Four separate PARK calculations with different input has been conducted and the results has been plotted into tables. In AEP calculation, 10% losses covering expected losses and uncertainty. Capacity factor is the percentage of hours in a year that the WTGs would need to operate at rated capacity. Few results has been added in appendix. Table 15 below shows the AEP of site A (Mongla port) with details. Name of Meteo No. Of Turbines Turbulence model Result PARK [GWh/y] Result 10% Losses [GWh/y] GROSS (no losses) [GWh/y] Capacity factor [%] Park efficiency [%] CFSR2 E N No CFSR2 E N Yes CFSR2 E N (Regression MCP using 2 No CFSR E N22.500) CFSR2 E N (Regression MCP using CFSR E N22.500) 2 Yes Table 15: AEP (in GWh) with details for site A (Mongla port). Source: WindPRO 2.9, Table 15 represents the AEP details with average wind speed for site A (Mongla port). As results shows that the energy production increases due to wind speed. Further investigations can be conduct by using real-time data like the wind data from nearby met mast or SODAR or LIDAR which will lead to wind power development on those area. Figure 16 below shows the main wind speed, Weibull distribution, frequency and energy rose of wind statistic information of CFSR2_E89.591_N (Regression MCP using CFSR_E89.500_N22.500) for site A. If analyze the image below, main wind is coming from south side. This wind is known as south east monsoon wind. No wake model has been used while generating the wind statistic. Mean wind speed [m/s]

41 Figure 16: Wind information data for CFSR2_E89.591_N (Regression MCP using CFSR_E89.500_N22.500) for site A. Source: WindPRO 2.9, In site compliance calculation, results for site A with WAsP and WAsP Engineering shows in table 16 that the all parameters are ok except the lightning strike rates in that area is critical. In that case, developers should consult with turbines manufacturer to solve this issue. Checks and Analyses Results Terrain complexity Ok Extreme wind Ok Effective turbulence Ok Wind distribution Ok Flow inclination Ok Wind shear Ok Air density Ok Seismic hazard Ok Temperature range N/A Lightning rate Critical Table 16: Site compliance results for site A. Source: WindPRO 2.9, 2015.
42 Table 17 below presents for site B (Chittagong coast line) that the AEP and wind speed are high because the site center is close to the sea. Met mast BlendedSeaWinds E N located in the sea. And the measurement has been conducted by the NOAA/ NESDIS / National Climatic Data Center, USA using six satellites equipped with scatterometers. On the sea, the wind speed in high because the roughness on sea is almost zero, that s why wind can blow without slowing down. That s why the AEP and the average wind speed with this met mast is higher. The other met mast CFSR2 E N in located onshore, which has relatively less AEP and less mean wind speed. Because, when the wind blows on land, it disrupt by its surrounding roughness and obstacles. From those two met mast, it shows that the AEP increases when the wind speed increases. Name of Meteo No. Of Turbines Turbulence model Result PARK [GWh/y] Result 10% Losses [GWh/y] GROSS (no losses) [GWh/y] Capacity factor [%] Park efficiency [%] BlendedSeaWinds E N No BlendedSeaWinds E N Yes CFSR2 E N No CFSR2 E N Yes Table 17: AEP (in GWh) with details for site B (Chittagong coast line). Source: WindPRO 2.9, Mean wind speed [m/s] Main wind speed, Weibull distribution, frequency and energy rose of CFSR2_E91.636_N for site B (Chittagong coast line) shown below in Figure 17. From the image of wind statistics for site B shows that the main wind blows from south east side because the wind known as south east monsoon wind from Indian ocean blows through Bay of Bengal which is located on the south side of Bangladesh. So most of the southern parts (mostly coast line) of Bangladesh are effected by this specific wind. Also, all coast line areas are effected by the sea breeze and land breeze which makes the wind blows all time. Same effect will be applied on site B which will be beneficial for wind energy productions.
43 Figure 17: Wind information data for CFSR2_E91.636_N for site B. Source: WindPRO 2.9, The results for site B shows in table 18 that the Effective turbulence is caution level and seismic hazard and lightning strike rates are critical level. In that case, developers should consult with turbines manufacturer to solve those issues. Checks and Analyses Results Terrain complexity Ok Extreme wind Ok Effective turbulence Caution Wind distribution Ok Flow inclination Ok Wind shear Ok Air density Ok Seismic hazard Critical Temperature range Ok Lightning rate Critical Table 18: Site compliance results for Site B. Source: WindPRO 2.9, 2015.
44 Table 19 below has been plotted for site C (Teknaf coast line) shows the AEP for four calculations in different inputs. Met mast BlendedSeaWinds E N located in the sea and the wind measurement has been accompanied by the NOAA/ NESDIS / National Climatic Data Center, USA using six satellites equipped with scatterometers. As the roughness on the sea surface is almost zero, the wind can blow uninterrupted. That s why the AEP and the average wind speed with this met mast shows higher values. The other met mast CFSR2 E N (Regression MCP using BlendedSeaWinds E N20.750) has been generated by using MCP Regression method. The met mast CFSR2 E N in located onshore, and the met mast BlendedSeaWinds E N is located on the sea. These two met masts data have been correlated by MCP Regression method and created a new met mast call CFSR2 E N (Regression MCP using BlendedSeaWinds E N20.750). The AEP and the mean wind speed by using this newly created met mast is relatively lower than the other because of the surrounding roughness and obstacles. Name of Meteo BlendedSeaWinds E N BlendedSeaWinds E N No. Of Turbines Turbulence model Result PARK [GWh/y] Result 10% Losses [GWh/y] GROSS (no losses) [GWh/y] Capacity factor [%] Park efficiency [%] 3 No Yes CFSR2 E N (Regression MCP using BlendedSeaWinds E No N20.750) CFSR2 E N (Regression MCP using BlendedSeaWinds E N20.750) 3 Yes Table 19: AEP (in GWh) with details for site C (Teknaf coast line). Source: WindPRO 2.9, Mean wind speed [m/s] Figure 18 below shows the main wind speed, Weibull distribution, frequency and energy rose of BlendedSeaWinds E N for site B (Teknaf coast line). In the image, it shows that the major wind blows from south side. This site also effected by the south east monsoon wind and the sea breeze and land breeze.

45 Figure 18: Wind information data for BlendedSeaWinds E N for site C. Source: WindPRO 2.9, The results for site C shows in table 20 that the Effective turbulence and seismic hazard are in caution level. Developers should consult with turbines manufacturer to solve those issues before installation. Checks and Analyses Results Terrain complexity Ok Extreme wind Ok Effective turbulence Caution Wind distribution Ok Flow inclination Ok Wind shear Ok Air density Ok Seismic hazard Caution Temperature range N/A Lightning rate Ok Table 20: Site compliance results for Site C. Source: WindPRO 2.9, 2015.
46 2. WindSim 2.1 Uniform grid The results for all simulations (for uniform grid) for three sites are given below. Due to space limitations, it is not possible to provide all interesting and relevant output data. Table 21, 22 and 23 below shows the AEP of each number of cells, capacity factor, wakes losses and average wind speed for different number of cells for site A, B and C in uniform grid. And the Figure 19, 20 and 21 shows the graph of AEP variation for different numbers of cells in the uniform grid of site A, B and C. Due to the space limitation, full reports of WindSim simulations couldn t be added in appendix. The results of uniform grid (all simulations) for three sites shows the rise on AEP until it reaches on pick in certain number of cells. And the percentage of wake loses increases in every increase in the number of cells. The highest number of cells in uniform grid for site A, B and C have been performed for number of cells. Capacity factor is low for site A but much higher in site B and site C. No. Of cells No. Of turbines Capacity (MW) Wake model Capacity factor (%) Gross AEP (GWh/y) Wake losses (%) AEP with wake losses (GWh/y) Average wind speed (m/s) Yes Yes Yes Yes Yes Yes Yes Table 21: AEP for all uniform grid simulations for site A. Source: WindSim 6.2, 2015.
47 GWh/y GWh/y Uniform grid for site A No. Of cells No. of cells Figure 19: Graph of AEP (in GWh) variation for different numbers of cells in the uniform grid for site A. Source: WindSim 6.2, No. Of cells No. Of turbines Capacity (MW) Wake model Capacity factor (%) Gross AEP (GWh/y) Wake losses (%) AEP with wake losses (GWh/y) Average wind speed (m/s) Yes Yes Yes Yes Yes Yes Yes Table 22: AEP for all uniform grid simulations for site B. Source: WindSim 6.2, Uniform grid for site B No. Of cells No. of cells Figure 20: Graph of AEP (in GWh) variation for different numbers of cells in the uniform grid for site B. Source: WindSim 6.2, 2015.
48 GWh/y No. Of cells No. Of turbines Capacity (MW) Wake model Capacity factor (%) Gross AEP (GWh/y) Wake losses (%) AEP with wake losses (GWh/y) Average wind speed (m/s) Yes Yes Yes Yes Yes Yes Yes Table 23: AEP for all uniform grid simulations for site C. Source: WindSim 6.2, Uniform grid for site C No. Of cells No. of cells Figure 21: Graph of AEP (in GWh) variation for different numbers of cells in the uniform grid for site C. Source: WindSim 6.2, Refinement grid The results from refinement grid from the simulations specified above are given here. Due to space limitations, it is not possible to provide all interesting and relevant output data. Full report has been attached in appendix. Table 24, 25 and 26 below shows the AEP of each number of cells, capacity factor, wakes losses and average wind speed for different number of cells for site A, B and C in uniform grid. And the Figure 22, 23 and 24 shows the graph of AEP variation for different numbers of cells in the uniform grid of site A, B and C. The results of refinement grid (all simulations) for three sites shows a negligible change in AEP in all the number of cells. Also the percentage of wake loses does not differ so much by increasing in the number of cells. The highest number of cells in refinement grid for site A was and
49 GWh/y Figure 241: Graph of AEP (in GWh) variation for different numbers of cells in the refinement grid for site B. Source: WindSim 6.2, 2015.Figure 242: Graph of AEP (in GWh) variation for different numbers of cells in the refinement grid for site A. Source: for site B and C was number of cells. Capacity factor is low for site A but much higher in site B and site C. No. Of cells No. Of turbines Capacity (MW) Wake model Capacity factor (%) Gross AEP (GWh/y) Wake losses (%) AEP with wake losses (GWh/y) Average wind speed (m/s) Yes Yes Yes Yes Yes Yes Table 24: AEP for all refinement grid simulations for site A. Source: WindSim 6.2, Refinement grid for site A No. Of cells No. of cells Figure 22: Graph of AEP (in GWh) variation for different numbers of cells in the refinement grid for site A. Source: WindSim 6.2, Average AEP with No. Of No. Of Capacity Wake Capacity Gross AEP Wake losses wind wake losses Figure cells 235: Graph turbines of AEP (in (MW) GWh) variation model for factor different (%) numbers (GWh/y) of cells in the refinement (%) grid for site speed (GWh/y) B. Source: WindSim 6.2, 2015.Figure 236: Graph of AEP (in GWh) variation for different numbers of cells in the refinement grid for site A. Source: (m/s) WindSim , Yes Yes Yes Figure : Graph 5 of AEP (in 10 GWh) variation Yes for different 20.7 numbers of cells in the refinement grid for site B. Source: WindSim , Yes Yes Yes Table 25: AEP for all refinement grid simulations for site B. Source: WindSim 6.2, Figure 238: Graph of AEP (in GWh) variation for different numbers of cells in the refinement grid for site C. Source: WindSim 6.2, 2015.Figure 239: Graph of AEP (in GWh) variation for different numbers of cells in the refinement grid for site B. Source: WindSim 6.2, 2015.Figure 240: Graph of AEP (in GWh) variation for different numbers of cells in the refinement grid for site A. Source: WindSim 6.2, 2015.
50 GWh/y GWh/y 20 Refinement grid for site B No. Of cells No. of cells Figure 23: Graph of AEP (in GWh) variation for different numbers of cells in the refinement grid for site B. Source: WindSim 6.2, No. Of cells No. Of turbines Capacity (MW) Wake model Capacity factor (%) Gross AEP (GWh/y) Wake losses (%) AEP with wake losses (GWh/y) Average wind speed (m/s) Yes Yes Yes Yes Yes Yes Yes Table 26: AEP for all refinement grid simulations for site C. Source: WindSim 6.2, Refinement grid for site C No. Of cells No. of cells Figure 24: Graph of AEP (in GWh) variation for different numbers of cells in the refinement grid for site C. Source: WindSim 6.2, 2015.
51 Limitations and discussions There were few limitations while conducting this thesis project. First of all, there was limited time for this thesis to be finished. Second is, there was no met mast data have been provided by BDM (Bangladesh Meteorological Department). It would be a time consuming process to get data from them. BMD has been collecting wind data more than 50 years from several weather stations around the country. But they collects wind data for weather forecasting which is not suitable for wind energy estimation. There are few reasons for that. Firstly, the wind measurement tower heights are too low; around 5 10 m agl, and the wind measurement needed for wind turbines from at least 50m agl and more. Modern wind turbines are generally have higher hub heights m. Secondly, the measurement tower in weather stations are surrounded by obstacles such as, buildings, houses and plantations. So, there is interruption in wind flow. Thirdly, data recording mechanisms in many stations are not automated, therefore the chance of errors creeping into data are high. WindSim simulations are time consuming. For this thesis project, only WindSim simulations took more than 1080 hours (15 days * 24 hr * 3 PCs). Also the license of WindSim had some limitations as it is provided to student for institutional purposes. So it has limitations with grid size.gws files for three sites. For example; while making.gws file for site B (Chittagong coast line), the met mast BlendedSeaWinds E N was outside of the grid. So all WindSim simulations for site B had been performed by using met mast CFSR2_E91.636_N which has relatively lower wind speed. That s why AEP with WindSim for site B shows lower than the AEP with WindPRO. While calculating AEP in WindPRO for site B, met mast BlendedSeaWinds E N has been used, that s why AEP is higher than WindSim. Due to space limitation, WindPRO and WindSim Simulation full results couldn t added in the appendix. For WindSim, each of simulation contains around 20 pages of full report. In that case, 820 pages (41 simulations * 20 pages) are only full reports of WindSim simulations. Also, there are many results from WindPRO and WAsP Engineering couldn t be added for the same reason. But the important results have been added.
52 The necessity of wind measurement is vital for site suitability and wind energy estimations. The conventional method to measure the wind with met mast tower with cup anemometers or ultrasonic anemometers in different height of the tower. But this method has less mobility function, time consuming and expensive to install. But new technologies like SODAR or LIDAR can be used for remote locations. They can measure the wind speed in different heights with details.
53 Conclusions The results with WindPRO and WindSim shows that the coastal areas have good potential for wind power. In the sites surveyed; site B (Chittagong coast line) and Site C (Teknaf coast line) have the good wind resources. It also indicates that the whole coastline is suitable for wind power development. And the results from WAsP and WAsP Engineering shows that the local climate is suitable for deploying modern wind turbines. Coastal areas are always influenced by the sea breezes and land breezes. That s why the AEP higher like offshore wind turbine as well as the main wind speed. It will be cost efficient (as the offshore wind turbine installation is expensive) and feasible for coast line based wind turbine installations. In site A (Mongla port), the wind resources is not good enough to develop wind power projects as shows in the WindPRO and WindSim results. But the local climate is suitable for modern wind turbine installations as shown results from WAsP and WAsP Engineering calculations. Further investigation can be initiated using the wind measurements from SODAR or LIDAR for better results, which may depict better feasibility of the project. As mentioned before that no published research paper has been found about the wind resource analysis in Bangladesh using such powerful software tools like WindPRO, WindSim or WAsP Engineering. That s why this thesis project holds the importance of future development of wind power in different places including offshore in Bangladesh. This investigation may accrue attention of wind power developers, government officials, investors and researchers for further investigations about the potential of wind power and its development particularly in coastal areas of Bangladesh.
54 References 1. Khan, M. I., Mahboob, S A wind map of Bangladesh. Renewable Energy. 2. A.N.M. Mominul Islam Mukut, Md. Quamrul Islam, PH.D, and Muhammad Mahbubul Alam, PH.D Prospect of Wind Energy in the Coastal Belt of Bangladesh. In: Engineering, Dhaka: Bangladesh University of Engineering and Technology. 3. Pachauri, R. R., A IPCC fourth assessment report. UN. 4. EMD. WindPRO Simisiroglou, Nikolaos. "Wind resource assessment comparison on a complex terrain employing WindPRO and WindSim." (2012) 6. WindSim. WindSim: The Basics. Documentation for WindSim users, Md. Tasbirul Islam, Iftakharuddin, A.Z.Asaifullah Current energy scenario and future prospect of renewable energy in Bangladesh. 8. Nilsson, K. and Ivanell, S. (2010). Wind Energy. Gotland University. Visby. Sweden. 9. Ishihara, Yamaguchi & Fujino, (2004) "Development of a New Wake Model Based on a Wind Tunnel Experiment." Global Wind Power Katic, Højstrup & Jensen, (1986), "A Simple Model for Cluster Efficiency." EWEC Proceedings, 7-9 October 1986, Rome, Italy. 11. Lantz, Hand & Wiser (2012), The Past and Future Cost of Wind Energy. NREL, Conference Paper NREL/CP-6A , August Larsen, (1988), "A Simple Wake Calculation Procedure." Risø-M-2760, Tegen et al (2010), 2010 Cost of Wind Energy Review. NREL, Technical Report NREL/TP , April Wallbank, (2008) WindSim Validation Study, CFD validation in Complex terrain. 15. David Ryan VanLuvanee. (2006). Investigation of Observed and Modeled Wake Effects at Horns Rev using WindPRO. 16. Global Wind Energy Council, (May 2015).
55 Appendix Site A (Mongla Port) Module: PARK. Wind data: CFSR2_E89.591_N22.589, Wake model: No wake
56 Module: PARK, Wind data: CFSR2_E89.591_N22.589, Wake model: Wake
57 Module: PARK, Wind data: CFSR2_E89.591_N (Regression MCP using CFSR_E89.500_N22.500), Wake model: No wake
58 Module: PARK, Wind data: CFSR2_E89.591_N (Regression MCP using CFSR_E89.500_N22.500), Wake model: Wake

59 Module: STANGEN, Wind data: CFSR2_E89.591_N (Regression MCP using CFSR_E89.500_N22.500), Wake model: No wake
60
61 Module: SITE COMPLIANCE
62 Site B (Chittagong coast line) Module: PARK. Wind data: BlendedSeaWinds_E91.750_N22.250, Wake model: No wake
63 Module: PARK, Wind data: BlendedSeaWinds_E91.750_N22.250, Wake model: Wake
64 Module: PARK, Wind data: CFSR2_E91.636_N22.385, Wake model: No wake
65 Module: PARK, Wind data: CFSR2_E91.636_N22.385, Wake model: Wake

66 Module: STANGEN, Wind data: CFSR2_E91.636_N22.385, Wake model: No wake
67

68 Module: SITE COMPLIANCE

69 Site C (Teknaf coast line) Module: PARK. Wind data: BlendedSeaWinds_E92.250_N20.750, Wake model: No wake
70 Module: PARK, Wind data: BlendedSeaWinds_E92.250_N20.750, Wake model: Wake
71 Module: PARK, Wind data: CFSR2_E92.250_N (Regression MCP using BlendedSeaWinds_E92.250_N20.750), Wake model: No wake
72 Module: PARK, Wind data: CFSR2_E92.250_N (Regression MCP using BlendedSeaWinds_E92.250_N20.750), Wake model: Wake

73 Module: STANGEN, Wind data: BlendedSeaWinds_E92.250_N20.750, Wake model: No wake
74

75 Module: SITE COMPLIANCE
Torrild - WindSIM Case study
 Torrild - WindSIM Case study Note: This study differs from the other case studies in format, while here another model; WindSIM is tested as alternative to the WAsP model. Therefore this case should be
Study on wind turbine arrangement for offshore wind farms
 Downloaded from orbit.dtu.dk on: Jul 01, 2018 Study on wind turbine arrangement for offshore wind farms Shen, Wen Zhong; Mikkelsen, Robert Flemming Published in: ICOWEOE-2011 Publication date: 2011 Document
Wind Flow Analysis on a Complex Terrain
 Wind Flow Analysis on a Complex Terrain A reliability study of a CFD tool on forested area including effects of forest module Eventuell figur/bild (Formatmall: Figure and picture text) Högskolan på Gotland
Wind resource assessment over a complex terrain covered by forest using CFD simulations of neutral atmospheric boundary layer with OpenFOAM
 Wind resource assessment over a complex terrain covered by forest using CFD simulations of neutral atmospheric boundary layer with OpenFOAM Nikolaos Stergiannis nstergiannis.com nikolaos.stergiannis@vub.ac.be
The Wind Resource: Prospecting for Good Sites
 The Wind Resource: Prospecting for Good Sites Bruce Bailey, President AWS Truewind, LLC 255 Fuller Road Albany, NY 12203 bbailey@awstruewind.com Talk Topics Causes of Wind Resource Impacts on Project Viability
Comparison of flow models
 Comparison of flow models Rémi Gandoin (remga@dongenergy.dk) March 21st, 2011 Agenda 1. Presentation of DONG Energy 2. Today's presentation 1. Introduction 2. Purpose 3. Methods 4. Results 3. Discussion
Advanced pre and post-processing in Windsim
 University of Perugia Department of Industrial Engineering Francesco Castellani Advanced pre and post-processing in Windsim CONTENTS Pre-processing 1) Domain control: *.gws construction 2) Advanced grid
Windcube FCR measurements
 Windcube FCR measurements Principles, performance and recommendations for use of the Flow Complexity Recognition (FCR) algorithm for the Windcube ground-based Lidar Summary: As with any remote sensor,
Outline. Wind Turbine Siting. Roughness. Wind Farm Design 4/7/2015
 Wind Turbine Siting Andrew Kusiak 2139 Seamans Center Iowa City, Iowa 52242-1527 andrew-kusiak@uiowa.edu Tel: 319-335-5934 Fax: 319-335-5669 http://www.icaen.uiowa.edu/~ankusiak Terrain roughness Escarpments
Wake effects at Horns Rev and their influence on energy production. Kraftværksvej 53 Frederiksborgvej 399. Ph.: Ph.
 Wake effects at Horns Rev and their influence on energy production Martin Méchali (1)(*), Rebecca Barthelmie (2), Sten Frandsen (2), Leo Jensen (1), Pierre-Elouan Réthoré (2) (1) Elsam Engineering (EE)
Are Advanced Wind Flow Models More Accurate? A Test of Four Models
 Are Advanced Wind Flow Models More Accurate? A Test of Four Models Philippe Beaucage, PhD Senior Research Scientist Michael C. Brower, PhD Chief Technical Officer Brazil Wind Power Conference 2012 Albany
Increased Project Bankability : Thailand's First Ground-Based LiDAR Wind Measurement Campaign
 Increased Project Bankability : Thailand's First Ground-Based LiDAR Wind Measurement Campaign Authors: Velmurugan. k, Durga Bhavani, Ram kumar. B, Karim Fahssis As wind turbines size continue to grow with
Acknowledgements First of all, I would like to thank Matthew Homola and Nordkraft for allowing me to use measurements from Nygårdsfjellet wind farm. W
 Acknowledgements First of all, I would like to thank Matthew Homola and Nordkraft for allowing me to use measurements from Nygårdsfjellet wind farm. Without this contribution, this thesis would have been
Site Assessment Report. Wind farm: Ascog Farm (GB)
") Site Assessment Report Energy Yield Estimation Wind farm: (GB) 3 x E- kw with 5m hh Imprint Publisher Copyright notice ENERCON GmbH 5 Aurich Germany Phone: +9 91 97- Fax: +9 91 97-19 E-mail: info@enercon.de
Site Assessment Report Energy Yield Estimation Wind farm: (GB) 3 x E- kw with 5m hh Imprint Publisher Copyright notice ENERCON GmbH 5 Aurich Germany Phone: +9 91 97- Fax: +9 91 97-19 E-mail: info@enercon.de
Measurement and simulation of the flow field around a triangular lattice meteorological mast
 Measurement and simulation of the flow field around a triangular lattice meteorological mast Matthew Stickland 1, Thomas Scanlon 1, Sylvie Fabre 1, Andrew Oldroyd 2 and Detlef Kindler 3 1. Department of
Flow modelling hills complex terrain and other issues
 Flow modelling hills, complex terrain and other issues Modelling approaches sorted after complexity Rules of thumbs Codes and standards Linear model, 1 st order turbulence closure LINCOM/Wasp Reynolds-averaged
Wind Resource Assessment Østerild National Test Centre for Large Wind Turbines
 Downloaded from orbit.dtu.dk on: Jan 21, 2018 Wind Resource Assessment Østerild National Test Centre for Large Wind Turbines Hansen, Brian Ohrbeck; Courtney, Michael; Mortensen, Niels Gylling Publication
WindPRO version Nov 2012 Project:
 23/11/2012 15:21 / 1 WAsP interface - Main Result Calculation: WAsP Interface example Name for WAsP Site coordinates UTM NAD27 Zone: 14 East: 451,101 North: 5,110,347 Air density calculation mode Result
Wind Power. Kevin Clifford METR 112 April 19, 2011
 Wind Power Kevin Clifford METR 112 April 19, 2011 Outline Introduction Wind Turbines Determining Wind Power Output The Price of Wind Power Wind Power Availability across the World and US California Wind
PARK - Main Result Calculation: PARK calculation (5 x 166m, + LT CORR + MITIGATION) N.O. Jensen (RISØ/EMD)
 N.O. Jensen (RISØ/EMD)") PRK - Main Result Calculation: PRK calculation (5 x V15 @ 166m, + LT CORR + MITIGTION) Wake Model N.O. Jensen (RISØ/EMD) Calculation Settings ir density calculation mode Result for WTG at hub altitude
PRK - Main Result Calculation: PRK calculation (5 x V15 @ 166m, + LT CORR + MITIGTION) Wake Model N.O. Jensen (RISØ/EMD) Calculation Settings ir density calculation mode Result for WTG at hub altitude
Centre for Offshore Renewable Energy Engineering, School of Energy, Environment and Agrifood, Cranfield University, Cranfield, MK43 0AL, UK 2
 Fluid Structure Interaction Modelling of A Novel 10MW Vertical-Axis Wind Turbine Rotor Based on Computational Fluid Dynamics and Finite Element Analysis Lin Wang 1*, Athanasios Kolios 1, Pierre-Luc Delafin
Wind shear and its effect on wind turbine noise assessment Report by David McLaughlin MIOA, of SgurrEnergy
 Wind shear and its effect on wind turbine noise assessment Report by David McLaughlin MIOA, of SgurrEnergy Motivation Wind shear is widely misunderstood in the context of noise assessments. Bowdler et
Modelling the Output of a Flat-Roof Mounted Wind Turbine with an Edge Mounted Lip
 Modelling the Output of a Flat-Roof Mounted Wind Turbine with an Edge Mounted Lip S. J. Wylie 1, S. J. Watson 1, D. G. Infield 2 1 Centre for Renewable Energy Systems Technology, Department of Electronic
Wind Project Siting & Resource Assessment
 Wind Project Siting & Resource Assessment David DeLuca, Project Manager AWS Truewind, LLC 463 New Karner Road Albany, NY 12205 ddeluca@awstruewind.com www.awstruewind.com AWS Truewind - Overview Industry
New IEC and Site Conditions in Reality
 New IEC 61400-1 and Site Conditions in Reality Udo Follrichs Windtest Kaiser-Wilhelm-Koog GmbH Sommerdeich 14b, D-25709 Kaiser-Wilhelm-Koog Tel.: +49-4856-901-0, Fax: +49-4856-901-49 Axel Andreä, Kimon
On the use of rotor equivalent wind speed to improve CFD wind resource mapping. Yavor V. Hristov, PhD Plant Performance and Modeling Vestas TSS
 On the use of rotor equivalent wind speed to improve CFD wind resource mapping Yavor V. Hristov, PhD Plant Performance and Modeling Vestas TSS Firestorm- Number 53 on Top500 list from June 2011 14664 processors
WindProspector TM Lockheed Martin Corporation
 WindProspector TM www.lockheedmartin.com/windprospector 2013 Lockheed Martin Corporation WindProspector Unparalleled Wind Resource Assessment Industry Challenge Wind resource assessment meteorologists
How an extreme wind atlas is made
 How an extreme wind atlas is made AC Kruger South African Weather Service X Larsén DTU Wind Energy Wind 1 Atlas for South Africa (WASA) Why do we need extreme wind statistics? Statistical background for
Pre Feasibility Study Report Citiwater Cleveland Bay Purification Plant
 SOLAR POWER SPECIALISTS.Pure Power ACN 074 127 718 ABN 85 074 127 718 POWER MAGIC PTY LTD 245 INGHAM RD GARBUTT QLD 4814 Phone: 1800 068 977 Fax: 07 4725 2479 Email: FNQSOLAR@bigpond.com Pre Feasibility
Bankable Wind Resource Assessment
 Bankable Wind Resource Assessment Bankable Wind Resource Assessment 1.800.580.3765 WWW.TTECI.COM Pramod Jain, Ph.D. Presented to: DFCC Bank and RERED Consortia Members January 25 27, 2011 Colombo, Sri
WESEP 594 Research Seminar
 WESEP 594 Research Seminar Aaron J Rosenberg Department of Aerospace Engineering Iowa State University Major: WESEP Co-major: Aerospace Engineering Motivation Increase Wind Energy Capture Betz limit: 59.3%
Validation of Measurements from a ZephIR Lidar
 Validation of Measurements from a ZephIR Lidar Peter Argyle, Simon Watson CREST, Loughborough University, Loughborough, United Kingdom p.argyle@lboro.ac.uk INTRODUCTION Wind farm construction projects
Computational Fluid Dynamics
 Computational Fluid Dynamics A better understanding of wind conditions across the whole turbine rotor INTRODUCTION If you are involved in onshore wind you have probably come across the term CFD before
EE 364B: Wind Farm Layout Optimization via Sequential Convex Programming
 EE 364B: Wind Farm Layout Optimization via Sequential Convex Programming Jinkyoo Park 1 Introduction In a wind farm, the wakes formed by upstream wind turbines decrease the power outputs of downstream
Evaluation of four numerical wind flow models
 EWEA Resource Assessment Workshop 2013 Evaluation of four numerical wind flow models Michael C. Brower, PhD Chief Technical Officer Jose Vidal, MSc Consulting Services Europe & Latin America Manager Philippe
Control Strategies for operation of pitch regulated turbines above cut-out wind speeds
 Control Strategies for operation of pitch regulated turbines above cut-out wind speeds Helen Markou 1 Denmark and Torben J. Larsen, Risø-DTU, P.O.box 49, DK-4000 Roskilde, Abstract The importance of continuing
Wind Projects: Optimizing Site Selection
 Wind Projects: Optimizing Site Selection ECOWAS Regional Workshop on Wind Energy Babul Patel, Principal Alain Rosier, Vice President Nexant, Inc. Praia, Cape Verde November 4-5, 2013 Basic Criteria for
Tidal influence on offshore and coastal wind resource predictions at North Sea. Barbara Jimenez 1,2, Bernhard Lange 3, and Detlev Heinemann 1.
 Tidal influence on offshore and coastal wind resource predictions at North Sea Barbara Jimenez 1,2, Bernhard Lange 3, and Detlev Heinemann 1. 1 ForWind - Center for Wind Energy Research, University of
7 th International Conference on Wind Turbine Noise Rotterdam 2 nd to 5 th May 2017
 7 th International Conference on Wind Turbine Noise Rotterdam 2 nd to 5 th May 2017 Sound power level measurements 3.0 ir. L.M. Eilders, Peutz bv: l.eilders@peutz.nl ing. E.H.A. de Beer, Peutz bv: e.debeer@peutz.nl
Forest Winds in Complex Terrain
 Forest Winds in Complex Terrain Ilda Albuquerque 1 Contents Project Description Motivation Forest Complex Terrain Forested Complex Terrain 2 Project Description WAUDIT (Wind Resource Assessment Audit and
COMPARISONS OF COMPUTATIONAL FLUID DYNAMICS AND
 The Seventh Asia-Pacific Conference on Wind Engineering, November 8-12, 2009, Taipei, Taiwan COMPARISONS OF COMPUTATIONAL FLUID DYNAMICS AND WIND TUNNEL EXPERIMENTS FOR PEDESTRIAN WIND ENVIRONMENTS Chin-Hsien
CFD Analysis of Giromill Type Vertical Axis Wind Turbine
 242 CFD Analysis Giromill Type Vertical Axis Wind Turbine K. Sainath 1, T. Ravi 2, Suresh Akella 3, P. Madhu Sudhan 4 1 Associate Pressor, Department Mechanical Engineering, Sreyas Inst. Engg. & Tech.,
A STUDY OF PROSPECTS OF WIND RESOURCES FOR WATER PUMPING AND ELECTRICITY GENERATION IN BANGLADESH
 th International Conference on Mechanical Engineering, December -, 1, Dhaka, Bangladesh/pp. I 53-59 A STUDY OF PROSPECTS OF WIND RESOURCES FOR WATER PUMPING AND ELECTRICITY GENERATION IN BANGLADESH Sultan
Evaluation of aerodynamic criteria in the design of a small wind turbine with the lifting line model
 Evaluation of aerodynamic criteria in the design of a small wind turbine with the lifting line model Nicolas BRUMIOUL Abstract This thesis deals with the optimization of the aerodynamic design of a small
The EllipSys2D/3D code and its application within wind turbine aerodynamics
 The EllipSys2D/3D code and its application within wind turbine aerodynamics Niels N. Sørensen Wind Energy Department, Risø DTU National Laboratory for Sustainable Energy and Dep. Civil Engineering, Aalborg
&)' VWXG\ DQG ZLQG IORZ PRGHOLQJ RYHU GLIIHUHQW WHUUDLQ W\SHV
' VWXG\ DQG ZLQG IORZ PRGHOLQJ RYHU GLIIHUHQW WHUUDLQ W\SHV") ɇⱥɍɑɇɂɍɋɍⱦɉȼȿɇⱥɋɍɋȿɇɋʉɂəɍɇɂȼȿɋɋɂɍȿɍ-2015 ɬɨɦ54ɫɟɪɢɹ1.2 &)'VWXG\DQGZLQGIORZPRGHOLQJRYHUGLIIHUHQWWHUUDLQW\SHV Angel Terziev Kiril Mavrov CFD study and wind flow modeling over different terrain types: Worldwide,
ɇⱥɍɑɇɂɍɋɍⱦɉȼȿɇⱥɋɍɋȿɇɋʉɂəɍɇɂȼȿɋɋɂɍȿɍ-2015 ɬɨɦ54ɫɟɪɢɹ1.2 &)'VWXG\DQGZLQGIORZPRGHOLQJRYHUGLIIHUHQWWHUUDLQW\SHV Angel Terziev Kiril Mavrov CFD study and wind flow modeling over different terrain types: Worldwide,
Wind Flow Modeling: Are computationally intensive models more accurate?
 June 23 rd, 2015 Wind Flow Modeling: Are computationally intensive models more accurate? Philippe Beaucage, PhD Lead Research Scientist Michael C. Brower, PhD President & Chief Technical Officer Jose Vidal,
The transition to sustainable energy
 ATSE Symposium The transition to sustainable energy Peter Littlewood 8 Nov 2016 The changing world economy Index 180 170 160 150 140 130 120 110 100 90 Economies less energy intensive Electricity less
Site Summary. Wind Resource Summary. Wind Resource Assessment For King Cove Date Last Modified: 8/6/2013 By: Rich Stromberg & Holly Ganser
 Site Summary Wind Resource Assessment For King Cove Date Last Modified: 8/6/2013 By: Rich Stromberg & Holly Ganser Station ID: 2857 Latitude: 55 7 45.8 N Longitude: 162 16 10.6 W Tower Type: 30 m NRG Tall
Computationally Efficient Determination of Long Term Extreme Out-of-Plane Loads for Offshore Turbines
 Computationally Efficient Determination of Long Term Extreme Out-of-Plane Loads for Offshore Turbines Anand Natarajan Senior Scientist Wind Energy Department, Risø DTU Denmark Introduction IEC 61400-1
Figure 1 Lake Ontario Offshore Study Area near East Toronto
 Wind Energy Resource Assessment and Forecasting for Sites on the Great Lakes Peter Taylor1,2, Jim Salmon2, Jack Simpson3, Wensong Weng1, Matthew Corkum1 and Hong Liu1 1 CRESS, York niversity, 2 Zephyr
Yellowknife Area Wind Potential
 Yellowknife Area Wind Potential Prepared for by Jean-Paul Pinard, P. Eng., PhD. 703 Wheeler St., Whitehorse, Yukon Y1A 2P6 Tel. (867) 336-2977; Email jpp@northwestel.net, and Annika Trimble (Ed.), Aurora
Global Flow Solutions Mark Zagar, Cheng Hu-Hu, Yavor Hristov, Søren Holm Mogensen, Line Gulstad Vestas Wind & Site Competence Centre, Technology R&D
 Global Flow Solutions Mark Zagar, Cheng Hu-Hu, Yavor Hristov, Søren Holm Mogensen, Line Gulstad Vestas Wind & Site Competence Centre, Technology R&D vestas.com Outline The atmospheric modeling capabilities
10 th WindSim User Meeting June 2015, Tønsberg
 10 th WindSim User Meeting 24-25 June 2015, Tønsberg Best Practice PRESENTED BY: Di Li 1 of 3 Content 1. Objective: Bankable AEP Site Suitability 2. Management: Balance on accuracy, timeline and resource
Snare Wind Monitoring Update 2016
 2016 Prepared for by Jean Paul Pinard, P. Eng., PhD. 703 Wheeler St., Whitehorse, Yukon Y1A 2P6 Tel. (867) 336 2977, jpp@northwestel.net March 31, 2016 Executive Summary This project is part of the assessment
LES* IS MORE! * L ARGE E DDY S IMULATIONS BY VORTEX. WindEnergy Hamburg 2016
 LES* IS MORE! * L ARGE E DDY S IMULATIONS BY VORTEX WindEnergy Hamburg 2016 OUTLINE MOTIVATION Pep Moreno. CEO, BASIS Alex Montornés. Modelling Specialist, VALIDATION Mark Žagar. Modelling Specialist,
Wind Project Siting and Permitting Blaine Loos
 Wind Project Siting and Permitting Blaine Loos Energy Project Analyst Center for Wind Energy at James Madison University Wind Project Siting and Permitting The Energy in Wind Resource Assessment (Macro-siting)
Wind Power Potential Assessment of Complex Terrain at RGPV Hill Top
 IJIRST International Journal for Innovative Research in Science & Technology Volume 1 Issue 10 March 2015 ISSN (online): 2349-6010 Wind Power Potential Assessment of Complex Terrain at RGPV Hill Top Syed
2 Asymptotic speed deficit from boundary layer considerations
 EWEC Techn.track Wake, paper ID 65 WAKE DECAY CONSTANT FOR THE INFINITE WIND TURBINE ARRAY Application of asymptotic speed deficit concept to existing engineering wake model. Ole Steen Rathmann, Risø-DTU
Offshore Micrositing - Meeting The Challenge
 Offshore Micrositing - Meeting The Challenge V. Barth; DEWI GmbH, Oldenburg English Introduction Offshore wind is increasingly gaining importance in the wind energy sector. While countries like the UK
M. Mikkonen.
 Wind study by using mobile sodar technology M. Mikkonen Oulu University of Applied Sciences, School of Engineering, Oulu, Finland t3mimi00@students.oamk.com Abstract In this paper is presented a concept
Poland is one of the new countries, which seems to have the potential of being a large market for wind energy projects in the near future.
 Wind atlas for Midnorth POLAND. EMD/Per Nielsen 2001-10-31 Poland is one of the new countries, which seems to have the potential of being a large market for wind energy projects in the near future. EMD
AIRFLOW GENERATION IN A TUNNEL USING A SACCARDO VENTILATION SYSTEM AGAINST THE BUOYANCY EFFECT PRODUCED BY A FIRE
 - 247 - AIRFLOW GENERATION IN A TUNNEL USING A SACCARDO VENTILATION SYSTEM AGAINST THE BUOYANCY EFFECT PRODUCED BY A FIRE J D Castro a, C W Pope a and R D Matthews b a Mott MacDonald Ltd, St Anne House,
Complex terrain wind resource estimation with the wind-atlas method: Prediction errors using linearized and nonlinear CFD micro-scale models
 Downloaded from orbit.dtu.dk on: Dec 17, 2017 Complex terrain wind resource estimation with the wind-atlas method: Prediction errors using linearized and nonlinear CFD micro-scale models Troen, Ib; Bechmann,
A Comparison of the UK Offshore Wind Resource from the Marine Data Exchange. P. Argyle, S. J. Watson CREST, Loughborough University, UK
 A Comparison of the UK Offshore Wind Resource from the Marine Data Exchange P. Argyle, S. J. Watson CREST, Loughborough University, UK Introduction Offshore wind measurements are scarce and expensive,
WIND DATA ANALYSIS AND WIND FLOW SIMULATION OVER LARGE AREAS
 Mathematical Modelling in Civil Engineering Vol. 10 No. 1 2014 Doi: 10.2478/mmce 2014 0005 WIND DATA ANALYSIS AND WIND FLOW SIMULATION OVER LARGE AREAS ANGEL TERZIEV- Lecturer, Assoc. Prof., PhD, Technical
Session 2a: Wind power spatial planning techniques. IRENA Global Atlas Spatial planning techniques 2-day seminar
 Session 2a: Wind power spatial planning techniques IRENA Global Atlas Spatial planning techniques 2-day seminar Central questions we want to answer After having identified those areas which are potentially
Computational studies on small wind turbine performance characteristics
 Journal of Physics: Conference Series PAPER OPEN ACCESS Computational studies on small wind turbine performance characteristics To cite this article: N Karthikeyan and T Suthakar 2016 J. Phys.: Conf. Ser.
Aerodynamic Analyses of Horizontal Axis Wind Turbine By Different Blade Airfoil Using Computer Program
 ISSN : 2250-3021 Aerodynamic Analyses of Horizontal Axis Wind Turbine By Different Blade Airfoil Using Computer Program ARVIND SINGH RATHORE 1, SIRAJ AHMED 2 1 (Department of Mechanical Engineering Maulana
Marine Renewables Industry Association. Marine Renewables Industry: Requirements for Oceanographic Measurements, Data Processing and Modelling
 Marine Renewables Industry Association Marine Renewables Industry: Requirements for Oceanographic Measurements, Data Processing and Modelling October 2009 Table of Contents 1. Introduction... 1 2. Measurements
Session 2: Wind power spatial planning techniques
 Session 2: Wind power spatial planning techniques IRENA Global Atlas Spatial planning techniques 2-day seminar Central questions we want to answer After having identified those areas which are potentially
Wave Energy Atlas in Vietnam
 Wave Energy Atlas in Vietnam Nguyen Manh Hung, Duong Cong Dien 1 1 Institute of Mechanics, 264 Doi Can Str. Hanoi, Vietnam nmhungim@gmail.com; duongdienim@gmail.com Abstract Vietnam has achieved remarkable
3D-simulation of the turbulent wake behind a wind turbine
 Journal of Physics: Conference Series 3D-simulation of the turbulent wake behind a wind turbine To cite this article: Steffen Wußow et al 2007 J. Phys.: Conf. Ser. 75 012033 View the article online for
Inuvik Wind Monitoring Update 2016
 Inuvik Wind Monitoring Update 2016 Source: MACA Prepared for By Jean Paul Pinard, P. Eng., PhD. 703 Wheeler St., Whitehorse, Yukon Y1A 2P6 Tel. (867) 336 2977; Email jpp@northwestel.net March 31, 2016
Wind Flow Model of Area Surrounding the Case Western Reserve University Wind Turbine
 Wind Flow Model of Area Surrounding the Case Western Reserve University Wind Turbine Matheus C. Fernandes 1, David H. Matthiesen PhD *2 1 Case Western Reserve University Dept. of Mechanical Engineering,
Meteorological Measurements OWEZ
 Meteorological Measurements OWEZ Half year report - 01-07-2008-31-12-2008 H. Korterink P.J. Eecen J.W. Wagenaar ECN-E--09-018 OWEZ_R_121_20080701-20081231_WIND_RESOURCE_2008_2 Abstract NoordzeeWind carries
PO. 233 Arno Brand, Edwin Bot, Hüseyin Özdemir ECN - Unit Wind Energy, NL 1755 ZG Petten, Netherlands
 Accurate Wind Farm Development and Operation Advanced Wake Modelling PO. 233 Arno Brand, Edwin Bot, Hüseyin Özdemir ECN - Unit Wind Energy, NL 1755 ZG Petten, Netherlands Gerald Steinfeld, Sonja Drüke,
Meteorological Measurements OWEZ
 Meteorological Measurements OWEZ Half year report 01-01-2008-30-06-2008 H. Korterink P.J. Eecen ECN-E--08-062 OWEZ_R_121_20080101-20080630_wind_resource_2008_1 Abstract NoordzeeWind carries out an extensive
Vindatlas i Ægypten. Mortensen, Niels Gylling; Badger, Jake; Hansen, Jens Carsten. Publication date: Document Version Peer reviewed version
 Downloaded from orbit.dtu.dk on: Dec 19, 2017 Vindatlas i Ægypten Mortensen, Niels Gylling; Badger, Jake; Hansen, Jens Carsten Publication date: 2006 Document Version Peer reviewed version Link back to
RESOURCE DECREASE BY LARGE SCALE WIND FARMING
 ECN-RX--4-14 RESOURCE DECREASE BY LARGE SCALE WIND FARMING G.P. Corten A.J. Brand This paper has been presented at the European Wind Energy Conference, London, -5 November, 4 NOVEMBER 4 Resource Decrease
Large-eddy simulation study of effects of clearing in forest on wind turbines
 Large-eddy simulation study of effects of clearing in forest on wind turbines J. Matsfelt 1 and L. Davidson 1 1 Chalmers University of Technology, Dep. of Mechanics and Maritime Sciences, Div. of Fluid
Numerical Investigation of Multi Airfoil Effect on Performance Increase of Wind Turbine
 International Journal of Engineering & Applied Sciences (IJEAS) International Journal of Engineering Applied Sciences (IJEAS) Vol.9, Issue 3 (2017) 75-86 Vol.x, Issue x(201x)x-xx http://dx.doi.org/10.24107/ijeas.332075
Wind Resource Assessment for FALSE PASS, ALASKA Site # 2399 Date last modified: 7/20/2005 Prepared by: Mia Devine
 813 W. Northern Lights Blvd. Anchorage, AK 99503 Phone: 907-269-3000 Fax: 907-269-3044 www.aidea.org/wind.htm Wind Resource Assessment for FALSE PASS, ALASKA Site # 2399 Date last modified: 7/20/2005 Prepared
Numerical and Experimental Investigation of the Possibility of Forming the Wake Flow of Large Ships by Using the Vortex Generators
 Second International Symposium on Marine Propulsors smp 11, Hamburg, Germany, June 2011 Numerical and Experimental Investigation of the Possibility of Forming the Wake Flow of Large Ships by Using the
Wind Flow Modeling Software Comparison
 Wind Flow Modeling Software Comparison John Vanden Bosche AWEA Wind Resource Assessment Workshop Minneapolis, MN September 30, 2009 Issues With Wind Flow Modeling Impractical to measure the wind at the
Full Classification acc. to IEC for SoDAR AQ510 Wind Finder. Vincent Camier, Managing Director, Ammonit Measurement GmbH
 Full Classification acc. to IEC 61400-12-1 for SoDAR AQ510 Wind Finder Vincent Camier, Managing Director, Ammonit Measurement GmbH Ammonit Company Profile German company, based in Berlin +25 years of know-how
WAKE MODELING OF AN OFFSHORE WINDFARM USING OPENFOAM
 WAKE MODELING OF AN OFFSHORE WINDFARM USING OPENFOAM Alireza Javaheri, Beatriz Canadillas UL International GmbH (DEWI), Ebertstr. 96, 26382 Wilhelmshaven, Germany Summery The premier task of this work
3D Nacelle Mounted Lidar in Complex Terrain
 ENERGY 3D Nacelle Mounted Lidar in Complex Terrain PCWG Hamburg, Germany Paul Lawson 25.03.2015 1 DNV GL 125.03.2015 SAFER, SMARTER, GREENER Agenda Introduction and Project Background Lidar Specifications
CORRELATION EFFECTS IN THE FIELD CLASSIFICATION OF GROUND BASED REMOTE WIND SENSORS
 CORRELATION EFFECTS IN THE FIELD CLASSIFICATION OF GROUND BASED REMOTE WIND SENSORS Will Barker (1), Julia Gottschall (2), Michael Harris (3), John Medley (4), Edward Burin des Roziers (5), Chris Slinger
E. Agu, M. Kasperski Ruhr-University Bochum Department of Civil and Environmental Engineering Sciences
 EACWE 5 Florence, Italy 19 th 23 rd July 29 Flying Sphere image Museo Ideale L. Da Vinci Chasing gust fronts - wind measurements at the airport Munich, Germany E. Agu, M. Kasperski Ruhr-University Bochum
Observed Roughness Lengths for Momentum and Temperature on a Melting Glacier Surface
 5 Observed Roughness Lengths for Momentum and Temperature on a Melting Glacier Surface The roughness lengths for momentum and temperature are calculated on a melting glacier surface. Data from a five level
The study on micro-location of wind-electric field in the complex terrain
 Academia Journal of Scientific Research 3(3): 000-000, February 2019 DOI: 10.15413/ajsr.2019.2006 ISSN 2315-7712 2019 Academia Publishing Research Paper The study on micro-location of wind-electric field
Session 2b: Wind power spatial planning techniques
 Session 2b: Wind power spatial planning techniques IRENA Global Atlas Spatial planning techniques 2-day seminar Central questions we want to answer After having identified those areas which are potentially
SUPPLEMENTARY GUIDANCE NOTE 4: WIND SHEAR
 A GOOD PRACTICE GUIDE TO THE APPLICATION OF ETSU-R-97 FOR THE ASSESSMENT AND RATING OF WIND TURBINE NOISE SUPPLEMENTARY GUIDANCE NOTE 4: WIND SHEAR ISSUE 1 JULY 2014 Page 1 of 14 PREFACE This document
Numerical simulations of a large offshore wind turbine exposed to turbulent inflow conditions
 9 th European Seminar OWEMES 2017 Numerical simulations of a large offshore wind turbine exposed to turbulent inflow conditions Galih Bangga, Giorgia Guma, Thorsten Lutz and Ewald Krämer Institute of Aerodynamics
Post-mortem study on structural failure of a wind farm impacted by super typhoon Usagi
 Downloaded from orbit.dtu.dk on: Nov 26, 2018 Post-mortem study on structural failure of a wind farm impacted by super typhoon Usagi Chen, Xiao; Li, Chuan Feng; Xu, Jian Zhong Publication date: 2015 Document
IMPROVEMENT OF THE WIND FARM MODEL FLAP FOR OFFSHORE APPLICATIONS
 IMPROVEMENT OF THE WIND FARM MODEL FLAP FOR OFFSHORE APPLICATIONS Bernhard Lange(1), Hans-Peter Waldl(1)(2), Rebecca Barthelmie(3), Algert Gil Guerrero(1)(4), Detlev Heinemann(1) (1) Dept. of Energy and
HOUTEN WIND FARM WIND RESOURCE ASSESSMENT
 CIRCE CIRCE Building Campus Río Ebro University de Zaragoza Mariano Esquillor Gómez, 15 50018 Zaragoza Tel.: 976 761 863 Fax: 976 732 078 www.fcirce.es HOUTEN WIND FARM WIND RESOURCE ASSESSMENT CIRCE AIRE
Wind Resource Assessment for NOME (ANVIL MOUNTAIN), ALASKA Date last modified: 5/22/06 Compiled by: Cliff Dolchok
, ALASKA Date last modified: 5/22/06 Compiled by: Cliff Dolchok") 813 W. Northern Lights Blvd. Anchorage, AK 99503 Phone: 907-269-3000 Fax: 907-269-3044 www.akenergyauthority.org SITE SUMMARY Wind Resource Assessment for NOME (ANVIL MOUNTAIN), ALASKA Date last modified:
813 W. Northern Lights Blvd. Anchorage, AK 99503 Phone: 907-269-3000 Fax: 907-269-3044 www.akenergyauthority.org SITE SUMMARY Wind Resource Assessment for NOME (ANVIL MOUNTAIN), ALASKA Date last modified:
The Influence of Ocean Surface Waves on Offshore Wind Turbine Aerodynamics. Ali Al Sam
 The Influence of Ocean Surface Waves on Offshore Wind Turbine Aerodynamics Ali Al Sam What I m going to wear today? Do I need to leave early to get to work? Taking buss or riding bike? Where will we drink