A TEACHING UNIT FOR YEARS 8 12 CHILDREN
|
|
|
- Annabella Smith
- 6 years ago
- Views:
Transcription


1 A TEACHING UNIT FOR YEARS 8 12 CHILDREN 31
2 ACTIVITY 1: WHAT CAUSES TIDES? What you will need: Tide Tables: Map of the area related to tide times. Paper, Thin Cardboard, Some clear plastic, Scissors. Paper Fastener What to do: Step 1: Find a chart of the high and low tide times and tide heights for a particular month. Also find the days on which there is a new and a full moon. Pick four consecutive days. Write down the daily tide times for those days. Draw a graph of the tide height against time for the high and low tides in the day. (There may be 3 or 4) Question: What is the period of time between the tides? An Extension Activity Step 2: Repeat what you have just done for different days two weeks later. Question: Are the tides the some height? Do the high and low tides occur at the same time? Step 3: If you can get a map of your island, pick a particular day. Find all the places you have tide information for. Mark off the high tide times over the 24 hour period. Something to think about? Do you notice anything about the pattern? Could you say that the pattern of the high tide times shows up like a wave that travels around island? How would knowing this affect your planning of a fishing trip? 32
3 A 6 am Modelling the tides. Use the templates to cut out one shape on the clear plastic sheet the other on a sheet of paper Colour this area blue to represent the ocean 12 midnight Paper Fastner Plastic sheet 6 pm 12 noon Continent Moon A Paper sheet Colour this area green or brown to represent the earth s crust Ocean floor 33
4 What to do: On the plastic sheet, colour in the water blue. Make sure you mark the points A, B, C, and D and the times. On the paper cutout colour in the land a different colour. Paste this to a piece of cardboard. Carefully push a paper fastner through the centre of the top piece and then through the bottom piece. Make sure that the two pieces can rotate. Line up the A on the top piece with the one on the bottom piece. Is this a high tide or low tide at A. Now rotate the piece of plastic so it is 12 noon at A. Is this high tide or low tide? Continue on to 6 pm and 12 midnight at A. This is like the moon orbiting around the earth. How many high and low tides are there in one day? What does the ocean appear to be doing as the moon orbits around the earth? Name the force that attracts the water towards it? Something to think about? Why is there a bulge of water at the opposite end? Hint: This has to something to do a special force called centrifugal force. Here is an example, what happens when you swing a bucket of water over your head? Do you think the gravitational force of the sun will have any effect on the tides? What is going to happen if the sea levels start to rise? Can you show this on the templates you have made? Something to find out about? The tide heights are not exactly the same over the 24 hour period. Why does this happen? The tides do not exactly go through a 24 hour period. In fact it is slightly longer. Can you find out why? 34
5 What we want children to learn. Tides are cyclical. They are a natural event caused by gravity that causes the sea level to rise and fall. It is possible to follow the tidal pattern around islands, just as it is around the earth The period between each high tide is a little more than 12 hours and is created by time it takes for the moon to complete its orbit. 35
6 ACTIVITY 2: SPRING AND NEAP TIDES. Predict: When do you think the tides will be at their highest? What you need: A tide chart for a month. The dates for the new and full moon. What to do; Draw a graph of the tides for the month. Height is on the y axis. Date is on the x axis. Use only the highest and lowest tide for each day. Mark on the graph, the day on which there is a full moon and the day there is a new moon. Observe: What do you notice about the tide heights on these days? Explain: Use the four diagrams below to explain why there are changes in the tide heights? The diagrams show the moon s position in relation to the earth and sun as it orbits the earth. moon earth earth earth earth 36
7 What we want children to learn: Sun and moon both influence sea level. Their gravities can combine or work against each other. Spring tides (high sea levels) result from the combined gravitational forces. 37
8 ACTIVITY 3: WILL GLOBAL WARMING CAUSE THE OCEANS TO RISE? Prediction: What do you think? Discuss your ideas with your and write down your group explanation. These two experiments may help you answer this question and confirm your ideas.? Experiment: To demonstrate how much water expands on warming. What you will need: A Flask or clear plastic drink bottle: Stopper: Glass tube: Food colouring. What to do: Fill the flask almost to the brim with water and a drop of colouring. Put in the stopper and tube. Press down firmly. Water should rise up the tube. When it has stopped rising mark the tube with a marker pen. Put the flask out in the sun. After 10, minutes take a look at the flask. Measure: How far up the tube is the water level now? Explain: Why has the water moved up the tube. Something to think about: Can you redesign the experiment to measure the how far the water travels up the tube for every 2 o C? Something more to think about: For each 1 degree centigrade that the temperature of the water increases, it increases in volume by a factor of or 0.021%. What would be the effect on the volume of water in the ocean of a 1 degree temperature rise? 38
9 Well let s assume that the average depth of the ocean is 3.7 km. If the area that the oceans cover remains pretty much unchanged, then the change in depth will be: 3700 m x = 0.78 m That means that a 1 degree temperature increase in the oceans will give an almost 80 cm increase in sea level. Measure 80cm on a wall up from the ground. Look around you, how much of the area you are standing would be flooded? How much would be clear above the new water level? This is the worst case scenario for 2100, the turn of the next century! Experiment: To demonstrate how much extra water is produced when ice melts. What you will need: A bowl or container of water: Some ice cubes What to do: Fill a container 3/4 full with water. Add ice cubes. Mark the side of the container with a marker pen. Let the ice cubes melt. Prediction: What do you think will happen? Measure: Has the height of the water changed once the ice cubes have melted. Explain: Was there as much change as you expected? Can you explain what has happened? Question: We know that the Greenhouse Effect is warming the oceans and melting the floating ice caps. Which one do you think will have the greatest effect in your lifetime on sea levels? What evidence do you have to support your answer? What we want children to learn: 39
10 When water warms it expands. Reason being that the water particles have more energy so need to occupy more space as they move around more. When icecaps melt they will not increase the amount of water in the oceans as the water that has originated from the ice merely takes up the volume originally occupied by the ice. 40
11 ACTIVITY 4: HOW DO WE FIND OUT THE MEAN SEA LEVEL? What you will need: Long length of string, tape measure, meter ruler, sellotape, a marker, a level marker, small weight. Students will need to work in threes Note to the teacher. If the beach has only a small slope you may want to tie two rulers together before putting the level in place. What to do: Getting the gear together. air bubble First thing to do is to make a level. This is a home-made spirit level. Find a small plastic test tube with a screw lid. Fill the small test tube so that it is almost full with water (or cooking oil). Leave a small air bubble. Screw on the lid. The air bubble should move freely in the test tube. Secure the test tube to the middle of a metre ruler. Sellotape will do At one end of the ruler tie a one metre length of string. Finding the profile: Do this at low tide. At the top of the beach, hold the ruler level and let the string hang down. Make sure the ruler is level. Another student lifts the string so the weight is just touching the sand. Measure the length of string hanging from the ruler and touching the sand. The third student can record the height. Move the end of the ruler to the place in the sand where the string reached and do the same thing again. Continue this until you reach the low tide mark. Now use graph paper and use these measurements to draw a profile. Mark the high tide mark and the low tide points. This is an example 41
12 low tide mark foreshore high tide mark Now draw a line between the two marks, high water and low water. This is called the foreshore. Mark a point on the fore shore halfway between the low tide and high tide marks. This is the mean point for the sea level. What to do next: You have measured the distance between high and low tides. If possible take this measurement over the period of a month and record the state of the moon and weather. Can you explain: What could be altering the height of the sea? How large an effect is it having? Can you guess: How will the water level marks change if the oceans start to rise? Will the water levels at high tide start to affect the land behind the beach? How high will the sea level have to rise, allowing for everything else staying the same? What we want children to learn; Data is information gathering. Gathering data over time provides evidence for what could be happening. Scientific knowledge needs the assistance of mathematical tools. 42
13 ACTIVITY 5: SEA LEVELS, PAST PRESENT AND FUTURE! What you will need: Graph paper, Ruler: Pencil. What to do: The sea has never been always at the same level. For a variety of reasons ranging from climate to geological the sea levels have changed. Using a technique known as Thorium/Uranium dating, sea level has been estimated off the coral reefs of Papua New Guinea for the last 250 thousand years. Thousand years before today Metres below present sea level 0 (Today) Plot a graph showing how the sea level has changed over the last 250 thousand years. Start with the x-axis on 250 thousand and work up to 0 (today). On the y-axis start at 0 and go downward to a maximum of 140m Question: How has the sea level varied over this period of time? That was the past. Now what do scientists predict for the future? 43
14 The data is based on models that scientists use to predict the changes in sea level as the oceans increase in temperature. These figures were dated from Year Change in average sea level Lowest Estimate (cm) Best Guess Estimate (cm) Worst Case Estimate (cm) Draw a graph of the possible changes in sea level over the sixty years from Put the years along the x-axis. The average sea level should be on the y-axis. You will have a line for each estimate. Something to think about: What effect do you think the sea level change will have in your area? (You could do this for each of the estimates). Something extra: Can you predict how badly the coastal areas will be affected and to what extent? If you can, get hold of a map of your area or nearest coastal area showing the heights of the land above sea level. (These are shown by contours). Make a rough copy of the map, showing towns, villages, rivers, hills and valleys. See if you can shade in the areas that will be most affected by a 30 cm increase in sea level. Go down to the beach. Work out where the low and high tide marks would be. How much higher would the high tide mark be? Could this affect any areas inland on your island? 44

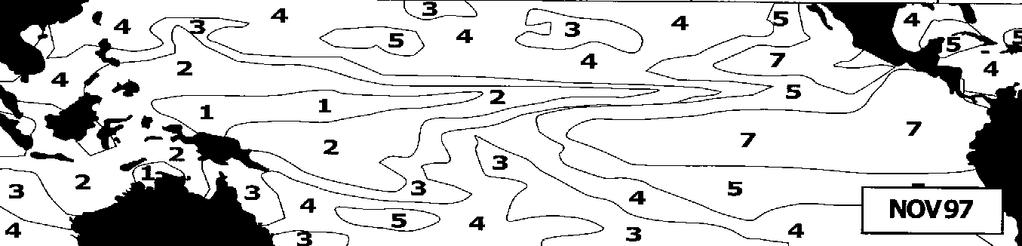
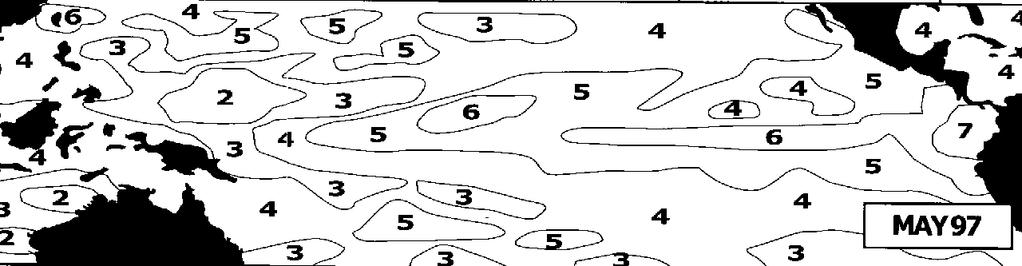
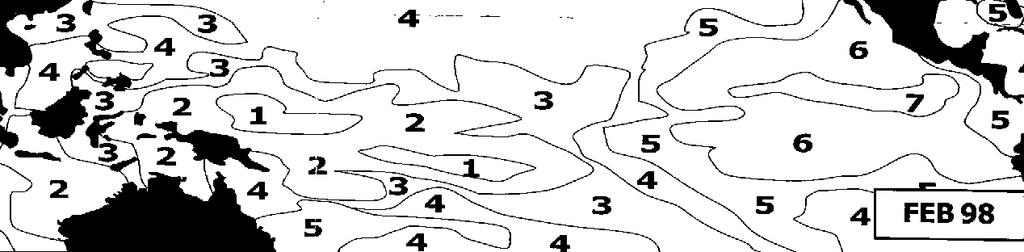
15 ACTIVITY 6: EL NINO: AN EXAMPLE OF WHAT CAN HAPPEN WHEN OCEAN TEMPERATURES CHANGE. Ocean Temperatures and El Nino? El Nino is a weather pattern that occurs periodically over the Pacific Ocean. Its effects are felt world wide. It involves a change in ocean temperatures across the mid Pacific Ocean linked to a decrease in the intensity of the seasonal South East Trade Winds. El Nino got its name from the fisherman of South America who recognised this weather pattern as being significant for its poor fishing. The change occurs when the trade winds that blow from the east of the Pacific Ocean to the West weaken. The information you are going to use originated with the El Nino of Look at the satellite information: 1. Which way did the warm water travel? 2. When was the El Nino at its maximum? How do we know? 3. How long did it take for the El Nino to disappear? Key: The lighter area represents warmer ocean waters 45

16 Activity: How does this affect the height of the oceans. The Pacific maps you are given show contour lines, which give the changes in sea level height through the El Nino period 1997 to Colour the maps using the following key: Colour code Sea Level Height (cm) 1 = Purple 2 = Blue 3 = Lt Blue 4 = Green 5 = Yellow 6 = Orange = Red 46
17 47

18 Questions: 1. What is the highest the sea reached? Where was this? 2. What is the lowest point the sea reached? Where was this? 3. What is the difference in sea level height? 4. Describe how the sea appeared to move over the year. 5. Can you locate your approximate Pacific location on the map? 6. What happened to the height of the sea in your location over the year? Something Extra: Place some tracing or clear paper on top of one of the maps. Trace the contours of the surface by outlining each of the different colours. Now trace a particular outline onto a piece of card. If possible use different coloured card for each contour outline. Cut out the pieces of card. Place them carefully on the traced out map in their corresponding positions. Glue them in place. What you have built is a model of the sea level surface. How do you think this might affect the ocean currents? (Your teacher has a map of these currents.) 48
19 ACTIVITY 7: MAKE YOUR OWN EL NINO Purpose: This is a way of demonstrating to students of what happens to the trade winds in an EL Nino cycle and the effect it has on ocean upwelling. Materials: Clear plastic oblong container (approx. 45cm x 10cm x 10cm) (If not available clear plastic food containers will do), Water, Mineral oil, (something like clear turps will work) Blue food colouring, Hair dryer Optional - Red Oil-based paint to colour the turps. A map of the Pacific Ocean Setting this up: Fill the tray with water to within 2cm of the top. Add blue food colouring to the water to give the effect of a blue ocean. Do not stir the food colouring but allow some to settle on the bottom to give a darker colour. This will show the upwelling. In a bowl mix in some red oil-based paint with the clear oil or turps until it is evenly coloured. The oil-based paint is not a necessity. It just makes it easier to see the movement on the surface. Gently pour the oil over the surface of the water. Allow to settle so that you have two layers. Mark one end of the container west (Indonesia) and the other end east (South America.) Plug in hair dryer. Note keep it away from any water spills. What does the model represent? The liquids in the plastic container represent a slice across the equatorial Southern Pacific Ocean. The red oil represents the warm layer of surface water that has been heated by the sun. The blue water represents the colder water below the surface warm layer which has traveled through from the colder southern regions. The hairdryer is about to represent the trade winds. 49
. After the wind has been blowing for a period of time add a few drops of food colouring to the west end of the tank. ( It should sink to the bottom.) Keep the wind blowing.")
20 What to do: Turn on the hairdryer so giving a strong blast of air (no heat needed) and direct the wind it across the surface of the oil-topped water from the East (South America) to the West (Indonesia). After the wind has been blowing for a period of time add a few drops of food colouring to the west end of the tank. ( It should sink to the bottom.) Keep the wind blowing. Ask the class to describe what effect this has on the warm and cold water. Have the class draw what they see happening. (It should be possible show the upwelling of cold water to the surface.) Have the class predict what would happen if the Trade Winds do not blow or are not as strong: Turn off the trade winds and ask the class to describe what happened when the trade winds stop. Repeat this by turning down the speed of the hairdryer or moving it further away from the surface of the ocean to represent weaker winds. Ask the class to describe what happened when the trade winds are not as strong. Do the observations fit the predictions? 50
21 Explanation: The warm water is pushed across the Pacific and piles up in the West (Indonesia) as it is blown by the trade winds (hair dryer). This is what we would normally expect to happen in the equatorial Pacific Ocean. The blue food represents the cold water and you may notice that the bottom moves upwards towards the surface at the eastern end (South America). This is upwelling which, in the Pacific Ocean, brings nutrient-rich bottom waters to the surface. Plankton feed on the nutrients, and in turn fish feed on the plankton, so these areas tend to be rich in fish and other sea life. When the trade winds do not happen or are weaker. The warm water moves back across the ocean from the west (Indonesia) to the east (South America). This movement warm water that is the oceans part of the El Nino condition. (You may need to do this several times to observe the movement.) This stops the upwelling and prevents the nutrients flowing to the plankton. The result is poor fishing. Note: The warm water also deflects up and down the coastline of South and North America, and this creates other problems. Extension: Discuss the location of the warm water on the globe. Discuss what will happen to the air above the warm water in terms of how much moisture the air can hold. (The air warms and holds more moisture from the evaporation of seawater the water cycle) If the body of warm water expands what will happen to possible occurrence of cyclones in the South Pacific? 51
22 ACTIVITY 8: WHAT IS HAPPENING AND WHAT CAN WE DO? A lot of work is being done by scientists to understand the role of the oceans, atmosphere and how they affect the weather. One thing is definitely known: The Greenhouse Effect is changing our climate. The changes include: Warming of the earth s atmosphere, Sea levels rising, Change in weather patterns e.g. more droughts or more rainfall in some areas, Change in agriculture practices, New health threats caused by unfamiliar diseases, Lack of drinking water, Threats to wildlife and coral reefs, Survey: What do people think is happening? What you will need: Pen and large sheets of paper. Groups of 3-4 people. What to do: In your group decide on a series of questions that you think might tell you something about what people think about climate change. They can be simple questions like: Do we seem to be getting more rain? Are we getting more storms? Is the fishing as good as it used to be? How has the reef near the village changed? Is the sea coming up the beach further? There are many more, but decide on the five best ones. Now decide who you are going to ask. Who would be the best people to get your information from? Who has lived in your village for a long time? Each group member should ask at least 3 people. 52
23 When you have the information: Draw up a table to record people s comments. Think of ways that you can group their answers. It could be something like this: NAMES More rain More storms More cloud Less rain Joe Mary Look for any common statements recorded by people in your group. Is there anything in common about what the people you surveyed think is happening to the climate? Could you rewrite any of these as issues. Activity: Looking for Solutions What you will need: Pen and large sheets of paper. Groups of 3-4 people. What to do: The sheet below is called an Environmental Action Planner. Divide up your large sheet of paper into the sections shown on the template. Pick one of the issues from your survey above. Write this into the box: What is the Issue? Work your way through the rest of the boxes. You don t have to do them in any particular order. You may find that there are a lot of things to consider and you have to cut down on these in order to make it workable. Remember: Your solutions need to be workable for you. 53
24 Environmental Action Planner What is the issue we will deal with? What do we want to see happen? What information do we need? What do we want to change? What could we do? Who do we need to talk to? What skills do we need? Who or what will influence the decision we will make? Will these work? What do we do to make people aware of the issue? What will we do? Will it get to where we want to be? Our thoughts. 54
25 APPENDIX: SOME ACTIVITIES LOOKING AT SALTWATER. A STARTER ACTIVITY: WHAT IS DENSITY? Note for the teacher: This activity is a starter activity to introduce students to the concept of density. (This concept becomes apparent in later activities related to the composition of seawater.) What you will need: Some blocks of wood (preferably cubes): A block of plastic: A book: Blocks of different metals: A set of scales: A ruler. (Note for the teacher: To make life easier use rectangular blocks of different materials and with dimensions that are close to exact centimetre measurements.) What to do: Rank the objects in what you think is from the densest to the least dense. Using the ruler, measure the length, width and height of the objects to the nearest centimetre. Use these measurements to calculate the volume of the object. (This will give the volume in cubic centimetres). The formula is: Volume = Length x Width x Height Now weigh each object on the scales to the nearest gram. When you have recorded this information, calculate the density of each object. The formula is: Density = Mass/Volume Now rank the objects in order of the densest to the least dense. How close were you to your original ranking? Something to think about: Density tells us something about how tightly packed the particles are. Which object would be the densest of the ones you measured? The density of fresh water is very close to 1g/cm 3. Objects that are denser than water will sink. Those, which are less dense, will float. Group your objects into those that will sink and those that will float. 55
26 Extension: Find out a way of measuring the density of unusually shaped objects such as stones. What we want children to learn; All matter is made up of particles. Density is a measure of how closely these particles are packed together. The tighter the packing, the more dense the material. Density is measured in units of mass per unit volume, ACTIVITY: STUFF TO DO WITH SEA WATER. (AN INTRODUCTION TO SOME OF THE PROPERTIES OF SEAWATER.) Explain: Why is Sea Water salty? Where does the salt come from? Discuss your ideas as a group and draw or write out your final ideas on a large sheet of paper for class discussion. Activity: Where does the salt go? Prediction: Does adding salt to the water change the volume occupied by the water? What you will need: A large jar (or a large measuring cylinder): Marker pen: Salt: A tablespoon: Water. What to do: Fill the large container 3/4 full with water. Mark the level of the water in the container. Add a tablespoon of salt. Stir and wait until it has dissolved. Keep doing this until there is just a little bit of salt left on the bottom of the container. Check the water level on the side of the container. Observe: What happens to the water level before and after adding salt? Explain: If the water and salt are made up of particles how can what has happened be explained? (Use pictures to help you explain what has happened if you wish). 56
27 Teacher: Use pebbles in a measuring cylinder and then add sand to show how the salt particles can take up the spaces between water molecules without increasing the volume). Question: Density is a measure of how tightly the particles of something are packed in the same amount of space. For instance a kilogram of salt occupies more space than a kilogram of lead. Would one litre of Sea Water weigh more/ the same/ or less/ then one litre of Freshwater? Can you explain why? What do you think the density of Sea Water would be like compared to Fresh Water? What we want children to learn: Salt has come from the land runoff and sedimentation Salt dissolves in water. The dissolved salt does not change the volume of the water. Since the volume of the water does not change, the density of the water has increased. 57
28 ACTIVITY: WHAT MAKES SEAWATER DIFFERENT? Prediction: Will seawater and freshwater mix? What you will need: 2 x 250ml beakers or large glass jars: Salt: Blue food colouring: Green food colouring: 2 small clear containers about 50 ml will do: 2 droppers: Tablespoon: Marker pen. What to do: Pour enough water into the large glass containers so they are half full. Put a tablespoon of salt into one of the containers and stir until the salt has dissolved. Write salt water on this container. Write fresh water on the other container. Pour some of the salty water into one of the small containers so it is 3/4 full. Add green colouring to this salty water until it is dark green. Label the small container Salt Water. Pour some freshwater into the other small container until it is 3/4 full. Add the Blue food colouring so that the water turns light blue. Label it Fresh Water. Use a dropper and gently add some drops of the green salt water to the large container of clear fresh water. Observe: Draw what happens to the green seawater? Does it mix with the fresh water? Does it float or sink? Use colours in your drawing to show what is happening? Now use a clean dropper and add some drops of blue freshwater to the clear seawater in the large container. Observe: Draw what happens to the blue fresh water? Does it mix with the seawater? Does it float or sink? Use colours in your drawing to show what is happening? 58

29 Explain: Can you think of a reason for what you see happening when freshwater and seawater come together? Questions: What do you think happens when it rains out at sea? Does the rainwater and sea water mix straight away? What we want children to learn: Seawater is denser than freshwater. When it rains the freshwater reduces the salinity of the saltwater on the surface. Something Extra: An Argo float looks at the amount of salt (salinity) of the water as it comes to the surface. The profiles below come from the data from two floats that were close to each other in the equatorial regions. How could you explain the difference in the salinity levels of the water? (Hint: before and after a heavy rainstorm ) Why could this be important information? What would cause the rainwater and sea water to eventually mix? 59
30 ACTIVITY: COMPARING THE BEHAVIOUR OF WARM WATER TO COLD WATER. The temperature of sea water varies all over the world. The ocean waters near the Artic and Antarctic will be considerably colder than the water near the Equator. The temperature of the water affects its density. This in turn affects how the water moves in the ocean, and the way deep ocean currents move. Prediction: What do you think will happen when warm and cold water meet each other? What you will need: Iced water: Very hot water: A large clear container (500 ml beaker): 2 small containers (30 ml beakers): Red and Blue food colouring: 2 droppers. What to do: Fill the large container 3/4 full with tap water and place it on a table to allow the water to settle. This allows it to reach the same temperature as the room. Pour some hot water into one of the small containers so that it is half full. Put some drops of RED food colouring into the hot water to make it dark red. Pour some iced water into the other container. Put some drops of BLUE food colouring into the iced water to make it dark blue. Using the dropper gently add some drops of hot red water to the water in the large container. Then add drops of blue iced water to the same large container of water. Observe: What happens to the hot and cold water. Do they mix? Draw pictures using Red and Blue colouring pencils to show what happens to the water. You may need to do several pictures over a period of time. Explain: What happens to the cold water? Why do you think this happens? What happens to the warm water? Why do you think this happens? What do you think will happen when cold water from the Polar Regions meets up with warmer water from the equator? Extension: Hold a straw at the edge of the top of the beaker so that it is parallel to the water surface. Blow gently through the straw. What happens to the water? 60
31 What we want children to learn: Cold water sinks below warm water. It is more dense. Warm water will sit on top of cold water. Wind will mix up the layers of warm and cold water. The picture shows the temperature profile taken from an Argo float near the equator. Temperature ( o C) 61
32 ACTIVITY: WHERE DOES THE MELTED ICE WATER GO? Prediction: What do you think will happen to the water as the ice melts on the surface? What you will need: Beaker, Water, Ice cubes (coloured with food colouring). What to do: Fill the beaker 3/4 full with water. Place the coloured ice cube on the surface of the water. Watch what happens. Explain: Why do you think this is happening? What so this mean will happen to the fresh cold water from the molten ice caps? What do we want children to learn? The cold water from the melting ice caps sinks. The deep water of the oceans is very cold. The deep water of the oceans travels along 62
33 63
Deep Water Currents Lab
 Deep Water Currents Lab Background: Anyone visiting the seashore is struck by the constant motion of water traveling on the surface of the ocean in the form of waves. But beneath the ocean's surface, water
Density-Driven Currents
 Density-Driven Currents Objective To demonstrate density differences that exist in open ocean and coastal water masses, and how these differences drive currents. Correlations National Science Education
OCEANOGRAPHY STUDY GUIDE
 OCEANOGRAPHY STUDY GUIDE Chapter 2 Section 1 1. Most abundant salt in ocean. Sodium chloride; NaCl 2. Amount of Earth covered by Water 71% 3. Four oceans: What are they? Atlantic, Pacific, Arctic, Indian
Name Class Date. Use the terms from the following list to complete the sentences below. Each term may be used only once. Some terms may not be used.
 Assessment Chapter Test B The Movement of Ocean Water USING KEY TERMS Use the terms from the following list to complete the sentences below. Each term may be used only once. Some terms may not be used.
1 Currents. TAKE A LOOK 2. Read a Map In what direction does the Gulf Stream flow?
 CHAPTER 5 1 Currents SECTION The Movement of Ocean Water BEFORE YOU READ After you read this section, you should be able to answer these questions: What factors affect ocean currents? Why are ocean currents
Lesson: Ocean Circulation
 Lesson: Ocean Circulation By Keith Meldahl Corresponding to Chapter 9: Ocean Circulation As this figure shows, there is a connection between the prevailing easterly and westerly winds (discussed in Chapter
Chapter 22, Section 1 - Ocean Currents. Section Objectives
 Chapter 22, Section 1 - Ocean Currents Section Objectives Intro Surface Currents Factors Affecting Ocean Currents Global Wind Belts (you should draw and label a diagram of the global wind belts) The Coriolis
The Movement of Ocean Water. Currents
 The Movement of Ocean Water Currents Ocean Current movement of ocean water that follows a regular pattern influenced by: weather Earth s rotation position of continents Surface current horizontal movement
The density of a substance is the same for all samples of that substance.
 8.8.a Density and Buoyancy Students know density is mass per unit volume. P71 Wood Steel The density of a substance is the same for all samples of that substance. 1. The two blocks shown have the same
9.3. Storing Thermal Energy. Transferring Thermal Energy
 9.3 If you have been to a beach on a hot summer day, you have likely cooled off by going for a dip in the water. The water, which is cooler than you are, removes thermal energy from your body, making you
Directed Reading. Section: Ocean Currents. a(n). FACTORS THAT AFFECT SURFACE CURRENTS
. FACTORS THAT AFFECT SURFACE CURRENTS") Skills Worksheet Directed Reading Section: Ocean Currents 1. A horizontal movement of water in a well-defined pattern is called a(n). 2. What are two ways that oceanographers identify ocean currents? 3.
Skills Worksheet Directed Reading Section: Ocean Currents 1. A horizontal movement of water in a well-defined pattern is called a(n). 2. What are two ways that oceanographers identify ocean currents? 3.
What is an ocean current? 1. wind action: the force of the wind blowing over the top of the water 2. spin of Earth 3. shape of the continents
 Ocean Currents Textbook pages 414 427 Before You Read Section 11.2 Summary What forces do you think cause ocean water to move? Do you think ocean water moves the same way everywhere in the ocean? Write
OCN-201 Chemistry and Physics section
 Name: Class: _ Date: _ OCN-201 Chemistry and Physics section True/False Indicate whether the statement is true or false. 1. Because of the dissolved salt in seawater its freezing point is lower than that
Ocean Current Worksheet
 Ocean Current Worksheet Temperature Affects and Surface Currents: Surface waters of the Earth s oceans are forced to move, primarily by winds. Where winds blow in the same direction for a long period of
170 points. 38 points In your textbook, read about modern oceanography. For each item write the word that meets the description.
 Ch 15 Earth s Oceans SECTION 15.1 An Overview of Oceans 38 points In your textbook, read about modern oceanography. For each item write the word that meets the description. (5 points) 1. German research
The ocean water is dynamic. Its physical
 CHAPTER MOVEMENTS OF OCEAN WATER The ocean water is dynamic. Its physical characteristics like temperature, salinity, density and the external forces like of the sun, moon and the winds influence the movement
Duckies have been found in Hawaii, Alaska, S. America, Scotland, Washington state and Australia as of 2012.
 Duckies have been found in Hawaii, Alaska, S. America, Scotland, Washington state and Australia as of 2012. We learned that it takes 3 years to complete one circuit of the North Pacific Gyre flow in the
Water on Earth. How do oceans relate to weather and the atmosphere? Solar Radiation and Convection Currents
 Earth is often called the Blue Planet because so much of its surface (about 71%) is covered by water. Of all the water on Earth, about 96.5% is held in the world s oceans. As you can imagine, these oceans
Glossary Published on LEARNZ (
 buoyant/bouyancy Able to float or rise to the surface of a liquid. calibrate to check the accuracy of something compared to a known standard (you can calibrate a water thermometer by putting it in boiling
Chapter. The Dynamic Ocean
 Chapter The Dynamic Ocean An ocean current is the mass of ocean water that flows from one place to another. 16.1 The Composition of Seawater Surface Circulation Surface Currents Surface currents are movements
Name: OBJECTIVES: By the end of today s lesson, you will be able to
 7 th Grade Science Unit: Water s Cycles and Patterns Lesson: WCP 21 Name: Date: Monday, October 3, 2016 Homeroom: _ OBJECTIVES: By the end of today s lesson, you will be able to SWBAT Explain how currents
Ocean Motion Notes. Chapter 13 & 14
 Ocean Motion Notes Chapter 13 & 14 What is a Wave? Wave: movement of energy through a body of water How are Waves Caused? Caused mostly by wind Wind blowing on the water transmits energy to the water Size
Investigation 11.4 Global Ocean Currents
 Name: Date: Investigation Answer Sheet Investigation 11.4 Global Ocean Currents How do temperature and salinity cause ocean layering? Did you know that there are rives in the ocean? In some places, there
OCN 201 Lab Fall 2009 OCN 201. Lab 9 - El Niño
 OCN 201 Lab Fall 2009 OCN 201 Lab 9 - El Niño El Niño is probably one of the most widely publicized oceanic phenomena. If there s one single reason for that it s probably the fact that El Niño s presence
SIXTH GRADE OCEANS 1 WEEK LESSON PLANS AND ACTIVITIES
 SIXTH GRADE OCEANS 1 WEEK LESSON PLANS AND ACTIVITIES WATER CYCLE OVERVIEW OF SIXTH GRADE WATER WEEK 1. PRE: Evaluating components of the water cycle. LAB: Experimenting with porosity and permeability.
Section 6. The Surface Circulation of the Ocean. What Do You See? Think About It. Investigate. Learning Outcomes
 Chapter 5 Winds, Oceans, Weather, and Climate Section 6 The Surface Circulation of the Ocean What Do You See? Learning Outcomes In this section, you will Understand the general paths of surface ocean currents.
The Composition of Seawater
 The Composition of Seawater Salinity Salinity is the total amount of solid material dissolved in water. Most of the salt in seawater is sodium chloride, common table salt. Element Percent Element Percent
Assessment Schedule 2016 Earth and Space Science: Demonstrate understanding of processes in the ocean system (91413)
") NCEA Level 3 Earth & Space Science (91413) 2016 page 1 of 6 Assessment Schedule 2016 Earth and Space Science: Demonstrate processes in the ocean system (91413) Evidence Statement Q Evidence with with Excellence
NCEA Level 3 Earth & Space Science (91413) 2016 page 1 of 6 Assessment Schedule 2016 Earth and Space Science: Demonstrate processes in the ocean system (91413) Evidence Statement Q Evidence with with Excellence
For Class Today How does ocean water circulate? Ocean currents, surface currents, gyres, currents & climate, upwelling, deep ocean circulation
 For Class Today Modified Cornell Notes on section 16.1 (pg. 448-453) **Follow the guide in your ISN and previous notes for help** Heading: How does ocean water circulate? Left hand side categories: Ocean
Lecture 13 El Niño/La Niña Ocean-Atmosphere Interaction. Idealized 3-Cell Model of Wind Patterns on a Rotating Earth. Previous Lecture!
 Lecture 13 El Niño/La Niña Ocean-Atmosphere Interaction Previous Lecture! Global Winds General Circulation of winds at the surface and aloft Polar Jet Stream Subtropical Jet Stream Monsoons 1 2 Radiation
What Causes Weather Patterns?
 What Causes Weather Patterns? INVESTlGATlON: Water on the Move If you ve ever been soaked in a rainstorm or even surprised by a thundershower in the desert, you know that water is a big part of the weather.
Introduction to Physical Oceanography STUDENT NOTES Date: 1. What do you know about solar radiation at different parts of the world?
 Introduction to Physical Oceanography STUDENT NOTES Date: 1 Warm up What do you know about solar radiation at different parts of the world? What affect does the tilt of the Earth have on the northern and
Ocean Inter-annual Variability: El Niño and La Niña. How does El Niño influence the oceans and climate patterns?
 Name: Date: Guiding Question: Ocean Inter-annual Variability: El Niño and La Niña How does El Niño influence the oceans and climate patterns? Introduction What is El Niño/La Niña? The El Niño/La Niña cycle
Ocean Currents that Redistribute Heat Globally
 Ocean Currents that Redistribute Heat Globally Ocean Circulation Ocean Currents Fig. CO7 OCEAN CURRENTS Surface ocean currents are similar to wind patterns: 1. Driven by Coriolis forces 2. Driven by winds
Introduction to Oceanography OCE 1001
 Introduction to Oceanography OCE 1001 Lecture Notes Chantale Bégin & Jessica Fry Version 2.1 10. Ocean Circulation (Trujillo, Chapter 7) Major ocean currents are stable and predictable; they have been
Station 1: Solar Radiation on Earth
 Station 1: Solar Radiation on Earth Activity Procedures 1. Choose one person to be the Sun. 2. Standing an arm s length away from the globe, have the Sun classmate hold the flashlight level with the equator,
GRADE 6: Materials 1. UNIT 6M.1 7 hours. Solubility. Resources. About this unit. Previous learning. Expectations. Key vocabulary and technical terms
 GRADE 6: Materials 1 Solubility UNIT 6M.1 7 hours About this unit This is the first of four units on materials in Grade 6. This unit builds on the study of the properties of water in Unit 5M.1. Unit 7M.1
Quiz name: Oceanography - Land and Sea Interaction - Quiz #2
 Name: Quiz name: Oceanography - Land and Sea Interaction - Quiz #2 ate: 1. What is the direction of spin for gyres in the northern hemisphere? clockwise counter clockwise northern oscillation southern
Ocean Motion. Ocean Currents. Before You Read. Read to Learn
 chapter 18 3 Ocean Motion section 2 Ocean Currents What You ll Learn the Coriolis effect what influences surface currents the temperature of coastal waters about density currents Before You Read Imagine
Earth s oceans covers 71 % _ of the planet s surface. In reality, Earth s ocean waters are all. interconnected as part of a single large global ocean.
 Ocean Motion Met 101: Introduction to the World's Oceans Produced by The COMET Program Geography: Name Pd. Earth s oceans covers 71 % _ of the planet s surface. In reality, Earth s ocean waters are all
Write answers on your own paper. A. the Sun B. the Moon C. Earth s gravity D. Earth s rotation
 The tmosphere Write answers on your own paper 1. What is the primary energy source that drives all weather events, including precipitation, hurricanes, and tornados?. the Sun. the Moon C. Earth s gravity
OCN 201, Chemistry & Physics Section
 , A 1-April-2015 Name: Answer the True/False and Multiple Choice questions on the scantron sheet. Answer the remaining questions on this exam handout. Turn in both the scantron and exam at the end of class.
Underwater Volcano Authors: Christian Bertsch, University of Vienna years
 9-11 years Science Content: Physics Target Concepts/Skills: Density of solids and fluids Target Age group: 9-11 years Duration of activity: 3 hours Summary: Students inquire the concept of floating and
HYDROSPHERE, OCEANS AND TIDES
 HYDROSPHERE, OCEANS AND TIDES Revision 10x10learning.com 1 Chapter 12. In the Earth s Atmosphere On surface of the Earth Under the ground Hydrosphere comprises of ALL WATER Water Vapour = 0.001% Is very
Unit 11 Lesson 2 How Does Ocean Water Move? Copyright Houghton Mifflin Harcourt Publishing Company
 Unit 11 Lesson 2 How Does Ocean Water Move? Catch a Wave A wave is the up-and-down movement of surface water. Catch a Wave Catch a Wave (wave effects) Surface waves are caused by wind pushing against
CHAPTER 7 Ocean Circulation
 1 2 3 4 5 6 7 8 9 10 11 12 13 14 CHAPTER 7 Ocean Circulation Words Ocean currents Moving seawater Surface ocean currents Transfer heat from warmer to cooler areas Similar to pattern of major wind belts
Build your own weather station
 Build your own weather station Subject areas: Science, technology, maths, engineering Duration: ongoing Class: senior classes - primary school Objective: Enable the students to design and construct a rain
and the Link between Oceans, Atmosphere, and Weather
 Geography Worksheet Instructions Using a map, atlas, or any other materials your teacher suggests, label the following on the blank map provided. 1. Label East, West, North, and South. 2. Label the following
Pacific Climate Variability
 Pacific Climate Variability Pacific Islands Climate Education Partnership You may have heard the term climate variability. What does the term climate variability mean? What are the causes and effects of
Greenhouse Effect Activity
 Greenhouse Effect Activity Objectives: The student will: 1. Read and use weather instruments. 2. Collect and record temperature readings. 3. Describe the concept of the greenhouse effect. Materials: Fish
Meteorology I Pre test for the Second Examination
 Meteorology I Pre test for the Second Examination MULTIPLE CHOICE 1. A primary reason why land areas warm up more rapidly than water areas is that a) on land, all solar energy is absorbed in a shallow
El Niño Unit (2.5 pts)
") T. James Noyes, El Camino College El Niño Unit (Topic 9B) page 1 Name: Section: El Niño Unit (2.5 pts) El Niño is a warm ocean current that flows along the Equator and towards the west coast of South America
T. James Noyes, El Camino College El Niño Unit (Topic 9B) page 1 Name: Section: El Niño Unit (2.5 pts) El Niño is a warm ocean current that flows along the Equator and towards the west coast of South America
ATMOSPHERIC CIRCULATION
 Name ATMOSPHERIC CIRCULATION (adapted from Dr. S. Postawko, U. of Ok.) INTRODUCTION Why does the wind blow? Why do weather systems in the mid-latitudes typically move from west to east? Now that we've
EARTH, PLANETARY, & SPACE SCIENCES 15 INTRODUCTION TO OCEANOGRAPHY. LABORATORY SESSION #6 Fall Ocean Circulation
 EARTH, PLANETARY, & SPACE SCIENCES 15 INTRODUCTION TO OCEANOGRAPHY LABORATORY SESSION #6 Fall 2017 Ocean Circulation The focus of the Lab this week is circulation of the ocean and atmosphere. Here, you
Lecture 5.1 Surface Ocean Circulation. Image from Daily Mail Newspaper, UK
 Lecture 5.1 Surface Ocean Circulation Image from Daily Mail Newspaper, UK Announcements Midterm is Thursday, consists of 25 multiple choice, 3 pages short answer questions No Scantron needed Calculators,
Ocean Layers. Based on sunlight penetration: Based on water density: Sunlight (photosynthesis is possible) Twilight Midnight
 Twilight Midnight") PART 3 Ocean Layers Based on sunlight penetration: Sunlight (photosynthesis is possible) Twilight Midnight Based on water density: Mixed layer Pycnocline (rapid change of themperature/salinity) Deep ocean
PART 3 Ocean Layers Based on sunlight penetration: Sunlight (photosynthesis is possible) Twilight Midnight Based on water density: Mixed layer Pycnocline (rapid change of themperature/salinity) Deep ocean
El Nino and Global Warming
 El Nino and Global Warming El Niño and Global Warming El Niño Climate Trade winds Barometric pressure Southern oscillation WHAT YOU WILL LEARN 1. You will identify the cause of El Niño events. 2. You will
Chapter: Atmosphere Section 3: Air Movement
 Table of Contents Chapter: Atmosphere Section 3: Air Movement We will learn about: -Air Movement=Wind -Why different latitudes on Earth will receive different amounts of Solar Energy -The Coriolis Effect
Overview of Density Worksheet
 Name Key formulas/concepts: Overview of Density Worksheet Density Density = Mass divided by Volume (D = M/V). The mass of an object is 25 grams. The volume of an object is 5 cm 3. D = 25g/5cm 3 = 5 g/cm
Winds and Ocean Circulations
 Winds and Ocean Circulations AT 351 Lab 5 February 20, 2008 Sea Surface Temperatures 1 Temperature Structure of the Ocean Ocean Currents 2 What causes ocean circulation? The direction of most ocean currents
We can tell that diameter of the tube influence the pressure of the water at the bottom.
 IDS 102 Pressure Part II You may have found that there is a slight difference in the distance of the two streams, but this is due to frictional forces between the water and the tube, not the different
Fun Physics Workshop
 Name: University of Cape Town Department of Physics Fun Physics Workshop Equipment checklist. Each group should get the following: 2 tins, saucer, beaker, straws, 2 balloons, tube, wooden balance, 2 weights,
Name Date L.O: SWBAT explain what breezes, planetary winds, ocean currents & monsoons are.
 Name Date L.O: SWBAT explain what breezes, planetary winds, ocean currents & monsoons are. 1. A cool breeze is blowing toward the land from the ocean on a warm, cloudless summer day. This condition is
Page 1
 Contents: 1. Thrust and Pressure 2. Pressure in Fluids 3. Buoyancy 4. Why objects sink or Float when placed on surface of water? 5. Archimedes Principle 6. Relative Density Learning Objectives: The students
Ocean Circulation, Food Webs and Climate What does the wind have to do with feeding fish (and feeding us)?
?") Ocean Circulation, Food Webs and Climate What does the wind have to do with feeding fish (and feeding us)? El Niño: Tropical Oceans and Global Climate Reading: 9.10-9.13, 9.15 Graphic: Upwelling off Cape
Ocean Circulation, Food Webs and Climate What does the wind have to do with feeding fish (and feeding us)? El Niño: Tropical Oceans and Global Climate Reading: 9.10-9.13, 9.15 Graphic: Upwelling off Cape
LAB 7. ROTATION. 7.1 Problem. 7.2 Equipment. 7.3 Activities
 LAB 7. ROTATION 7.1 Problem How are quantities of rotational motion defined? What sort of influence changes an object s rotation? How do the quantities of rotational motion operate? 7.2 Equipment plumb
Beach Profiles: Monitoring Sea Level Rise. Student Activity Sheet. Name Date Class
 Beach Profiles: Monitoring Sea Level Rise Student Activity Sheet Name Date Class A shoreline is the area where the water and land meet. This is where we find beach: areas where sediments (sand or other
Scuba Divers Science Performance Task Grades 5-8 Name: Scuba Divers
 Name: Scuba Divers Two identical twins named Jill and Rachel were planning separate trips to go scuba diving. Jill planned to scuba dive in the ocean off the coast of Maine and Rachel planned to scuba
Write about this. Have you ever experienced a very strong wind gust? What happened? Have you ever felt a gentle breeze? What did it feel like?
 Write about this. Have you ever experienced a very strong wind gust? What happened? Have you ever felt a gentle breeze? What did it feel like? How wind works Winds flow on earth based on differences in
Air Pressure and Wind
 Air Pressure and Wind 19.1 Understanding Air Pressure Air Pressure Defined Air pressure is the pressure exerted by the weight of air. Air pressure is exerted in all directions down, up, and sideways. The
MiSP Solubility L2 Teacher Guide. Introduction
 MiSP Solubility L2 Teacher Guide Introduction In this unit students will learn about solubility. Students should already be familiar with the basic chemistry concepts. They should know that some substances
The Causes of Ocean Circulation
 Activity 1 The Causes of Ocean Circulation Goals In this activity you will: Understand the effect of the wind on the movement of water at the ocean surface. Understand the effect of the Coriolis force
Prevailing Winds. The Coriolis Effect
 Prevailing Winds 1. Wind: a movement of air in the atmosphere. Bill Nye wind (2 minutes) 2. Local or regional wind: occur in fairly small areas. 3. Prevailing winds: Major wind pattern that affect large
Which factor: temperature or salinity do you think will play a bigger role in determining the speed of the solution?
 Accel Keeping Current Name: Purpose: To examine the role of density in currents. Hypothesis Which will make a fast flowing current? You will test the ability of four solutions to travel through tap water.
NAME BLOCK Density Lab PROBLEM: How can we determine the densities of different substances?
 NAME BLOCK Density Lab PROBLEM: How can we determine the densities of different substances? PART 1 Determining relative density procedure 1. Designate an eyedropper for each beaker. Do not mix them up
Chapter. Air Pressure and Wind
 Chapter Air Pressure and Wind 19.1 Understanding Air Pressure Air Pressure Defined Air pressure is the pressure exerted by the weight of air. 19.1 Understanding Air Pressure Air Pressure Defined Air pressure
Schooner Adventure Water and Energy
 Schooner Adventure Water and Energy Harnessing Energy from the Ocean: Investigating Ocean Wind and Water Currents I. What Causes Wind and Wind Currents? How Winds Are Made Investigate movement of warm
Chapter: Atmosphere Section 3: Air Movement
 Table of Contents Chapter: Atmosphere Section 3: Air Movement We will learn about Air Movement=Wind -Why different latitudes on Earth will receive different amounts of Solar Energy -The Coriolis Effect
Fluid Circulation (Student Mastery Objectives) -The most frequent type of heat transfer of energy in the atmosphere is convection.
 -The most frequent type of heat transfer of energy in the atmosphere is convection.") Fluid Circulation (Student Mastery Objectives) -The most frequent type of heat transfer of energy in the atmosphere is convection. -Differences in density affect the circulation of fluids. Cold air is
Fluid Circulation (Student Mastery Objectives) -The most frequent type of heat transfer of energy in the atmosphere is convection. -Differences in density affect the circulation of fluids. Cold air is
OCN201 Spring14 1. Name: Class: Date: True/False Indicate whether the statement is true or false.
 Name: Class: _ Date: _ OCN201 Spring14 1 True/False Indicate whether the statement is true or false. 1. Short residence time elements are uniformly distributed in the oceans 2. Thermohaline circulation
ESS15 Lecture 12. Review, tropical oceans & El Nino, and the thermohaline ocean circulation. Please see new reading material on website.
 ESS15 Lecture 12 Review, tropical oceans & El Nino, and the thermohaline ocean circulation. Please see new reading material on website. Review. I-clicker exercise: In this graph of Earth s energy imbalances
SCIENCE Research how living things rely on carbon dioxide, study the greenhouse effect, research carbon dating
 Dry Ice! Brief description This is a WOW lesson your students will never forget! The demonstrations provided are safe, fun, amazing, thought provoking and loud. Use them to discuss the states of matter,
ConcepTest PowerPoints
 ConcepTest PowerPoints Chapter 10 Physics: Principles with Applications, 6 th edition Giancoli 2005 Pearson Prentice Hall This work is protected by United States copyright laws and is provided solely for
Name: Class: Date: Multiple Choice Identify the choice that best completes the statement or answers the question.
 Name: Class: _ Date: _ Ch. 9 Climate Test Multiple Choice Identify the choice that best completes the statement or answers the question. 1. The average, year-after-year conditions of temperature, precipitation,
. In an elevator accelerating upward (A) both the elevator accelerating upward (B) the first is equations are valid
 both the elevator accelerating upward (B) the first is equations are valid") IIT JEE Achiever 2014 Ist Year Physics-2: Worksheet-1 Date: 2014-06-26 Hydrostatics 1. A liquid can easily change its shape but a solid cannot because (A) the density of a liquid is smaller than that of
IIT JEE Achiever 2014 Ist Year Physics-2: Worksheet-1 Date: 2014-06-26 Hydrostatics 1. A liquid can easily change its shape but a solid cannot because (A) the density of a liquid is smaller than that of
Your web browser (Safari 7) is out of date. For more security, comfort and the best experience on this site: Update your browser Ignore
 is out of date. For more security, comfort and the best experience on this site: Update your browser Ignore") Your web browser (Safari 7) is out of date. For more security, comfort and the best experience on this site: Update your browser Ignore L A NIÑA El Niño-Southern Oscillation (ENSO) For the complete encyclopedic
Your web browser (Safari 7) is out of date. For more security, comfort and the best experience on this site: Update your browser Ignore L A NIÑA El Niño-Southern Oscillation (ENSO) For the complete encyclopedic
Wednesday, September 27, 2017 Test Monday, about half-way through grading. No D2L Assessment this week, watch for one next week
 Wednesday, September 27, 2017 Test Monday, about half-way through grading No D2L Assessment this week, watch for one next week Homework 3 Climate Variability (due Monday, October 9) Quick comment on Coriolis
What Causes Wind? Exploration: How Does Air Move When Pressure Builds Up? 4.2 Explore. Predict
 4.2 Explore What Causes Wind? In Learning Set 1, you built an anemometer. You used it to measure wind speed and direction in your community. In the last section, you read about how wind and ocean currents
El Niño Lecture Notes
 El Niño Lecture Notes There is a huge link between the atmosphere & ocean. The oceans influence the atmosphere to affect climate, but the atmosphere also influences the ocean, which can also affect climate.
Chapter 1, Lesson 5: Air, It s Really There
 Chapter 1, Lesson 5: Air, It s Really There Key Concepts In a gas, the particles (atoms and molecules) have weak attractions for one another. They are able to move freely past each other with little interaction
Current: large mass of continuously moving ocean water
 Ocean Currents Current: large mass of continuously moving ocean water Surface Currents--Wind Circulation These waters make up about 10% of all the water in the ocean. These waters are the upper 400 meters
Students will use two different methods to determine the densities of a variety of materials and objects.
 Activity #1: Determining Densities Summary The concept of density has many useful applications. This image is an electron density map, used by biochemists to help understand the structure of a protein.
Name Date Class. Overview Oceans. Directions: Use the following terms to complete the concept map below. wind salts climate gases.
 Directed Reading for Content Mastery Overview Oceans Directions: Use the following terms to complete the concept map below. wind salts climate gases densitytides nekton Seawater contains dissolved 1. and
Equatorial upwelling. Example of regional winds of small scale
 Example of regional winds of small scale Sea and land breezes Note on Fig. 8.11. Shows the case for southern hemisphere! Coastal upwelling and downwelling. Upwelling is caused by along shore winds, that
GEOGRAPHY - STD 8 [ ] Q1.
![GEOGRAPHY - STD 8 [ ] Q1.](/thumbs/84/90631870.jpg "GEOGRAPHY - STD 8 [ ] Q1.") GEOGRAPHY - STD 8 Movements of Oceans [2016-2017] Q1. Name the two types of regular movements in the oceans. Ans. The regular movements in the ocean are of two types: 1. Horizontal Ocean currents 2. Vertical
GEOGRAPHY - STD 8 Movements of Oceans [2016-2017] Q1. Name the two types of regular movements in the oceans. Ans. The regular movements in the ocean are of two types: 1. Horizontal Ocean currents 2. Vertical
Lecture Outlines PowerPoint. Chapter 18 Earth Science 11e Tarbuck/Lutgens
 Lecture Outlines PowerPoint Chapter 18 Earth Science 11e Tarbuck/Lutgens 2006 Pearson Prentice Hall This work is protected by United States copyright laws and is provided solely for the use of instructors
Aim. Materials. Methods. What Happens. Explorer Education Programme
 Aim To examine how the differences in water movement between salt water and freshwater and how they interact with each other. Students completing the worksheets will also develop writing and literacy skills.
Wind Movement and Global and Local Winds
 Wind Movement and Global and Local Winds In previous lessons, you learned that the uneven heating of Earth s surface by the Sun causes some areas to be warmer than others. This uneven heating of land forms
In the liquid phase, molecules can flow freely from position. another. A liquid takes the shape of its container. 19.
 In the liquid phase, molecules can flow freely from position to position by sliding over one another. A liquid takes the shape of its container. In the liquid phase, molecules can flow freely from position
In the liquid phase, molecules can flow freely from position to position by sliding over one another. A liquid takes the shape of its container.
 In the liquid phase, molecules can flow freely from position to position by sliding over one another. A liquid takes the shape of its container. In the liquid phase, molecules can flow freely from position