Large Eddy Simulation of Wing Tip Vortex in the Near Field
|
|
|
- Penelope Booker
- 6 years ago
- Views:
Transcription

1 Large Eddy Simulation of Wing Tip Vortex in the Near Field Li Jiang Jiangang Cai Chaoqun Liu Technical Report
2 Large Eddy Simulation of Wing Tip Vortex in the Near Field Li Jiang Jiangang Cai Chaoqun Liu Department of Mathematics, University of Texas at Arlington, Arlington, Texas September 2007 Abstract Large eddy simulation with filtered-structure-function subgrid model and implicit large eddy simulation (ILES without explicit subgrid model) using high-order accuracy and high resolution compact scheme have been performed on the tip vortex shedding from a rectangular half-wing with a NACA 0012 airfoil section and a rounded wing tip. The formation of the tip vortex and its initial development in the boundary layer and the near field wake are investigated and analyzed in detail. The physics, why the tip vortex, which is originally turbulent in the boundary layer, is re-laminarized and becomes stable and laminar rapidly after shedding in the near field, is revealed by this simulation. The computation also shows the widely used second order subgrid model is not consistent to six-order compact scheme and would degenerate the six-order LES results to second order. Therefore, high order schemes, gird refinement and six order subgrid models are critical to LES approaches. 1. Introduction Tip vortices are generated at the tip of lifting surfaces where fluid flows from the high-pressure side to the low-pressure side. Tip vortices have significant effects on many practical engineering problems. Wing tip vortices can result in a decrease in lift and an increase in drag. Trailing vortices generated at the wing tip can affect the landing separation distances for aircraft. The propeller tip-vortex cavitation on a submerged submarine can cause the serious noise problem. The blade/vortex interaction on helicopter blades can impact the blades performances and cause undesirable noise and vibration. The study of tip vortices is not only of great engineering importance but also of great scientific interest and challenge. Tip vortex flow is a very complicated flow. The tip vortex system originated from the complex three-dimensional separated flow is highly unsteady and turbulent. The interactions between the primary and the secondary vortices, the vortices and the separated shear layer, and that between the system of vortices and the wakes occur simultaneously in the flow field. Many experimental and numerical investigations of tip vortex dynamics have been conducted in the past decades. Since noise radiation from flap side edges is known to be a major component of non-propulsive, i.e., airframe-generated noise, a lot of efforts have been made under NASA s Advanced Subsonic Technology Program (Macaraeg, 1998). Khorrami (Khorrami et al, 1999) analyzed five possible sources which cause the flow unsteadiness and then serious noises: 1) large-scale flow fluctuation supported by the free-shear layer emanating from the flap bottom edge and spanning the entire flap chord, 2) large-scale flow fluctuations supported by the post-
3 merged vortex downstream of the mid-chord region, 3) convection of a turbulent boundary layer over the sharp edges at the flap side edge, giving rise to scattering and broadband sound radiation, 4) vortex merging, and 5) vortex breakdown. They believe the first two are most likely to be responsible for the bulk of the concentrated audible noise generation. A linear analysis of the shear layer instability has been made showing good agreement, in frequencies of the maximally amplified disturbance, with the directional, microphone array measurements performed in the QFF at NASA Langley Research Center. Further efforts to reduce the tip-vortex generated noise have been made by using a side-edge fence (Sloff et al, 2002) and porous flap-tip treatment (Chow et al, 2002). Choudhari (Choudhari et al, 2003) applied RANS code, CFL3D, with a porous flap tip model to successfully simulate the time average improvement. The simulation showed that flow communication via distributed leakage across the treatment surface leads to reduced flap loading near the side edge. The reduced flap loading results in a reduced severity of shear layer rollup adjacent to the side edge, a modified interaction between the side and top-edge vortices, and significantly weaker (more diffuse) vortex structures over the aft-chord region. The vortex structures are also slightly farther away from the side edge compared with the untreated case. Finally, the breakdown of the side edge vortex at higher flap deflections can also be eliminated by the porous treatment. However, their approach is the time averaged RANS. In order to get a deeper understanding of the physics, LES is necessary to be used to capture the flow details. The physical behavior of a trailing vortex in the far filed downstream of the lifting body has been of the primary interest. By comparison, the evolution of tip vortices within a few chord lengths downstream of the wing trailing edge receives much less attention. In fact, the initial rollup of the wing tip vortex shows a more complex behavior. Better understanding of the formation, structure, strength and the initial development of the wing tip vortices may provide the guide for the tip vortex control. The present work is focused on the generation and the near field development of a wing tip vortex. In the experiment conducted by Chow et al (Chow et al 1997) on the rectangular half-wing model at a Reynolds number based on chord of 4.6x10 6, the flow was found to be turbulent in the near field. However, the turbulence decayed quickly with streamwise distance. This was considered to be the result of the stabilizing effect of the nearly solid body rotation of the vortex-core mean flow. It was also found that the Reynolds shear stresses are not aligned with the mean strain rate, indicating that an isotropic-eddy-viscositybased prediction method which is used by most RANS and subgrid model can not fully model the turbulence in the vortex. Based on this experiment, Dacles-Mariani et al (Dacles-Mariani, et al, 1996) conducted the numerical simulations of the wingtip vortex flow in the near field region. The method of artificial compressibility was used to solve the three-dimensional incompressible Navier-Stokes equations. The convective and pressure terms are evaluated using fifth-order accurate flux-difference splitting based on Roe s method. Their results showed good agreement with the experiment data outside of the viscous vortex core. It was also found that the Baldwin- Barth and the Spalart-Allmaras one equation turbulence models can not accurately predict tip vortex. An ad-hoc modification of the production term was needed. It was thought that the underprediction of the flow quantities in the core region was caused by turbulence modeling errors. Fleig and Arakawa (Fleig and Arakawa 2003) performed simulations of tip vortex generated by a finite blade with NACA0012 section at Reynolds numbers of 4.06x10 5 and 1.2x10 6. Smagorinsky eddy viscosity model and up to 300 million grid points were used in the simulations. The solver is based on the second-order Beam-Warming approach and a third-order
4 finite-difference upwind scheme for spatial derivatives. Complex flow features associated with the tip vortex were compared with experimental measurements for the lower Reynolds number cases. It was found that the tip vortex constitutes a major noise source. Youssef et al (Youssef et al 1997) conducted the temporal large-eddy simulation to study the development of large scale structures in the wake and their interaction with the tip vortex. A model was derived to provide an approximate velocity field in a vertical plane immediately after the trailing edge of a rectangular wing. This velocity field was used as the initial condition for the temporal largeeddy simulations. A modified MacCormack scheme which is explicit second order in time and fourth order in space for the convective terms was used to solve the compressible LES equations. Smagorinsky model was used and the Reynolds number based on the chord length is 5.3x10 5. It was found that the classical sinuous mode of 2D wakes prevails in the spiral wake connecting the vortex core to the nominally 2D wake in the middle of the wing. The large scale structures of the spiral wake cause the formation of undulations on the core. In the studies by Labbe and Sagaut (Labbe and Sagaut 2003), the simulations of the evolution of the near field wake vortex behind a A300 Airbus model in high-lift configuration was carried out by solving the three-dimensional Navier-Stokes equations for an incompressible fluid with a second order accurate scheme in time and space. The Reynolds number based on the chord length is 1.5x10 5. This simulation focused on a portion of the wake. The inlet plane was located at one wingspan behind the trailing edge of the wing. The inlet boundary condition was provided by experiment data. As the turbulent motion has only negligible effects on the vertical and spanwise velocity components of wake vortices, no turbulence model was implemented. This study numerically reproduced the unsteady properties of the vortices and compared the different frequencies with those measured experimentally. The results showed that the main vortex is subject to a global motion which frequencies are in the same range as those obtained experimentally. Near field tip vortex flow is a complex turbulent flow dominated by rotation. The flow structures have large range of scales and both velocity and pressure have large gradients especially in the near field at high Reynolds numbers. The flow complexity requires that the numerical methods used to study tip vortices must have high-order accuracy and high resolution. Compact schemes have spectral-like resolution and can achieve high-order accuracy with compact stencils. Compact schemes have been widely used in the simulations of complex flows, especially in the direct numerical simulations of turbulent flows. The objective of this work is to use the LES and implicit LES with high order accuracy and high resolution to investigate the formation and the near field evolution of a wing tip vortex at high Reynolds number. The code used in this study is based on a sixth-order compact finite difference scheme (Lele, 1992). An outline of the paper is as follows. A brief introduction of the governing equations and the numerical method is given in Section 2. In Section 3, the flow configuration and computational parameters are described. Results and discussions are presented in Sections 4. Concluding remarks are given in Section Governing equations and numerical methods The governing equations solved are the conservation form of three-dimensional compressible Navier-Stokes equations in body-fitted coordinates. The LU-SGS implicit solver (Yoon, 1992) scheme based on the second-order backward Euler algorithm is used for the time advancing. Spatial derivatives are calculated using the sixth-order centered compact finite differencing (Lele, 1992) in the interior of the domain, together with fourth-order closures at points
5 immediately adjacent to the boundary and third-order closures at the boundary points. Coordinate transformation metrics are also evaluated using the same compact scheme by an approach that satisfies the geometric conservation law numerically (Gaitonde & Visbal, 1999). High order compact filtering (Lele, 1992) is used at regular intervals to suppress the numerical oscillation associated with the high-order centered compact scheme. Parallel computation based on the Message Passing Interface (MPI) is utilized to improve the performance of the code. The parallel computation is combined with the domain decomposition method. The computational domain is divided into n equal-sized subdomains along the ξ direction. Readers may refer to our early work (Shan et al., 2000) for more details of the parallel algorithm. The details of the numerical method and the numerical verification and applications of the computer code can be found in our previous work (Jiang et al., 1999a, Shan et al, 2000, Shan et al, 2005). For the large eddy simulations, the Filtered-Structure-Function LES model (Ducros, et al, 1996) is used. 3. Flow Configuration and Computational Parameters The flow configuration in this simulation is based on the wing tip experiment conducted by Chow et al (Chow, et al. 1997). The computational domain includes a rectangular half-wing with a NACA 0012 airfoil section, a rounded wing tip and the surrounding boundaries. The wing has an aspect ratio of The angle of attack is 10 degrees. The upstream boundary is three chord lengths away from the leading edge of the wing. The upper and lower boundaries are four chord lengths from the wing surface. The outflow boundary is located at 5 chord lengths downstream. The free-stream velocity U, the free-stream pressure p, the free-stream temperature T, and the chord length of the airfoil c are selected as the reference parameters for nondimensionalization. The flow conditions and grid parameters are summarized in Table 1. The Reynolds number based on the free-stream velocity and the chord length is In the simulation, the freestream Mach number is set to 0.2. The grid layout is shown in Figure 1. Axes x, y and z are along the chord-wise direction, the spanwise direction and the normal direction. ξ, η and ζ are computational coordinates. The numbers of grid points in ξ, η and ζ directions are 1024, 160 and 160, respectively. The C-type grid is produced in the (x,z) plane using the elliptic grid generation method (Spekreuse, 1995). In the spanwise direction, the grids are clustered around the wing tip. In the wall normal direction, the grids are clustered near the wing surface. The grid sizes in wall units shown in Table 1 are estimated based on a turbulent boundary layer flow with the same Reynolds number. To implement the parallel computation, the computational domain is divided evenly in ξ direction. In this simulation, 64 processors are used. Table 1. Computational parameters Re c Ma N ξ N η N ζ x + min y + min z + min
 and further developed by Jiang et al (Jiang, et")

6 Figure 1. Grid distribution Figure 2. Distribution of overlapping grids around the rounded wingtip The nonreflecting boundary conditions proposed by Poinsot and Lele (Poinsot & Lele, 1992) and further developed by Jiang et al (Jiang, et al, 1999) for curvilinear coordinates are imposed at the upstream, far field and outflow boundaries. Due to the subsonic nature of the flow, the uniform free-stream velocities and temperature are prescribed at the upstream boundary, while the density is determined by the nonreflecting boundary conditions. This upstream boundary condition is different from that used in the simulation conducted by Dacles-Mariani ( Dacles- Mariani, et al 1996), in which the inflow velocity profiles are prescribed using experimental values. At the outflow boundary, the perfectly nonreflecting boundary condition (Jiang, et al, 1999) is used. The no-slip and the adiabatic wall boundary conditions are used on the wing surface. To avoid the effect of the low order boundary scheme, a special treatment is implemented at the boundaries around the wing tip. The grid distribution around the wing tip in y-z plane is plotted in Figure 2. The overlapping region includes five grid points in η direction. This treatment ensures the sixth-order accuracy at the tip boundaries. It is worth to mention that in the experiment (Chow, et al. 1997), the wing was mounted inside the wind tunnel and the incoming flow is turbulent. In addition, a strip of roughness elements was used to fix the transition which is caused by separations near the leading edge and ensure that the boundary layers on the suction side were turbulent and kept attached downstream of the strip. Due to the limitation the computer resources, we had to make following changes to the flow conditions: 1) in the simulation, the symmetry boundary condition is used at the wing root instead of using the solid plate wall boundary conditions; 2) The incoming flow is assumed to be a uniform free-stream flow; 3) the wing surface is smooth and no early transition is excited. We believe these changes could make the comparison between our ILES results and experiment difficult, but would not prevent the ILES results from revealing the physics of the tip vortex formation and it near filed development. 4. ILES Results and Discussions A uniform flow field is used as the initial condition for the simulation. The non-dimensional time step based on the frees-stream velocity and the wing chord length is c/u. The corresponding CFL number is 396. The non-dimensional time has reached 4.2 c/u when the

7 data is taken for analysis. It takes about 2 c/u for the flow field of the region of interest(1.5c downstream from the trailing edge) to be fully developed. 4.1 Instantaneous flow field Instantaneous data are picked at t= 3.15c/U when the flow field is fully developed. Figure 3 shows the instantaneous field of the axial vorticity. Figure 3(a) is the perspective view of the isosurface of axial vorticity, which originates from the wing tip in the form of small vortical structures and evolves into a smooth vortex tube in the further downstream wake. On the suction side of the wing, the flow near the wing tip is highly three-dimensional turbulent. Small vortical structures are clearly seen inside and around the tip vortex. Near the trailing edge, spiral wake surrounding the tip vortex is formed as the wake is skewed and laterally stretched and curved by the rotating velocity field associated with the vortex. In the further downstream region (about one chord length from the trailing edge), the wing tip vortex is stabilized, where the small vortical structures are not visible around the primary tip vortex. Figure 3(b) shows the contours of axial vorticity in a vertical plane at y=0.72 which approximately intercepts with the tip vortex core. The evolution of the vortical structures inside and around the tip vortex can be seen clearly on the plane. (b) (a) Figure 3. Instantaneous (t= 3.15c/U ) field of axial vorticity. (a) Iso-surface of vorticity component ω x =3; (b) Contours of vorticity component ω x in the x-z plane at y=0.72 The distributions of the y- and z- components of the vorticity are plotted in Figure 4 and Figure 5 respectively. In Figure 4(a), the iso-surfaces of positive and negative y- component vorticity are parallel to each other in a vertical layout, and both extend along the axis of the wing tip vortex in the wake, representing a typical spiral motion of velocity field. Similar observation can be found in Figure 5(a), where the iso-surfaces corresponding to the positive and the negative z- component of vorticity are parallel to each other in a horizontal layout. The evolution of the y- and z- components of the vorticity on the vertical plane at y=0.72 is shown in Figure 4(b) and Figure 5(b).
 (b) Figure 5. Instantaneous (t= 3.15c/U ) field of vorticity in z direction. (a) Iso-surface of vorticity component ω z =±3; (b) Contours of vorticity component ω z in the x-z plane at y=0.")

8 (a) (b) Figure 4. Instantaneous (t= 3.15c/U )field of spanwise vorticity. (a) Iso-surface of vorticity component ω y =±3; (b) Contours of vorticity component ω y in the x-z plane at y=0.72 (a) (b) Figure 5. Instantaneous (t= 3.15c/U ) field of vorticity in z direction. (a) Iso-surface of vorticity component ω z =±3; (b) Contours of vorticity component ω z in the x-z plane at y=0.72 Figure 6 shows the pressure contours and velocity vectors on the cross-sections at different streamwise locations. At x/c=0.90, the vortex structures are highly unsteady. The shear layer separates from the rounded wing tip and rolls up generating the primary vortex. The core area of the primary vortex is very unstable and the outer edge of the primary vortex is not smooth. Near the junction of the wing and the rounded tip, the secondary vortex is induced by the primary vortex and the secondary vortex rotates in the opposite direction of the primary vortex, while the vorticity of small vortices shedding from wing tip shear layer has the same sign as the primary vortex. At x/c=0.995, on the cross-section that is very close to the trailing edge, the center of the primary vortex moves upward away from the surface of the wing and the size of vortex core grows.
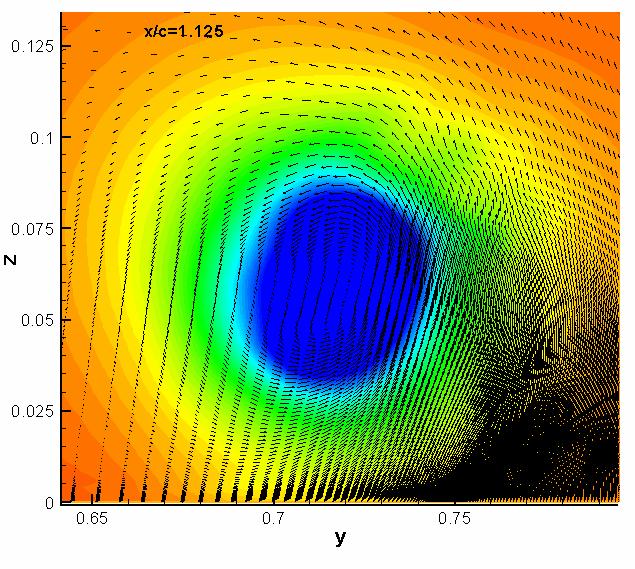
9 The secondary vortex also grows as it rolls up and merges into the primary vortex and brings unsteadiness and instability into the core of the primary vortex. The interaction between the primary and the secondary vortices is quite intensive, thus generates small vortical structures in the core area. At x/c=1.06, on the cross-section that locates at the immediate down-stream of the trailing edge, due to the absence of solid wall, there is no newly generated secondary vortices. The visible secondary vortical structures on this cross-section are actually the secondary vortices shed from the wing surface at the upstream location and convected downstream. As a matter of fact, the secondary vortex becomes weaker as they are traveling downstream, and thus introduces less disturbance to the core of the primary vortex. On this cross-section, the primary vortex is able to maintain an unbroken core all the time. Further downstream from the trailing edge of the wing, on the cross-section at x/c=1.125, the secondary vortex is barely seen because they are significantly dissipated as they are convected downstream. On the cross-sections located on the downstream of the trailing edge, the shear layer associated with the wing tip also disappears. Without the secondary vortex and the shear layer, no more disturbances are fed into the primary vortex. Therefore, the primary vortex is stabilized and is able to maintain a shape of a smooth regular circle. Sometimes, the trailing edge wake (from the lower left corner of the plot), being entrained by the primary vortex, rolls up and is entangled with the primary vortex. When this happens, the shape and the position of the vortex core are affected. As one goes to further downstream locations, the primary vortex becomes more stable. (a) (b)
 x/c=1.25; (f) x/c=1.45 Figure 7 shows the contours of the instantaneous streamwise vorticity ω x on cross-sections at different stremwise locations. At the mid-chord location x/c=0.")
 between the shear layer and the wing surface.")
10 (c) (d) (e) (f) Figure 6. Instantaneous (t= 3.15c/U ) pressure contours and velocity vectors in the cross planes at different streamwise locations (a) x/c=0.9; (b) x/c=0.995; (c) x/c=1.06; (d) x/c=1.125; (e) x/c=1.25; (f) x/c=1.45 Figure 7 shows the contours of the instantaneous streamwise vorticity ω x on cross-sections at different stremwise locations. At the mid-chord location x/c=0.606, the separated shear layer is very unstable, as some small vortical structures are continuously shedding from the shear layer and reattaching to the suction surface. At a further downstream location, the rolling up of the separated shear layer produces the primary vortex (red color) between the shear layer and the wing surface. The counter-rotating vortical structures shown in blue color is the secondary vortex. The highly unstable shear layer and the interaction between the primary and the secondary vortices serves as an external resource of disturbance that is fed into the primary vortex, which now has a very unstable area in the center of the vortex in the form of a broken core with many small vortical structures. At downstream of the trailing edge, in the absence of wall surface, without additional disturbance/energy input from the secondary vortex and shear layer, the primary vortex core becomes more stable, and small structures dissipate quickly.
 streamwise vorticity ω x in cross planes at different locations Figure 8. Contours of instantaneous (t= 3.")
11 Figure 7. Contours of instantaneous (t= 3.15c/U ) streamwise vorticity ω x in cross planes at different locations Figure 8. Contours of instantaneous (t= 3.15c/U )axial velocity in cross planes at different locations The large favorable axial pressure gradient in the core of the primary vortex accelerates the incoming fluid to produce high axial velocity. The instantaneous axial velocity can reach as high as 2U, as shown by Figure 8, which displays the contours of the instantaneous axial velocity on cross-sections at different streamwise locations. Strong axial flow occurs on cross-sections over the wing. In the further downstream of the wake, the axial velocity decays rapidly. The time history of the instantaneous velocity reveals more features of the flow field, as those in Figure 9, which shows the time history of axial velocity at the streamwise locations ranging from 0.9c to 1.452c inside the vortex core. At these two stations of x/c=0.9 and 0.99 located above the wing surface on the suction side, the signal of velocity fluctuation is highly random and has a broadband spectrum. From the trailing edge to further downstream, fluctuation amplitudes become smaller and high frequency fluctuation gradually disappear x/c= x/c= u 1 u time time x/c= x/c= u 1 u time time
12 2 1.8 x/c= x/c= u 1 u time time Figure 9. Time history of axial velocity at different streamwise locations inside the vortex core Figure 10 shows the time history of cross-flow velocity at the location inside the vortex core. In comparison with the time history of axial velocity, the evolution of the cross-flow velocity shows the same trend. The flow inside the core is highly unsteady and random with a broadband spectrum at x/c=0.9 and At further downstream locations in the wake region, the cross-flow velocity fluctuations have much lower frequency and smaller amplitude. This result indicates that the flow inside the vortex core is becoming more stable and re-laminarized while traveling downstream. 1 x/c=0.9 1 x/c= (v 2 +w 2 ) (1/2) (v 2 +w 2 ) (1/2) time time 1 x/c= x/c= (v 2 +w 2 ) (1/2) (v 2 +w 2 ) (1/2) time time 1 x/c= x/c= (v 2 +w 2 ) (1/2) (v 2 +w 2 ) (1/2) time time Figure 10. Time history of cross-flow velocity magnitude (v2+w2)1/2 at different streamwise locations inside the vortex core

13 4.2 Mean flow field The mean flow field is obtained from a time-averaging process. Time averaging is take from t= 2c/U to t= 4.2c/U Figure 11 shows contours of the time averaged axial vorticity in cross planes at different streamwise locations. The location and the size of the primary vortex core can be seen clearly. Over the wing surface, the time averaged vortex core is deformed and stretched with an irregular edge. In the contrast, the shape of the vortex core becomes more regular in the wake region, and becomes even more circular in the further downstream area. Figure 11. Contours of mean axial vorticity in cross planes at different locations Figure 12. Distribution of axial vorticity along a horizontal line through vortex core In Figure 12, the time averaged profiles of the axial vorticity along a horizontal centerline at different streamwise locations clearly show the negative value of vorticity near wingtip on the first five profiles, which are either located over the wing surface or close to the trailing edge, indicating the existence of the secondary vortex with an opposite direction of rotation of the primary vortex. The vorticity strength is kept at the same level in the immediate wake region. Figure 13 shows the contours of mean (time averaged) pressure on the cross-sections at different streamwise locations. On each cross-section, a region with a low mean pressure usually reflects the location of the vortex core. At x/c=0.9, the low-pressure zone is attached to the wing surface. On the downstream cross-sections, e.g., at x/c=1.06~1.452, the location of the mean vortex core corresponding to the low-pressure area moves upward and toward the symmetric plane. The pressure coefficient profiles along the center lines of the vortex core are depicted in Figure 14. The static pressure drops rapidly above the surface, but this process slows down in the wake region.


14 Figure 13. Contours of mean pressure in crosssections at different streamwise locations Figure 14. Distribution of pressure coefficient along a horizontal line through vortex core The distribution of pressure in the core area of the primary vortex indicates the favorable axial pressure gradient, which accelerates the axial velocity and produce the axial velocity surplus. Figure 15 shows the contours of the mean axial velocity on cross-sections at different streamwise locations. The time averaged axial velocity can reach as high as 1.2U near the trailing edge. Downstream of the trailing edge, the favorable axial pressure gradient decreases and disappears after x/c= The axial velocity surplus reduces accordingly. Figure 15. Contours of mean axial velocity on cross-sections at different streamwise locations Figure 16. Contours of mean cross-flow velocity magnitude in cross-sections at different axial locations The contours of the magnitude of mean cross-flow velocity on cross-sections at different axial locations are shown in Figure 16. On cross-sections at x/c=0.803 and 0.9, high-speed cross-flow circumvents the wing tip. On the suction side of the wing, starting from the mid-chord, both the size of the high cross-flow region and the magnitude of the cross-flow velocity increase as x increases. After the primary tip vortex and secondary vortex have established, the size of the area with low cross-flow velocity becomes smaller, surrounded by cross-flow with relatively higher
15 speed. In the further downstream of the trailing edge, there is only one area with low cross-flow velocity corresponding to vortex core. Figure 17. Distribution of velocity component in z direction along a horizontal line through vortex core The locations of the vortex core centers are depicted in Figure 18. In x-y plane, the vortex center moves inboard inclined at nearly a constant angle with respect to the x-axis. The kink near the trailing edge is thought to be caused by the trailing edge effect. In x-z plane, the trajectory angle with respect to x axis is about 11 degree which is close to the attack angle (10 degree). This indicates that, in the near wake region, the vortex axis is nearly aligned with free stream flow direction. (a) (b) Figure 18. Vortex core trajectories (a) y coordinate (b) z coordinate
16 This section shows that our ILES results still have some discrepancies from Chow s experiment. As mentioned in section 3 that there are some differences of flow conditions specified by the present simulation and the experiment, and thus we can not make quantitative comparison with experimental results by the current simulation. Since no early transition is excited in the simulation, instability waves and separations are still observed on the suction side in the rear part of the wing. These structures are thought to reduce the strength of the tip vortex. The symmetry condition at the wing root changes the load distribution on the wing surface and may also contribute to such an effect. 4.3 Turbulence Character The contours of the Root-Mean-Squared (RMS) of the axial velocity fluctuation u on crosssections at different streamwise locations are shown in Figure 19. On the cross-sections that intersect with the wing, the peak value of velocity fluctuation u appears at those locations where the shear layer separates from the surface of wing tip. The axial velocity fluctuation reaches its maximum value of 0.32U near the trailing edge. The high level fluctuations are wrapped up into the vortex core and convected downstream. On the cross-sections located in the wake area, the peak value of velocity fluctuation u appears in the center of the vortex core. In the streamwise direction, the fluctuation level decreases rapidly in the further downstream of the wake. The profiles of u rms along a line that intersects with the vortex core with z=constant are shown in Figure 20. In the wake, the level of the axial velocity fluctuation decreases as x increases. Figure 19. Contours of u rms on cross-sections at different streamwise locations Figure 20. Distribution of u rms along a horizontal line through vortex core Figure 21 shows the contours of velocity fluctuation v rms on the cross-sections at different streamwise locations. On cross-sections that intersect with the wing, the velocity fluctuation v rms reaches its peak value of 0.42U upstream the trailing edge of the wing. On the cross-sections located in the wake near the trailing edge (at x/c=1.06), strong interactions between wake and the primary vortex is obvious. The wake/vortex interaction becomes much weaker as the vortex core

17 moves upward and away from the wake in the further downstream. In Figure 22, the profiles of v rms along a constant-z line that cuts through the vortex core are plotted as functions of y. Figure 22 shows that the velocity fluctuation v rms along the spanwise direction decreases monotonically as x increases, except at x/c=1.25, where the increase of the fluctuation level can be caused by the interaction between the primary vortex and the wake near the trailing edge. Figure 21. Contours of v rms on cross-sections at different streamwise locations Figure 22. Distribution of v rms along a horizontal line through vortex core Figure 23 shows the contours of the velocity fluctuation w rms on cross-sections at different streamwise locations. On cross-sections that intersect with the wing, the velocity fluctuation reaches its peak value of 0.28U near the trailing edge of the wing. The contours of w rms on cross-sections located in the wake near the trailing edge show strong interactions between wake and the primary vortex. The wake/vortex interaction becomes weaker in the further downstream of the wake. The profiles of w rms along a constant-z line that cuts through vortex core are plotted as functions of y in Figure 24.
18 Figure 23. Contours of w rms on cross-sections at different stremwise locations Figure 24. Distribution of w rms along a horizontal line through vortex core The contours of the components of Reynolds stress u v, u w, and v w are plotted on crosssections with different streamwise locations in Figure 25, Figure 27, and Figure 29, respectively.. Figure 26, Figure 28, and Figure 30 show the profiles of the three components of the Reynolds stress along a line with constant z through vortex core as functions of y. The contours on the cross-sections shown in Figure 25 indicate that the separated shear layer has maximum Reynolds shear stress u v. The two lobe structure identified by opposite sign of Reynolds shear stress u v in the vortex core can be seen at cross-sections over the wing surface and in the wake. Similar observation has also been found by the experiment (Chow, et al, 1997). In the wake of the wing, the Reynolds shear stress u v decreases rapidly along the axial direction. In Figure 29, the contours on the cross-section also indicate that the separated shear layer has the maximum Reynolds shear stress u w. Again, the two lobe structure identified by the opposite sign of u w in the vortex core can be seen at cross-sections over the wing surface and in the wake. The u w component of the Reynolds stress decreases rapidly along the axial direction in the wake. In Figure 29, the contours of the v w show a four-leaf clove pattern which was also observed in the experiment (Chow, et al, 1997). This pattern becomes more clear in the wake where the distortion effect of the shear layer vanishes. The distribution of v w in the plot indicates that strong turbulent activity appears in the center of the vortex core over the wing surface. The Reynolds stress v w also decays along the axial direction in the wake Figure 25. Contours of Reynolds shear stress component u v on cross-sections at different streamwise locations Figure 26. Profiles of Reynolds shear stress u v along a horizontal line through vortex core

19 Figure 27. Contours of Reynolds shear stress component u w on cross-sections at different streamwise locations Figure 28. Profiles of Reynolds shear stress u w along a horizontal line through vortex core Figure 29. Contours of Reynolds shear stress component v w on cross-sections at different streamwise locations Figure 30. Profiles of Reynolds shear stress v w along a horizontal line through vortex core v w The contours of means strain rate + is displayed in Figure 31. Compared with the z y corresponding Reynolds shear stress shown in Figure 29, the Reynold stress is not aligned with the mean strain rate, which is consistent with the finding in Chow s experiment. This indicates the strong anisotropy in the vortex.
20 Figure 31. Contours of mean strain rate v w + on cross-sections at different z y streamwise locations Figure 32 shows the contours of turbulence kinetic energy on cross-sections at different streamwise locations. The profiles of turbulence kinetic energy along a horizontal line through vortex core are plotted as functions of y in Figure 33. The maximum turbulence kinetic energy occurs in the separated shear layer near the wing tip, as shown in Figure 32. After the primary vortex is formed, the peak turbulence kinetic energy appears at the center of the vortex core. In the wake, the turbulence kinetic energy decreases rapidly along the axial direction. In Figure 33, on the profiles corresponding to the cross-sections at x/c=1.06 and 1.125, the second peak reflects the wake effect. Figure 32. Contours of turbulence kinetic energy on cross-sections at different streamwise locations Figure 33. Profiles of turbulence kinetic energy along a horizontal line through vortex core
21 The distribution of pressure perturbation reveals the propagation of acoustic waves away from the wing tip, as shown in Figure 34 where the contours of RMS of pressure fluctuation are plotted on cross-sections with different streamwise locations. The pressure perturbations thus the acoustic waves are closely related to the fluctuations in the tip vortex and the separated turbulent shear layer. The formation of the primary tip vortex is considered as a major source of the noise associated with the acoustic waves. Figure 34. Contours of RMS of pressure fluctuation 5. LES Results and Discussions Large Eddy Simulations with filtered-structure function subgrid model (Ducros, et al, 1996) on two sets of grids are also performed. The numbers of grid are (around 12 millions) in coarse grid simulation and (around 26 millions) in fine grid simulation. The fine grid is the same as the one used in ILES. Figure 35 and Figure 36 show the pressure contours and velocity vectors on the cross-sections at different streamwise locations. Compared with the ILES result shown in Figure 6, in fine grid LES, primary and secondary votices have the similar features as those captured in ILES, while coarse grid result shows fewer small structures and the primary vortex is less deformed. The primary vortex dissipate more rapidly in coarse grid LES.
 (d)")
22 (a) (b) (c) (d)
 pressure contours and velocity")
 x/c=0.")
 x/c=1.25; (f) x/c=1.45.")
23 (e) (f) Figure 35. Instantaneous (t= 3.55c/U ) pressure contours and velocity vectors in the cross planes at different streamwise locations (a) x/c=0.9; (b) x/c=0.995; (c) x/c=1.06; (d) x/c=1.125; (e) x/c=1.25; (f) x/c=1.45. Fine grid LES. (a) (b) (c) (d)
 pressure contours and velocity vectors in the cross planes at")
 x/c=1.125; (e) x/c=1.25; (f) x/c=1.45. Coarse grid LES.")


24 (e) (f) Figure 36. Instantaneous (t= 3.75c/U ) pressure contours and velocity vectors in the cross planes at different streamwise locations (a) x/c=0.9; (b) x/c=0.995; (c) x/c=1.06; (d) x/c=1.125; (e) x/c=1.25; (f) x/c=1.45. Coarse grid LES. Figure 37 shows the time history of axial velocity at the streamwise locations ranging from 0.9c to 1.452c inside the vortex core. Solid lines represent ILES result and dashed lines are from fine grid LES result. We can see that fine grid LES shows the similar broadband spectrum feature of the velocity fluctuations as that from ILES. As the fine grid LES starts from the intermediate solutions from ILES (at about t=2.475c/u ), the solutions at the initial stage in LES match ILES solutions.
25 Figure 37. Time history of axial velocity at different streamwise locations inside the vortex core, comparison between ILES and LES. Solid lines: ILES; Dashed lines: fine grid LES. The time averaged profiles of the axial vorticity along a horizontal centerline at different streamwise locations are shown in Figure 38. The comparison between ILES and LES shows that LES model has little effect on the mean flow quantity in the wake region downstream the trailing edge, while over the wing surface, the vorticity strength predicted by LES is stronger. This indicate that the grid resolution is high enough in the wake region so that LES model is not in effect, while over the suction surface where turbulence is more intense, the grid resolution in ILES is not high enough, thus the LES model takes effect. The comparison between the fine grid LES and coarse grid LES shows large difference in both near surface region and wake region, which indicates that the resolution of the coarse grid is poor in both regions. (a) Comparison between ILES and LES (b) Comparison between fine and coarse LES Figure 38. Distribution of axial vorticity along a horizontal line through vortex core Figure 39 shows contours of the time averaged axial vorticity in cross planes at different streamwise locations. It is obvious that because of the poor grid resolution, the primary vortex dissipates more rapidly in coarse grid LES. The vortex behavior predicted from the fine grid LES (a) shows the similar feature as that from ILES (Figure 11)
26 (a) fine grid LES (b) coarse grid LES Figure 39. Contours of mean axial vorticity in cross planes at different locations The pressure coefficient profiles along the center lines of the vortex core, the contours of mean (time averaged) pressure on the cross-sections at different streamwise locations and Distribution of velocity component in z direction along a horizontal line through vortex core are shown in Figure 40, Figure 41 and Figure 42. ILES result and fine grid LES result are close to each other in the wake region. Coarse grid is too dissipative and not fine enough to resolve large gradient profiles. (a) Comparison between ILES and LES (b) Comparison between fine and coarse LES Figure 40. Distribution of pressure coefficient along a horizontal line through vortex core
27 (a) fine grid LES (b) coarse grid LES Figure 41. Contours of mean pressure in cross-sections at different streamwise locations (a) Comparison between ILES and LES (b) Comparison between fine and coarse LES Figure 42. Distribution of velocity component in z direction along a horizontal line through vortex core The comparisons of the components of Reynolds stress, turbulence kinetic energy, and mean strain rate between ILES and fine grid LES, fine grid LES and coarse grid LES are shown in Figure 43 through Figure 57. For most turbulent statistic quantities, larger differences between ILES and fine grid LES are observed over the wing surface where turbulence fluctuations are strong. In the wake region, two solutions show less difference except for Reynolds shear stress. These findings suggest that the grid resolution over the wing surface needs to be improved more than that in the wake region where turbulence fluctuations start to decay. Currently a finer grid ILES is ongoing. The result will be used to evaluate the solution from the fine grid LES and check the grid convergence property of ILES.
28 (a) Comparison between ILES and LES (b) Comparison between fine and coarse LES Figure 43. Distribution of u rms along a horizontal line through vortex core (a) fine grid LES (b) coarse grid LES Figure 44. Contours of u rms on cross-sections at different streamwise locations
29 (a) Comparison between ILES and LES (b) Comparison between fine and coarse LES Figure 45. Distribution of v rms along a horizontal line through vortex core (a) fine grid LES (b) coarse grid LES Figure 46. Contours of v rms on cross-sections at different streamwise locations
30 (a) Comparison between ILES and LES (b) Comparison between fine and coarse LES Figure 47. Distribution of w rms along a horizontal line through vortex core (a) fine grid LES (b) coarse grid LES Figure 48. Contours of w rms on cross-sections at different stremwise locations
31 (a) Comparison between ILES and LES (b) Comparison between fine and coarse LES Figure 49. Profiles of Reynolds shear stress u v along a horizontal line through vortex core (a) fine grid LES (b) coarse grid LES Figure 50. Contours of Reynolds shear stress component u v on cross-sections at different streamwise locations
32 (a) Comparison between ILES and LES (b) Comparison between fine and coarse LES Figure 51. Profiles of Reynolds shear stress u w along a horizontal line through vortex core (a) fine grid LES (b) coarse grid LES Figure 52. Contours of Reynolds shear stress component u w on cross-sections at different streamwise locations
33 (a) Comparison between ILES and LES (b) Comparison between fine and coarse LES Figure 53. Profiles of Reynolds shear stress v w along a horizontal line through vortex core (a) fine grid LES (b) coarse grid LES Figure 54. Contours of Reynolds shear stress component v w on cross-sections at different streamwise locations
34 (a) Comparison between ILES and LES (b) Comparison between fine and coarse LES Figure 55. Profiles of turbulence kinetic energy along a horizontal line through vortex core (a) fine grid LES (b) coarse grid LES Figure 56. Contours of turbulence kinetic energy on cross-sections at different streamwise locations
 complex flow associated with the formation of the wing tip vortex and its initial development and interaction with the near field wake has been simulated.")
35 (a) fine grid LES Figure 57. Contours of mean strain rate locations (b) coarse grid LES v w + on cross-sections at different streamwise z y 6. Conclusions High Reynolds number (4.6x10 6 ) complex flow associated with the formation of the wing tip vortex and its initial development and interaction with the near field wake has been simulated. The high-order, and high-resolution compact scheme used in the simulation has captured the major physics on a mesh with only about 26 million grid points which is highly stretched near the solid wall. On the suction side of the wing surface, the rolling up of the separated shear layer at the rounded wing tip creates the primary tip vortex. The rotational flow field of the primary tip vortex induces the counter-rotating secondary vortex near the wing surface. The separated shear layer contains high level of fluctuations and wraps up the secondary vortex into the primary vortex. Both the shear layer fluctuations and the secondary vortex contribute high disturbance energy to the primary vortex core to produce small vortical structures within the core region, which becomes highly turbulent. Therefore, the turbulence inside the primary tip vortex is not created by the tip vortex itself. Instead, the turbulent shear layer and the interaction between the primary and the secondary vortices are the major sources of turbulent activity in the core. The primary tip vortex is generated near the wing tip onboard the suction surface and is convected downstream. The rotation of the tip vortex produces low pressure in the core region. The favorable axial pressure gradient accelerates the axial flow and produces the axial velocity surplus. The instantaneous axial velocity can be as large as 2.0U. On the other hand, counterrotating secondary vortex contribute to axial velocity deficit. In the near wake region, there is no more energy input from either the shear layer or the secondary vortex due to the absence of the solid wall surface. In the wake, the small vortical structures convected from the upstream to the downstream dissipate rapidly. Without the secondary vortex and the shear layer in the wake, no more disturbances are fed into the primary vortex. The near field wake is screwed and laterally stretched and curved by the rotating primary vortex. The wake disturbances also contribute to the fluctuation of the primary vortex and dissipate quickly when traveling downstream. In further
36 downstream, the tip vortex becomes more stable and flow in the core region is more axisymmetric. On the cross-sections that are intersected with the wing, the peak values of velocity fluctuations are found over the suction side of the wing where the shear layer separates from the rounded wing tip. The high level fluctuations are wrapped up into the vortex core and convected downstream. In the wake region, the peak of velocity fluctuation appears in the center of the vortex core and fluctuation level decreases rapidly downstream along the axial direction. Pressure perturbation field shows that the noise source locates in the near tip region and acoustic waves propagate away from the wing tip. The fluctuations inside the tip vortex contribute to the pressure perturbations. Three numerical simulations have been performed. One is fine grid (26 millions) LES without model which we call implicit LES (ILES). The second one is fine grid (26 millions) LES with filtered-structure function subgrid model and the third one is course grid (12 millions) LES with the same subgrid model. The computation shows fine grid ILES and LES results are similar in the wake and different near the wall, which shows more resolution is needed to resolve the near wall small vortices. The coarse grid LES shows too dissipative to tip vortex which is dissipated too fast after shedding. This also demonstrates the second order subgrid model is inconsistent to a six-order compact scheme. We would like to make some comments on low order LES with low order subgrid models. The fundamental idea of using LES is to resolve large scales as much as possible. Therefore, low order scheme, such as second order central or bias difference scheme, is not appropriate for LES due to their low order accuracy and low resolution although we are aware that many LES work with low order scheme have been reported, and high order compact scheme is preferred for flow transition and turbulence. Most LES computations require use of a subgrid model trying to get the unresolved scales back which could be considered as truncation errors mathematically. 2 However, Smagorinsky model and many other subgrid models are second order with. If we use sixth order compact scheme for LES without model (Implicit LES), we will get sixth order of accuracy. However, if we add the Smgorinsky subgrid model, our LES results will be degenerated to second order of accuracy, which is really bad. A carefully designed 6 th order subgrid model may be needed for high order LES. Therefore, second order ILES, second order LES with second order subgrid models are not appropriate. The second order subgrid models degenerate the original ILES results, which is six order in accuracy, to second order. This is a critical problem to most of LES work reported. The possible solution is to increase grids in the near wall region or develop a six order subgrid model. Table 2 shows the orders obtained by different orders of schemes, which demonstrates the importance of high order numerical schemes for DNS/LES.
Wind tunnel effects on wingtip vortices
 48th AIAA Aerospace Sciences Meeting Including the New Horizons Forum and Aerospace Exposition 4-7 January 2010, Orlando, Florida AIAA 2010-325 Wind tunnel effects on wingtip vortices Xin Huang 1, Hirofumi
AE Dept., KFUPM. Dr. Abdullah M. Al-Garni. Fuel Economy. Emissions Maximum Speed Acceleration Directional Stability Stability.
 Aerodynamics: Introduction Aerodynamics deals with the motion of objects in air. These objects can be airplanes, missiles or road vehicles. The Table below summarizes the aspects of vehicle performance
COMPUTATIONAL FLOW MODEL OF WESTFALL'S LEADING TAB FLOW CONDITIONER AGM-09-R-08 Rev. B. By Kimbal A. Hall, PE
 COMPUTATIONAL FLOW MODEL OF WESTFALL'S LEADING TAB FLOW CONDITIONER AGM-09-R-08 Rev. B By Kimbal A. Hall, PE Submitted to: WESTFALL MANUFACTURING COMPANY September 2009 ALDEN RESEARCH LABORATORY, INC.
The effect of back spin on a table tennis ball moving in a viscous fluid.
 How can planes fly? The phenomenon of lift can be produced in an ideal (non-viscous) fluid by the addition of a free vortex (circulation) around a cylinder in a rectilinear flow stream. This is known as
High fidelity gust simulations around a transonic airfoil
 High fidelity gust simulations around a transonic airfoil AEROGUST Workshop 27 th - 28 th April 2017, University of Liverpool Presented by B. Tartinville (Numeca) Outline of the presentation 1Objectives
Influence of rounding corners on unsteady flow and heat transfer around a square cylinder
 Influence of rounding corners on unsteady flow and heat transfer around a square cylinder S. K. Singh Deptt. of Mech. Engg., M. B. M. Engg. College / J. N. V. University, Jodhpur, Rajasthan, India Abstract
Numerical and Experimental Investigation of the Possibility of Forming the Wake Flow of Large Ships by Using the Vortex Generators
 Second International Symposium on Marine Propulsors smp 11, Hamburg, Germany, June 2011 Numerical and Experimental Investigation of the Possibility of Forming the Wake Flow of Large Ships by Using the
THE BRIDGE COLLAPSED IN NOVEMBER 1940 AFTER 4 MONTHS OF ITS OPENING TO TRAFFIC!
 OUTLINE TACOMA NARROWS BRIDGE FLOW REGIME PAST A CYLINDER VORTEX SHEDDING MODES OF VORTEX SHEDDING PARALLEL & OBLIQUE FLOW PAST A SPHERE AND A CUBE SUMMARY TACOMA NARROWS BRIDGE, USA THE BRIDGE COLLAPSED
Computational Investigation of Airfoils with Miniature Trailing Edge Control Surfaces
 AIAA-24-5 Computational Investigation of Airfoils with Miniature Trailing Edge Control Surfaces Hak-Tae Lee, Ilan M. Kroo Stanford University, Stanford, CA 9435 Abstract Miniature trailing edge effectors
 et al. [25], Noack et al. [26] for circular cylinder flows, Van Oudheusden [27] for square cylinder and Durgesh [28] for a flat plate model. The first two modes appear as phase-shifted versions of each
DUE TO EXTERNAL FORCES
 17B.6 DNS ON GROWTH OF A VERTICAL VORTEX IN CONVECTION DUE TO EXTERNAL FORCES Ryota Iijima* and Tetsuro Tamura Tokyo Institute of Technology, Yokohama, Japan 1. INTRODUCTION Various types of vertical vortices,
Lift for a Finite Wing. all real wings are finite in span (airfoils are considered as infinite in the span)
") Lift for a Finite Wing all real wings are finite in span (airfoils are considered as infinite in the span) The lift coefficient differs from that of an airfoil because there are strong vortices produced
Lift for a Finite Wing all real wings are finite in span (airfoils are considered as infinite in the span) The lift coefficient differs from that of an airfoil because there are strong vortices produced
Aerodynamic Analysis of Blended Winglet for Low Speed Aircraft
 , July 1-3, 2015, London, U.K. Aerodynamic Analysis of Blended Winglet for Low Speed Aircraft Pooja Pragati, Sudarsan Baskar Abstract This paper provides a practical design of a new concept of massive
ROAD MAP... D-1: Aerodynamics of 3-D Wings D-2: Boundary Layer and Viscous Effects D-3: XFLR (Aerodynamics Analysis Tool)
") Unit D-1: Aerodynamics of 3-D Wings Page 1 of 5 AE301 Aerodynamics I UNIT D: Applied Aerodynamics ROAD MAP... D-1: Aerodynamics of 3-D Wings D-: Boundary Layer and Viscous Effects D-3: XFLR (Aerodynamics
Unit D-1: Aerodynamics of 3-D Wings Page 1 of 5 AE301 Aerodynamics I UNIT D: Applied Aerodynamics ROAD MAP... D-1: Aerodynamics of 3-D Wings D-: Boundary Layer and Viscous Effects D-3: XFLR (Aerodynamics
GEOMETRY TIP CAP EFFECTS ON FORMATION AND NEAR WAKE EVOLUTION OF THE ROTOR TIP VORTICES
 36th AIAA Fluid Dynamics Conference and Exhibit 5-8 June 2006, San Francisco, California AIAA 2006-3376 GEOMETRY TIP CAP EFFECTS ON FORMATION AND NEAR WAKE EVOLUTION OF THE ROTOR TIP VORTICES Roxana Vasilescu
Influence of wing span on the aerodynamics of wings in ground effect
 Influence of wing span on the aerodynamics of wings in ground effect Sammy Diasinos 1, Tracie J Barber 2 and Graham Doig 2 Abstract A computational fluid dynamics study of the influence of wing span has
Investigation of Suction Process of Scroll Compressors
 Purdue University Purdue e-pubs International Compressor Engineering Conference School of Mechanical Engineering 2006 Investigation of Suction Process of Scroll Compressors Michael M. Cui Trane Jack Sauls
Numerical Simulation And Aerodynamic Performance Comparison Between Seagull Aerofoil and NACA 4412 Aerofoil under Low-Reynolds 1
 Advances in Natural Science Vol. 3, No. 2, 2010, pp. 244-20 www.cscanada.net ISSN 171-7862 [PRINT] ISSN 171-7870 [ONLINE] www.cscanada.org *The 3rd International Conference of Bionic Engineering* Numerical
PERFORMANCE OF A FLAPPED DUCT EXHAUSTING INTO A COMPRESSIBLE EXTERNAL FLOW
 24 TH INTERNATIONAL CONGRESS OF THE AERONAUTICAL SCIENCES PERFORMANCE OF A FLAPPED DUCT EXHAUSTING INTO A COMPRESSIBLE EXTERNAL FLOW P. R. Pratt, J. K. Watterson, E. Benard, S. Hall School of Aeronautical
Quantification of the Effects of Turbulence in Wind on the Flutter Stability of Suspension Bridges
 Quantification of the Effects of Turbulence in Wind on the Flutter Stability of Suspension Bridges T. Abbas 1 and G. Morgenthal 2 1 PhD candidate, Graduate College 1462, Department of Civil Engineering,
Incompressible Potential Flow. Panel Methods (3)
") Incompressible Potential Flow Panel Methods (3) Outline Some Potential Theory Derivation of the Integral Equation for the Potential Classic Panel Method Program PANEL Subsonic Airfoil Aerodynamics Issues
Incompressible Potential Flow Panel Methods (3) Outline Some Potential Theory Derivation of the Integral Equation for the Potential Classic Panel Method Program PANEL Subsonic Airfoil Aerodynamics Issues
Numerical Investigation of Multi Airfoil Effect on Performance Increase of Wind Turbine
 International Journal of Engineering & Applied Sciences (IJEAS) International Journal of Engineering Applied Sciences (IJEAS) Vol.9, Issue 3 (2017) 75-86 Vol.x, Issue x(201x)x-xx http://dx.doi.org/10.24107/ijeas.332075
Forest Winds in Complex Terrain
 Forest Winds in Complex Terrain Ilda Albuquerque 1 Contents Project Description Motivation Forest Complex Terrain Forested Complex Terrain 2 Project Description WAUDIT (Wind Resource Assessment Audit and
A COMPUTATIONAL STUDY ON THE DESIGN OF AIRFOILS FOR A FIXED WING MAV AND THE AERODYNAMIC CHARACTERISTIC OF THE VEHICLE
 28 TH INTERNATIONAL CONGRESS OF THE AERONAUTICAL SCIENCES A COMPUTATIONAL STUDY ON THE DESIGN OF AIRFOILS FOR A FIXED WING MAV AND THE AERODYNAMIC CHARACTERISTIC OF THE VEHICLE Jung-Hyun Kim*, Kyu-Hong
Computational Analysis of the S Airfoil Aerodynamic Performance
 Computational Analysis of the 245-3S Airfoil Aerodynamic Performance Luis Velazquez-Araque and Jiří Nožička 2 Department of Mechanical Engineering National University of Táchira, San Cristóbal 5, Venezuela
Large-eddy simulation of a turbulent buoyant helium plume
 Center for Turbulence Research Annual Research Briefs 8 45 Large-eddy simulation of a turbulent buoyant helium plume By G. Blanquart AND H. Pitsch. Motivation and objectives The numerical simulation of
NUMERICAL SIMULATION OF ACTIVE FLOW CONTROL BASED ON STREAMWISE VORTICES FOR A BLUNT TRAILING EDGE AIRFOIL
 BBAA VI International Colloquium on: Bluff Bodies Aerodynamics & Applications Milano, Italy, July, 20-24 2008 NUMERICAL SIMULATION OF ACTIVE FLOW CONTROL BASED ON STREAMWISE VORTICES FOR A BLUNT TRAILING
HEFAT th International Conference on Heat Transfer, Fluid Mechanics and Thermodynamics July 2012 Malta
 HEFAT212 9 th International Conference on Heat Transfer, Fluid Mechanics and Thermodynamics 16 18 July 212 Malta AN EXPERIMENTAL STUDY OF SWEEP ANGLE EFFECTS ON THE TRANSITION POINT ON A 2D WING BY USING
Turbulence Modelling of Deep Dynamic Stall at Low Reynolds Number
 , June 30 - July 2, 2010, London, U.K. Turbulence Modelling of Deep Dynamic Stall at Low Reynolds Number Shengyi Wang, Lin Ma, Derek B Ingham, Mohamed Pourkashanian and Zhi Tao Abstract The unsteady separated
Experimental and Theoretical Investigation for the Improvement of the Aerodynamic Characteristic of NACA 0012 airfoil
 International Journal of Mining, Metallurgy & Mechanical Engineering (IJMMME) Volume 2, Issue 1 (214) ISSN 232 46 (Online) Experimental and Theoretical Investigation for the Improvement of the Aerodynamic
WESEP 594 Research Seminar
 WESEP 594 Research Seminar Aaron J Rosenberg Department of Aerospace Engineering Iowa State University Major: WESEP Co-major: Aerospace Engineering Motivation Increase Wind Energy Capture Betz limit: 59.3%
DNS Study on Three Vortex Identification Methods
 Γ DNS Study on Three Vortex Identification Methods Yinlin Dong Yong Yang Chaoqun Liu Technical Report 2016-07 http://www.uta.edu/math/preprint/ DNS Study on Three Vortex Identification Methods Yinlin Dong
Development of Technology to Estimate the Flow Field around Ship Hull Considering Wave Making and Propeller Rotating Effects
 Development of Technology to Estimate the Flow Field around Ship Hull Considering Wave Making and Propeller Rotating Effects 53 MAKOTO KAWABUCHI *1 MASAYA KUBOTA *1 SATORU ISHIKAWA *2 As can be seen from
Navier Stokes analysis of lift-enhancing tabs on multi-element airfoils
 Navier Stokes analysis of lift-enhancing tabs on multi-element airfoils Paul G. Carrannanto, Bruce L. Storms, James C. Ross, Russell M. Cummings Ford Motor Company, Dearborn, MI 48121, USA Aerospace Computing,
Inlet Swirl on Turbocharger Compressor Performance
 Inlet Swirl on Turbocharger Compressor Performance Lei Huang, Ying Liu, Hua Chen* National laboratory of Engine Turbocharging Technology, Tianjin, China *corresponding author: Tel.:+86-22-5870-7069; fax:
EXPERIMENTAL STUDY OF WIND PRESSURES ON IRREGULAR- PLAN SHAPE BUILDINGS
 BBAA VI International Colloquium on: Bluff Bodies Aerodynamics & Applications Milano, Italy, July, 2-24 8 EXPERIMENTAL STUDY OF WIND PRESSURES ON IRREGULAR- PLAN SHAPE BUILDINGS J. A. Amin and A. K. Ahuja
Anna University Regional office Tirunelveli
 Effect of Tubercle Leading Edge Control Surface on the Performance of the Double Delta Wing Fighter Aircraft P Sharmila 1, S Rajakumar 2 1 P.G. Scholar, 2 Assistant Professor, Mechanical Department Anna
AN EXPERIMENTAL STUDY OF THE EFFECTS OF SWEPT ANGLE ON THE BOUNDARY LAYER OF THE 2D WING
 AN EXPERIMENTAL STUDY OF THE EFFECTS OF SWEPT ANGLE ON THE BOUNDARY LAYER OF THE 2D WING A. Davari *, M.R. Soltani, A.Tabrizian, M.Masdari * Assistant Professor, Department of mechanics and Aerospace Engineering,
A comparison of NACA 0012 and NACA 0021 self-noise at low Reynolds number
 A comparison of NACA 12 and NACA 21 self-noise at low Reynolds number A. Laratro, M. Arjomandi, B. Cazzolato, R. Kelso Abstract The self-noise of NACA 12 and NACA 21 airfoils are recorded at a Reynolds
AERODYNAMIC CHARACTERISTICS OF SPIN PHENOMENON FOR DELTA WING
 ICAS 2002 CONGRESS AERODYNAMIC CHARACTERISTICS OF SPIN PHENOMENON FOR DELTA WING Yoshiaki NAKAMURA (nakamura@nuae.nagoya-u.ac.jp) Takafumi YAMADA (yamada@nuae.nagoya-u.ac.jp) Department of Aerospace Engineering,
Flow Over Bodies: Drag and Lift
 Fluid Mechanics (0905241) Flow Over Bodies: Drag and Lift Dr.-Eng. Zayed dal-hamamre 1 Content Overview Drag and Lift Flow Past Objects Boundary Layers Laminar Boundary Layers Transitional and Turbulent
High Swept-back Delta Wing Flow
 Advanced Materials Research Submitted: 2014-06-25 ISSN: 1662-8985, Vol. 1016, pp 377-382 Accepted: 2014-06-25 doi:10.4028/www.scientific.net/amr.1016.377 Online: 2014-08-28 2014 Trans Tech Publications,
AN EXPERIMENTAL AND COMPUTATIONAL STUDY OF THE AERODYNAMIC CHARACTERISTICS AN OSCILLATORY PITCHING NACA0012 AEROFOIL
 AN EXPERIMENTAL AND COMPUTATIONAL STUDY OF THE AERODYNAMIC CHARACTERISTICS AN OSCILLATORY PITCHING NACA0012 AEROFOIL Ashim Yadav, Simon Prince & Jenny Holt School of Aerospace, Transport and Manufacturing,
Investigation on 3-D Wing of commercial Aeroplane with Aerofoil NACA 2415 Using CFD Fluent
 Investigation on 3-D of commercial Aeroplane with Aerofoil NACA 2415 Using CFD Fluent Rohit Jain 1, Mr. Sandeep Jain 2, Mr. Lokesh Bajpai 3 1PG Student, 2 Associate Professor, 3 Professor & Head 1 2 3
ANALYSIS OF AERODYNAMIC CHARACTERISTICS OF A SUPERCRITICAL AIRFOIL FOR LOW SPEED AIRCRAFT
 ANALYSIS OF AERODYNAMIC CHARACTERISTICS OF A SUPERCRITICAL AIRFOIL FOR LOW SPEED AIRCRAFT P.Sethunathan 1, M.Niventhran 2, V.Siva 2, R.Sadhan Kumar 2 1 Asst.Professor, Department of Aeronautical Engineering,
CFD Analysis ofwind Turbine Airfoil at Various Angles of Attack
 IOSR Journal of Mechanical and Civil Engineering (IOSR-JMCE) e-issn: 2278-1684,p-ISSN: 2320-334X, Volume 13, Issue 4 Ver. II (Jul. - Aug. 2016), PP 18-24 www.iosrjournals.org CFD Analysis ofwind Turbine
Effect of Diameter on the Aerodynamics of Sepaktakraw Balls, A Computational Study
 ISSN 1750-9823 (print) International Journal of Sports Science and Engineering Vol. 03 (2009) No. 01, pp. 017-021 Effect of Diameter on the Aerodynamics of Sepaktakraw Balls, A Computational Study Zahari
Helicopters / Vortex theory. Filipe Szolnoky Cunha
 Vortex Theory Slide 1 Vortex Theory Slide 2 Vortex Theory µ=0.2 Slide 3 Vortex Theory µ=0.4 Slide 4 Vortex Theory Slide 5 Tip Vortex Trajectories Top view Slide 6 Definition Wake Age Slide 7 Assumptions:
NUMERICAL AND EXPERIMENTAL INVESTIGATION OF THE FLOWFIELD IN A BLOWDOWN WIND TUNNEL
 ICAS 2002 CONGRESS NUERICAL AND EXPERIENTAL INVESTIGATION OF THE FLOWFIELD IN A BLOWDOWN WIND TUNNEL Ali Rebaine, ahmood Khalid, Cabot Broughton and Fred Ellis Institute for Aerospace Research, National
THREE DIMENSIONAL STRUCTURES OF FLOW BEHIND A
 The Seventh Asia-Pacific Conference on Wind Engineering, November 8-12, 29, Taipei, Taiwan THREE DIMENSIONAL STRUCTURES OF FLOW BEHIND A SQUARE PRISM Hiromasa Kawai 1, Yasuo Okuda 2 and Masamiki Ohashi
AERODYNAMICS I LECTURE 7 SELECTED TOPICS IN THE LOW-SPEED AERODYNAMICS
 LECTURE 7 SELECTED TOPICS IN THE LOW-SPEED AERODYNAMICS The sources of a graphical material used in this lecture are: [UA] D. McLean, Understanding Aerodynamics. Arguing from the Real Physics. Wiley, 2013.
ISOLATION OF NON-HYDROSTATIC REGIONS WITHIN A BASIN
 ISOLATION OF NON-HYDROSTATIC REGIONS WITHIN A BASIN Bridget M. Wadzuk 1 (Member, ASCE) and Ben R. Hodges 2 (Member, ASCE) ABSTRACT Modeling of dynamic pressure appears necessary to achieve a more robust
Basic Fluid Mechanics
 Basic Fluid Mechanics Chapter 7B: Forces on Submerged Bodies 7/26/2018 C7B: Forces on Submerged Bodies 1 Forces on Submerged Bodies Lift and Drag are forces exerted on an immersed body by the surrounding
The Effect of Gurney Flap Height on Vortex Shedding Modes Behind Symmetric Airfoils
 The Effect of Gurney Flap Height on Vortex Shedding Modes Behind Symmetric Airfoils Daniel R. Troolin 1, Ellen K. Longmire 2, Wing T. Lai 3 1: TSI Incorporated, St. Paul, USA, dan.troolin@tsi.com 2: University
External Tank- Drag Reduction Methods and Flow Analysis
 External Tank- Drag Reduction Methods and Flow Analysis Shaik Mohammed Anis M.Tech Student, MLR Institute of Technology, Hyderabad, India. G. Parthasarathy Associate Professor, MLR Institute of Technology,
NAWEA 2015 SYMPOSIUM
 Aerodynamics and Aeroacoustics of Spanwise Wavy Trailing Edge Flatback Airfoils: Design Improvement Seung Joon Yang James D. Baeder Alfred Gessow Rotorcraft Center Department of Aerospace Engineering,
The Usage of Propeller Tunnels For Higher Efficiency and Lower Vibration. M. Burak Şamşul
 The Usage of Propeller Tunnels For Higher Efficiency and Lower Vibration M. Burak Şamşul ITU AYOC 2014 - Milper Pervane Teknolojileri Company Profile MILPER is established in 2011 as a Research and Development
Energy from wind and water extracted by Horizontal Axis Turbine
 Energy from wind and water extracted by Horizontal Axis Turbine Wind turbines in complex terrain (NREL) Instream MHK turbines in complex bathymetry (VP East channel NewYork) Common features? 1) horizontal
Welcome to Aerospace Engineering
 Welcome to Aerospace Engineering DESIGN-CENTERED INTRODUCTION TO AEROSPACE ENGINEERING Notes 4 Topics 1. Course Organization 2. Today's Dreams in Various Speed Ranges 3. Designing a Flight Vehicle: Route
AIRFLOW GENERATION IN A TUNNEL USING A SACCARDO VENTILATION SYSTEM AGAINST THE BUOYANCY EFFECT PRODUCED BY A FIRE
 - 247 - AIRFLOW GENERATION IN A TUNNEL USING A SACCARDO VENTILATION SYSTEM AGAINST THE BUOYANCY EFFECT PRODUCED BY A FIRE J D Castro a, C W Pope a and R D Matthews b a Mott MacDonald Ltd, St Anne House,
ZIN Technologies PHi Engineering Support. PHi-RPT CFD Analysis of Large Bubble Mixing. June 26, 2006
 ZIN Technologies PHi Engineering Support PHi-RPT-0002 CFD Analysis of Large Bubble Mixing Proprietary ZIN Technologies, Inc. For nearly five decades, ZIN Technologies has provided integrated products and
Aerodynamics of Winglet: A Computational Fluid Dynamics Study Using Fluent
 Aerodynamics of : A Computational Fluid Dynamics Study Using Fluent Rohit Jain 1, Mr. Sandeep Jain, Mr. Lokesh Bajpai 1PG Student, Associate Professor, Professor & Head 1 Mechanical Engineering Department
Euler Solutions of Flow around a Rectangular Wing with Square Tip
 45th AIAA Aerospace Sciences Meeting and Exhibit 8 - January 27, Reno, Nevada AIAA 27-896 45th AIAA Aerospace Sciences Meeting & Exhibit, 8 Jan, 27, Reno, NV Euler Solutions of Flow around a Rectangular
JOURNAL PUBLICATIONS
 1 JOURNAL PUBLICATIONS 71. Lee, T., Mageed, A., Siddiqui, B. and Ko, L.S., (2016) Impact of ground proximity on aerodynamic properties of an unsteady NACA 0012 airfoil, submitted to Journal of Aerospace
J. Szantyr Lecture No. 21 Aerodynamics of the lifting foils Lifting foils are important parts of many products of contemporary technology.
 J. Szantyr Lecture No. 21 Aerodynamics of the lifting foils Lifting foils are important parts of many products of contemporary technology. < Helicopters Aircraft Gliders Sails > < Keels and rudders Hydrofoils
Aerodynamic study of a cyclist s moving legs using an innovative approach
 Aerodynamic study of a cyclist s moving legs using an innovative approach Francesco Pozzetti 30 September 2017 Abstract During a period of four weeks in September, I completed a research project in fluid
Unsteady Aerodynamics of Tandem Airfoils Pitching in Phase
 Unsteady Aerodynamics of Tandem Airfoils Pitching in Phase Ravindra A Shirsath and Rinku Mukherjee Abstract This paper presents the results of a numerical simulation of unsteady, incompressible and viscous
The Influence of Ocean Surface Waves on Offshore Wind Turbine Aerodynamics. Ali Al Sam
 The Influence of Ocean Surface Waves on Offshore Wind Turbine Aerodynamics Ali Al Sam What I m going to wear today? Do I need to leave early to get to work? Taking buss or riding bike? Where will we drink
Surrounding buildings and wind pressure distribution on a high rise building
 Surrounding buildings and wind pressure distribution on a high rise building Conference or Workshop Item Accepted Version Luo, Z. (2008) Surrounding buildings and wind pressure distribution on a high rise
CFD DESIGN STUDY OF A CIRCULATION CONTROL INLET GUIDE VANE OF AN AEROFOIL
 Int. J. Mech. Eng. & Rob. Res. 2012 Manjunath Ichchangi and Manjunath H, 2012 Research Paper ISSN 2278 0149 www.ijmerr.com Vol. 1, No. 3, October 2012 2012 IJMERR. All Rights Reserved CFD DESIGN STUDY
Computational Analysis of Cavity Effect over Aircraft Wing
 World Engineering & Applied Sciences Journal 8 (): 104-110, 017 ISSN 079-04 IDOSI Publications, 017 DOI: 10.589/idosi.weasj.017.104.110 Computational Analysis of Cavity Effect over Aircraft Wing 1 P. Booma
Reduction of Skin Friction Drag in Wings by Employing Riblets
 Reduction of Skin Friction Drag in Wings by Employing Riblets Kousik Kumaar. R 1 Assistant Professor Department of Aeronautical Engineering Nehru Institute of Engineering and Technology Coimbatore, India
Wind Flow Model of Area Surrounding the Case Western Reserve University Wind Turbine
 Wind Flow Model of Area Surrounding the Case Western Reserve University Wind Turbine Matheus C. Fernandes 1, David H. Matthiesen PhD *2 1 Case Western Reserve University Dept. of Mechanical Engineering,
Kathleen Dohan. Wind-Driven Surface Currents. Earth and Space Research, Seattle, WA
 Updates to OSCAR and challenges with capturing the wind-driven currents. Wind-Driven Surface Currents Kathleen Dohan Earth and Space Research, Seattle, WA ENSO OSCAR Surface currents from satellite fields
THEORETICAL EVALUATION OF FLOW THROUGH CENTRIFUGAL COMPRESSOR STAGE
 THEORETICAL EVALUATION OF FLOW THROUGH CENTRIFUGAL COMPRESSOR STAGE S.Ramamurthy 1, R.Rajendran 1, R. S. Dileep Kumar 2 1 Scientist, Propulsion Division, National Aerospace Laboratories, Bangalore-560017,ramamurthy_srm@yahoo.com
Study on wind turbine arrangement for offshore wind farms
 Downloaded from orbit.dtu.dk on: Jul 01, 2018 Study on wind turbine arrangement for offshore wind farms Shen, Wen Zhong; Mikkelsen, Robert Flemming Published in: ICOWEOE-2011 Publication date: 2011 Document
Tim Lee s journal publications
 Tim Lee s journal publications 82. Lee, T., and Tremblay-Dionne, V., (2018) Impact of wavelength and amplitude of a wavy ground on a static NACA 0012 airfoil submitted to Journal of Aircraft (paper in
Citation Journal of Thermal Science, 18(4),
,") NAOSITE: Nagasaki University's Ac Title Author(s) Noise characteristics of centrifuga diffuser (Noise reduction by means leading tip) Murakami, Tengen; Ishida, Masahiro; Citation Journal of Thermal Science,
NAOSITE: Nagasaki University's Ac Title Author(s) Noise characteristics of centrifuga diffuser (Noise reduction by means leading tip) Murakami, Tengen; Ishida, Masahiro; Citation Journal of Thermal Science,
Aerodynamic Terms. Angle of attack is the angle between the relative wind and the wing chord line. [Figure 2-2] Leading edge. Upper camber.
![Aerodynamic Terms. Angle of attack is the angle between the relative wind and the wing chord line. [Figure 2-2] Leading edge. Upper camber.](/thumbs/82/86661300.jpg "Aerodynamic Terms. Angle of attack is the angle between the relative wind and the wing chord line. [Figure 2-2] Leading edge. Upper camber.") Chapters 2 and 3 of the Pilot s Handbook of Aeronautical Knowledge (FAA-H-8083-25) apply to powered parachutes and are a prerequisite to reading this book. This chapter will focus on the aerodynamic fundamentals
Chapters 2 and 3 of the Pilot s Handbook of Aeronautical Knowledge (FAA-H-8083-25) apply to powered parachutes and are a prerequisite to reading this book. This chapter will focus on the aerodynamic fundamentals
EXPERIMENTAL ANALYSIS OF FLOW OVER SYMMETRICAL AEROFOIL Mayank Pawar 1, Zankhan Sonara 2 1,2
 EXPERIMENTAL ANALYSIS OF FLOW OVER SYMMETRICAL AEROFOIL Mayank Pawar 1, Zankhan Sonara 2 1,2 Assistant Professor,Chandubhai S. Patel Institute of Technology, CHARUSAT, Changa, Gujarat, India Abstract The
NUMERICAL INVESTIGATION OF AERODYNAMIC CHARACTERISTICS OF NACA AIRFOIL WITH A GURNEY FLAP
 Int. J. Mech. Eng. & Rob. Res. 2012 MasoudJahanmorad Nouri et al., 2012 Research Paper ISSN 2278 0149 www.ijmerr.com Vol. 1, No. 3, October 2012 2012 IJMERR. All Rights Reserved NUMERICAL INVESTIGATION
Unsteady airfoil experiments
 Unsteady airfoil experiments M.F. Platzer & K.D. Jones AeroHydro Research & Technology Associates, Pebble Beach, CA, USA. Abstract This paper describes experiments that elucidate the dynamic stall phenomenon
Results and Discussion for Steady Measurements
 Chapter 5 Results and Discussion for Steady Measurements 5.1 Steady Skin-Friction Measurements 5.1.1 Data Acquisition and Reduction A Labview software program was developed for the acquisition of the steady
Figure 1 Figure 1 shows the involved forces that must be taken into consideration for rudder design. Among the most widely known profiles, the most su
 THE RUDDER starting from the requirements supplied by the customer, the designer must obtain the rudder's characteristics that satisfy such requirements. Subsequently, from such characteristics he must
Unsteady Flows and Airfoil-Vortex Interaction
 (SYA) 12-1 Unsteady Flows and Airfoil-Vortex Interaction M. Mamou, M. Khalid and H. Xu Institute for Aerospace Research National Research Council Ottawa, K1A 0R6, Ontario, Canada Mahmoud.Mamou@nrc.ca Abstract
EXPERIMENTAL ANALYSIS OF THE CONFLUENT BOUNDARY LAYER BETWEEN A FLAP AND A MAIN ELEMENT WITH SAW-TOOTHED TRAILING EDGE
 24 TH INTERNATIONAL CONGRESS OF THE AERONAUTICAL SCIENCES EXPERIMENTAL ANALYSIS OF THE CONFLUENT BOUNDARY LAYER BETWEEN A FLAP AND A MAIN ELEMENT WITH SAW-TOOTHED TRAILING EDGE Lemes, Rodrigo Cristian,
Proceedings of Meetings on Acoustics
 Proceedings of Meetings on Acoustics Volume 9, 2010 http://acousticalsociety.org/ 159th Meeting Acoustical Society of America/NOISE-CON 2010 Baltimore, Maryland 19-23 April 2010 Session 1pBB: Biomedical
Aerodynamic investigation of Winglets on Wind Turbine Blades using CFD
 Risø-R-1543(EN) Aerodynamic investigation of Winglets on Wind Turbine Blades using CFD Jeppe Johansen and Niels N. Sørensen Risø National Laboratory Roskilde Denmark February 26 Author: Jeppe Johansen
Lecture 7. More on BL wind profiles and turbulent eddy structures. In this lecture
 Lecture 7. More on BL wind profiles and turbulent eddy structures In this lecture Stability and baroclinicity effects on PBL wind and temperature profiles Large-eddy structures and entrainment in shear-driven
CFD ANALYSIS OF FLOW AROUND AEROFOIL FOR DIFFERENT ANGLE OF ATTACKS
 www.mechieprojects.com CFD ANALYSIS OF FLOW AROUND AEROFOIL FOR DIFFERENT ANGLE OF ATTACKS PRESENTATION OUTLINE AIM INTRODUCTION LITERATURE SURVEY CFD ANALYSIS OF AEROFOIL RESULTS CONCLUSIONS www.mechieprojects.com
Simulation of Flow Field Past Symmetrical Aerofoil Baffles Using Computational Fluid Dynamics Method
 Proceedings of the 4 th International Conference of Fluid Flow, Heat and Mass Transfer (FFHMT'17) Toronto, Canada August 21 23, 2017 Paper No. 120 DOI: 10.11159/ffhmt17.120 Simulation of Flow Field Past
A Study on the Effects of Wind on the Drift Loss of a Cooling Tower
 A Study on the Effects of Wind on the Drift Loss of a Cooling Tower Wanchai Asvapoositkul 1* 1 Department of Mechanical Engineering, Faculty of Engineering, King Mongkut s University of Technology Thonburi
Measurement and simulation of the flow field around a triangular lattice meteorological mast
 Measurement and simulation of the flow field around a triangular lattice meteorological mast Matthew Stickland 1, Thomas Scanlon 1, Sylvie Fabre 1, Andrew Oldroyd 2 and Detlef Kindler 3 1. Department of
Numerical Investigation of Flow Around Two Cylinders using Large-Eddy Simulation
 Numerical Investigation of Flow Around Two Cylinders using Large-Eddy Simulation Baraal Qays Mahdi M. Sc. Student, Mechanical Engineering, Department of Mechanical Engineering. Universiti Kebangsaan Malaysia,
SIMULATION OF TIP LEAKAGE FLOW AROUND PARTIAL SQUEALER RIMS IN AXIAL TURBINES
 SIMULATION OF TIP LEAKAGE FLOW AROUND PARTIAL SQUEALER RIMS IN AXIAL TURBINES Levent Kavurmacioglu 1, Debashis Dey 2 & Cengiz Camci 3 Department of Aerospace Engineering Turbomachinery Heat Transfer Laboratory
AERODYNAMIC CHARACTERISTICS OF NACA 0012 AIRFOIL SECTION AT DIFFERENT ANGLES OF ATTACK
 AERODYNAMIC CHARACTERISTICS OF NACA 0012 AIRFOIL SECTION AT DIFFERENT ANGLES OF ATTACK SUPREETH NARASIMHAMURTHY GRADUATE STUDENT 1327291 Table of Contents 1) Introduction...1 2) Methodology.3 3) Results...5
Journal of Engineering Science and Technology Review 9 (5) (2016) Research Article. CFD Simulations of Flow Around Octagonal Shaped Structures
 (2016) Research Article. CFD Simulations of Flow Around Octagonal Shaped Structures") Jestr Journal of Engineering Science and Technology Review 9 (5) (2016) 72-76 Research Article JOURNAL OF Engineering Science and Technology Review www.jestr.org CFD Simulations of Flow Around Octagonal
Jestr Journal of Engineering Science and Technology Review 9 (5) (2016) 72-76 Research Article JOURNAL OF Engineering Science and Technology Review www.jestr.org CFD Simulations of Flow Around Octagonal
Steady Analysis of NACA Flush Inlet at High Subsonic and Supersonic Speeds
 , July 1-3, 2015, London, U.K. Steady Analysis of NACA Flush Inlet at High Subsonic and Supersonic Speeds Taimur A. Shams 1, Masud J 2 Abstract Essence of this research is to report computational analysis
Investigation of the flow around uncambered airfoils at 1000 Reynolds number using computational fluid dynamics for micro air vehicles
 Investigation of the flow around uncambered airfoils at 1000 Reynolds number using computational fluid dynamics for micro air vehicles Emad Uddin 1), Muhammad Adil Naseem 2), Saif Ullah Khalid 3), Aamir
Keywords: dynamic stall, free stream turbulence, pitching airfoil
 Applied Mechanics and Materials Vol. 225 (2012) pp 103-108 Online available since 2012/Nov/29 at www.scientific.net (2012) Trans Tech Publications, Switzerland doi:10.4028/www.scientific.net/amm.225.103