In-Flight Flow Visualization Results of the F-106B with a Vortex Flap
|
|
|
- Junior Gordon
- 6 years ago
- Views:
Transcription
1 (SYA) 43-1 In-Flight Flow Visualization Results of the F-106B with a Vortex Flap Jay M. Brandon, James B. Hallissy, Philip W. Brown, John E. Lamar NASA Langley Research Center, MS 499, Hampton, VA 23681, USA SUMMARY Surface and off-surface flow visualization techniques were used to visualize the three-dimensional vortex flows on the F-106 aircraft with vortex flaps installed. Results at angles of attack between 9 to 18 and Mach numbers from 0.3 to 0.9 are presented. A smoke flow vapor screen technique was used to document leading-edge vortex paths and sizes, while an oil flow technique was employed to provide detailed information on reattachment and separation line locations and other flow details. Results were obtained for two vortex flap deflection angles, 30 and 40. Flow visualization revealed the existence of a multiple vortex system that had not previously been seen in subscale tests or predicted for this configuration. The vortex flap generated a leading-edge vortex system that reattached near the flap hinge over a wide angle of attack range. In addition to the primary vortex, flow visualization revealed the presence of several distinct vortices which traced a path from the vortex flap and then over the wing. INTRODUCTION The vortex flap concept repositions the wing leading-edge vortices such that they move from the wing onto the flap surface. The resulting induced suction pressures on the forward facing flap produce a thrust component that reduces drag. This concept has been examined in many experimental and theoretical studies 1-4 and has been found to be an effective method for improving the performance of highly swept configurations at maneuver lift coefficients. This technology shows promise in improving maneuvering performance of supersonic-cruise fighter configurations, as well as improving the take-off performance of high-speed civil transport airplane designs. As a result, considerable research has been conducted to develop analytical tools for the design of efficient and highly effective vortex flaps 5. A flight validation program was conducted at the NASA Langley Research Center using an F-106B testbed aircraft to verify the design tools and expected performance benefits for the vortex flap concept. The primary emphasis of the flight program was the measurement of pressure profiles along the vortex flap and wing to provide verification of design techniques. In addition, limited performance flight testing was accomplished with and without the vortex flap to obtain indications of performance increments which were obtained due to the flap. The flap was flown at two deflection angles as part of the validation process. Flow visualization data were obtained to verify the structure of the flowfield, and to aid in the interpretation of the flight test data. Off-surface flow visualization using a vapor screen system similar to that used previously 6 revealed an unanticipated flow field consisting of a multiple vortex system in addition to the leading-edge vortex positioned along the leading-edge flap. To further study the flow characteristics, surface flow visualization using oil coatings on the wing and flap were conducted. This report summarizes the flowfield characteristics observed with the vortex flap configurations over a wide range of angle of attack, Mach number, and sideslip. Paper presented at the RTO AVT Symposium on Advanced Flow Management: Part A Vortex Flows and High Angle of Attack for Military Vehicles, held in Loen, Norway, 7-11 May 2001, and published in RTO-MP-069(I).
2 Report Documentation Page Form Approved OMB No Public reporting burden for the collection of information is estimated to average 1 hour per response, including the time for reviewing instructions, searching existing data sources, gathering and maintaining the data needed, and completing and reviewing the collection of information. Send comments regarding this burden estimate or any other aspect of this collection of information, including suggestions for reducing this burden, to Washington Headquarters Services, Directorate for Information Operations and Reports, 1215 Jefferson Davis Highway, Suite 1204, Arlington VA Respondents should be aware that notwithstanding any other provision of law, no person shall be subject to a penalty for failing to comply with a collection of information if it does not display a currently valid OMB control number. 1. REPORT DATE 00 MAR REPORT TYPE N/A 3. DATES COVERED - 4. TITLE AND SUBTITLE In-Flight Flow Visualization Results of the F-106B with a Vortex Flap 5a. CONTRACT NUMBER 5b. GRANT NUMBER 5c. PROGRAM ELEMENT NUMBER 6. AUTHOR(S) 5d. PROJECT NUMBER 5e. TASK NUMBER 5f. WORK UNIT NUMBER 7. PERFORMING ORGANIZATION NAME(S) AND ADDRESS(ES) NATO Research and Technology Organisation BP 25, 7 Rue Ancelle, F Neuilly-Sue-Seine Cedex, France 8. PERFORMING ORGANIZATION REPORT NUMBER 9. SPONSORING/MONITORING AGENCY NAME(S) AND ADDRESS(ES) 10. SPONSOR/MONITOR S ACRONYM(S) 12. DISTRIBUTION/AVAILABILITY STATEMENT Approved for public release, distribution unlimited 11. SPONSOR/MONITOR S REPORT NUMBER(S) 13. SUPPLEMENTARY NOTES Also see: ADM001490, Presented at RTO Applied Vehicle Technology Panel (AVT) Symposium held inleon, Norway on 7-11 May 2001, The original document contains color images. 14. ABSTRACT 15. SUBJECT TERMS 16. SECURITY CLASSIFICATION OF: 17. LIMITATION OF ABSTRACT UU a. REPORT unclassified b. ABSTRACT unclassified c. THIS PAGE unclassified 18. NUMBER OF PAGES 34 19a. NAME OF RESPONSIBLE PERSON Standard Form 298 (Rev. 8-98) Prescribed by ANSI Std Z39-18
3 (SYA) 43-2 TEST AIRPLANE AND TEST TECHNIQUES Airplane Description The F-106B airplane used for this study is a two-seat version of a supersonic all-weather fighter/interceptor built by Convair in The airplane is powered by a Pratt and Whitney J-75-P-17 afterburning turbojet engine. The design features a 60 sweep delta wing planform (aspect ratio 2.20), with an area-ruled fuselage. The controls consist of elevons for pitch and roll control, and a rudder for yaw control, all using a conventional hydraulic non-reversible flight control system. The airplane wings were painted black to improve contrast during the flow visualization tests. The airplane was modified by the addition of vortex flaps to the leading edges of the wing. The vortex flap was ground adjustable to deflections of 20, 30, 40, and 50 degrees. The flaps were attached to the baseline airplane leading edge, and were made as a series of segments as shown in figure 1. The segments were required to allow for wing bending during flight, and were made to prevent airflow between segments and with as small as geometric discontinuities along the flap surface as possible. The vortex flap flight test validation program flew with the flaps set to 30 and 40. The test airplane was equipped with a flight test noseboom for accurate air data information, and extensive instrumentation for gathering surface pressure information over the right wing and flap, and to obtain standard flight test parameters of aircraft states and control positions in flight. These data were telemetered to a ground monitoring station real-time during the test flights, and recorded onboard using fm tapes. The airplane was fitted with a propylene glycol smoke generation system, and a rotating light sheet system which could illuminate a large extent of the wing surface. Surface oil flow testing was also conducted inflight. The left wing was used for all on and off-surface flow visualization tests. The right wing was outfitted to obtain surface pressure measurements. Smoke Injection System The flow visualization system (fig 2) consisted of two video cameras (one located on the engine intake, and one near the aircraft centerline aft of the canopy), a propylene glycol smoke generation system which consisted of a storage tank, vaporizer, heated hose, and smoke probe, and a rotating light sheet. The three gallon propylene glycol reservoir gave 45 minutes of smoke at a nominal pump speed. The pump speed could be controlled from the rear cockpit to produce the desired volume of smoke. Light Sheet and Video Recording Systems The light sheet package could be mounted on top of the airplane fuselage and consisted of a mercury-arc light which was converted to a light sheet using a.048" slit with knife-edges. The light sheet was directed over the wing using a system of lenses and a mirror. The light sheet azimuth was controllable from the rear cockpit and could illuminate portions of the wing from angles of 40 to 160 as shown in figure 3. The light sheet did not illuminate the surface of the flap due to the deflection angle of the flap. The rear cockpit was equipped with a video monitor that displayed the in-flight selected video camera data with time, angle of attack, and light sheet position superimposed at the bottom of the screen. These data were recorded on a super-vhs format video recorder, while the raw camera images for each camera were recorded with time code information separately on standard VHS recorders. Vapor Screen Test Technique and Flight Procedures Vapor screen flow visualization tests were conducted at night during periods of very low moon illumination. Test conditions for these data ranged from 5000 feet to feet altitude at 1-g flight conditions. Flight test points were also obtained at elevated g conditions to achieve desired α/mach combinations. These elevated g flight conditions were obtained at Mach numbers up to 0.95 and g levels up to 4 g's for the vortex flap airplane. The angle of attack range included in these tests was from α=7 to α=18.
4 (SYA) 43-3 Surface Flow Test Technique and Flight Procedures On-surface flow visualization was conducted using both oil flow and tuft techniques. The oil studies used a mixture of clear mineral oil, titanium dioxide, and oleic acid to provide white oil for contrast with the wing, which was painted black. The oil mixture was painted on the wing prior to take-off. One angle of attack condition was obtained per flight using this method. The oil flow portion of the flight typically was complete 10 minutes after takeoff. Tufts were also used for surface flow visualization on the wing and vortex flap. The tufts were plastic cones, approximately 3" long secured to the wing with string and tape. Surface flow visualization results were obtained primarily at 1-g flight at low altitudes (below 15,500 ft) with a chase plane in formation to obtain photographs of the oil or tuft patterns. Data were obtained from α=8 to α=18. VORTEX FLAP CONCEPT The concept of the vortex flap is to reposition the leading edge vortex system which normally develops over the wing at high angles of attack for high swept wings onto a forward facing flap surface. This results in a reduction of induced drag due to a thrust component derived from the vortex low pressure on the flap. The idealized flow conditions are sketched in figure 4. The vortex systems utilized in this concept are much weaker and less persistent than the familiar vortex systems seen in highly swept wing or strake planforms at high angles of attack, and one aspect of this research was to investigate how these vortex systems would behave under realistic flight conditions. Extensive wind tunnel and analytical work has been conducted in the development of design methodologies of vortex flaps. The flap flown on the F-106B was designed using methods of ref 5. The design process was used to design the flap for a leading-edge vortex reattachment point on the flap/wing hinge line at maneuvering lift coefficients. Wind tunnel test results conducted on various configurations (refs 7-9) validated the design methodology. Tests were also conducted on the F-106B with vortex flaps and also verified the design technique. Each of these tests showed a single leading-edge vortex system which was manipulated by the addition of vortex flaps. Proper design of the flap geometry resulted in the reattachment of the flow to occur near the flap hingeline. At high angles of attack, the vortex would migrate off the flap, over the wing surface, and finally the vortex would burst. FLIGHT TEST RESULTS The intersection of the camera field of view and the light sheet provided the vapor screen image data. Because flights were conducted on moonless nights, the outline of the wing is not visible in the data. By using a resectioning technique which involved calibration of the camera and light-sheet systems using known points on the wing, it was possible to calculate the position of the images in the vapor screen data relative to aircraft coordinates. This information could then be used to track the movement of the vortices with angle of attack, and also allowed the images to be superimposed on a mathematical representation of the airplane to aid in interpreting the data. The procedures used for the graphic analysis technique used are described in previous reports Brief further discussion of the techniques developed during this experiment for quantifying in-flight flow visualization data, and some examples of data for a baseline (no vortex flap) F-106B configuration are presented in the Appendix. 30 Vortex Flap The primary characteristic of the flow field is the existence of a system of multiple vortices that appear to originate on the vortex flap and then migrate off the flap to run nearly streamwise over the wing as another
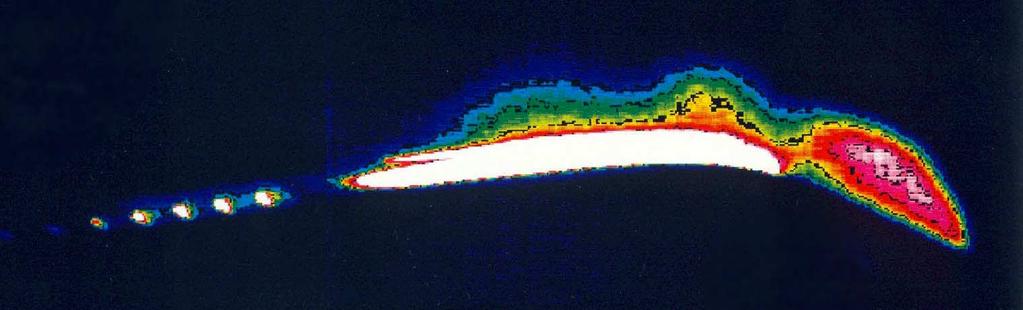
5 (SYA) 43-4 vortex builds on the flap. This pattern is repeated many times down the wing, depending on angle of attack. It should be noted that smoke was only injected at one location (near forward part of segment 2a), and smoke was transported down the span after vortex migrations were seen to go over the wing. This indicates that there was some spanwise flow transport even when a new vortex appeared to be formed. Figure 5 shows an example of a vapor screen image composite at an angle of attack of 9 degrees. Three distinct vortices are observed. At the most forward location, one vortex is forming on the flap surface, the second slightly inboard over the leading edge of the wing, and the third well inboard. The composite view of the vortices over the surface of the wing can be compared to the oil flow results shown in figure 6. The oil flow results confirmed the existence of a highly complex flow pattern with multiple vortex systems as observed during the vapor screen tests. It is seen that the primary flap vortex grows and the reattachment line reaches the wing leading edge midway in flap section 2a. This is indicated by the entrainment of oil that had flowed along the flap/wing leading edge juncture, which is then entrained in the vortex flow toward the flap leading edge. Looking further down the flap, the secondary separation line is clearly evident and at section 5b moves inboard off the flap to the wing. Under that peel-off, another vortex is formed which grows, and then peels off inboard at section 6b. Effect of Angle of Attack The primary characteristic of the flow field is the existence of a system of multiple vortices which appear to originate on the vortex flap and then migrate off the flap to run nearly streamwise over the wing as another vortex builds on the flap. This pattern is repeated many times down the wing, depending on angle of attack. The first shed vortex appears near 40 light sheet angle. A photograph taken during daylight with the smoke system running is shown in figure 7. This picture shows at α=9 the shedding process of the vortices leaving the flap surface and progressing over the wing surface. In this photograph, three vortices are seen to lift off the flap and go over the wing. The underlying surface flow corresponding to the shedding vortices is also evident from the flow cones attached to the flap. Due to the angle from which the photograph was taken, the cones that actually lie under the shedding vortices appear slightly outboard. As each vortex passes off the flap and onto the wing, the surface flow, as indicated by the cones, changes direction from nearly parallel to the wing leading edge to inboard along the path of the vortices. Looking more closely, figure 8 shows a repeating pattern down the flap at sections 2a, 2b, 3a, 4, and 5a. The pattern is evidenced by the distortion of the normal herringbone pattern characteristic of a vortex scrubbing on a surface. These distortions probably indicate the influence of a peeling vortex and the growth of a new vortex underneath. Section 3a shows a clear discontinuity in the secondary separation line as does section 5b and 6b clearly indicating the formation of a new vortex. The oil flow data also showed that in general, the vortex reattachment line was near the wing/flap attachment line, which was the design philosophy for the flap. Figure 9 shows an approximation of the vortex paths over the wing based on the centroid of the smoke flow seen from both side and top camera views. The process used to determine the vortex paths from the vapor screen images is discussed in the appendix. It is important to note that the positions of the vortex over the flap include only that portion of the vortex visible in the light sheet, and in reality, if the complete vortex could be seen, it would probably show the vortex more outboard over the surface of the flap. Four vortex paths were seen. The furthest inboard vortex was seen only at one light sheet station (depicted as one symbol) just inboard of the wing leading edge. Two downstream vortices are seen to co-exist on the flap for a short distance before streaming aft over the wing. Finally, a fourth vortex path is observed on the flap surface outboard. At α=9, no further vortices are seen aft on the wing, probably due to the small relative size of the vortices, and smoke entrainment and volume of smoke issues, however, as previously noted, the surface oil flow data show continued vortex activity down the length of the flap. The agreement between the observed surface flow information and off-surface core location is very good. Additionally, the surface flow data show the streamwise secondary separation lines originating each time near a discontinuity on the vortex flap surface - i.e. at a flap joint. Based on the surface flows, the vortex shedding process occurred several more times outboard on the flap.
6 (SYA) 43-5 Figure 10 shows the composite result of the vapor screen data at α=11. Here, the top portions of some of the vortices are seen above the flap surface, in addition to the shed vortices over the wing surface. The data show good representation of 3 vortices trailing back nearly streamwise over the wing surface. The growth of the vortices on the flap before turning streamwise is also shown. The vortices on the flap surface are larger than was seen at α=9 at each lightsheet location. Again, as was seen at α=9, the smoke/light combination did not allow visualization of the vortex system on the outboard portions of the wing, or on the flap surface. A sketch of the vortex paths at α=11 is shown in figure 11. Three vortex paths are observed in the data, similar to the α=9 case, however vortex paths are visible further down the length of the flap. The spanwise positions of the vortices and the locations at which the vortices cross over from the wing to the flap are slightly inboard compared to the α=9 condition. Figure 12 shows the composite results of the vapor screen data at α=13. At this angle of attack, the vortices have grown in size, and are visible higher above the flap surface than for the lower angles of attack. Again, similar characteristics, of the vortex growing on the flap and then shedding over the surface of the wing are seen. Figure 13 shows the corresponding surface oil flow patterns. At α=13, the secondary separation line is further inboard from the flap surface compared to the lower angles of attack. Distortions in the oil flow patterns signal the shedding process, but are less apparent than for the lower angles of attack. At this angle of attack, the reattachment of the flap vortex is well up onto the wing by section 4. Also, the secondary separation line has moved well inboard of the leading edge of the flap. The changes in the location of the secondary separation line at the beginning of segment 2a, middle of segment 2b and beginning of segment 3a are consistent with the multiple systems seen in the vapor screen images though the movements of the secondary separation line are far less dramatic than seen in the previous conditions. Additionally, streaks on the wing surface track back to the discontinuities in the secondary separation line and also correlate with the positions of the systems seen in the vapor screen data. Figure 14 shows the apex area of the flap and wing in more detail. The primary flap vortex reattachment reaches the leading edge of the wing just prior to segment 2, and then moves onto the wing, indicating a higher angle of attack than design. Also, it is interesting to note that the flow outboard of the secondary separation line is parallel to the leading edge of the flap. The vortex path locations, shown in figure 15 are very similar to those seen at α=11. Again, 3 vortices are evident originating from the flap, proceeding a short distance down the flap and then turning streamwise over the wing surface. The location of the separation lines in the oil flow results and the core paths show excellent agreement again. At this angle of attack, streamwise secondary separation lines were not evident on the flap, however bending of the secondary separation line after the flap joints beginning segments 2b and 3a indicate a flow protuberance probably associated with the streamwise vortex phenomenon. This weak interaction on the surface flow indicate that at high angles of attack, the streamwise vortices consist of a portion of the leading edge vorticity which becomes lifted significantly off the surface of the flap before streaming aft. The third vortex remains on the flap surface until disappearing from view due to the insufficient contrast. The oil flow results were inconclusive in determining if additional streaming vortices existed over the wing. Figure 16 shows the composite result of the vapor screen data at α=15. At this angle of attack, the flow condition is similar to that at α=13, but the vortices have grown in size. Again, the flow is comprised of 2 vortices over the forward portion of the wing. Outboard, the vortex over the vortex flap grows and moves inboard. Concurrent with the inboard shift of the most outboard vortex, the inboard vortex disappears, which may indicate that the 2 vortex systems have merged. At the far outboard portion of the wing, the vortex is barely visible, probably because the larger vortex system inboard diffused the seeding smoke such that little smoke density was left at the aft or outboard locations. The vortex path locations are shown in figure 17. An interesting feature of the flow is that increasing angle of attack does not significantly affect the span-wise location of the vortices as they trail over the wing. At each angle of attack, 3 vortices were seen over the flap and wing (one additional vortex was seen at the point nearest the apex at α=9 ). The spanwise locations of the vortices near their originations are nearly identical
7 (SYA) 43-6 to the α=13 case. Progressing aft, the most inboard vortex appears to be merging with the adjacent vortex. Further aft, the combination of the two most inboard vortices may merge with outboard vortex, although the inflight images were inconclusive. The outboard vortex is much larger than it was at α=13, and moves inboard over the wing surface. Effect of Sideslip The effect of sideslip was to effectively reduce or increase the sweep angle of the wing. Because the vortex flaps were designed specifically for 60 sweep angle, the performance of the flap would be expected to decrease as sweep angle was varied. Comparisons of the effect of sideslip will be made by individual light sheet location data. Only two sets of data were available at comparable angles of attack and sideslip for analysis from the flight program. These were at α=11, and one point at β=7 at a lightsheet angle of 88, and one condition at β=-7 at a lightsheet angle of 58. Figure 18 shows the effect of negative sideslip at α=11, and a lightsheet angle of 58 (near the forward section of the wing and flap). These data were recorded on the wing apex camera. At negative sideslip, the data show 3 distinct vortices compared with the larger, less defined structure at β=0. At β=0, the leading-edge vortices have started merging together on the surface of the wing at this lightsheet position. At β=-7, they have not yet coalesced, so the structure corresponds to a lower effective angle of attack condition. A positive sideslip condition comparison is shown in figure 19. These data were recorded on the top view camera. Comparing the images at a lightsheet location of 88 and α=11 for β=7 with corresponding β=0 data shows that the positive sideslip resulted in a larger flap vortex which corresponds to an increase in effective angle of attack. At sideslip, not only is the vortex on the surface of the flap (furthest right in the figure) larger than at zero sideslip, but the track of the shed vortex on the wing (second from right) is closer to the flap as well. The inboard vortex shed over the surface of the wing seen at zero sideslip is not well defined at the positive sideslip condition. 40 Vortex Flap Effect of Angle of Attack Similar flow patterns were observed for the 40 flap deflection angle as were previously seen for the 30 deflection, however the larger deflection angle tended to increase the angle of attack for similar flow conditions, and many more distinct vortices were visible as the light sheet swept aft. Figure 20 shows an example of a composite view of the vapor screen data at α=11. The 40 vortex flap proved even more susceptible to the multiple vortex system/vortex shedding phenomena than the 30 flap. Figure 21 shows the oil pattern at α=10 showing the discontinuity of the secondary separation line and the path of the shedding vortex over the flap onto the wing occurring at every flap joint. It is postulated that the small geometric discontinuity between flap segments was a trigger to initiate the vortex shedding. The joints between segments were taped on some flights to prevent the possibility of air from spilling between segments, however no difference in the oil flow or smoke patterns were noted. In addition to the shedding vortex paths at most of the flap joints, this figure also indicates an apparent shed vortex approximately twothirds back on segment 1 (light oil streak line running from secondary separation line near flap leading-edge and going up over the wing in a nearly streamwise direction), where there is no obvious geometric discontinuity. At α=11 (figures 22 and 23), the oil flow results are very similar to α=10, except the streamwise streak lines on segments 3a and 4 are much more diffuse, indicating a different flow pattern developing as the angle of attack is increased. Figure 22 shows the forward portion of the flap at α=11. The photograph shows that the flap vortex reattachment line is generally on the flap surface. Streamwise streak lines indicating shed vorticity are seen emanating from the leading edge of each flap segment starting with 2a.
8 (SYA) 43-7 Discontinuities in the secondary separation line are visible in sections 2b and 3b. Figure 23 shows the aft half of the flap at 11. Indications of shed vortices are again seen in each segment of the flap. Segment 5b shows a large discontinuity in the secondary separation line. The vortex-shedding pattern continues through the last flap segment. It should be noted that although clearly multiple vortices are being shed over the sing surface from the vortex flaps, the existence of a spanwise flow transport mechanism still existed (since smoke could be seen at outboard wing and flap locations). Figure 24 shows the composite view of the vapor screen results at α=13. The smoke flow indicate very similar patterns, with the multiple vortices shed off the flap and over the wing, as seen in the α=11 data. The vortex size is increasing with the increase of angle of attack, and now the top of one of the vortices on the vortex flap can be seen at a lightsheet angle of 88. Figure 25 shows the oil flow pattern at α=13. The primary reattachment line is very near the flap/wing junction indicating that the flow on the flap is at near design conditions. Again, discontinuities are seen in the secondary separation line, which has become very wide, and possibly a pooling of oil from more than one vortex, at every flap segment. The distortion of the herringbone patterns on the flap surface is evident in segments 2b, 3b, 5a, 5b, 6a and 6b. The absence of distortions in the herringbone pattern on some of the segments, especially segment 3a is puzzling since the vapor screen images showed vortex systems which would be emanating from this area, and a trace of oil is seen on the wing inboard of this flap segment. The secondary attachment line in segment 3a shows part of it starting from 0% chord at the leading edge of segment 3a. Figure 26 shows the composite view of the vapor screen images at α=15. At this angle of attack, the vortex size has increased again, and up to seven vortices can be seen on the aft portion of the wing. The larger deflection of the vortex flap, in addition to possible small vortex size on the flap before shedding, results in no vortices being seen in the lightsheet flow visualization over the inboard segments of the flap. The oil flow data (figure 27) indicate the primary reattachment line was well up onto the wing. The secondary separation line shows discontinuities in its path which are evident near each flap segment joint through segment 3b. Figure 28 shows a closer view of the forward half of the flap. A sharp discontinuity in the secondary separation line is evident at segment 2a. The herringbone pattern distortion is evident only in section 3b, however the streaks over the wing indicative of a vortex path seen in this figure and previously in figure 27 correlate well with the observed vapor screen data. The changes in path direction of the secondary separation line (near the flap leading edge) have indicated changes in the vortex structure. This, along with the oil streaks seen on the wing surface, indicate that some shedding of the vortex flow is occurring, although perhaps not as strongly as seen at the lower angles of attack. Possibly, the vortex systems are beginning to merge into fewer discrete shedding vortices at this point. The composite view of the vapor screen data corresponding to α=18 is shown in figure 29. At this angle of attack, the vortex systems have merged on top of the wing into two large vortices. Effect of Mach Number It is well known that Mach number can play an important role in vortical flowfield strength. Data were obtained at transonic conditions to attempt to visualize flowfield differences. At the higher Mach numbers, due to colder temperatures resulting from higher altitudes required, and due to higher airspeeds, less smoke was available to entrain in the vortex system. As Mach number was increased to from 0.80 to 0.90 at a constant angle of attack of 11, the vortices observed on the wing appeared to lift slightly higher off the wing surface, and grow slightly in size. Due to the conditions mentioned, and the few test points that were flown, detailed data were not obtained to accurately assess the effects of Mach on effects of the vortex formation across angle of attack, or details above the surface of the vortex flaps.
9 (SYA) 43-8 Effect of Reynolds Number Previous work conducted on the baseline F-106 (without the vortex flaps) showed a dominant effect of Reynolds number on the formation, growth and character of the vortex system over the wing 6. Those results showed that at low Reynolds numbers, vortex formation began at lower angle of attack than at high Reynolds numbers. Additionally, the unmodified wing developed a multiple vortex system similar to that seen with the vortex flaps, however at the lower Reynolds numbers, fewer individual streaming vortices were formed. The location of the vortices at low Reynolds numbers was found to be inboard of the corresponding vortices at higher Reynolds numbers. With the vortex flap, aerodynamic characteristics over the wing were found to be qualitatively invariant with Reynolds number over the range for which the flights were flown. The high altitude data shows less contrast than the low altitude data due to the decreased performance of the propylene glycol system at reduced atmospheric pressures and temperatures, however the overall flowfield characteristics remain unchanged. Planform views of the vortex positions over the wing are shown in figures comparing the high and low Reynolds number data. Figure 30 shows the vortex positions at α=13. Comparison of the data at 46 and 33 million Reynolds number shows nearly identical vortex placement on the surface of the wing. At α=15, (figure 31), the 42 million Reynolds number data shows the vortex positions to be slightly inboard of the vortex positions at 29 million Reynolds number. Both sets of data still exhibit the same number of shedding vortices, (7), and they follow similar paths down the wing. At high angles of attack, (figure 32), the 27 million Reynolds number data at α=17 maintains 3 separate vortices over the wing, whereas the 37 million Reynolds number data at α=18 shows only 2. This may be an indication of flow sensitivity to angle of attack rather than Reynolds number. Flight Data Discussion Analysis of the surface flow visualization results showed two primary flow patterns. These are illustrated in figure 33. Both patterns show an apparent pooling of the oil along a line oriented in a nearly streamwise direction on the flap, and both patterns exhibit turning of the flow (streak lines) from an outboard orientation (characteristic of lying beneath a vortex) to an orientation nearly parallel to the flap hinge inboard of the disturbance line. The type-1 pattern (an example in fig 8, segment 5b) shows the streak lines continue to turn toward a streamwise direction as they near the disturbance line. This is consistent with the disturbance line indicating the secondary separation of a vortex path that has left the flap surface, and is shedding streamwise over the wing. Outboard of this streamwise pool of oil (disturbance line) is a region of strong shear flow where little or no detail can be seen in the oil flow data. After the disturbance, the secondary separation line outboard of the disturbance is repositioned very close to the flap leading edge indicating that the vortex outboard of the disturbance seems to have started from zero size. However, as previously mentioned, since smoke flow details were observed aft of these disturbances, some flow mechanism existed to enable spanwise flow across the areas of vortex shedding. The type-2 pattern (an example in fig 6, segment 2b), generally has a less pronounced disturbance flowing streamwise, and the streak lines under the leading-edge vortex turn sharply back toward the leading edge before resuming the normal vortical flow pattern. This flow results in the appearance of a slight pooling of oil along the streamwise disturbance line, but there appears to be no net surface flow in the streamwise direction along that line except in the vicinity of flow reattachment where the steak lines from inboard continue to turn toward a streamwise direction and flow aft onto the wing. The secondary separation line aft of the disturbance does not reposition as close to the flap leading edge as seen with the type-1 pattern. It is not clear if this type-2 flow resulted in the development of a new leading-edge vortex system, or in a modification of the vortex system that existed further inboard on the wing. Analysis of the data showed that in general, for low angles of attack, the type-1 vortex pattern dominated the flowfield characteristics. As angle of attack was increased, and the leading-edge vortex grew in size, the type-1 pattern transitioned to the type-2 pattern. As angle of attack was further increased, the type-2 pattern became less pronounced, and the flow began to be dominated by one or two leading-edge vortices.
10 (SYA) 43-9 Examinations of the flight results showed that the multiple streamwise vortices observed above the wing originated at the flap leading edge where individual flap segments were joined. Oil flow studies were conducted with the joints sealed with fabric-backed tape to prevent air leakage, and showed essentially the same results. These data indicate that the small geometric perturbations along the leading edge were sufficient to generate a leading-edge flow that was very complex and significantly different in details than that observed previously in wind tunnel model tests and in CFD calculations. The major purpose for developing the vortex flap was to improve the lift-to-drag ratio at high maneuvering lift coefficients. Despite the strikingly different flow field developed on the airplane compared to CFD and wind tunnel predictions, the overall effectiveness of the flaps were very close to predictions. A comparison between flight and wind tunnel / simulation results of the maximum sustained load factor achievable at an altitude of 30,000 feet at maximum power is shown in figure 34. The data show that the vortex flap addition clearly improved transonic maneuvering capability, and the improvements were very close to predictions. POST FLIGHT WIND TUNNEL INVESTIGATION After observing the unpredicted vortex topologies in flight, an F-106 wind tunnel model was tested in the Langley 7-by-10 Foot High-Speed Tunnel 12. Flow visualization tests were conducted using a surface oil flow test technique at low subsonic speeds. All previous wind tunnel tests had shown a single leading-edge vortex system along the flap, as predicted by the design methodology. During storage of the model, some minor damage in the form of small dents and nicks had occurred to the flaps. Since leading-edge discontinuities were believed to be at least partially responsible for the multiple vortices seen in flight, these dents were not repaired prior to the tests. It was found during the test that the dents, or the subsequent application of tape flow trips, would provide sufficient perturbation for the shedding of vortices and formation of the multiple vortex system seen in flight. The extremely small perturbation size indicated that with normal manufacturing tolerances, it might be impossible to avoid the multiple vortex patterns seen in flight on a full-scale airplane with leading-edge devices similar to vortex flaps. Examples of wind tunnel data results are shown in figures 35 and 36. CONCLUDING REMARKS Flow visualization studies were conducted on the F-106 vortex flap airplane to aid in the validation of vortex flap design tools. Surface flow visualization (oil and cones) and off-surface flow visualization (vapor screen) techniques were employed. Data were obtained at angles of attack from 7 to 18 and Mach numbers from low subsonic to The primary feature observed was the presence of multiple vortex systems over the flap. Both configurations tested showed similar qualitative results with vortices developing on the flap and then shedding over the wing. Small geometric discontinuities appeared to trigger the shed vorticity, however, the flap surface appeared to have a vortex along its span. The vapor screen data showed clearly the vortex on the flap growing with angle of attack and also as it moved downstream. Then, the flap vortex would shed off of the flap and progress nearly streamwise over the surface of the wing. Immediately under the shed flap vortex, a vortex began its growth on the flap surface and repeated this pattern of shedding many times down the length of the flap. Two flow field mechanisms appeared to exist on the flap surface. At lower angles of attack, a very distinct vortex shedding and vortex formation pattern appeared several times down the span. At higher angles of attack, generally a less distinct surface flow pattern was observed, however the offsurface flow visualization indicated similar vortex flow shedding pattern over the wing. A span-wise flow transport mechanism existed across the span of the flaps, even with the shedding vortices, as evidenced by smoke entrainment visible over most of the span of the wing. Reynolds number effects, seen previously on the unmodified F-106 wing, were not evident with the sharp leading edge vortex flaps. Performance flight test results and subsequent wind tunnel studies showed that the effects of the unpredicted multiple vortex pattern appeared to be small, and confirmed hypothesis of small discontinuities being the trigger for the shed vortices.
11 (SYA) Appendix on Flight Flow Visualization for Baseline F-106B Aircraft Discussion: The baseline aircraft, i.e. without vortex-flap, was tested at the end of the vortex-flap program using the same rotating vapor-screen technique rotating light-sheet, on-board propylene-glycol-vapor-seedingsystem and two video cameras coupled with image enhancement, photogrammetry, and computer graphics. The purpose of the test was to provide understanding as to the origin of the multiple-primary vortices discovered during a prior test (ref. 6) of the baseline aircraft using a fixed light-sheet. Sample false-color 2D results from reference 11 have been mapped onto the aircraft numerical-surfacegeometry in 3D space as shown in figure A1. This figure demonstrates the utility of the rotating light sheet to provide global vortex information. From this figure, one can see evidence of a coherent vortex the vortex core in each 2D image is essentially the brighter region to form above this round-edged camberedwing and to trail aft. Moreover, this vortex leaves its feeding sheet where a new and un-visualized offsurface vortex forms in the vicinity of the leading-edge slot an aerodynamic fence. Vortex properties of core and reattachment-point locations can be extracted from the 2D vapor-screen images of figure A1 by the methods outlined in figure A2. The core locations are determined by computer software which calculates a weighted average of the gray scale values of the reflected light in a user controlled, circumscribed region. The preceding was done because this cambered wing (with its round leading edge) tends to produce a diffuse vortex system, one in which the propylene-glycol condensedparticles do not revaporize in the core but merely concentrate (ref. 6). The determined location from this process is a centroid and is called the vortex core. Using vapor-screen data to find an approximation of the reattachment point is not as straightforward, because, as shown in figure A2, the vapor particles provide only an envelope or filled outline of the vortex system. For results presented here, the core-locating software has been applied to determine the most inboard edge (inner extent) of the envelope. By projecting this portion of the vortex envelope to the wing upper surface, a track of the inboard extreme can be established. This surface location of the inner extent of the envelope can be used as an approximation of the reattachment point. The rational for this statement is based on a study of figure A3 (See refs. 13 and 14). This led to a hypothesis that the lateral difference between the projected vortex envelope and reattachment point is small. Further discussions regarding this technique and potential sources of errors for determining the reattachment point using off-surface flow visualization data are included in reference 11. Even with potential sources of error, this technique still provides a rational basis for estimating the reattachment location in those situations where surface techniques are not available. Comparisons with oilflow results are presented in an attempt to gauge the reliability of this technique. The resulting vortex-system core location(s) and reattachment point(s) for each image can be located (mapped) in 3D space through the process of photogrammetric reconstruction (See ref. 11). Hence, these results can be displayed as surface tracks mapped onto the wing planform; also, the distances to the local leading edge can be calculated along the light sheet for each rotation angle, Φ. Examples are given next. Once vortex features can be quantified on the surface, other parametric studies can be done. For example, figure A4 shows the impact of altitude (Reynolds number - R n ) on the distance along a light-sheet ray of the outermost vortex core to the local leading-edge (l) for this aircraft at 1g, as determined from vaporscreen processing. The general trend of l is to be displaced inboard over the middle angle-of-attack (α) range with increasing altitude. The altitude increase is associated with a reduction in R n. Therefore, the inboard
12 (SYA) movement is reasonable because of flow separation and vortex merging occurring at the smaller α s at the lower R n s. This effect of lower R n results in the outermost vortex system tending to be a single vortex at a moderate α. Further, this system is likely to be larger and to have its core location more inboard. Conversely, for the higher R n (occurring at the lower altitudes) a delay occurs in the separation process leading to vortex formation. Consequently, to maintain a fixed value of l as altitude decreases, α must increase. At Φ = 100 there is an outward movement of the core at the lower values of alpha. For these maneuvers, R n and α are inversely related and the l curves reflect this behavior. These projected vortex-feature tracks can be compared with other data sources, such as oil-flow and pressure coefficient. Figure A5 shows a comparison with flight oil-flows. The dominant-vortex reattachment lines are in good agreement near Fuselage Station (FS) 490 and Butt Line (BL) 100, and the core track is well positioned with respect to the streak lines, although it is outboard of the closest secondary separation line. The surface streak lines do not indicate the presence of the inboard vortex determined from the images. Figure A6 shows a similar comparison but here with the upper-surface pressure coefficient (C p,u ) data. This figure shows good correlation over the middle part of the wing between the core tracks and the pressure peaks, including the second peak of belt-set 3. [Note that in order to compare these two different kinds of results, the pressure-port locations associated with the peak surface pressures must be used.] Concluding Remarks: The conclusion from this appendix is that optical methods can be used in flight to provide aircraft flow features both on- and off- the surface and that they are worth the effort for increased flow understanding of other measured or predicted results.

13 (SYA) Figure A1. Three-dimensional representation of vortex-system images and characteristics on F-106B numerical surface geometry. (Note that paint lines occur on left wing but are displayed on right wing here, reflected about centerline, to show complete set of pertinent features represented in surface geometry.)
14 (SYA) Top Camera Image Vortex envelope Core Leading edge Light sheet footprint Reattachment point Side Camera Image Vortex envelope Core Leading edge Reattachment point Light sheet footprint Figure A2. Illustration of reattachment-point location using a computer software (graphics) procedure.
15 (SYA) Z α V Y X Secondary vortex Werle' (ref. (ref.13) 11) Reattachment line Secondary separation, laminar boundary layer Secondary separation, turbulent boundary layer Streamlines Gregoriou (ref. (ref. 12) 14) Figure A3. Representative sketches of off-surface vortex systems and associated surface flow. Altitude, ft LE l 50 Φ = Φ = 60 ι, in Flight positions 0 50 Φ = Φ = 90 Φ = ι, in Φ = Φ = FS ι, in BL α, deg α, deg Figure A4. Effect of altitude (R n ) on distance from outermost (vapor-screen) to local leading-edge along light-sheet ray at 1g for F-106B aircraft.
16 (SYA) Core location (vapor screen) Reattachment (vapor screen) Streak line (oil flow) Separation (oil flow) Reattachment (oil flow) Reattachment (oil flow) 490 FS BL Figure A5. Superposition of projected vapor-screen results on oil-flow patterns with streak lines. F-106B; α = ; M = 0.29; R n = Belt-set 3 Cp,u Core FS 450 Cp,u -1 0 Cp,u Cp,u BL Figure A6. Superposition of projected vapor-screen core tracks on C p,u. F-106B; α = ; M = 0.41; R n =
17 (SYA) REFERENCES 1. Rao, Dhanvada M.: Leading-Edge Vortex Flaps for Enhanced Subsonic Aerodynamics of Slender Wings. ICAS , Oct Lamar, John E.; Campbell, James F.: Vortex Flaps Advanced Control Devices for Supercruise Fighters. Aerospace America, vol. 22, no. 1, Jan. 1984, pp Campbell, J.F.; and Osborn, R.F.: Leading-Edge Vortex Research: Some Nonplanar Concepts and Current Challenges. Vortex Flow Aerodynamics, Volume I, James F. Campbell, Russell F. Osborn, and Jerome T. Foughner, Jr., eds., NASA CP-2416, 1986, pp Yip, Long P.; and Murri, Daniel G.: Effects of Vortex Flaps on the Low-Speed Aerodynamic Characteristics of an Arrow Wing. NASA TP-3106, Frink, Neal T.: Refinements of a Vortex Flap Design Method With Systematic Applications. Vortex Flow Aerodynamics, Volume III, James F. Campbell, Russell F. Osborn, and Jerome T. Foughner, Jr., eds., NASA CP-2418, 1986, pp Lamar, John E.; and Johnson, Thomas D.: Sensitivity of F-106B Leading-Edge-Vortex Images to Flight and Vapor-Screen Parameters. NASA TP-2818, June Frink, N. T.; Huffman, J.K.; and Johnson, T.D.,Jr.: Vortex flap flow reattachment line and subsonic longitudinal aerodynamic data on 50 deg to 74 deg Delta wings on common fuselage. NASA TM , Dec Bare, E.A.; Reubush, D.E.; and Haddad, R.C.: Flow field over the wing of a delta-wing fighter model with vortex control devices at Mach 0.6 to 1.2. NASA TM-4296, April Frink, N.T.: Subsonic wind-tunnel measurements of a slender wing-body configuration employing a vortex flap. NASA TM-89101, July Stacy, Kathryn; Severnce, Kurt; and Childers, Brooks A.: Computer-Aided Light Sheet Flow Visualization Using Photogrammetry. NASA TP-3416, Lamar, John E.; Brandon, Jay M.; Stacy, Kathryn; Johnson, Thomas D., Jr.; Severence, Kurt; and Childers, Brooks A.: Leading-Edge Vortex-System Details Obtained on F-106B Aircraft Using a Rotating Vapor Screen and Surface Techniques. NASA TP-3374, Nov Hallissy, James B.; Schoonover, W. Elliott, Jr.; Johnson, Thomas D., Jr.; and Brandon, Jay M.: Wind- Tunnel Investigation of the Multiple Vortex System Observed in Flight Tests of the F-106B Vortex Flap Configuration. NASA TP-3322, Dec Werlé, H.: Aperçu cu sur les Possibilités Expérimentales du Tunnel Hydrodynamique a Visualization de l O.N.E.R.A. ONERA Tech. Note 48, Gregoriou, Gregor: Modern Missile Design for High Angle-of-Attack. AGARD-LS-121/5, March 1982.
18 Figure 1. Vortex flap construction details. (SYA) 43-17


19 (SYA) Figure 2. Vapor screen flow visualization system. Figure 3. Lightsheet azimuth coverage over the wing surface.


20 (SYA) Figure 5. Vapor screen image composite, α = 9, 30 vortex flap. Figure 4. Vortex flap concept. Figure 6. Oil flow results at α = 9, 30 vortex flap.


21 (SYA) Figure 7. Daytime smoke, α = 9, 30 vortex flap. Figure 8. Oil flow patterns, α = 9, 30 vortex flap.

22 (SYA) Figure 9. Vortex paths, α = 9, 30 vortex flap. Figure 11. Vortex paths, α = 11, 30 vortex flap. Figure 10. Vapor screen composite, α = 11, 30 vortex flap. Figure 12. Vapor screen composite, α = 13, 30 vortex flap.


23 (SYA) Figure 13. Surface oil flow patterns, α = 13, 30 vortex flap. Figure 14. Detail of apex area, α = 13, 30 vortex flap.


24 (SYA) Figure 15. Vortex paths, α = 13, 30 vortex flaps. Figure 17. Vortex paths, α = 15, 30 vortex flaps. Figure 16. Vapor screen composite α = 15, 30 vortex flaps.

.")
.")
25 (SYA) Figure 18(a). View of vortex at lightsheet position of 58, α = 11, β = 0, 30 vortex flap. Figure 18(b). View of vortex at lightsheet position of 58, α = 11, β = -7, 30 vortex flap. Figure 19(a). View of vortex at lightsheet position of 88, α = 11, β = 0, 30 vortex flap. Figure 19(b). View of vortex at lightsheet position of 88, α = 11, β = +7, 30 vortex flap.

26 (SYA) Figure 20. Vapor screen composite, α = 11, 40 vortex flaps. Figure 21. Oil flow patterns, α = 10, 40 vortex flaps.


27 (SYA) Figure 22. Oil flow patterns, α = 11, 40 vortex flaps. Figure 23. Oil flow patterns on outboard segment of wing, α = 11, 40 vortex flaps.

28 (SYA) Figure 24. Vapor screen composite, α = 13, 40 vortex flaps. Figure 25. Oil flow patterns, α = 13, 40 vortex flaps.


29 (SYA) Figure 26. Vapor screen composite, α = 15, 40 vortex flaps. Figure 27. Oil flow patterns, α = 15, 40 vortex flaps. Figure 28. Detail of forward sections of the vortex flap, α = 15, 40 vortex flaps.
. Vortex paths, α = 13, 40 vortex flaps, Re = 46 x 10 6, Mach = 0.26.")
30 (SYA) Figure 29. Vapor screen composite, α = 18, 40 vortex flaps. Figure 30(b) - Vortex paths, α = 13, 40 vortex flaps, Re = 33 x 10 6, Mach = Figure 30(a). Vortex paths, α = 13, 40 vortex flaps, Re = 46 x 10 6, Mach = Figure 31(a) - Vortex paths, α = 15, 40 vortex flaps, Re = 42 x 10 6, Mach = 0.27.
31 (SYA) Figure 31(b) - Vortex paths, α = 15, 40 vortex flaps, Re = 29 x 10 6, Mach = Figure 32(b) - Vortex paths, α = 18, 40 vortex flaps, Re = 27 x 10 6, Mach = Figure 32(a) - Vortex paths, α = 18, 40 vortex flaps, Re = 37 x 10 6, Mach = 0.24.
32 Figure 33. Flowfield sketch (SYA) 43-31


33 (SYA) Figure 34. Sustained load factor at maximum power, altitude = 30,000 ft Figure 35. Original oil flow results in tunnel investigation, α = 11. Figure 36. Oil flow results with trips corresponding to flap segment locations, α = 11
Lift for a Finite Wing. all real wings are finite in span (airfoils are considered as infinite in the span)
") Lift for a Finite Wing all real wings are finite in span (airfoils are considered as infinite in the span) The lift coefficient differs from that of an airfoil because there are strong vortices produced
Lift for a Finite Wing all real wings are finite in span (airfoils are considered as infinite in the span) The lift coefficient differs from that of an airfoil because there are strong vortices produced
STUDIES ON THE OPTIMUM PERFORMANCE OF TAPERED VORTEX FLAPS
 ICAS 2000 CONGRESS STUDIES ON THE OPTIMUM PERFORMANCE OF TAPERED VORTEX FLAPS Kenichi RINOIE Department of Aeronautics and Astronautics, University of Tokyo, Tokyo, 113-8656, JAPAN Keywords: vortex flap,
Stability & Control Aspects of UCAV Configurations
 Stability & Control Aspects of UCAV Configurations Paul Flux Senior Aerodynamicist BAE SYSTEMS Air Programmes Report Documentation Page Form Approved OMB No. 0704-0188 Public reporting burden for the collection
IMPACT OF FUSELAGE CROSS SECTION ON THE STABILITY OF A GENERIC FIGHTER
 IMPACT OF FUSELAGE CROSS SECTION ON THE STABILITY OF A GENERIC FIGHTER Robert M. Hall NASA Langley Research Center Hampton, Virginia ABSTRACT Many traditional data bases, which involved smooth-sided forebodies,
AN EXPERIMENTAL INVESTIGATION OF SPILLING BREAKERS
 AN EXPERIMENTAL INVESTIGATION OF SPILLING BREAKERS Prof. James H. Duncan Department of Mechanical Engineering University of Maryland College Park, Maryland 20742-3035 phone: (301) 405-5260, fax: (301)
The subsonic compressibility effect is added by replacing. with
 Swept Wings The main function of a swept wing is to reduce wave drag at transonic and supersonic speeds. Consider a straight wing and a swept wing in a flow with a free-stream velocity V. Assume that the
Inlet Influence on the Pressure and Temperature Distortion Entering the Compressor of an Air Vehicle
 Distortion Entering the Compressor of an Air Vehicle P. Hendrick Université Libre de Bruxelles, ULB Avenue F.D. Roosevelt, 50 1050 Brussels BELGIUM patrick.hendrick@ulb.ac.be ABSTRACT One of the possible
ANALYSIS OF AERODYNAMIC CHARACTERISTICS OF A SUPERCRITICAL AIRFOIL FOR LOW SPEED AIRCRAFT
 ANALYSIS OF AERODYNAMIC CHARACTERISTICS OF A SUPERCRITICAL AIRFOIL FOR LOW SPEED AIRCRAFT P.Sethunathan 1, M.Niventhran 2, V.Siva 2, R.Sadhan Kumar 2 1 Asst.Professor, Department of Aeronautical Engineering,
Using SolidWorks & CFD to Create The Next Generation Airlocks
 Using SolidWorks & CFD to Create The Next Generation Airlocks Matthew Gaffney Mechanical Engineer Geo-Centers, INC US Army Natick Soldier Center Natick, MA 01760 508-233-5557 Matthew.gaffney@natick.army.mil
Anna University Regional office Tirunelveli
 Effect of Tubercle Leading Edge Control Surface on the Performance of the Double Delta Wing Fighter Aircraft P Sharmila 1, S Rajakumar 2 1 P.G. Scholar, 2 Assistant Professor, Mechanical Department Anna
Low Speed Wind Tunnel Wing Performance
 Low Speed Wind Tunnel Wing Performance ARO 101L Introduction to Aeronautics Section 01 Group 13 20 November 2015 Aerospace Engineering Department California Polytechnic University, Pomona Team Leader:
Reynolds Number Effects on Leading Edge Vortices
 Reynolds Number Effects on Leading Edge Vortices Taken From AIAA-2002-2839 Paper Reynolds Numbers Considerations for Supersonic Flight Brenda M. Kulfan 32nd AIAA Fluid Dynamics Conference and Exhibit St.
LEADING-EDGE VORTEX FLAPS FOR SUPERSONIC TRANSPORT CONFIGURATION -EFFECTS OF FLAP CONFIGURATIONS AND ROUNDED LEADING-EDGES-
 ICAS 2002 CONGRESS LEADING-EDGE VORTEX FLAPS FOR SUPERSONIC TRANSPORT CONFIGURATION -EFFECTS OF FLAP CONFIGURATIONS AND ROUNDED LEADING-EDGES- Kenichi RINOIE*, Dong Youn KWAK**, Katsuhiro MIYATA* and Masayoshi
Incompressible Potential Flow. Panel Methods (3)
") Incompressible Potential Flow Panel Methods (3) Outline Some Potential Theory Derivation of the Integral Equation for the Potential Classic Panel Method Program PANEL Subsonic Airfoil Aerodynamics Issues
Incompressible Potential Flow Panel Methods (3) Outline Some Potential Theory Derivation of the Integral Equation for the Potential Classic Panel Method Program PANEL Subsonic Airfoil Aerodynamics Issues
SEMI-SPAN TESTING IN WIND TUNNELS
 25 TH INTERNATIONAL CONGRESS OF THE AERONAUTICAL SCIENCES SEMI-SPAN TESTING IN WIND TUNNELS S. Eder, K. Hufnagel, C. Tropea Chair of Fluid Mechanics and Aerodynamics, Darmstadt University of Technology
Reduction of Skin Friction Drag in Wings by Employing Riblets
 Reduction of Skin Friction Drag in Wings by Employing Riblets Kousik Kumaar. R 1 Assistant Professor Department of Aeronautical Engineering Nehru Institute of Engineering and Technology Coimbatore, India
EXPERIMENTAL ANALYSIS OF THE CONFLUENT BOUNDARY LAYER BETWEEN A FLAP AND A MAIN ELEMENT WITH SAW-TOOTHED TRAILING EDGE
 24 TH INTERNATIONAL CONGRESS OF THE AERONAUTICAL SCIENCES EXPERIMENTAL ANALYSIS OF THE CONFLUENT BOUNDARY LAYER BETWEEN A FLAP AND A MAIN ELEMENT WITH SAW-TOOTHED TRAILING EDGE Lemes, Rodrigo Cristian,
Results and Discussion for Steady Measurements
 Chapter 5 Results and Discussion for Steady Measurements 5.1 Steady Skin-Friction Measurements 5.1.1 Data Acquisition and Reduction A Labview software program was developed for the acquisition of the steady
AERODYNAMIC CHARACTERISTICS OF SPIN PHENOMENON FOR DELTA WING
 ICAS 2002 CONGRESS AERODYNAMIC CHARACTERISTICS OF SPIN PHENOMENON FOR DELTA WING Yoshiaki NAKAMURA (nakamura@nuae.nagoya-u.ac.jp) Takafumi YAMADA (yamada@nuae.nagoya-u.ac.jp) Department of Aerospace Engineering,
ROAD MAP... D-1: Aerodynamics of 3-D Wings D-2: Boundary Layer and Viscous Effects D-3: XFLR (Aerodynamics Analysis Tool)
") Unit D-1: Aerodynamics of 3-D Wings Page 1 of 5 AE301 Aerodynamics I UNIT D: Applied Aerodynamics ROAD MAP... D-1: Aerodynamics of 3-D Wings D-: Boundary Layer and Viscous Effects D-3: XFLR (Aerodynamics
Unit D-1: Aerodynamics of 3-D Wings Page 1 of 5 AE301 Aerodynamics I UNIT D: Applied Aerodynamics ROAD MAP... D-1: Aerodynamics of 3-D Wings D-: Boundary Layer and Viscous Effects D-3: XFLR (Aerodynamics
Experimental and Theoretical Investigation for the Improvement of the Aerodynamic Characteristic of NACA 0012 airfoil
 International Journal of Mining, Metallurgy & Mechanical Engineering (IJMMME) Volume 2, Issue 1 (214) ISSN 232 46 (Online) Experimental and Theoretical Investigation for the Improvement of the Aerodynamic
CFD AND EXPERIMENTAL STUDY OF AERODYNAMIC DEGRADATION OF ICED AIRFOILS
 Colloquium FLUID DYNAMICS 2008 Institute of Thermomechanics AS CR, v.v.i., Prague, October 22-24, 2008 p.1 CFD AND EXPERIMENTAL STUDY OF AERODYNAMIC DEGRADATION OF ICED AIRFOILS Vladimír Horák 1, Dalibor
Numerical and Experimental Investigation of the Possibility of Forming the Wake Flow of Large Ships by Using the Vortex Generators
 Second International Symposium on Marine Propulsors smp 11, Hamburg, Germany, June 2011 Numerical and Experimental Investigation of the Possibility of Forming the Wake Flow of Large Ships by Using the
STUDY OF MODEL DEFORMATION AND STING INTERFERENCE TO THE AERODYNAMIC ESTIMATIONS OF THE CAE-AVM MODEL
 STUDY OF MODEL DEFORMATION AND STING INTERFERENCE TO THE AERODYNAMIC Min ZHONG, Ganglin WANG, Jun HUA Chinese Aeronautical Establishment #2 Anwai Beiyuan, 100012, Beijing, China Keywords: Aerodynamic design,
Aerodynamic Analysis of Blended Winglet for Low Speed Aircraft
 , July 1-3, 2015, London, U.K. Aerodynamic Analysis of Blended Winglet for Low Speed Aircraft Pooja Pragati, Sudarsan Baskar Abstract This paper provides a practical design of a new concept of massive
Computational Analysis of Cavity Effect over Aircraft Wing
 World Engineering & Applied Sciences Journal 8 (): 104-110, 017 ISSN 079-04 IDOSI Publications, 017 DOI: 10.589/idosi.weasj.017.104.110 Computational Analysis of Cavity Effect over Aircraft Wing 1 P. Booma
High-Frequency Scattering from the Sea Surface and Multiple Scattering from Bubbles
 High-Frequency Scattering from the Sea Surface and Multiple Scattering from Bubbles Peter H. Dahl Applied Physics Laboratory College of Ocean and Fisheries Sciences University of Washington Seattle, Washington
Aerodynamic Terms. Angle of attack is the angle between the relative wind and the wing chord line. [Figure 2-2] Leading edge. Upper camber.
![Aerodynamic Terms. Angle of attack is the angle between the relative wind and the wing chord line. [Figure 2-2] Leading edge. Upper camber.](/thumbs/82/86661300.jpg "Aerodynamic Terms. Angle of attack is the angle between the relative wind and the wing chord line. [Figure 2-2] Leading edge. Upper camber.") Chapters 2 and 3 of the Pilot s Handbook of Aeronautical Knowledge (FAA-H-8083-25) apply to powered parachutes and are a prerequisite to reading this book. This chapter will focus on the aerodynamic fundamentals
Chapters 2 and 3 of the Pilot s Handbook of Aeronautical Knowledge (FAA-H-8083-25) apply to powered parachutes and are a prerequisite to reading this book. This chapter will focus on the aerodynamic fundamentals
AE Dept., KFUPM. Dr. Abdullah M. Al-Garni. Fuel Economy. Emissions Maximum Speed Acceleration Directional Stability Stability.
 Aerodynamics: Introduction Aerodynamics deals with the motion of objects in air. These objects can be airplanes, missiles or road vehicles. The Table below summarizes the aspects of vehicle performance
AERODYNAMICS I LECTURE 7 SELECTED TOPICS IN THE LOW-SPEED AERODYNAMICS
 LECTURE 7 SELECTED TOPICS IN THE LOW-SPEED AERODYNAMICS The sources of a graphical material used in this lecture are: [UA] D. McLean, Understanding Aerodynamics. Arguing from the Real Physics. Wiley, 2013.
14th Applied Aerodynamics Conference June 17-20, 1996 / New Orleans, LA
 AIAA 96-2386 Study of Semi-Span Model Testing Techniques G. M. Gatlin and R. J. McGhee NASA Langley Research Center Hampton, VA 23681-1 14th Applied Aerodynamics Conference June 17-2, 1996 / New Orleans,
High Swept-back Delta Wing Flow
 Advanced Materials Research Submitted: 2014-06-25 ISSN: 1662-8985, Vol. 1016, pp 377-382 Accepted: 2014-06-25 doi:10.4028/www.scientific.net/amr.1016.377 Online: 2014-08-28 2014 Trans Tech Publications,
HEFAT th International Conference on Heat Transfer, Fluid Mechanics and Thermodynamics July 2012 Malta
 HEFAT212 9 th International Conference on Heat Transfer, Fluid Mechanics and Thermodynamics 16 18 July 212 Malta AN EXPERIMENTAL STUDY OF SWEEP ANGLE EFFECTS ON THE TRANSITION POINT ON A 2D WING BY USING
Application of a Slotted Airfoil for UH-60A Helicopter Performance
 Application of a Slotted Airfoil for UH-6A Helicopter Performance Hyeonsoo Yeo Raytheon ITSS Joon W. Lim Army/NASA Rotorcraft Division Aeroflightdynamics Directorate (AMRDEC) US Army Aviation and Missile
Experimental Investigation into the Aerodynamic Stability of a Suborbital Reusable Booster Concept
 50th AIAA Aerospace Sciences Meeting including the New Horizons Forum and Aerospace Exposition 09-12 January 2012, Nashville, Tennessee AIAA 2012-1216 Experimental Investigation into the Aerodynamic Stability
Low-Speed Wind-Tunnel Investigation of the Stability and Control Characteristics of a Series of Flying Wings With Sweep Angles of 50
 NASA Technical Memorandum 464 Low-Speed Wind-Tunnel Investigation of the Stability and Control Characteristics of a Series of Flying Wings With Sweep Angles of 5 Scott P. Fears Lockheed Engineering & Sciences
Air-Sea Interaction Spar Buoy Systems
 DISTRIBUTION STATEMENT A: Distribution approved for public release; distribution is unlimited Air-Sea Interaction Spar Buoy Systems Hans C. Graber CSTARS - University of Miami 11811 SW 168 th Street, Miami,
Wing-Body Combinations
 Wing-Body Combinations even a pencil at an angle of attack will generate lift, albeit small. Hence, lift is produced by the fuselage of an airplane as well as the wing. The mating of a wing with a fuselage
NUMERICAL INVESTIGATION OF THE FLOW BEHAVIOUR IN A MODERN TRAFFIC TUNNEL IN CASE OF FIRE INCIDENT
 - 277 - NUMERICAL INVESTIGATION OF THE FLOW BEHAVIOUR IN A MODERN TRAFFIC TUNNEL IN CASE OF FIRE INCIDENT Iseler J., Heiser W. EAS GmbH, Karlsruhe, Germany ABSTRACT A numerical study of the flow behaviour
ScienceDirect. Investigation of the aerodynamic characteristics of an aerofoil shaped fuselage UAV model
 Available online at www.sciencedirect.com ScienceDirect Procedia Engineering 90 (2014 ) 225 231 10th International Conference on Mechanical Engineering, ICME 2013 Investigation of the aerodynamic characteristics
Evaluation of High Lift System with Oscillatory Blowing in 2.5D Configuration
 Evaluation of High Lift System with Oscillatory Blowing in 2.5D Configuration Cǎtǎlin NAE, Mihai-Victor PRICOP Corresponding author INCAS - National Institute for Aerospace Research Elie Carafoli Bdul
C-1: Aerodynamics of Airfoils 1 C-2: Aerodynamics of Airfoils 2 C-3: Panel Methods C-4: Thin Airfoil Theory
 ROAD MAP... AE301 Aerodynamics I UNIT C: 2-D Airfoils C-1: Aerodynamics of Airfoils 1 C-2: Aerodynamics of Airfoils 2 C-3: Panel Methods C-4: Thin Airfoil Theory AE301 Aerodynamics I : List of Subjects
The effect of back spin on a table tennis ball moving in a viscous fluid.
 How can planes fly? The phenomenon of lift can be produced in an ideal (non-viscous) fluid by the addition of a free vortex (circulation) around a cylinder in a rectilinear flow stream. This is known as
Chapter 5 Wing design - selection of wing parameters - 4 Lecture 22 Topics
 Chapter 5 Wing design - selection of wing parameters - Lecture Topics 5.3.9 Ailerons 5.3.0 Other aspects of wing design Example 5. 5.3.9 Ailerons The main purpose of the ailerons is to create rolling moment
Wind tunnel effects on wingtip vortices
 48th AIAA Aerospace Sciences Meeting Including the New Horizons Forum and Aerospace Exposition 4-7 January 2010, Orlando, Florida AIAA 2010-325 Wind tunnel effects on wingtip vortices Xin Huang 1, Hirofumi
A COMPUTATIONAL STUDY ON THE DESIGN OF AIRFOILS FOR A FIXED WING MAV AND THE AERODYNAMIC CHARACTERISTIC OF THE VEHICLE
 28 TH INTERNATIONAL CONGRESS OF THE AERONAUTICAL SCIENCES A COMPUTATIONAL STUDY ON THE DESIGN OF AIRFOILS FOR A FIXED WING MAV AND THE AERODYNAMIC CHARACTERISTIC OF THE VEHICLE Jung-Hyun Kim*, Kyu-Hong
Investigation on 3-D Wing of commercial Aeroplane with Aerofoil NACA 2415 Using CFD Fluent
 Investigation on 3-D of commercial Aeroplane with Aerofoil NACA 2415 Using CFD Fluent Rohit Jain 1, Mr. Sandeep Jain 2, Mr. Lokesh Bajpai 3 1PG Student, 2 Associate Professor, 3 Professor & Head 1 2 3
Welcome to Aerospace Engineering
 Welcome to Aerospace Engineering DESIGN-CENTERED INTRODUCTION TO AEROSPACE ENGINEERING Notes 4 Topics 1. Course Organization 2. Today's Dreams in Various Speed Ranges 3. Designing a Flight Vehicle: Route
AN EXPERIMENTAL STUDY OF THE EFFECTS OF SWEPT ANGLE ON THE BOUNDARY LAYER OF THE 2D WING
 AN EXPERIMENTAL STUDY OF THE EFFECTS OF SWEPT ANGLE ON THE BOUNDARY LAYER OF THE 2D WING A. Davari *, M.R. Soltani, A.Tabrizian, M.Masdari * Assistant Professor, Department of mechanics and Aerospace Engineering,
Parasite Drag. by David F. Rogers Copyright c 2005 David F. Rogers. All rights reserved.
 Parasite Drag by David F. Rogers http://www.nar-associates.com Copyright c 2005 David F. Rogers. All rights reserved. How many of you still have a Grimes rotating beacon on both the top and bottom of the
Inlet Influence on the Pressure and Temperature Distortion Entering the Compressor of an Air Vehicle
 Distortion Entering the Compressor of an Air Vehicle P. Hendrick Université Libre de Bruxelles, ULB Avenue F.D. Roosevelt, 50 1050 Brussels BELGIUM patrick.hendrick@ulb.ac.be ABSTRACT One of the possible
Drag Divergence and Wave Shock. A Path to Supersonic Flight Barriers
 Drag Divergence and Wave Shock A Path to Supersonic Flight Barriers Mach Effects on Coefficient of Drag The Critical Mach Number is the velocity on the airfoil at which sonic flow is first acquired If
A comparison of NACA 0012 and NACA 0021 self-noise at low Reynolds number
 A comparison of NACA 12 and NACA 21 self-noise at low Reynolds number A. Laratro, M. Arjomandi, B. Cazzolato, R. Kelso Abstract The self-noise of NACA 12 and NACA 21 airfoils are recorded at a Reynolds
Ermenek Dam and HEPP: Spillway Test & 3D Numeric-Hydraulic Analysis of Jet Collision
 Ermenek Dam and HEPP: Spillway Test & 3D Numeric-Hydraulic Analysis of Jet Collision J.Linortner & R.Faber Pöyry Energy GmbH, Turkey-Austria E.Üzücek & T.Dinçergök General Directorate of State Hydraulic
Basic Fluid Mechanics
 Basic Fluid Mechanics Chapter 7B: Forces on Submerged Bodies 7/26/2018 C7B: Forces on Submerged Bodies 1 Forces on Submerged Bodies Lift and Drag are forces exerted on an immersed body by the surrounding
Aero Club. Introduction to Flight
 Aero Club Presents Introduction to RC Modeling Module 1 Introduction to Flight Centre For Innovation IIT Madras Page2 Table of Contents Introduction:... 3 How planes fly How is lift generated?... 3 Forces
Jet Propulsion. Lecture-17. Ujjwal K Saha, Ph. D. Department of Mechanical Engineering Indian Institute of Technology Guwahati
 Lecture-17 Prepared under QIP-CD Cell Project Jet Propulsion Ujjwal K Saha, Ph. D. Department of Mechanical Engineering Indian Institute of Technology Guwahati 1 Lift: is used to support the weight of
SUBPART C - STRUCTURE
 SUBPART C - STRUCTURE GENERAL CS 23.301 Loads (a) Strength requirements are specified in terms of limit loads (the maximum loads to be expected in service) and ultimate loads (limit loads multiplied by
AERODYNAMIC ANALYSIS OF MULTI-WINGLETS FOR LOW SPEED AIRCRAFT
 AERODYNAMIC ANALYSIS OF MULTI-WINGLETS FOR LOW SPEED AIRCRAFT Cosin, R., Catalano, F.M., Correa, L.G.N., Entz, R.M.U. Engineering School of São Carlos - University of São Paulo Keywords: multi-winglets,
Lesson: Airspeed Control
 11/20/2018 Airspeed Control Page 1 Lesson: Airspeed Control Objectives: o Knowledge o An understanding of the aerodynamics related to airspeed control o Skill o The ability to establish and maintain a
Aerodynamic behavior of a discus
 Available online at www.sciencedirect.com Procedia Engineering 34 (2012 ) 92 97 9 th Conference of the International Sports Engineering Association (ISEA) Aerodynamic behavior of a discus Kazuya Seo a*,
Development of Low Volume Shape Memory Alloy Variable Ballast System for AUV Use
 Development of Low Volume Shape Memory Alloy Variable Ballast System for AUV Use Dr. Graeme J Rae Ocean Engineering Program Division of Marine and Environmental Systems Florida Institute of Technology
DIRECCION DE PERSONAL AERONAUTICO DPTO. DE INSTRUCCION PREGUNTAS Y OPCIONES POR TEMA
 MT DIREION DE PERSONL ERONUTIO DPTO. DE INSTRUION PREGUNTS Y OPIONES POR TEM 1 TEM: 0292 FLT/DSP - (HP. 03) ERODYNMIS OD_PREG: PREG20084823 (8324) PREGUNT: When are inboard ailerons normally used? Low-speed
It should be noted that the symmetrical airfoil at zero lift has no pitching moment about the aerodynamic center because the upper and
 NAVWEPS -81-8 and high power, the dynamic pressure in the shaded area can be much greater than the free stream and this causes considerably greater lift than at zero thrust. At high power conditions the
JOURNAL PUBLICATIONS
 1 JOURNAL PUBLICATIONS 71. Lee, T., Mageed, A., Siddiqui, B. and Ko, L.S., (2016) Impact of ground proximity on aerodynamic properties of an unsteady NACA 0012 airfoil, submitted to Journal of Aerospace
J. Szantyr Lecture No. 21 Aerodynamics of the lifting foils Lifting foils are important parts of many products of contemporary technology.
 J. Szantyr Lecture No. 21 Aerodynamics of the lifting foils Lifting foils are important parts of many products of contemporary technology. < Helicopters Aircraft Gliders Sails > < Keels and rudders Hydrofoils
Secondary wave lift degradation. Pekka Koivisto. Trafi Research Reports Trafin tutkimuksia Trafis undersökningsrapporter
 Secondary wave lift degradation Pekka Koivisto Trafi Research Reports Trafin tutkimuksia Trafis undersökningsrapporter 18/2015 Secondary wave lift degradation Pekka Koivisto, Aalto University Finnish Transport
Comparing GU & Savier airfoil equipped half canard In S4 wind tunnel (France)
") Some notes about Comparing GU & Savier airfoil equipped half canard In S4 wind tunnel (France) Matthieu Scherrer Adapted from Charlie Pujo & Nicolas Gorius work Contents Test conditions 3. S-4 Wind-tunnel.............................................
Some notes about Comparing GU & Savier airfoil equipped half canard In S4 wind tunnel (France) Matthieu Scherrer Adapted from Charlie Pujo & Nicolas Gorius work Contents Test conditions 3. S-4 Wind-tunnel.............................................
AERODYNAMIC CHARACTERISTICS OF NACA 0012 AIRFOIL SECTION AT DIFFERENT ANGLES OF ATTACK
 AERODYNAMIC CHARACTERISTICS OF NACA 0012 AIRFOIL SECTION AT DIFFERENT ANGLES OF ATTACK SUPREETH NARASIMHAMURTHY GRADUATE STUDENT 1327291 Table of Contents 1) Introduction...1 2) Methodology.3 3) Results...5
Aircraft Fuel Cell Repair Equipment
 Aircraft Fuel Cell Repair Equipment After Iniative Report AMB-05-005 PROJECT MANAGER: Capt John M. Yerger DSN 650-7608 john.yerger@mcguire.af.mil Air Force Air Mobility Battlelab DISTRIBUTION A. Approved
Influence of wing span on the aerodynamics of wings in ground effect
 Influence of wing span on the aerodynamics of wings in ground effect Sammy Diasinos 1, Tracie J Barber 2 and Graham Doig 2 Abstract A computational fluid dynamics study of the influence of wing span has
THE BRIDGE COLLAPSED IN NOVEMBER 1940 AFTER 4 MONTHS OF ITS OPENING TO TRAFFIC!
 OUTLINE TACOMA NARROWS BRIDGE FLOW REGIME PAST A CYLINDER VORTEX SHEDDING MODES OF VORTEX SHEDDING PARALLEL & OBLIQUE FLOW PAST A SPHERE AND A CUBE SUMMARY TACOMA NARROWS BRIDGE, USA THE BRIDGE COLLAPSED
AFRL-RX-WP-TP
 AFRL-RX-WP-TP-2012-0215 REVERSE PRESSURE CAPABLE FINGER SEAL (PREPRINT) Nathan Gibson and Joe Yanof Honeywell International, Inc. JANUARY 2012. See additional restrictions described on inside pages STINFO
Improvement of an Artificial Stall Warning System for Sailplanes
 Improvement of an Artificial Stall Warning System for Sailplanes Loek M. M. Boermans and Bart Berendsen Delft University of Technology, Faculty of Aerospace Engineering P.O.Box 5058, 2600 GB Delft, The
Tim Lee s journal publications
 Tim Lee s journal publications 82. Lee, T., and Tremblay-Dionne, V., (2018) Impact of wavelength and amplitude of a wavy ground on a static NACA 0012 airfoil submitted to Journal of Aircraft (paper in
Effect of Co-Flow Jet over an Airfoil: Numerical Approach
 Contemporary Engineering Sciences, Vol. 7, 2014, no. 17, 845-851 HIKARI Ltd, www.m-hikari.com http://dx.doi.org/10.12988/ces.2014.4655 Effect of Co-Flow Jet over an Airfoil: Numerical Approach Md. Riajun
Design and Development of Micro Aerial Vehicle
 Advances in Aerospace Science and Applications. ISSN 2277-3223 Volume 4, Number 1 (2014), pp. 91-98 Research India Publications http://www.ripublication.com/aasa.htm Design and Development of Micro Aerial
Examples of Carter Corrected DBDB-V Applied to Acoustic Propagation Modeling
 Naval Research Laboratory Stennis Space Center, MS 39529-5004 NRL/MR/7182--08-9100 Examples of Carter Corrected DBDB-V Applied to Acoustic Propagation Modeling J. Paquin Fabre Acoustic Simulation, Measurements,
Internal Waves and Mixing in the Aegean Sea
 Internal Waves and Mixing in the Aegean Sea Michael C. Gregg Applied Physics Laboratory, University of Washington 1013 NE 40 th St. Seattle, WA 98105-6698 phone: (206) 543-1353 fax: (206) 543-6785 email:
Twist Distributions for Swept Wings, Part 2
 On the Wing... #162 Twist Distributions for Swept Wings, Part 2 Having defined and provided examples of lift distributions in Part 1, we now move on to describing the stalling patterns of untwisted and
Fig. 2. M.I. Yaroslavtsev, 2002
 SPECIAL FEATURES OF USING N O FOR HEATING OF THE TEST GAS IN A HOT-SHOT WIND TUNNEL M.I. Yaroslavtsev Institute of Theoretical and Applied Mechanics SB RAS, 630090 Novosibirsk Russia 1. The study of heat
Aerodynamic Analysis of a Symmetric Aerofoil
 214 IJEDR Volume 2, Issue 4 ISSN: 2321-9939 Aerodynamic Analysis of a Symmetric Aerofoil Narayan U Rathod Department of Mechanical Engineering, BMS college of Engineering, Bangalore, India Abstract - The
EXPERIMENTAL AND NUMERICAL STUDY OF A TWO- ELEMENT WING WITH GURNEY FLAP
 25 TH INTERNATIONAL CONGRESS OF THE AERONAUTICAL SCIENCES EXPERIMENTAL AND NUMERICAL STUDY OF A TWO- ELEMENT WING WITH GURNEY FLAP F.M. Catalano PhD.( catalano@sc.usp.br ) *, G. L. Brand * * Aerodynamic
VORTEX BEHAVIORS OVER A CRANKED ARROW WING CONFIGURATION AT HIGH ANGLES OF ATTACK
 24 TH INTERNATIONAL CONGRESS OF THE AERONAUTICAL SCIENCES VORTEX BEHAVIORS OVER A CRANKED ARROW WING CONFIGURATION AT HIGH ANGLES OF ATTACK Dong-Youn KWAK*, Masashi SHIROTAKE** and Kenichi RINOIE** *Japan
Waves, Turbulence and Boundary Layers
 Waves, Turbulence and Boundary Layers George L. Mellor Program in Atmospheric and Oceanic Sciences Princeton University Princeton NJ 8544-71 phone: (69) 258-657 fax: (69) 258-285 email: glm@splash.princeton.edu
Cost-Effectiveness of CC&D Measures and their Interaction
 Cost-Effectiveness of CC&D Measures and their Interaction Eivind Strømman Forsvarets forskningsinstitutt (Norwegian Defence Research Establishment) PO Box 25, NO-27 Kjeller Norway eivind.stromman@ffi.no
CFD Study of Solid Wind Tunnel Wall Effects on Wing Characteristics
 Indian Journal of Science and Technology, Vol 9(45), DOI :10.17485/ijst/2016/v9i45/104585, December 2016 ISSN (Print) : 0974-6846 ISSN (Online) : 0974-5645 CFD Study of Solid Wind Tunnel Wall Effects on
DIRECCION DE PERSONAL AERONAUTICO DPTO. DE INSTRUCCION PREGUNTAS Y OPCIONES POR TEMA
 MT DIREION DE PERSONL ERONUTIO DPTO. DE INSTRUION PREGUNTS Y OPIONES POR TEM 1 TEM: 0114 TP - (HP. 03) ERODYNMIS OD_PREG: PREG20078023 (8358) PREGUNT: What is the safest and most efficient takeoff and
AF101 to AF109. Subsonic Wind Tunnel Models AERODYNAMICS. A selection of optional models for use with TecQuipment s Subsonic Wind Tunnel (AF100)
") Page 1 of 4 A selection of optional models for use with TecQuipment s Subsonic Wind Tunnel (AF100) Dimpled Sphere Drag Model (from AF109) shown inside the TecQuipment AF100 Wind Tunnel. Cylinder, aerofoils,
Page 1 of 4 A selection of optional models for use with TecQuipment s Subsonic Wind Tunnel (AF100) Dimpled Sphere Drag Model (from AF109) shown inside the TecQuipment AF100 Wind Tunnel. Cylinder, aerofoils,
PERFORMANCE OF A FLAPPED DUCT EXHAUSTING INTO A COMPRESSIBLE EXTERNAL FLOW
 24 TH INTERNATIONAL CONGRESS OF THE AERONAUTICAL SCIENCES PERFORMANCE OF A FLAPPED DUCT EXHAUSTING INTO A COMPRESSIBLE EXTERNAL FLOW P. R. Pratt, J. K. Watterson, E. Benard, S. Hall School of Aeronautical
Static Extended Trailing Edge for Lift Enhancement: Experimental and Computational Studies
 Static Extended Trailing Edge for Lift Enhancement: Experimental and Computational Studies T. Liu, J. Montefort, W. Liou Western Michigan University Kalamazoo, MI 49008 and Q. Shams NASA Langley Research
II.E. Airplane Flight Controls
 References: FAA-H-8083-3; FAA-8083-3-25 Objectives Key Elements Elements Schedule Equipment IP s Actions SP s Actions Completion Standards The student should develop knowledge of the elements related to
Principles of glider flight
 Principles of glider flight [ Lecture 1: Lift, drag & glide performance ] Richard Lancaster Email: Richard@RJPLancaster.net Twitter: @RJPLancaster ASK-21 illustrations Copyright 1983 Alexander Schleicher
Unsteady airfoil experiments
 Unsteady airfoil experiments M.F. Platzer & K.D. Jones AeroHydro Research & Technology Associates, Pebble Beach, CA, USA. Abstract This paper describes experiments that elucidate the dynamic stall phenomenon
JAR-23 Normal, Utility, Aerobatic, and Commuter Category Aeroplanes \ Issued 11 March 1994 \ Section 1- Requirements \ Subpart C - Structure \ General
 JAR 23.301 Loads \ JAR 23.301 Loads (a) Strength requirements are specified in terms of limit loads (the maximum loads to be expected in service) and ultimate loads (limit loads multiplied by prescribed
Effect of Leading- and Trailing-Edge Flaps on Clipped Delta Wings With and Without Wing Camber at Supersonic Speeds
 NASA Technical Memorandum 4542 Effect of Leading- and Trailing-Edge Flaps on Clipped Delta Wings With and Without Wing Camber at Supersonic Speeds Gloria Hernandez, Richard M. Wood, and Peter F. Covell
TITLE: Assessing the Hydrodynamic Performance of Fouling-Release Surfaces (ONR Research Contract # N WR )
") TITLE: Assessing the Hydrodynamic Performance of Fouling-Release Surfaces (ONR Research Contract # N00014-07-WR-2-0213) INVESTIGATOR: Associate Professor Michael P. Schultz, Naval Architecture & Ocean
TITLE: Assessing the Hydrodynamic Performance of Fouling-Release Surfaces (ONR Research Contract # N00014-07-WR-2-0213) INVESTIGATOR: Associate Professor Michael P. Schultz, Naval Architecture & Ocean
External Tank- Drag Reduction Methods and Flow Analysis
 External Tank- Drag Reduction Methods and Flow Analysis Shaik Mohammed Anis M.Tech Student, MLR Institute of Technology, Hyderabad, India. G. Parthasarathy Associate Professor, MLR Institute of Technology,
EXPERIMENTAL AND ANALYTICAL INVESTIGATION OF THE EFFECT OF BODY KIT USED WITH SALOON CARS IN BRUNEI DARUSSALAM
 EXPERIMENTAL AND ANALYTICAL INVESTIGATION OF THE EFFECT OF BODY KIT USED WITH SALOON CARS IN BRUNEI DARUSSALAM M.G., Yazdani, H. Ullah, T. Aderis and R. Zainulariffin, Faculty of Engineering, Institut
Characterizing The Surf Zone With Ambient Noise Measurements
 Characterizing The Surf Zone With Ambient Noise Measurements LONG-TERM GOAL Grant Deane Marine Physical Laboratory Scripps Institution of Oceanography La Jolla, CA 93093-0213 phone: (619) 534-0536 fax: