Climate Science INTER-ANNUAL TO DECADAL CLIMATE VARIABILITY/COASTAL UPWELLING AND COASTAL CLIMATES. MONITORING EL NIÑO and LA NIÑA
|
|
|
- Annice Jefferson
- 6 years ago
- Views:
Transcription
1 Climate Science INTER-ANNUAL TO DECADAL CLIMATE VARIABILITY/COASTAL UPWELLING AND COASTAL CLIMATES MONITORING EL NIÑO and LA NIÑA Background: Before 1982, few Americans had ever heard of the term El Niño, when exceptionally stormy weather conditions were reported along the West Coast. Much media and public attention was focused upon this large-scale anomalous atmospheric and oceanic condition again during the winter when numerous Pacific storms battered the West Coast and Southeast, while the northern tier of states remained exceptionally mild. Briefly, El Niño, named after "the Christ child" by Peruvians some 200 years ago, is associated with a noticeable warming of the equatorial Pacific Ocean waters along the South American Coast in December. This phenomenon that occurs every three to five years had been long known to produce disastrous effects upon the local South American economy. Warming of the coastal Pacific waters causes a reduction in the upwelling of nutrient-rich cold water reducing the fish population and hence the income from the fishing industry. Studying these El Niño events, some researchers had found a correlation between these episodes and the Southern Oscillation, a quasiperiodic variation in the atmospheric pressure across the tropical Pacific Ocean. The term ENSO, a contraction for El Niño and Southern Oscillation, has been used to describe the combined effects of these two phenomena. Notably in 1998, the opposite condition, called La Niña appeared. The term La Niña had been proposed about 1988 to identify an event associated with anomalously cold ocean waters in the eastern Pacific. The reason attention has been paid to these warming and cooling events in the equatorial Pacific is that atmospheric and oceanic scientists have seen a relationship between El Niño/La Niña events in the eastern Pacific and unusual weather conditions in many other areas of the world. Research continues to predict future El Niño and La Niña events and to explain the causes in an effort to understand these "teleconnections." In fact, the terms El Niño and La Niña now refer to the larger scale anomalous atmospheric and oceanic patterns seen across the globe. Following the significant El Niño event, a major international effort called TOGA (Tropical Oceans, Global Atmosphere) was launched. Between 1985 and 1994, the weather and near-surface ocean conditions in the tropical Pacific were closely monitored by investigators using moored ocean buoys, drifting buoys, ship measurements, and satellites in both geosynchronous and polar orbits. Infrared radiation (IR) sensors onboard these satellites provide a continuous worldwide estimate of the sea surface temperatures (SST). The buoy network and the satellite surveillance, continued under the administration of NOAA, provided the scientific community with the first indications of the major El Niño or "warm-phase ENSO" and the 1998 "cold phase" La Niña events. WIDESPREAD EFFECTS OF El NIÑO and LA NIÑA The Climate Prediction Center has a website entitled ENSO Temperature and Precipitation Composites, where a suite of maps can be viewed that show how the temperature, precipitation and snow patterns over three-month "seasons" across the coterminous United States are affected by El Niño and La Niña
2 conditions. The data were collected from 1950 through the present and are plotted as departures from mean values, grouped on six separate pages (e.g., El Niño temperature, El Niño precipitation, etc.) accessed from separate tabs. Eighteen El Niño cases (listed below the maps) and 16 La Niña cases were considered. Considering the top row ("composite"), the left panel represents the average temperature, precipitation or snow departures from normal for a given three-month season, while the right panel shows the frequency of occurrence of above or below average conditions as a percentage for the set of all individual El Niño or La Niña years. For example, take the case of temperature for the late meteorological winter and early meteorological spring (JFM). For an El Niño situation, the Southern States extending from Arizona eastward to the Carolinas would have below average temperatures, with Florida experiencing temperature departures that would be at least one Celsius degree below average. The frequency of occurrence of below average temperatures would be in excess of 60 percent, or approximately eleven years out of the 18 El Niño cases. On the other hand, the nation's northern tier of states would have above average JFM temperatures in an El Niño case. Such a positive temperature anomaly situation across the northern Rockies and adjacent high Plains occurred little more than 40 percent of all El Niño years. For the same set of months (JFM) in a La Niña year, the Northwest, the northern Rockies and the northern Plains would most likely experience below average temperature conditions. KEEPING TRACK OF CURRENT El NIÑO/ LA NIÑA INDICATORS Several Web sites focusing on the El Niño and La Niña provide up-to-date information concerning the SST and other El Niño indicators. You can use these sources to monitor the present conditions across the tropical Pacific, compare a recent El Niño event with other historic predecessors, and learn how these events may affect the weather and climate elsewhere on the planet. A special El Niño theme page produced by the National Oceanic and Atmospheric Administration's Pacific Marine Environmental Laboratory (PMEL) in Seattle, WA contains background information and various types of current information sources. One such source is the set of real time plots of sea surface temperature and wind observations provided by an array of moored ocean buoys in the Pacific Ocean. Other links from this page provide El Niño forecasts and information in a question and answer format. A NOAA La Niña theme page is also available that describes La Niña episodes. Another site, the Ocean Surface Topography from Space homepage, provides global sea level data obtained from NASA's Jason satellite. From this altimeter information, current El Niño and La Niña conditions can be monitored and displayed. The National Weather Service's Climate Prediction Center (CPC) issues an El Niño or La Niña Watch when conditions are favorable for the development of El Niño or La Niña conditions within the next six months. As of this writing, borderline ENSO-neutral were continuing as observed surface temperatures were close to the long-term averages across most of the equatorial Pacific, with "SST anomalies" (differences between observed surface temperatures and the long-term averages) generally being less than 0.5 Celsius degrees above or below average. While slightly cooler than average waters were found across the eastern equatorial Pacific, "positive SST anomalies" (observed surface temperatures above the long-term averages) amounting to nearly 1.0 Celsius degrees above average were found across small areas in the far western Pacific near Oceania. Scientists at NASA's Jet Propulsion Laboratory reported that based upon global sea level data from the Jason-2 satellite a "'La Nada' climate pattern lingers over the Pacific" following two years of strong, cool-water La Niña events. ("La Nada" is a term that is used by some sources to describe ENSO-neutral conditions.) Recently, scientists at CPC indicated that ENSO-neutral conditions would appear to be favored through the spring 2014 in the Northern Hemisphere. Therefore, the ENSO Alert System Status is considered "Not Active."
3 INTER-ANNUAL TO DECADAL CLIMATE VARIABILITY Driving Questions: How do interactions between the ocean, atmosphere, and Earth s surface produce inter-annual and longer climate variability? What are examples of such short-term climate variability on local, regional, and global scales? Educational Outcomes: To describe the origins and characteristics of inter-annual and decadal variability. To explain their impacts on local, regional and global weather and climate. Objectives: After completing this investigation, you should be able to: Describe fundamental concepts concerning climate fluctuations that have been observed lasting beyond a year to decades. Explain inter-annual climate variability as exemplified by El Niño Southern Oscillation (ENSO). Describe local, regional, and global impacts or teleconnections of inter-annual climate variability phenomena. Variability in Earth s Climate System Earth s climate system shows considerable variability on all time scales. As stated previously, the primary drivers of climate are the direct impacts of (a) incident solar radiation, (b) Earth s rotation and revolution, (c) the character of Earth s surface, and (d) atmospheric composition. These boundary conditions underlie cycles of climate components (e.g., temperature, precipitation) that adhere strictly to diurnal and annual time periods. These essentially determine the multi-year mean state of the climate system (including annual and seasonal mean values of climatic components). But there are fluctuations that occur in the climate system with time scales lasting greater than a year (inter-annual) to decades and longer. They manifest conditions, or modes, with distinctive life times and spatial patterns. These are departures from the mean state of the climate system that are related to variations in the general circulations of the atmosphere and ocean, and the conditions at Earth s surface such as sea surface temperatures (SST) and snow and ice cover. These modes arise from the forcings and responses, including feedbacks, in the system and the extent to which the slower acting components (e.g., ice, deep ocean, and vegetation) become entrained with the more rapid variations of the atmosphere and ocean surface. The ocean, because of its attributes, including its great mass, huge heat capacity, fluidity, and thermal inertia, is a crucial participant in producing climate fluctuations that run their course on inter-annual and longer time scales. These fluctuations are significant to societies and ecosystems through their impacts on water resources, food supply, energy demand, human health, biological systems, and national security, among other issues. El Niño Southern Oscillation (ENSO): Perhaps the best known and most readily detected interannual climate variability phenomenon is El Niño Southern Oscillation (ENSO), a large-scale, persistent disturbance of ocean and atmosphere in the tropical Pacific Ocean. ENSO is governed by large-scale ocean dynamics and coupled ocean-atmosphere interactions which result in periods of anomalously warm and cold conditions (or phases) in the tropical Pacific Ocean on a quasi-periodic basis. While its different phases have major impacts on the tropical Pacific and bordering land

4 environments, there are also impacts worldwide. Globally, ENSO is the largest single contributor to inter-annual climate variability. The term El Niño originally described a short-term, weak warming of ocean water that ran southward along the coast of Peru and Ecuador around Christmas resulting in poor fishing. Now, the term is incorporated into the more comprehensive general term El Niño - Southern Oscillation (ENSO), which exhibits a warm phase (traditional El Niño), a cold phase (termed La Niña) and a neutral or long-term average phase. The SO in ENSO refers to the Southern Oscillation, an interannual seesaw in tropical sea level pressure between the eastern and western portions of the tropical Pacific. In general, the terms El Niño and La Niña may be used for particular phase occurrences. El Niño modes last an average of 12 to 18 months and occur about once every two to seven years. Ten occurred during a recent 42-year period, with one of the most intense on record in Sometimes El Niño is followed by La Niña, a period of unusually strong trade winds and vigorous upwelling in the eastern tropical Pacific. During La Niña, changes in SST and extremes in weather are typically opposite those observed during El Niño. A persistent ENSO phase can be accompanied by major shifts in planetary-scale atmospheric and oceanic circulations and weather extremes. Because of the importance of ENSO, the tropical Pacific Ocean is now monitored continuously via about 70 tethered (anchored) buoys in NOAA s Tropical Atmosphere Ocean (TAO) Project. Operational definitions of ENSO phases have been agreed to by the World Meteorological Organization (WMO) Commission for Climatology. They are defined based on three-month averages of SST departures from normal for a critical region (ENSO 3.4 region: 120W-170W, 5 N-5S) of the equatorial Pacific as follows: El Niño (the warm phase) is characterized by a positive SST departure from normal, equal to or greater than 0.5 Celsius degrees, averaged over three consecutive months. La Niña (the cold phase) is characterized by a negative SST departure from normal, equal to or greater than 0.5 Celsius degrees, averaged over three consecutive months. Figure 1 displays the average SST and wind patterns for December 2011 based on observations from NOAA s TAO/Triton equatorial Pacific buoy array.
(24.0)(22.")
5 Figure 1. Tropical Pacific monthly SST and winds during December The upper panel in Figure 1 depicts SST and winds across the tropical Pacific, and shows the temperature patterns as averaged over the month of December Isotherms are drawn at a 0.5 C interval to show the temperature pattern. Temperatures range from above 29.5 C in the far western Pacific to less than [(25.5)(24.0)(22.0)] C along the equator near 100 deg W. 2. Average wind directions are indicated by arrows with their lengths proportional to the wind speeds. The prevailing surface winds across most of the tropical Pacific during December 2011 were towards the [(east)(west)]. The lower panel in Figure 1 denotes anomalies. An anomaly is a departure from the longterm average condition. Anomaly patterns are depicted with lines also drawn with half-degree intervals. Positive (warmer than normal) anomalies are analyzed with solid lines and negative (colder than normal) anomalies with dashed lines. The heavy solid black line, labeled 0, denotes locations where SST values were the same as the long-term averages. 3. With a pencil and a straight edge, mark off the ENSO 3.4 region (120W-170W, 5 N-5S). The average anomaly in the region is [(warmer than +0.5)(between 0 and 0.5)(colder than 0.5)] Celsius degrees. 4. Anomalies in the ENSO 3.4 region similar to those in December 2011 had persisted for at least three months. Based on the definitions stated earlier, [(El Niño)(La Niña)] conditions existed in the tropical Pacific in December [Note: Tropical Pacific conditions made a transition towards ENSO-neutral during April 2012.] Figure 2 and Figure 3 are presented to demonstrate especially strong El Niño and La Niña episodes, respectively, from recent years. Figure 2.
 (between 0 and 0.5)(colder than 0.")
6 Monthly SST and winds during a significant El Niño (warm phase) episode. 5. Figure 2 shows tropical Pacific conditions midway through a strong El Niño (warm phase) episode in The upper panel shows warm temperatures generally across the Pacific, with the lower panel showing anomalies in the ENSO 3.4 region which are [(warmer than +0.5) (between 0 and 0.5)(colder than 0.5)] Celsius degrees. Figure 3. Monthly SST and winds during significant La Niña (cold phase) episode. 6. Figure 3 shows tropical Pacific conditions midway through a strong La Niña (cold phase) episode during The upper panel shows warm temperatures in the western Pacific and colder temperatures along the equator to the east. The lower panel shows anomalies in the ENSO 3.4 region which are [(warmer than +0.5)(between 0 and 0.5)(colder than 0.5)] Celsius degrees. 7. Compare the wind arrows in the upper panels of Figures 2 and 3. They show that during [(El Niño) (La Niña)] episodes the wind blows more strongly towards the west across all or most of the tropical Pacific. For the most recent monthly SST and Winds TAO depiction, go to: There, click on Lat Lon plots. On the new page, click on Monthly and then, Make plot!. Click on image to enlarge it. You can also get the latest 5- day average depiction at the same website. Teleconnections: Teleconnection is the name given to statistically significant correlations between weather events that occur at different places around the globe. There are a number of such correlations that appear during ENSO episodes. They result from the changing position of the major heat source (identified by high SST) in the tropical Pacific. These interactions between ocean and atmosphere have a ripple effect on climatic conditions in far flung regions. Shifts in tropical rainfall affect wind patterns over much of the globe. Waves in the air flow pattern determine the positions of the monsoons, storms tracks, and belts of strong upper-air winds (jet streams) which overlie borders
(winter)]. 9.")
7 between warm and cold air masses at Earth s surface. El Niño (warm phase) and La Niña (cold phase) teleconnections are summarized in Figure 4 and Figure 5, respectively. 8. According to Figures 4 and 5, ENSO-related teleconnections in North America are more extensive during the Northern Hemisphere [(summer)(winter)]. 9. El Niño (warm phase) related teleconnections are typically stronger, more frequent, and longer lasting than those during La Niña (cold phase) episodes because El Niño events themselves are typically stronger, more frequent, and longer lasting. The teleconnections are also different. If the U.S. southeastern states were experiencing drought, the onset of a Northern Hemisphere winter-season [(El Niño)(La Niña)] might be welcomed. 10. One part of the coterminous U.S. which appears least likely to be impacted by ENSO events is the [(northwestern)(southwestern)(central)] states. 11. One country that is most impacted by teleconnections to some extent by all El Niño (warm phase) and La Niña (cold phase) episodes is [(Brazil)(Indonesia)(Japan)].

8 Figure 4. December-February and June-August El Niño (warm phase) typical teleconnections. Figure 5. December-February and June-August La Niña (cold phase) typical teleconnections. ENSO Impacts on the U.S.: Detailed statistical analyses have been made by NOAA s Climate Prediction Center to describe strong ENSO temperature and precipitation teleconnections. These are available in map forms at: As an optional activity, we suggest that you examine maps to determine what, if any, ENSO-related teleconnections have been detected in your geographical area. Decadal Variability: Additional variabilities in the climate system in certain regions over time frames of several decades have been identified. These periodicities are just beginning to be documented and understood. Regional differentials in sea-level air pressure and/or sea surface temperatures have been associated with upper atmospheric wind patterns or surface ocean conditions in the North Atlantic, North Pacific, Arctic and Antarctic areas.
9 Summary: Fluctuations occur in the climate system with time scales on the order of more than a year (inter-annual) to decades and longer. Ocean-atmosphere interactions play major roles in causing these climate modes with distinctive life times and spatial patterns. The El Niño Southern Oscillation is the most significant inter-annual climate variability phenomenon. While the climates of the locations where these fluctuations take place are directly impacted, they can also impact weather and climate in far flung places. These distant impacts are referred to as teleconnections. These fluctuations are significant to societies and ecosystems through impacts on water resources, food supply, energy demand, human health, biological systems, and national security. COASTAL UPWELLING AND COASTAL CLIMATES Driving Questions: How do winds produce upwelling and downwelling in the ocean? What is the significance of upwelling for marine productivity? What are possible impacts on local climate? Educational Outcomes: To describe upwelling and downwelling in coastal areas. To describe relationships between upwelling and marine productivity. To describe the impacts of upwelling and downwelling on California coastal climates. Objectives: After completing this investigation, you should be able to: Demonstrate the causes of coastal upwelling and downwelling. Describe the influence of the prevailing wind and Coriolis Effect on upwelling and downwelling. Describe the impacts of upwelling and downwelling on coastal climates. Introduction: In some near-shore areas of the ocean, coastal orientation, prevailing wind, and Earth s rotation combine to influence vertical ocean circulation. In these regions, the wind sometimes transports water in the upper 10 to 100 m (33 to 330 ft) away from the coast, to be replaced by cooler water from below. This process, called coastal upwelling, brings to the sunlit surface nutrient-rich water, spurring biological productivity. At other times and places, the wind transports near-surface water towards the coast, causing warm surface waters to pile up and sink. This process, known as coastal downwelling, thickens the layer of nutrient-deficient water, reducing biological productivity. Upwelling and downwelling can be accompanied by dramatic changes in the local weather and climate. Upwelling and downwelling are also associated with broad-scale atmosphere/ ocean interactions (e.g., El Niño and La Niño) that have regional and even global impacts on precipitation patterns and other components of the water cycle. In this investigation, we examine coastal upwelling and downwelling by looking at the contribution of coastline orientation, prevailing winds, and Earth rotation. We also describe the impacts on California coastal areas.
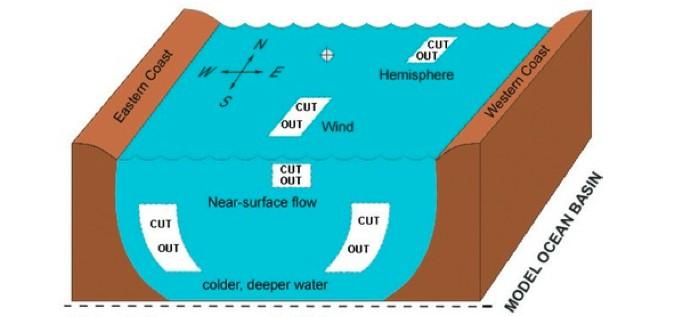
10 Materials: Scissors and paper brad or a paper clip with its inside end bent at a right angle to the rest of the clip. Figure 1 (last page of this Investigation) provides a Model Ocean Basin manipulative. Use scissors to separate the top and bottom diagrams along the dashed line and to remove the cut out areas in the top diagram along the dashed lines. The top block diagram represents the ocean surface with a vertical cross-section through a model ocean basin. 1. According to the cardinal direction arrows in the upper left hand corner of the top block diagram, the east boundary of any ocean basin is the land s [(eastern)(western)] coast. Use a pencil point to poke a small hole through the centers (each marked with a ) of the two diagrams. Lay the top diagram (Model Ocean Basin) directly over the bottom diagram (arrows) so the center points of the two coincide. To hold the two together and to provide an axis for rotation, place a paper brad pin through the holes you made on the diagrams. [If you are using a bent paper clip, lay the device flat on a table or desk so the clip doesn t fall out.] 2. While holding the top diagram stationary, rotate the bottom diagram through all 4 positions. Note that there are two different hemispheres, North (N) and South (S), each with two different wind directions and two different coasts possible. Hence, the total number of different combinations of hemispheres, wind directions, and coasts possible in our model is [(2)(6)(8)]. 3. Everywhere except at the equator, surface ocean water set in motion by the wind will be deflected by Earth s rotation. This deflection is called the Coriolis Effect. Turn the bottom diagram until a Northern Hemisphere combination appears, that is, when N appears in the upper right window. Compare the wind direction and the direction of the near-surface flow of water. (This is best seen by imagining yourself on the tail of the wind arrow and facing forward.) The near-surface flow of water is about 90 degrees to the [(right)(left)] of the wind direction. 4. Predict the flow direction of near-surface water produced by wind blowing from the opposite direction in the same hemisphere. Your prediction is that the near-surface flow will be about 90 degrees to the [(right)(left)] of the wind direction. 5. To check your prediction, rotate the bottom diagram until the other N appears in the window. From what you have learned so far in this investigation, wind-driven flow of near-surface water in the Northern Hemisphere is about 90 degrees to the [(right)(left)] of the wind direction. 6. Repeat the last three steps for the Southern Hemisphere. Again predict and note the difference between the wind direction and the direction of flow of near-surface water. The wind-driven flow of near-surface water in the Southern Hemisphere is about 90 degrees to the [(right)(left)] of the wind direction. 7. Near-surface water transported away from the coast tends to be replaced by cooler water from below in a process called upwelling. Rotate the bottom diagram to a position showing the wind blowing from south to north in the Southern Hemisphere. This combination will produce upwelling along the land s [(east)(west)] coast. 8. Coastal upwelling of nutrient-rich water stimulates the growth of marine plants which support fisheries. Now rotate the underlay to determine that in the Northern Hemisphere on the west
11 coast of Africa, upwelling and increased productivity will be generated by a wind blowing from [(south to north)(north to south)]. 9. When the wind transports near-surface water towards a coast, the warm surface layer thickens, decreasing biological productivity. This process is called downwelling. Rotate the underlay to a position showing the wind blowing from south to north in the Northern Hemisphere. This combination will produce downwelling along the land s [(eastern) (western)] coast. 10. Along the coast of central and northern California, surface winds generally blow from north to south in the summer and from south to north in the winter. The season of warm water transport towards the California coast and downwelling for this region is [(summer)(winter)]. 11. The season when cold coastal upwelling water along the California coast cools the overlying air to saturation and produces frequent fog is [(summer)(winter)]. 12. The Southern Hemisphere s trade winds, between the equator and 30 degrees S, have a strong component blowing from south to north. This causes upwelling, high biological productivity, and abundant fish harvests along the [(western)(eastern)] coasts of Africa and South America. Coastal Upwelling from a Different Perspective: As part of its NASA-sponsored Satellite Observations in Science Education, the University of Wisconsin-Madison Cooperative Institute for Meteorological Satellite Studies (CIMSS) leads an effort to improve the teaching and learning of the Earth system through quality educational resources that make use of satellite observations. To learn more about coastal upwelling via a learning activity developed in the Satellite Observations in Science Education Program, go to: Under the Learning Activities heading, scroll down to and click on 5) Coastal Upwelling. Proceed as directed through Module A entitled, The Biological Pump and the Significance of Upwelling. Optional: After completing this CIMSS module, consider clicking Main Menu on the screen at the lower left, then on 5) Coastal Upwelling, and complete Modules B and C. Summary: Coastal upwelling and downwelling of ocean water have significant effects on coastal weather and climates.
12
Ocean Inter-annual Variability: El Niño and La Niña. How does El Niño influence the oceans and climate patterns?
 Name: Date: Guiding Question: Ocean Inter-annual Variability: El Niño and La Niña How does El Niño influence the oceans and climate patterns? Introduction What is El Niño/La Niña? The El Niño/La Niña cycle
Currents. History. Pressure Cells 3/13/17. El Nino Southern Oscillation ENSO. Teleconnections and Oscillations. Neutral Conditions
 Teleconnections and Oscillations Teleconnection climate anomalies being related to each other over a large scale Oscillations: Macroscale movement of atmospheric systems that can influence weather, climate,
Lecture 13 El Niño/La Niña Ocean-Atmosphere Interaction. Idealized 3-Cell Model of Wind Patterns on a Rotating Earth. Previous Lecture!
 Lecture 13 El Niño/La Niña Ocean-Atmosphere Interaction Previous Lecture! Global Winds General Circulation of winds at the surface and aloft Polar Jet Stream Subtropical Jet Stream Monsoons 1 2 Radiation
Lecture 13. Global Wind Patterns and the Oceans EOM
 Lecture 13. Global Wind Patterns and the Oceans EOM Global Wind Patterns and the Oceans Drag from wind exerts a force called wind stress on the ocean surface in the direction of the wind. The currents
Module 3, Investigation 1: Briefing 1 What are the effects of ENSO?
 Background The changing temperatures of the tropical Pacific Ocean affect climate variability all over Earth. Ocean warming and cooling dramatically affect human activities by changing weather patterns
OCN 201 Lab Fall 2009 OCN 201. Lab 9 - El Niño
 OCN 201 Lab Fall 2009 OCN 201 Lab 9 - El Niño El Niño is probably one of the most widely publicized oceanic phenomena. If there s one single reason for that it s probably the fact that El Niño s presence
Your web browser (Safari 7) is out of date. For more security, comfort and the best experience on this site: Update your browser Ignore
 is out of date. For more security, comfort and the best experience on this site: Update your browser Ignore") Your web browser (Safari 7) is out of date. For more security, comfort and the best experience on this site: Update your browser Ignore L A NIÑA El Niño-Southern Oscillation (ENSO) For the complete encyclopedic
Your web browser (Safari 7) is out of date. For more security, comfort and the best experience on this site: Update your browser Ignore L A NIÑA El Niño-Southern Oscillation (ENSO) For the complete encyclopedic
The General Circulation and El Niño. Dr. Christopher M. Godfrey University of North Carolina at Asheville
 The General Circulation and El Niño Dr. Christopher M. Godfrey University of North Carolina at Asheville Global Circulation Model Air flow broken up into 3 cells Easterlies in the tropics (trade winds)
El Niño Lecture Notes
 El Niño Lecture Notes There is a huge link between the atmosphere & ocean. The oceans influence the atmosphere to affect climate, but the atmosphere also influences the ocean, which can also affect climate.
Equatorial upwelling. Example of regional winds of small scale
 Example of regional winds of small scale Sea and land breezes Note on Fig. 8.11. Shows the case for southern hemisphere! Coastal upwelling and downwelling. Upwelling is caused by along shore winds, that
Section 6. The Surface Circulation of the Ocean. What Do You See? Think About It. Investigate. Learning Outcomes
 Chapter 5 Winds, Oceans, Weather, and Climate Section 6 The Surface Circulation of the Ocean What Do You See? Learning Outcomes In this section, you will Understand the general paths of surface ocean currents.
Variability in the tropical oceans - Monitoring and prediction of El Niño and La Niña -
 Variability in the tropical oceans - Monitoring and prediction of El Niño and La Niña - Jun ichi HIROSAWA Climate Prediction Division Japan Meteorological Agency SST anomaly in Nov. 1997 1 ( ) Outline
- terminology. Further Reading: Chapter 07 of the text book. Outline. - characteristics of ENSO. -impacts
 (1 of 14) Further Reading: Chapter 07 of the text book Outline - terminology - characteristics of ENSO -impacts (2 of 14) Today: Introduction We want to look at another source of variability in the atmosphere
REMINDERS: UPCOMING REVIEW SESSIONS: - Thursday, Feb 27, 6:30-8:00pm in HSS 1330
 REMINDERS: Midterm 2: Friday, February 28 - lecture material covering chapters 6, 7, and 15 (since first midterm and through Wed lecture) - same Format as first midterm UPCOMING REVIEW SESSIONS: - Thursday,
CHAPTER 7 Ocean Circulation
 1 2 3 4 5 6 7 8 9 10 11 12 13 14 CHAPTER 7 Ocean Circulation Words Ocean currents Moving seawater Surface ocean currents Transfer heat from warmer to cooler areas Similar to pattern of major wind belts
The Child. Mean Annual SST Cycle 11/19/12
 Introduction to Climatology GEOGRAPHY 300 El Niño-Southern Oscillation Tom Giambelluca University of Hawai i at Mānoa and Pacific Decadal Oscillation ENSO: El Niño-Southern Oscillation PDO: Pacific Decadal
GEOS 201 Lab 13 Climate of Change InTeGrate Module Case studies 2.2 & 3.1
 Discerning Patterns: Does the North Atlantic oscillate? Climate variability, or short term climate change, can wreak havoc around the world. Dramatic year to year shifts in weather can have unanticipated
ENSO Cycle: Recent Evolution, Current Status and Predictions. Update prepared by Climate Prediction Center / NCEP 4 September 2012
 ENSO Cycle: Recent Evolution, Current Status and Predictions Update prepared by Climate Prediction Center / NCEP 4 September 2012 Outline Overview Recent Evolution and Current Conditions Oceanic Niño Index
Ocean Circulation, Food Webs and Climate What does the wind have to do with feeding fish (and feeding us)?
?") Ocean Circulation, Food Webs and Climate What does the wind have to do with feeding fish (and feeding us)? El Niño: Tropical Oceans and Global Climate Reading: 9.10-9.13, 9.15 Graphic: Upwelling off Cape
Ocean Circulation, Food Webs and Climate What does the wind have to do with feeding fish (and feeding us)? El Niño: Tropical Oceans and Global Climate Reading: 9.10-9.13, 9.15 Graphic: Upwelling off Cape
ENSO Cycle: Recent Evolution, Current Status and Predictions. Update prepared by Climate Prediction Center / NCEP 8 March 2010
 ENSO Cycle: Recent Evolution, Current Status and Predictions Update prepared by Climate Prediction Center / NCEP 8 March 2010 Outline Overview Recent Evolution and Current Conditions Oceanic Niño Index
Trade winds How do they affect the tropical oceans? 10/9/13. Take away concepts and ideas. El Niño - Southern Oscillation (ENSO)
") El Niño - Southern Oscillation (ENSO) Ocean-atmosphere interactions Take away concepts and ideas What is El Niño, La Niña? Trade wind and Walker circulation. What is the Southern Oscillation? Tropical
El Niño - Southern Oscillation (ENSO) Ocean-atmosphere interactions Take away concepts and ideas What is El Niño, La Niña? Trade wind and Walker circulation. What is the Southern Oscillation? Tropical
Lecture 24. El Nino Southern Oscillation (ENSO) Part 1
 Part 1") Lecture 24 El Nino Southern Oscillation (ENSO) Part 1 The most dominant phenomenon in the interannual variation of the tropical oceanatmosphere system is the El Nino Southern Oscillation (ENSO) over the
Lecture 24 El Nino Southern Oscillation (ENSO) Part 1 The most dominant phenomenon in the interannual variation of the tropical oceanatmosphere system is the El Nino Southern Oscillation (ENSO) over the
Ocean Currents that Redistribute Heat Globally
 Ocean Currents that Redistribute Heat Globally Ocean Circulation Ocean Currents Fig. CO7 OCEAN CURRENTS Surface ocean currents are similar to wind patterns: 1. Driven by Coriolis forces 2. Driven by winds
IX. Upper Ocean Circulation
 IX. Upper Ocean Circulation World Ocean Covers 71% of Earth s surface Contains 97% of surface water Arctic Ocean NH: 61% ocean, 39% land Pacific Ocean Atlantic Ocean Southern Ocean Indian Ocean SH: 81%
El Niño / Southern Oscillation (ENSO) and inter-annual climate variability
 and inter-annual climate variability") El Niño / Southern Oscillation (ENSO) and inter-annual climate variability seasonal cycle what is normal? monthly average conditions through a calendar year sea level pressure and surface winds surface
El Niño / Southern Oscillation (ENSO) and inter-annual climate variability seasonal cycle what is normal? monthly average conditions through a calendar year sea level pressure and surface winds surface
El Niño Unit (2.5 pts)
") T. James Noyes, El Camino College El Niño Unit (Topic 9B) page 1 Name: Section: El Niño Unit (2.5 pts) El Niño is a warm ocean current that flows along the Equator and towards the west coast of South America
T. James Noyes, El Camino College El Niño Unit (Topic 9B) page 1 Name: Section: El Niño Unit (2.5 pts) El Niño is a warm ocean current that flows along the Equator and towards the west coast of South America
Activity: Because the Earth Turns
 Activity: Because the Earth Turns Introduction: Almost everywhere on Earth (except at the equator), objects moving horizontally and freely (unconstrained) across Earth s surface travel in curved paths.
APPENDIX B NOAA DROUGHT ANALYSIS 29 OCTOBER 2007
 APPENDIX B NOAA DROUGHT ANALYSIS 29 OCTOBER 2007 ENSO Cycle: Recent Evolution, Current Status and Predictions Update prepared by Climate Prediction Center / NCEP October 29, 2007 Outline Overview Recent
Overview. Learning Goals. Prior Knowledge. UWHS Climate Science. Grade Level Time Required Part I 30 minutes Part II 2+ hours Part III
 Draft 2/2014 UWHS Climate Science Unit 3: Natural Variability Chapter 5 in Kump et al Nancy Flowers Overview This module provides a hands-on learning experience where students will analyze sea surface
March 4 th, 2019 Sample Current Affairs
 March 4 th, 2019 Sample Current Affairs 1. A weak El Niño is developing in the equatorial Pacific Ocean, which is expected to continue for a few months at least. What is El Nino? What causes El Nino? What
El Nino and Global Warming
 El Nino and Global Warming El Niño and Global Warming El Niño Climate Trade winds Barometric pressure Southern oscillation WHAT YOU WILL LEARN 1. You will identify the cause of El Niño events. 2. You will
Introduction to Oceanography OCE 1001
 Introduction to Oceanography OCE 1001 Lecture Notes Chantale Bégin & Jessica Fry Version 2.1 10. Ocean Circulation (Trujillo, Chapter 7) Major ocean currents are stable and predictable; they have been
Air Pressure and Wind
 Air Pressure and Wind 19.1 Understanding Air Pressure Air Pressure Defined Air pressure is the pressure exerted by the weight of air. Air pressure is exerted in all directions down, up, and sideways. The
Understanding El Nino-Monsoon teleconnections
 Understanding El Nino-Monsoon teleconnections Dr Neena Joseph Mani Earth & Climate Science INSA Anniversary General meeting, Session: Science in IISER Pune 27 th December 2017 Mean State of the equatorial
McKnight's Physical Geography 11e
 Chapter 2 Lecture McKnight's Physical Geography 11e Lectures Chapter 5 Atmospheric Pressure and Wind Michael Commons Ohio Northern University Atmospheric Pressure and Wind The Nature of Atmospheric Pressure
ORESU-G ORESU-G
 ORESU-G-97-008 ORESU-G 97-008 The Pacific Northwest: a Region of Transitions The unusual oceanic and atmospheric conditions of the Pacific Northwest create a remarkable and dynamic setting unlike any other
Chapter. Air Pressure and Wind
 Chapter Air Pressure and Wind 19.1 Understanding Air Pressure Air Pressure Defined Air pressure is the pressure exerted by the weight of air. 19.1 Understanding Air Pressure Air Pressure Defined Air pressure
The Setting - Climatology of the Hawaiian Archipelago. Link to Video of Maui Waves
 The Setting - Climatology of the Hawaiian Archipelago Link to Video of Maui Waves What caused this week s weather? What caused this weekend s weather? Today s Objective: Provide overview and description
Section 1. Global Wind Patterns and Weather. What Do You See? Think About It. Investigate. Learning Outcomes
 Chapter 5 Winds, Oceans, Weather, and Climate Section 1 Global Wind Patterns and Weather What Do You See? Learning Outcomes In this section, you will Determine the effects of Earth s rotation and the uneven
3/22/11. General Circulation of the Atmosphere. General Circulation of the Atmosphere
 Chapter 10 General refers to the average air flow, actual winds will vary considerably. Average conditions help identify driving forces. The basic cause of the general circulation is unequal heating of
Tropical Pacific Ocean remains on track for El Niño in 2014
 1 of 10 3/06/2014 3:33 PM ENSO Wrap-Up Current state of the Pacific and Indian Ocean Tropical Pacific Ocean remains on track for El Niño in 2014 Issued on Tuesday 3 June 2014 Product Code IDCKGEWWOO The
MFE 659 Lecture 2b El Niño/La Niña Ocean-Atmosphere Interaction. El Niño La Niña Ocean-Atmosphere Interaction. Intro to Ocean Circulation
 MFE 659 Lecture 2b El Niño/La Niña Ocean-Atmosphere Interaction El Niño La Niña Ocean-Atmosphere Interaction Outline Ocean Circulation El Niño La Niña Southern Oscillation ENSO 1 2 Intro to Ocean Circulation
Review for the second quarter. Mechanisms for cloud formation
 Review for the second quarter Mechanisms for cloud formation 1 Rising air expands and cools; Sinking air compresses and warms. (18) (24) Dry adiabatic lapse rate (10 o C/km): the rate of temperature decrease
Monitoring and prediction of El Niño and La Niña
 Monitoring and prediction of El Niño and La Niña Akio NARUI El Niño Monitoring and Prediction Group Climate Prediction Division Japan Meteorological Agency Outline 1. Introduction of El Niño and La Niña
Weather drivers in South Australia
 August 2008 Key facts Weather drivers in South Australia Major weather drivers in South Australia are: El Niño - Southern Oscillation frontal systems cut-off lows blocking highs Indian Ocean Dipole cloudbands
9/25/2014. Scales of Atmospheric Motion. Scales of Atmospheric Motion. Chapter 7: Circulation of the Atmosphere
 Chapter 7: Circulation of the Atmosphere The Atmosphere: An Introduction to Meteorology, 12 th Lutgens Tarbuck Lectures by: Heather Gallacher, Cleveland State University Scales of Atmospheric Motion Small-
Weather drivers in Victoria
 August 2008 Weather drivers in Victoria Key facts Major weather drivers in Victoria are: El Niño - Southern Oscillation frontal systems cut-off lows blocking highs Southern Annular Mode cloudbands Figure
ENSO Update Eastern Region. Michelle L Heureux Climate Prediction Center / NCEP/ NOAA 29 November 2016
 ENSO Update Eastern Region Michelle L Heureux Climate Prediction Center / NCEP/ NOAA 29 November 2016 Summary La Niña conditions are present.* ENSO Alert System Status: La Niña Advisory Equatorial sea
Chapter 9: Circulation of the Ocean
 Chapter 9: Circulation of the Ocean Tropical gardens on Britain s Scilly Isles. Only 48 kilometers (30 miles) off the coast of Cornwall at 50 N, these scenic islands lie in the path of the warm waters
Chapter 10: Global Wind Systems
 Chapter 10: Global Wind Systems Three-cell model of atmospheric circulation Intertropical Convergence Zone (ITCZ) Typical surface wind patterns Upper-level pressure and winds Climatological sea-level pressure
Lecture 13 March 24, 2010, Wednesday. Atmospheric Pressure & Wind: Part 4
 Lecture 13 March 24, 2010, Wednesday Atmospheric Pressure & Wind: Part 4 Synoptic scale winds Mesoscale winds Microscale winds Air-sea interactions The largest synoptic scale wind. Monsoon: Arabic for
RECTIFICATION OF THE MADDEN-JULIAN OSCILLATION INTO THE ENSO CYCLE
 RECTIFICATION OF THE MADDEN-JULIAN OSCILLATION INTO THE ENSO CYCLE By William S. Kessler and Richard Kleeman Journal of Climate Vol.13, 1999 SWAP, May 2009, Split, Croatia Maristella Berta What does give
Wednesday, September 27, 2017 Test Monday, about half-way through grading. No D2L Assessment this week, watch for one next week
 Wednesday, September 27, 2017 Test Monday, about half-way through grading No D2L Assessment this week, watch for one next week Homework 3 Climate Variability (due Monday, October 9) Quick comment on Coriolis
Global Circulations. GEOG/ENST 2331 Lecture 15 Ahrens: Chapter 10
 Global Circulations GEOG/ENST 2331 Lecture 15 Ahrens: Chapter 10 Last lecture Microscale (turbulence) Mesoscale (land/sea breeze) Synoptic scale (monsoon) Global scale (3 cell circulation) Three Cell Model
Global Impacts of El Niño on Agriculture
 Global Impacts of El Niño on Agriculture Presented to the University of Arkansas Division of Agriculture s Food and Agribusiness Series Webinar Series Presented by: Mark Brusberg and Brian Morris USDA
ENSO Wrap-Up. Current state of the Pacific and Indian Ocean
 18-11-2014 ENSO Wrap-Up Current state of the Pacific and Indian Ocean Tropical Pacific Ocean moves closer to El Niño The Pacific Ocean has shown some renewed signs of El Niño development in recent weeks.
Winds and Ocean Circulations
 Winds and Ocean Circulations AT 351 Lab 5 February 20, 2008 Sea Surface Temperatures 1 Temperature Structure of the Ocean Ocean Currents 2 What causes ocean circulation? The direction of most ocean currents
Current: large mass of continuously moving ocean water
 Ocean Currents Current: large mass of continuously moving ocean water Surface Currents--Wind Circulation These waters make up about 10% of all the water in the ocean. These waters are the upper 400 meters
Intermountain West Climate Summary
 Intermountain West Climate Summary A product of The Western Water Assessment Issued October 2010 Vol. 6, Issue 6 ENSO and Intermountain West Water Supply: A Review of Water Year 2010 and Outlook for Water
Appendix E Mangaone Stream at Ratanui Hydrological Gauging Station Influence of IPO on Stream Flow
 NZ Transport Agency Peka Peka to North Ōtaki Expressway Hydraulic Investigations for Expressway Crossing of Mangaone Stream and Floodplain Appendix E Mangaone Stream at Ratanui Hydrological Gauging Station
The Movement of Ocean Water. Currents
 The Movement of Ocean Water Currents Ocean Current movement of ocean water that follows a regular pattern influenced by: weather Earth s rotation position of continents Surface current horizontal movement
ESCI 107 The Atmosphere Lesson 11 Global Circulation
 Reading: Meteorology Today, Chapter 10 THE GLOBAL CIRCULATION ESCI 107 The Atmosphere Lesson 11 Global Circulation Latitudinal heat imbalance The tropics receive more radiation than they emit. The polar
18.1 Understanding Air Pressure 18.1 Understanding Air Pressure Air Pressure Defined Measuring Air Pressure Air pressure barometer
 18.1 Understanding Air Pressure 18.1 Understanding Air Pressure Air Pressure Defined Air pressure is the pressure exerted by the weight of air. Air pressure is exerted in all directions down, up, and sideways.
OCEANOGRAPHY STUDY GUIDE
 OCEANOGRAPHY STUDY GUIDE Chapter 2 Section 1 1. Most abundant salt in ocean. Sodium chloride; NaCl 2. Amount of Earth covered by Water 71% 3. Four oceans: What are they? Atlantic, Pacific, Arctic, Indian
Module 3, Investigation 1: Briefing 1 What are the effects of ENSO?
 Module 3, Investigation 1: Briefing 1 Background The changing temperatures of the tropical Pacific Ocean affect climate variability all over Earth. Ocean warming and cooling dramatically affect human activities
ENSO: El Niño Southern Oscillation
 ENSO: El Niño Southern Oscillation La Niña the little girl El Niño the little boy, the child LO: explain a complete ENSO cycle and assess the net affects on fish recruitment John K. Horne University of
Recent Atmospheric and Oceanic Circulation Changes Affecting Winter Weather in North America. Dr. Art Douglas Professor Emeritus Creighton University
 Recent Atmospheric and Oceanic Circulation Changes Affecting Winter Weather in North America Dr. Art Douglas Professor Emeritus Creighton University Outline 1. The 2018 El Nino: A Northern Hemisphere induced
Lesson: Atmospheric Dynamics
 Lesson: Atmospheric Dynamics By Keith Meldahl Corresponding to Chapter 8: Atmospheric Circulation Our atmosphere moves (circulates) because of uneven solar heating of the earth s surface, combined with
The Air-Sea Interaction. Masanori Konda Kyoto University
 2 The Air-Sea Interaction Masanori Konda Kyoto University 2.1 Feedback between Ocean and Atmosphere Heat and momentum exchange between the ocean and atmosphere Atmospheric circulation Condensation heat
Leeuwin Current - Reading
 Leeuwin Current At 5,500 kilometres, the Leeuwin is our longest ocean current! One of Australia s most influential natural features, the Leeuwin Current, has been confirmed as the longest continuous coastal
ATS150: Global Climate Change. Oceans and Climate. Icebergs. Scott Denning CSU 1
 The Oceans Wind-Driven Gyre Circulations Icebergs Scott Denning CSU 1 Surface Balance of Forces friction coriolis wind stress resultant current Wind stress accelerates surface water Friction couples surface
Upwelling and Phytoplankton Productivity
 Name: Date: Guiding Questions: Upwelling and Phytoplankton Productivity How does nutrient concentration influence phytoplankton growth in coastal and open ocean waters? What and where are the upwelling
Lesson: Ocean Circulation
 Lesson: Ocean Circulation By Keith Meldahl Corresponding to Chapter 9: Ocean Circulation As this figure shows, there is a connection between the prevailing easterly and westerly winds (discussed in Chapter
Climate briefing. Wellington region, February Alex Pezza and Mike Thompson Environmental Science Department
 Climate briefing Wellington region, February 2016 Alex Pezza and Mike Thompson Environmental Science Department For more information, contact the Greater Wellington Regional Council: Wellington PO Box
ENSO Jigsaw [Key Science Knowledge Module]
![ENSO Jigsaw [Key Science Knowledge Module]](/thumbs/83/88958439.jpg "ENSO Jigsaw [Key Science Knowledge Module]") ` 3 Teacher Edition 2-3 days ENSO Jigsaw [Key Science Knowledge Module] Activity Overview This module is the most important learning module in terms of the physical science aspects associated with the
` 3 Teacher Edition 2-3 days ENSO Jigsaw [Key Science Knowledge Module] Activity Overview This module is the most important learning module in terms of the physical science aspects associated with the
El Nino/La Nina. What is El Nino? From NOAA website
 El Nino/La Nina What is El Nino? From NOAA website El Nino was originally recognized by fishermen off the coast of South America as the appearance of unusually warm water in the Pacific Ocean, occurring
THE ATMOSPHERE. WEATHER and CLIMATE. The Atmosphere 10/12/2018 R E M I N D E R S. PART II: People and their. weather. climate?
 R E M I N D E R S Two required essays are due by Oct. 30, 2018. (A third may be used for extra credit in place of a Think Geographically essay.) ESSAY TOPICS (choose any two): Contributions of a noted
and the Link between Oceans, Atmosphere, and Weather
 Geography Worksheet Instructions Using a map, atlas, or any other materials your teacher suggests, label the following on the blank map provided. 1. Label East, West, North, and South. 2. Label the following
Name: OBJECTIVES: By the end of today s lesson, you will be able to
 7 th Grade Science Unit: Water s Cycles and Patterns Lesson: WCP 21 Name: Date: Monday, October 3, 2016 Homeroom: _ OBJECTIVES: By the end of today s lesson, you will be able to SWBAT Explain how currents
Lecture Outlines PowerPoint. Chapter 18 Earth Science 11e Tarbuck/Lutgens
 Lecture Outlines PowerPoint Chapter 18 Earth Science 11e Tarbuck/Lutgens 2006 Pearson Prentice Hall This work is protected by United States copyright laws and is provided solely for the use of instructors
GEOS 513 ENSO: Past, Present and Future
 GEOS 513 ENSO: Past, Present and Future Jessica Conroy Department of Geosciences Stephen W. Bieda, III Department of Atmospheric Sciences February 22, 2006: Regional Teleconnections (Observations) References:
For Class Today How does ocean water circulate? Ocean currents, surface currents, gyres, currents & climate, upwelling, deep ocean circulation
 For Class Today Modified Cornell Notes on section 16.1 (pg. 448-453) **Follow the guide in your ISN and previous notes for help** Heading: How does ocean water circulate? Left hand side categories: Ocean
Meteorology I Pre test for the Second Examination
 Meteorology I Pre test for the Second Examination MULTIPLE CHOICE 1. A primary reason why land areas warm up more rapidly than water areas is that a) on land, all solar energy is absorbed in a shallow
Lecture 29. The El-Niño Southern Oscillation (ENSO) La Niña = the girl; corresponds to the opposite climate situation
 La Niña = the girl; corresponds to the opposite climate situation") Lecture 29 The El-Niño Southern Oscillation (ENSO) El Niño is Spanish for Christ child, the name given by fishermen to a warm ocean current off the coast of Peru/Ecuador that in some years occurs near
Lecture 29 The El-Niño Southern Oscillation (ENSO) El Niño is Spanish for Christ child, the name given by fishermen to a warm ocean current off the coast of Peru/Ecuador that in some years occurs near
Section 3: Atmospheric Circulation
 Section 3: Atmospheric Circulation Preview Key Ideas The Coriolis Effect Global Winds Local Winds Maps in Action Key Ideas Explain the Coriolis effect. Describe the global patterns of air circulation,
Pacific Climate Variability
 Pacific Climate Variability Pacific Islands Climate Education Partnership You may have heard the term climate variability. What does the term climate variability mean? What are the causes and effects of
Lornshill Academy. Geography Department Higher Revision Physical Environments - Atmosphere
 Lornshill Academy Geography Department Higher Revision Physical Environments - Atmosphere Physical Environments Atmosphere Global heat budget The earth s energy comes from solar radiation, this incoming
El Niño and the Winter Weather Outlook
 El Niño and the 2015-2016 Winter Weather Outlook 2015 NASEO Annual Meeting http://www.ospo.noaa.gov/products/ocean/sst/anomaly/ NWS Boston February 10, 2015 Jimmy Taeger Meteorologist National Weather
Sailing the Seas: Wind Driven Ocean Circulation Ocean Gyres
 Sailing the Seas: Wind Driven Ocean Circulation Ocean Gyres Ocean Currents What Happens at the Coast? Readings: Ch 9: 9.2-9.6, 9.8-9.13 Graphic: America's Cup sailboat race off Newport, Rhode Island. J.
TEACHER VERSION: Suggested Student Responses Included. Upwelling and Phytoplankton Productivity
 Name: Date: TEACHER VERSION: Suggested Student Responses Included Guiding Questions: Upwelling and Phytoplankton Productivity How does nutrient concentration influence phytoplankton growth in coastal and
Chapter 7: Circulation And The Atmosphere
 Chapter 7: Circulation And The Atmosphere Highly integrated wind system Main Circulation Currents: series of deep rivers of air encircling the planet Various perturbations or vortices (hurricanes, tornados,
SURFACE CURRENTS AND TIDES
 NAME SURFACE CURRENTS AND TIDES I. Origin of surface currents Surface currents arise due to the interaction of the prevailing wis a the ocean surface. Hence the surface wi pattern (Figure 1) plays a key
What s UP in the. Pacific Ocean? Learning Objectives
 What s UP in the Learning Objectives Pacific Ocean? In this module, you will follow a bluefin tuna on a spectacular migratory journey up and down the West Coast of North America and back and forth across
ESS15 Lecture 12. Review, tropical oceans & El Nino, and the thermohaline ocean circulation. Please see new reading material on website.
 ESS15 Lecture 12 Review, tropical oceans & El Nino, and the thermohaline ocean circulation. Please see new reading material on website. Review. I-clicker exercise: In this graph of Earth s energy imbalances
Ocean Current Worksheet
 Ocean Current Worksheet Temperature Affects and Surface Currents: Surface waters of the Earth s oceans are forced to move, primarily by winds. Where winds blow in the same direction for a long period of
3 Global Winds and Local Winds
 CHAPTER 15 3 Global Winds and Local Winds SECTION The Atmosphere BEFORE YOU READ After you read this section, you should be able to answer these questions: What causes wind? What is the Coriolis effect?
Name Date L.O: SWBAT explain what breezes, planetary winds, ocean currents & monsoons are.
 Name Date L.O: SWBAT explain what breezes, planetary winds, ocean currents & monsoons are. 1. A cool breeze is blowing toward the land from the ocean on a warm, cloudless summer day. This condition is
Copy and answer the following in your marble composition book. 1. Which direction is the wind deflected in the northern hemisphere?
 Copy and answer the following in your marble composition book. 1. Which direction is the wind deflected in the northern hemisphere? 2. Which direction is the wind deflected in the southern hemisphere?
10% water in the world is tied up in the surface ocean currents. (above the pycnocline) Primary source is wind: Westerlies, Trades, Polar Easterlies
 Primary source is wind: Westerlies, Trades, Polar Easterlies") Oceanography Chapter 9 10% water in the world is tied up in the surface ocean currents. (above the pycnocline) Primary source is wind: Westerlies, Trades, Polar Easterlies Coriolis deflects winds (and
Oceanography Chapter 9 10% water in the world is tied up in the surface ocean currents. (above the pycnocline) Primary source is wind: Westerlies, Trades, Polar Easterlies Coriolis deflects winds (and
El Niño climate disturbance in northern Madagascar and in the Comoros
 El Niño climate disturbance in northern Madagascar and in the Comoros Rabeharisoa J. M.¹, Ratiarison A.¹, Rakotovao N.¹, Salim Ahmed Ali¹ ² (*) ¹ Laboratoire de Dynamique de l Atmosphère, du Climat et