THE RESPONSE OF THE GULF OF MAINE COASTAL CURRENT SYSTEM TO LATE-SPRING
|
|
|
- Derek Armstrong
- 6 years ago
- Views:
Transcription
, which extends from southern Nova Scotia to Cape Cod Massachusetts, has two principal branches; the Eastern Maine Coastal Current (EMCC) that extends along the")
1 THE RESPONSE OF THE GULF OF MAINE COASTAL CURRENT SYSTEM TO LATE-SPRING NORTHEASTERLY WIND FORCING Neal R Pettigrew and Huijie Xue School of Marine Sciences University of Maine, Orono ME The Gulf of Maine Coastal Current (GMCC), which extends from southern Nova Scotia to Cape Cod Massachusetts, has two principal branches; the Eastern Maine Coastal Current (EMCC) that extends along the eastern coast of Maine to Penobscot Bay, and the Western Maine Coastal Current (WMCC) that extends westward from Penobscot Bay to Massachusetts Bay. The GMCC is primarily a buoyancy-driven system with both principal branches increasing their transport in the spring and summer, and flowing southwestward against the mean wind forcing during this period. When the winds blow from the northeast they reinforce the buoyancy forcing rather than opposing it, and the response is a clear acceleration toward the southwest. Under typical summer conditions the transport of the EMCC is significantly greater that the WMCC. The reduction of southwestward transport near Penobscot Bay is accomplished via an offshore veering of a variable portion of the EMCC that recirculates cyclonically within the eastern Gulf of Maine (Figure 1). The degree of summer recirculation versus leakage into the WMCC varies from nearly complete recirculation to nearly continuous through flow. Although the fundamental reasons for this circulation pattern and its variation are not confidently known, it is clear that the interplay of the barotropic and baroclinic along-isobath pressure gradients is a major contributor. These pressure gradients are associated with the Penobscot outflow and the transition from the tidally-mixed eastern shelf to the more vertically stratified western shelf. The degree of continuity, or leakage, between the EMCC and WMCC has important implications with respect to transport of planktonic organisms including the toxic redtide dino-flagellate Alexandrium fundyense. Because Alexandrium is present in the core of the EMCC from late spring through early fall in most (if not all) years, its transmission southwestward along the shelf, versus its diversion offshore, or may be a key factor in the appearance of red tide outbreaks in the western coastal Gulf of Maine. While the factors controlling the continuity of the EMCC and WMCC are not well known, wind stress direction has a demonstrable effect. When winds blow from the northeast, both Figure 1. Summer surface circulation schematic coastal currents accelerate toward the southwest with the WMCC transport often increasing more dramatically than the EMCC transport. This reduction of the EMCC/WMCC transport ratio is consistent with the notion that northeasterly wind forcing decreases, or even eliminates, the offshore veering of the EMCC, thereby enhancing the connectivity between the two principal branches of the GMCC. 1
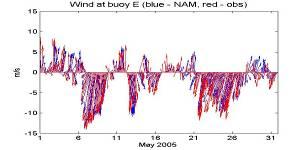
2 Figure 2. Monthly averages of the surface current speed and direction at GoMOOS buoys I and E (see Fig. 1) that are located respectively in the EMCC and WMCC. Speed is plotted on the abscissa and direction is idicated by the unit vectors. The seasonal disparity of the strength of the EMCC and WMCC is an indicator of the offshore veering of the EMCC near Penobscot Bay. The anomaly in May of 2005, where the two currents are of equal strength, indicates flow through from east to west during this period. In the May and June of 2005, GoM was exposed to repeated northeasterly wind events unusual not so much for their strength, but rather for their late-season timing that occurred after the onset of the red tide season and the establishment of the summer circulation pattern characterized by offshore veering of the EMCC. Data from the GoMOOS buoy array and output from the operational GoMOOS nowcast /forecast circulation model provide an unprecedented chance to examine the effects of northeast wind events during the late spring in the GoM. Figure 3 shows the locations of the GOMOOS buoy and CODAR arrays, and Figure 4 shows daily averages of wind speed and direction for buoys E, B and A. Records from Buoy E are not shown because the wind sensor malfunctioned during the first episode. Figure 4 shows that the May and June of 2005 were characterized by three distinct periods of northeast winds centered on with peaks around May 8, May 24, and June 15. The May wind episodes reached daily average peaks of 12 at buoys E and B, and 14 ms -1 at buoy A in Mass Bay. The June episode was shorter lived and weaker at 8-9 m s -1. The corresponding daily-averaged surface current speeds (at 2m depth) for May and June 2005 for Buoys I, E, B, and A are shown in Figure 5. The strongest current response to the three wind episodes were observed at Buoy A, which also showed closer coupling with wind, less lag, and the surface currents reversing when the reversed after the strong northeasterlies. In contrast currents at Buoy I were uniformly southwestward regardless of wind direction, and showed little response to the June 15 event. 2
 and")

3 Figure 3. Locations of GoMOOS buoys (red dots) and CODAR Staions (lavendar bullseyes. Figure 4. Wind speeds and directions at Buoys E, B, and A during May and June
4 Figure 5. Surface Current Speed and Direction for Buoys I, E, B, and A for May and June Response to the northeast winds were least apparent at Buoy B (and M and L, not shown) perhaps due to coastline orientation. 4

5 During the June northeast wind, the three northernmost CODAR units were operating. Although these three stations are too far apart for the consistent overlapping of radials required for continuous surface current vector calculations under typical wave conditions, the high wind conditions provided idea wave conditions for extended range. A tidally-averaged CODAR derived surface current map is shown in Figure 6. The surface current map shows strong and extensive southwestward flow over the shelf from Isle au Haut to Biddeford and westward flow from Biddeford to the entrance of Mass Bay. It is notable the characteristic summer offshore veering the EMCC near Penobscot Bay is entirely absent, that (as observed by the buoys) the flow in the vicinity of Buoy I in the EMCC was relatively weak, and the flow in Jordan Basin ((near Buoy M) was NNW. This current map suggests that the surface flow east of Penobscot Bay and South of Biddeford had a significant shoreward component that would tend to bring the Alexandrium cells ashore. It also confirms that the cells from the EMCC, rather than being shunted offshore near Penobscot Bay, would flow westward into the WMCC. The sum of the physical data suggest strongly that northeasterly winds in the spring and summer are capable of disrupting the offshore veering of the EMCC that typically interrupts much of the southwestward transport in the vicinity of Penobscot Bay. This wind-induced flow through would carry Alexandrium cells from the EMCC father westward and could have substantially contributed to the widespread red tide outbreak that began in late spring of Figure 6. Tidally-averaged CODAR surface current map for June 15, 2005 during the peak of the northeasterly wind event. Note the absence of the offshore flows near Penobscot bay that typically divert the EMCC water into the interior of the GoM during summer. Instead the current vectors suggest continuous flow from the eastern shelf to the western shelf. 5
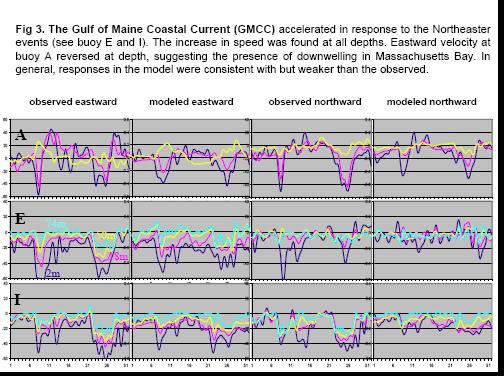
6 Numerical Modeling Results: The Gulf of Maine Ocean Observing System (GoMOOS) Nowcast/Forecast System (Xue et al., 2005) has provided daily nowcast and forecast of current, temperature, salinity and sea level in the Gulf of Maine since It provided timely estimates to aid strategic sampling program in the field during the outbreak of harmful algal bloom in Massachusetts Bay in May 2005 The numerical study focuses on two storm events in May Figure 7 compares the numerical meteorological nowcasts with the GoMOOS buoys winds. Results show that the model did an excellent job of simulating the wind field at the buoys locations. The wind had a strongly northerly component during the first Northeaster from 7-10 May, especially in the western Gulf of Maine, while it was more northeasterly and easterly during the second event from May. Similar responses were found for both events with downwelling in Massachusetts Bay and acceleration of the Maine Coastal Current. Both events triggered strong mixing episodes and resulted in well-mixed water columns along much of the coast. Surface temperature decreased by 2-5 deg C, while the temperature at 50 m increased by 1-2 deg C. The resulting water temperatures were thus a combined product of the downwelling, vertical mixing, and advection of colder waters from the east. The stratification tended to reestablish quickly between events largely due primarily to surface heating. When compared with in situ observations, the model responses appeared to be somewhat weaker and more gradual especially during the onset of the first Northeaster. Synoptic Description of the Storms During the first storm event, the low began to form over the South Atlantic Bight on 6 May. It moved northeastward and intensified in the next 24 hours. Strong wind began to impact the Gulf of Maine on 7 May around 12:00 UST, estimated wind speed exceeded 10 m/s in Massachusetts Bay and was close to 15 m/s over Georges Bank. Wind was from the northeast over the western Gulf, but mostly from east over the eastern Gulf. The Gulf received considerable amount of rainfall. On 8 May, the low was situated south of the Gulf of Maine with strong wind (> 15 m/s) over the entire Gulf (stronger in the west than in the east), and changing from northerlies and northeasterlies in the west to northeasterlies and easterlies in the east. The cyclone continued moving eastward and wind speeds gradually diminished over the Gulf of Maine from ~ 10 m/s on 9 May to ~ 5 m/s on 10 May. The second storm period was characterized by two back-to-back storms, one from 21 to 23 and another from 24 to 27 May, resulting in nearly a week strong winds. Northerly wind dominated in the former period, and northeasterly wind the latter. The maximum wind speeds during the storms were on the order of 17 m/s. The comparison between modeled and observed currents is shown in Figure 8. The response to the storm winds is well rendered although the observed response was a bit sharper than the modeled winds. In general the eastward component was better modeled than the northward component, especially at buoys E and I. The model accurately shows the currents at E accelerating to speeds comparable to the currents at I, as observed in the data, and as is consistent with the conceptual model of the northeasterly winds opening the gate and allowing EMCC waters to flow southwestward into the WMCC region. 6
7 N N. 7
ATMS 310 Tropical Dynamics
 ATMS 310 Tropical Dynamics Introduction Throughout the semester we have focused on mid-latitude dynamics. This is not to say that the dynamics of other parts of the world, such as the tropics, are any
3 The monsoon currents in an OGCM
 3 The monsoon currents in an OGCM The observations show that both Ekman drift and geostrophy contribute to the surface circulation in the north Indian Ocean. The former decays rapidly with depth, but the
Lecture 13 El Niño/La Niña Ocean-Atmosphere Interaction. Idealized 3-Cell Model of Wind Patterns on a Rotating Earth. Previous Lecture!
 Lecture 13 El Niño/La Niña Ocean-Atmosphere Interaction Previous Lecture! Global Winds General Circulation of winds at the surface and aloft Polar Jet Stream Subtropical Jet Stream Monsoons 1 2 Radiation
Alongshore wind stress (out of the page) Kawase/Ocean 420/Winter 2006 Upwelling 1. Coastal upwelling circulation
 Kawase/Ocean 420/Winter 2006 Upwelling 1. Coastal upwelling circulation") Kawase/Ocean 420/Winter 2006 Upwelling 1 Coastal upwelling circulation We found that in the northern hemisphere, the transport in the surface Ekman layer is to the right of the wind. At the bottom, there
Kawase/Ocean 420/Winter 2006 Upwelling 1 Coastal upwelling circulation We found that in the northern hemisphere, the transport in the surface Ekman layer is to the right of the wind. At the bottom, there
Wednesday, September 27, 2017 Test Monday, about half-way through grading. No D2L Assessment this week, watch for one next week
 Wednesday, September 27, 2017 Test Monday, about half-way through grading No D2L Assessment this week, watch for one next week Homework 3 Climate Variability (due Monday, October 9) Quick comment on Coriolis
Red Tide Blooms in Casco Bay (2010 State of the Bay Presentation)
") University of Southern Maine USM Digital Commons Presentations Casco Bay Estuary Partnership (CBEP) 2010 Red Tide Blooms in Casco Bay (2010 State of the Bay Presentation) Scott Libby Battelle Don Anderson
University of Southern Maine USM Digital Commons Presentations Casco Bay Estuary Partnership (CBEP) 2010 Red Tide Blooms in Casco Bay (2010 State of the Bay Presentation) Scott Libby Battelle Don Anderson
Water circulation in Dabob Bay, Washington: Focus on the exchange flows during the diurnal tide transitions
 Water circulation in Dabob Bay, Washington: Focus on the exchange flows during the diurnal tide transitions Jeong-in Kang School of Oceanography University of Washington (206) 349-7319 nortiumz@u.washington.edu
Regional Oceanography: an Introduction
 176 Regional Oceanography: an Introduction Fig. 11.1. Topography of the Indian Ocean. The 1000, 3000, and 5000 m isobaths are shown, and regions less than 3000 m deep are shaded. South of Australia the
Currents measurements in the coast of Montevideo, Uruguay
 Currents measurements in the coast of Montevideo, Uruguay M. Fossati, D. Bellón, E. Lorenzo & I. Piedra-Cueva Fluid Mechanics and Environmental Engineering Institute (IMFIA), School of Engineering, Research
Dynamics of mean and subtidal flow on the New England shelf
 JOURNAL OF GEOPHYSICAL RESEARCH, VOL. 108, NO. C8, 3281, doi:10.1029/2002jc001417, 2003 Dynamics of mean and subtidal flow on the New England shelf R. Kipp Shearman and Steven J. Lentz Department of Physical
Wind Driven Circulation Indian Ocean and Southern Ocean
 Wind Driven Circulation Indian Ocean and Southern Ocean Lecture 18 MAR 350 Spring 2017 Reading: Knauss Chapter 7 ECCO2 model animation ecco2_sst_flow (2).mp4 Mean surface height and currents DPO Fig. 11.1
CHAPTER 7 Ocean Circulation
 1 2 3 4 5 6 7 8 9 10 11 12 13 14 CHAPTER 7 Ocean Circulation Words Ocean currents Moving seawater Surface ocean currents Transfer heat from warmer to cooler areas Similar to pattern of major wind belts
How fast will be the phase-transition of 15/16 El Nino?
 How fast will be the phase-transition of 15/16 El Nino? YOO-GEUN HAM D E P A R T M E N T O F O C E A N O G R A P H Y, C H O N N A M N A T I O N A L U N I V E R S I T Y 2015/16 El Nino outlook One of strongest
The General Circulation and El Niño. Dr. Christopher M. Godfrey University of North Carolina at Asheville
 The General Circulation and El Niño Dr. Christopher M. Godfrey University of North Carolina at Asheville Global Circulation Model Air flow broken up into 3 cells Easterlies in the tropics (trade winds)
Winds and Ocean Circulations
 Winds and Ocean Circulations AT 351 Lab 5 February 20, 2008 Sea Surface Temperatures 1 Temperature Structure of the Ocean Ocean Currents 2 What causes ocean circulation? The direction of most ocean currents
Ocean Circulation. Si Hui Lee and Frances Wen. You can access ME at
 Ocean Circulation Si Hui Lee and Frances Wen You can access ME at http://tinyurl.com/oceancirculation Earth - the blue planet - 71% area covered by the oceans - 3/4 of ocean area between 3000-6000m deep
Evaluation of ACME coupled simulation Jack Reeves Eyre, Michael Brunke, and Xubin Zeng (PI) University of Arizona 4/19/3017
 University of Arizona 4/19/3017") Evaluation of ACME coupled simulation Jack Reeves Eyre, Michael Brunke, and Xubin Zeng (PI) University of Arizona 4/19/3017 1. Introduction We look at surface variables in the tropical Pacific from a coupled
Evaluation of ACME coupled simulation Jack Reeves Eyre, Michael Brunke, and Xubin Zeng (PI) University of Arizona 4/19/3017 1. Introduction We look at surface variables in the tropical Pacific from a coupled
RECTIFICATION OF THE MADDEN-JULIAN OSCILLATION INTO THE ENSO CYCLE
 RECTIFICATION OF THE MADDEN-JULIAN OSCILLATION INTO THE ENSO CYCLE By William S. Kessler and Richard Kleeman Journal of Climate Vol.13, 1999 SWAP, May 2009, Split, Croatia Maristella Berta What does give
Currents. History. Pressure Cells 3/13/17. El Nino Southern Oscillation ENSO. Teleconnections and Oscillations. Neutral Conditions
 Teleconnections and Oscillations Teleconnection climate anomalies being related to each other over a large scale Oscillations: Macroscale movement of atmospheric systems that can influence weather, climate,
Lesson: Ocean Circulation
 Lesson: Ocean Circulation By Keith Meldahl Corresponding to Chapter 9: Ocean Circulation As this figure shows, there is a connection between the prevailing easterly and westerly winds (discussed in Chapter
Climate briefing. Wellington region, February Alex Pezza and Mike Thompson Environmental Science Department
 Climate briefing Wellington region, February 2016 Alex Pezza and Mike Thompson Environmental Science Department For more information, contact the Greater Wellington Regional Council: Wellington PO Box
Lecture 24. El Nino Southern Oscillation (ENSO) Part 1
 Part 1") Lecture 24 El Nino Southern Oscillation (ENSO) Part 1 The most dominant phenomenon in the interannual variation of the tropical oceanatmosphere system is the El Nino Southern Oscillation (ENSO) over the
Lecture 24 El Nino Southern Oscillation (ENSO) Part 1 The most dominant phenomenon in the interannual variation of the tropical oceanatmosphere system is the El Nino Southern Oscillation (ENSO) over the
Red Tide Surveys of Massachusetts Bay, 1999
 Red Tide Surveys of Massachusetts Bay, 1999 Massachusetts Water Resources Authority Environmental Quality Department Report ENQUAD 2000-17 FINAL REPORT Red Tide Surveys of Massachusetts Bay, 1999 by D.
Lecture 13. Global Wind Patterns and the Oceans EOM
 Lecture 13. Global Wind Patterns and the Oceans EOM Global Wind Patterns and the Oceans Drag from wind exerts a force called wind stress on the ocean surface in the direction of the wind. The currents
APPENDIX G WEATHER DATA SELECTED EXTRACTS FROM ENVIRONMENTAL DATA FOR BCFS VESSEL REPLACEMENT PROGRAM DRAFT REPORT
 APPENDIX G WEATHER DATA SELECTED EXTRACTS FROM ENVIRONMENTAL DATA FOR BCFS VESSEL REPLACEMENT PROGRAM DRAFT REPORT Prepared for: B.C. Ferries Services Inc. Prepared by: George Roddan, P.Eng. Roddan Engineering
JOURNAL OF GEOPHYSICAL RESEARCH, VOL. 107, NO. C11, 3184, doi: /2001jc001190, 2002
 JOURNAL OF GEOPHYSICAL RESEARCH, VOL. 107, NO. C11, 3184, doi:10.1029/2001jc001190, 2002 A modeling study of shelf circulation off northern California in the region of the Coastal Ocean Dynamics Experiment
Yellow Sea with contributions by John R. Apel
 with contributions by John R. Apel Overview The is a shallow inland sea lying between northeastern China and the Korean Peninsula, with depths in its central north-south trough in excess of 60 to 80 m
The Dynamics of Northwest Summer Winds over the Santa Barbara Channel
 1042 MONTHLY WEATHER REVIEW VOLUME 129 The Dynamics of Northwest Summer Winds over the Santa Barbara Channel ERIC D. SKYLLINGSTAD AND PHILIP BARBOUR College of Oceanic and Atmospheric Sciences, Oregon
Lecture 13 March 24, 2010, Wednesday. Atmospheric Pressure & Wind: Part 4
 Lecture 13 March 24, 2010, Wednesday Atmospheric Pressure & Wind: Part 4 Synoptic scale winds Mesoscale winds Microscale winds Air-sea interactions The largest synoptic scale wind. Monsoon: Arabic for
Data Analysis of the Seasonal Variation of the Java Upwelling System and Its Representation in CMIP5 Models
 Data Analysis of the Seasonal Variation of the Java Upwelling System and Its Representation in CMIP5 Models Iulia-Mădălina Ștreangă University of Edinburgh University of Tokyo Research Internship Program
What happened to the South Coast El Niño , squid catches? By M J Roberts Sea Fisheries Research Institute, Cape Town
 What happened to the South Coast El Niño 1997-98, squid catches? By M J Roberts Sea Fisheries Research Institute, Cape Town Introduction FROM ALL ACCOUNTS, the intense 1997-98 c impacted most regions in
Figure 4, Photo mosaic taken on February 14 about an hour before sunset near low tide.
 The Impact on Great South Bay of the Breach at Old Inlet Charles N. Flagg and Roger Flood School of Marine and Atmospheric Sciences, Stony Brook University Since the last report was issued on January 31
Air Pressure and Wind
 Air Pressure and Wind 19.1 Understanding Air Pressure Air Pressure Defined Air pressure is the pressure exerted by the weight of air. Air pressure is exerted in all directions down, up, and sideways. The
APPENDIX B NOAA DROUGHT ANALYSIS 29 OCTOBER 2007
 APPENDIX B NOAA DROUGHT ANALYSIS 29 OCTOBER 2007 ENSO Cycle: Recent Evolution, Current Status and Predictions Update prepared by Climate Prediction Center / NCEP October 29, 2007 Outline Overview Recent
Mesoscale Meteorology
 Mesoscale Meteorology METR 4433 Spring 2015 3.4 Drylines The dryline is a mesoscale phenomena whose development and evaluation is strongly linked to the PBL. In this section, we will consider its general
Variability in the tropical oceans - Monitoring and prediction of El Niño and La Niña -
 Variability in the tropical oceans - Monitoring and prediction of El Niño and La Niña - Jun ichi HIROSAWA Climate Prediction Division Japan Meteorological Agency SST anomaly in Nov. 1997 1 ( ) Outline
2 Observations. 2.1 Ekman drift
 2 Observations To define the monsoon currents and the associated circulation in the north Indian Ocean, we use climatological wind-stress data to estimate the surface Ekman drift, and hydrography and altimeter
Trade winds How do they affect the tropical oceans? 10/9/13. Take away concepts and ideas. El Niño - Southern Oscillation (ENSO)
") El Niño - Southern Oscillation (ENSO) Ocean-atmosphere interactions Take away concepts and ideas What is El Niño, La Niña? Trade wind and Walker circulation. What is the Southern Oscillation? Tropical
El Niño - Southern Oscillation (ENSO) Ocean-atmosphere interactions Take away concepts and ideas What is El Niño, La Niña? Trade wind and Walker circulation. What is the Southern Oscillation? Tropical
The Setting - Climatology of the Hawaiian Archipelago. Link to Video of Maui Waves
 The Setting - Climatology of the Hawaiian Archipelago Link to Video of Maui Waves What caused this week s weather? What caused this weekend s weather? Today s Objective: Provide overview and description
Meteorology. Circle the letter that corresponds to the correct answer
 Chapter 7 Worksheet 2 Meteorology Name: Circle the letter that corresponds to the correct answer 1) Which of the following factors contributes to the general subsidence in the latitude zone 20 degrees
Chapter. Air Pressure and Wind
 Chapter Air Pressure and Wind 19.1 Understanding Air Pressure Air Pressure Defined Air pressure is the pressure exerted by the weight of air. 19.1 Understanding Air Pressure Air Pressure Defined Air pressure
Appendix 5: Currents in Minas Basin. (Oceans Ltd. 2009)
") Appendix 5: Currents in Minas Basin (Oceans Ltd. 29) Current in Minas Basin May 1, 28 March 29, 29 Submitted To: Minas Basin Pulp and Power P.O. Box 41 53 Prince Street Hansport, NS, BP 1P by 22, Purdy
Appendix 5: Currents in Minas Basin (Oceans Ltd. 29) Current in Minas Basin May 1, 28 March 29, 29 Submitted To: Minas Basin Pulp and Power P.O. Box 41 53 Prince Street Hansport, NS, BP 1P by 22, Purdy
IX. Upper Ocean Circulation
 IX. Upper Ocean Circulation World Ocean Covers 71% of Earth s surface Contains 97% of surface water Arctic Ocean NH: 61% ocean, 39% land Pacific Ocean Atlantic Ocean Southern Ocean Indian Ocean SH: 81%
Introduction to Oceanography OCE 1001
 Introduction to Oceanography OCE 1001 Lecture Notes Chantale Bégin & Jessica Fry Version 2.1 10. Ocean Circulation (Trujillo, Chapter 7) Major ocean currents are stable and predictable; they have been
10% water in the world is tied up in the surface ocean currents. (above the pycnocline) Primary source is wind: Westerlies, Trades, Polar Easterlies
 Primary source is wind: Westerlies, Trades, Polar Easterlies") Oceanography Chapter 9 10% water in the world is tied up in the surface ocean currents. (above the pycnocline) Primary source is wind: Westerlies, Trades, Polar Easterlies Coriolis deflects winds (and
Oceanography Chapter 9 10% water in the world is tied up in the surface ocean currents. (above the pycnocline) Primary source is wind: Westerlies, Trades, Polar Easterlies Coriolis deflects winds (and
(20 points) 1. ENSO is a coupled climate phenomenon in the tropical Pacific that has both regional and global impacts.
 1. ENSO is a coupled climate phenomenon in the tropical Pacific that has both regional and global impacts.") SIO 210 Problem Set 4 Answer key December 1, 2014 Due Dec. 12, 2014 (20 points) 1. ENSO is a coupled climate phenomenon in the tropical Pacific that has both regional and global impacts. (2 points) a)
SIO 210 Problem Set 4 Answer key December 1, 2014 Due Dec. 12, 2014 (20 points) 1. ENSO is a coupled climate phenomenon in the tropical Pacific that has both regional and global impacts. (2 points) a)
Mass coral mortality under local amplification of 2 C ocean warming
 Mass coral mortality under local amplification of C ocean warming Thomas M. DeCarlo, Anne L. Cohen, George T.F. Wong, Kristen A. Davis, Pat Lohmann, Keryea Soong correspondence to: tdecarlo@uwa.edu.au
El Nino/La Nina. What is El Nino? From NOAA website
 El Nino/La Nina What is El Nino? From NOAA website El Nino was originally recognized by fishermen off the coast of South America as the appearance of unusually warm water in the Pacific Ocean, occurring
ESCI 107 The Atmosphere Lesson 11 Global Circulation
 Reading: Meteorology Today, Chapter 10 THE GLOBAL CIRCULATION ESCI 107 The Atmosphere Lesson 11 Global Circulation Latitudinal heat imbalance The tropics receive more radiation than they emit. The polar
Hui Wang, Mike Young, and Liming Zhou School of Earth and Atmospheric Sciences Georgia Institute of Technology Atlanta, Georgia
 Water Cycle between Ocean and Land and Its Influence on Climate Variability over the South American-Atlantic Regions as Determined by SeaWinds Scatterometers Rong Fu Hui Wang, Mike Young, and Liming Zhou
5. El Niño Southern Oscillation
 5. El Niño Southern Oscillation Copyright 2006 Emily Shuckburgh, University of Cambridge. Not to be quoted or reproduced without permission. EFS 5/1 Ocean-Atmosphere Coupling Tropical atmosphere/ocean,
OCN 201 Lab Fall 2009 OCN 201. Lab 9 - El Niño
 OCN 201 Lab Fall 2009 OCN 201 Lab 9 - El Niño El Niño is probably one of the most widely publicized oceanic phenomena. If there s one single reason for that it s probably the fact that El Niño s presence
Circulation over the continental shelf of the western and southwestern Gulf of Mexico
 JOURNAL OF GEOPHYSICAL RESEARCH, VOL. 116,, doi:10.1029/2011jc007007, 2011 Circulation over the continental shelf of the western and southwestern Gulf of Mexico Jean Dubranna, 1 Paula Pérez Brunius, 1
Scales of Atmospheric Motion Scale Length Scale (m) Time Scale (sec) Systems/Importance Molecular (neglected)
 Time Scale (sec) Systems/Importance Molecular (neglected)") Supplement Wind, Fetch and Waves Scales of Atmospheric Motion Scale Length Scale (m) Time Scale (sec) Systems/Importance Molecular 10-7 - 10-2 10-1 (neglected) Coriolis not important Turbulent 10-2 10
Supplement Wind, Fetch and Waves Scales of Atmospheric Motion Scale Length Scale (m) Time Scale (sec) Systems/Importance Molecular 10-7 - 10-2 10-1 (neglected) Coriolis not important Turbulent 10-2 10
Figure 1, Chart showing the location of the Breach at Old Inlet and sensors deployed in Great South Bay.
 The Impact on Great South Bay of the Breach at Old Inlet Charles N. Flagg and Roger Flood School of Marine and Atmospheric Sciences, Stony Brook University The Great South Bay project (http://po.msrc.sunysb.edu/gsb/)
The Ocean is a Geophysical Fluid Like the Atmosphere. The Physical Ocean. Yet Not Like the Atmosphere. ATS 760 Global Carbon Cycle The Physical Ocean
 The Physical Ocean The Ocean is a Geophysical Fluid Like the Atmosphere Three real forces: Gravity Pressure gradients Friction Two apparent forces: Coriolis and Centrifugal Geostrophic & Hydrostatic balances
TEMPERATURE BEHAVIOR during WINTER in ANTARCTICA
 TEMPERATURE BEHAVIOR during WINTER in ANTARCTICA The temperature behaviour during winter in Antarctica was investigated. Special attention was devoted to anomalous strong warmings, ranging between 20 and
< Ocean Conditions and Salmon Forecasting
 Variations in source waters which feed the California Current may be the mechanism which links the PDO and climate change with ecosystem response Bill Peterson, Senior Scientist Northwest Fisheries Science
LONG WAVES OVER THE GREAT BARRIER REEF. Eric Wolanski ABSTRACT
 LONG WAVES OVER THE GREAT BARRIER REEF by Eric Wolanski k ABSTRACT Low-frequency forcing of water currents over the continental shelf f Australia is quite strong and should be taken into account when the
Impact of the tides, wind and shelf circulation on the Gironde river plume dynamics
 Impact of the tides, wind and shelf circulation on the Gironde river plume dynamics F. Toublanc 1, N. Ayoub 2, P. Marsaleix 3, P. De Mey 2 1 CNES/LEGOS 2 CNRS/LEGOS 3 CNRS/LA, Toulouse, France 5th GODAE
18.1 Understanding Air Pressure 18.1 Understanding Air Pressure Air Pressure Defined Measuring Air Pressure Air pressure barometer
 18.1 Understanding Air Pressure 18.1 Understanding Air Pressure Air Pressure Defined Air pressure is the pressure exerted by the weight of air. Air pressure is exerted in all directions down, up, and sideways.
Cross-Shore Variation of Wind-Driven Flows on the Inner Shelf in Long Bay, South Carolina, United States
 University of South Carolina Scholar Commons Faculty Publications Earth and Ocean Sciences, Department of 3-24-2006 Cross-Shore Variation of Wind-Driven Flows on the Inner Shelf in Long Bay, South Carolina,
National Weather Service
 National Weather Service Gulf of California Moisture Surges Gulf of California moisture surges, or simply Gulf Surges, are one of the most researched components of the North American Monsoon. As early
Atmospheric Rossby Waves Fall 2012: Analysis of Northern and Southern 500hPa Height Fields and Zonal Wind Speed
 Atmospheric Rossby Waves Fall 12: Analysis of Northern and Southern hpa Height Fields and Zonal Wind Speed Samuel Schreier, Sarah Stewart, Ashley Christensen, and Tristan Morath Department of Atmospheric
Chapter 2. Turbulence and the Planetary Boundary Layer
 Chapter 2. Turbulence and the Planetary Boundary Layer In the chapter we will first have a qualitative overview of the PBL then learn the concept of Reynolds averaging and derive the Reynolds averaged
MODELING INDIAN OCEAN CIRCULATION: BAY OF BENGAL FRESH PLUME AND ARABIAN SEA MINI WARM POOL
 MODELING INDIAN OCEAN CIRCULATION: BAY OF BENGAL FRESH PLUME AND ARABIAN SEA MINI WARM POOL P. N. Vinayachandran* 1 1, *2 and J. Kurian* * 1 Centre for Atmospheric and Oceanic Sciences, Indian Institute
ATS150: Global Climate Change. Oceans and Climate. Icebergs. Scott Denning CSU 1
 The Oceans Wind-Driven Gyre Circulations Icebergs Scott Denning CSU 1 Surface Balance of Forces friction coriolis wind stress resultant current Wind stress accelerates surface water Friction couples surface
Current measurements in Lakes Rotorua and Rotoehu 2010 and 2011
 Current measurements in Lakes Rotorua and Rotoehu 21 and 211 NIWA Client Report: HAM211-15 February 211 NIWA Project: BOP1123 Current measurements in Lakes Rotorua and Rotoehu 21 and 211 Max Gibbs Rod
MEAN DISTRIBUTION AND SEASONAL VARIABILITY OF COASTAL CURRENTS AND TEMPERATURE IN THE FLORIDA KEYS WITH IMPLICATIONS FOR LARVAL RECRUITMENT
 BULLETIN OF MARINE SCIENCE, 64(1): 35 56, 1999 MEAN DISTRIBUTION AND SEASONAL VARIABILITY OF COASTAL CURRENTS AND TEMPERATURE IN THE FLORIDA KEYS WITH IMPLICATIONS FOR LARVAL RECRUITMENT Thomas N. Lee
EARTH, PLANETARY, & SPACE SCIENCES 15 INTRODUCTION TO OCEANOGRAPHY. LABORATORY SESSION #6 Fall Ocean Circulation
 EARTH, PLANETARY, & SPACE SCIENCES 15 INTRODUCTION TO OCEANOGRAPHY LABORATORY SESSION #6 Fall 2017 Ocean Circulation The focus of the Lab this week is circulation of the ocean and atmosphere. Here, you
Oceans and the Global Environment: Lec 2 taking physics and chemistry outdoors. the flowing, waving ocean
 Oceans and the Global Environment: Lec 2 taking physics and chemistry outdoors the flowing, waving ocean Peter Rhines 1 Eric Lindahl 2 Bob Koon 2, Julie Wright 3 www.ocean.washington.edu/courses/has221a-08
8.4 COASTAL WIND ANOMALIES AND THEIR IMPACT ON SURFACE FLUXES AND PROCESSES OVER THE EASTERN PACIFIC DURING SUMMER
 8.4 COASTAL WIND ANOMALIES AND THEIR IMPACT ON SURFACE FLUXES AND PROCESSES OVER THE EASTERN PACIFIC DURING SUMMER Ragoth Sundararajan * and Darko Koraĉin Desert Research Institute, Reno, NV, USA Michael
Agronomy 406 World Climates
 Agronomy 406 World Climates January 30, 2018 Monsoons. Ocean properties and circulation. Review for today: Online textbook: 1.3.1 (Sea water) Composition and properties. For Thursday: Rahmstorf, S.: The
Historical Analysis of Montañita, Ecuador for April 6-14 and March 16-24
 Historical Analysis of Montañita, Ecuador for April 6-14 and March 16-24 Prepared for the ISA by Mark Willis and the Surfline Forecast and Science Teams Figure 1. Perfect Right- hander at Montañita, Ecuador
Lecture 18: El Niño. Atmosphere, Ocean, Climate Dynamics EESS 146B/246B
 Lecture 18: El Niño Atmosphere, Ocean, Climate Dynamics EESS 146B/246B El Niño Transient equatorial motions: Kelvin and Rossby waves. Positive feedback mechanism associated with air-sea coupling. Atmospheric
Assessment Schedule 2016 Earth and Space Science: Demonstrate understanding of processes in the ocean system (91413)
") NCEA Level 3 Earth & Space Science (91413) 2016 page 1 of 6 Assessment Schedule 2016 Earth and Space Science: Demonstrate processes in the ocean system (91413) Evidence Statement Q Evidence with with Excellence
NCEA Level 3 Earth & Space Science (91413) 2016 page 1 of 6 Assessment Schedule 2016 Earth and Space Science: Demonstrate processes in the ocean system (91413) Evidence Statement Q Evidence with with Excellence
10.6 The Dynamics of Drainage Flows Developed on a Low Angle Slope in a Large Valley Sharon Zhong 1 and C. David Whiteman 2
 10.6 The Dynamics of Drainage Flows Developed on a Low Angle Slope in a Large Valley Sharon Zhong 1 and C. David Whiteman 2 1Department of Geosciences, University of Houston, Houston, TX 2Pacific Northwest
THE CIRCULATION IN THE NORTERN PART OF THE DENMARK STRAIT AND ITS VARIABILITY ABSTRACT
 ICES em 19991L:06 THE CIRCULATION IN THE NORTERN PART OF THE DENMARK STRAIT AND ITS VARIABILITY Steingrimur J6nsson Marine Research Institute and University of Akureyri, Glenirgata 36, 600 Akureyri, Iceland,
Monday, October 2, Watch for new assessment (Week 4/5 review) TA s have your tests, please see key (at course website)
 TA s have your tests, please see key (at course website)") Monday, October 2, 2017 Watch for new assessment (Week 4/5 review) TA s have your tests, please see key (at course website) Homework 3 Due date Wednesday, Oct 11 (8 pm) Be ready to watch another important
Monday, October 2, 2017 Watch for new assessment (Week 4/5 review) TA s have your tests, please see key (at course website) Homework 3 Due date Wednesday, Oct 11 (8 pm) Be ready to watch another important
SIO 210 Introduction to Physical Oceanography Mid-term examination November 4, 2013; 50 minutes
 SIO 210 Introduction to Physical Oceanography Mid-term examination November 4, 2013; 50 minutes Closed book; one sheet of your own notes is allowed. A calculator is allowed. (100 total points.) Possibly
Synoptic Lab, MET 421, Test 2
 Name Synoptic Lab, MET 421, Test 2 1) For a 15 ms -1 east wind blowing towards Milwaukee a) Calculate the distance to the east shore of Lake Michigan. You can use a distance calculator website such as
INDIA METEOROLOGICAL DEPARTMENT (MINISTRY OF EARTH SCIENCES) SOUTHWEST MONSOON-2010 END OF SEASON REPORT
 SOUTHWEST MONSOON-2010 END OF SEASON REPORT") INDIA METEOROLOGICAL DEPARTMENT (MINISTRY OF EARTH SCIENCES) SOUTHWEST MONSOON-2010 END OF SEASON REPORT HIGHLIGHTS For the country as a whole, the rainfall for the season (June-September) was 102% of
INDIA METEOROLOGICAL DEPARTMENT (MINISTRY OF EARTH SCIENCES) SOUTHWEST MONSOON-2010 END OF SEASON REPORT HIGHLIGHTS For the country as a whole, the rainfall for the season (June-September) was 102% of
Abrupt marine boundary layer changes revealed by airborne in situ and lidar measurements
 Abrupt marine boundary layer changes revealed by airborne in situ and lidar measurements David A. Rahn 1, Thomas R. Parish 2, and David Leon 2 1 Univeristy of Kansas 2 Univeristy of Wyoming Precision Atmospheric
Nortek Technical Note No.: TN-021. Chesapeake Bay AWAC Evaluation
 Nortek Technical Note No.: TN-021 Title: Chesapeake Bay AWAC Evaluation Last Edited: October 5, 2004 Authors: Eric Siegel-NortekUSA, Chris Malzone-NortekUSA, Torstein Pedersen- Number of Pages: 12 Chesapeake
Climatology of the 10-m wind along the west coast of South American from 30 years of high-resolution reanalysis
 Climatology of the 10-m wind along the west coast of South American from 30 years of high-resolution reanalysis David A. Rahn and René D. Garreaud Departamento de Geofísica, Facultad de Ciencias Físicas
Prediction of Nearshore Waves and Currents: Model Sensitivity, Confidence and Assimilation
 Prediction of Nearshore Waves and Currents: Model Sensitivity, Confidence and Assimilation H. Tuba Özkan-Haller College of Oceanic and Atmospheric Sciences Oregon State University, 104 Ocean Admin Bldg
Section 6. The Surface Circulation of the Ocean. What Do You See? Think About It. Investigate. Learning Outcomes
 Chapter 5 Winds, Oceans, Weather, and Climate Section 6 The Surface Circulation of the Ocean What Do You See? Learning Outcomes In this section, you will Understand the general paths of surface ocean currents.
The Impact on Great South Bay of the Breach at Old Inlet Charles N. Flagg School of Marine and Atmospheric Sciences, Stony Brook University
 The Impact on Great South Bay of the Breach at Old Inlet Charles N. Flagg School of Marine and Atmospheric Sciences, Stony Brook University The previous report provided a detailed look at the conditions
Wave Prediction in the Santa Barbara Channel
 Wave Prediction in the Santa Barbara Channel OCS Study MMS 2001-055 Final Technical Summary Final Study Report U.S. Department of the Interior Minerals Management Service Pacific OCS Region Wave Prediction
Chapter 22, Section 1 - Ocean Currents. Section Objectives
 Chapter 22, Section 1 - Ocean Currents Section Objectives Intro Surface Currents Factors Affecting Ocean Currents Global Wind Belts (you should draw and label a diagram of the global wind belts) The Coriolis
The Air-Sea Interaction. Masanori Konda Kyoto University
 2 The Air-Sea Interaction Masanori Konda Kyoto University 2.1 Feedback between Ocean and Atmosphere Heat and momentum exchange between the ocean and atmosphere Atmospheric circulation Condensation heat
JOURNAL OF GEOPHYSICAL RESEARCH, VOL. 107, NO. C9, 3123, doi: /2000jc000768, 2002
 JOURNAL OF GEOPHYSICAL RESEARCH, VOL. 107, NO. C9, 3123, doi:10.1029/2000jc000768, 2002 A modeling study of shelf circulation off northern California in the region of the Coastal Ocean Dynamics Experiment:
Module 3, Investigation 1: Briefing 1 What are the effects of ENSO?
 Background The changing temperatures of the tropical Pacific Ocean affect climate variability all over Earth. Ocean warming and cooling dramatically affect human activities by changing weather patterns
SIO 210 Final examination Wednesday, December 11, PM Sumner auditorium Name:
 SIO 210 Final examination Wednesday, December 11, 2013 2-5 PM Sumner auditorium Name: Turn off all phones, ipods, etc. and put them away. This is a closed book exam. You may use one page of notes, both
WEATHER SYSTEMS OF MIDDLE LATITUDES
 CHAPTER 10 WEATHER SYSTEMS OF MIDDLE LATITUDES MULTIPLE CHOICE QUESTIONS 1. In equal volumes, which one of the following air masses exerts the highest surface air pressure? a. cp *b. A c. mp d. ct e. mt
Understanding Offshore Wind s Enhanced Peak Load Coincidence for East Coast Transmission Systems
 WINDPOWER 2013 Conference Chicago, May 8, 2013 Understanding Offshore Wind s Enhanced Peak Load Coincidence for East Coast Transmission Systems Bruce Bailey, Ph.D. President/CEO Co Authors: Whitney Wilson,
Chapter 10. Thermohaline Circulation
 Chapter 10. Thermohaline Circulation Main References: Schloesser, F., R. Furue, J. P. McCreary, and A. Timmermann, 2012: Dynamics of the Atlantic meridional overturning circulation. Part 1: Buoyancy-forced
Chapter 10. Adjacent seas of the Pacific Ocean
 Chapter 10 Adjacent seas of the Pacific Ocean Although the adjacent seas of the Pacific Ocean do not impact much on the hydrography of the oceanic basins, they cover a substantial part of its area and
Sensitivity of Coastal Currents Near Pt. Conception to Forcing by Three Different Winds: ECMWF, COAMPS and Blended SSM/I-ECMWF-Buoy Winds
 Sensitivity of Coastal Currents Near Pt. Conception to Forcing by Three Different Winds: ECMWF, COAMPS and Blended SSM/I-ECMWF-Buoy Winds Changming Dong and Lie-Yauw Oey* Program in Atmospheric & Oceanic
Atmospheric Forcing and the Structure and Evolution of the Upper Ocean in the Bay of Bengal
 DISTRIBUTION STATEMENT A. Approved for public release; distribution is unlimited. Atmospheric Forcing and the Structure and Evolution of the Upper Ocean in the Bay of Bengal J. Thomas Farrar and Robert