AcquaTailings: A Tool for Streamlining Mining Water Budget
|
|
|
- Bartholomew Clarke
- 6 years ago
- Views:
Transcription
1 AcquaTailings: A Tool for Streamlining Mining Water Budget Gustavo Pereira, GeoHydroTech Engineering, São Paulo, Brazil, gpereira@ghtengenharia.com.br, hrocha@ghtengenharia.com.br, dhoffert@ghtengenharia.com.br, ppaiva@ghtengenharia.com.br Abstract Acquatailings is a Graphical User Interface (GUI) tool developed in-house by GeoHydroTech Engineering to streamline the assessment and prediction of mining water budgets in tailing dams. It enables the quick examination of the sensitivity of the results to the various input variables used in this type of study, such as the physical characteristics of the watershed and of the spillway, dry/bulk density of the mined material and the solid rate of the processed pulp, as well as water fluxes captured from adjoining streams or lost through infiltration. Acquatailings is capable of resolving monthly predictions of several mining water parameters that are important in the design, construction schedule, and operation of tailing dams. These variables include: the dam water level, flooded area, water volume, storage capacity, water deficit, meteorological balance, water/sediment occupation, and the spillway water volume, as well as a three-dimensional, crosssectional illustration of the water level in the dam. This tool also enables the visualization of other graphical outputs, such as normal intervals for precipitation and evaporation, and elevation-area-volume plots. Simulations are obtained using three climatic scenarios that span the entire spectrum of likely environments that this mining site may observe: dry threshold, normal, and wet threshold. The former scenario yields a combination of reduced monthly precipitation and enhanced monthly evaporation, albeit at the limit of what can be climatologically considered normal. The latter scenario is created with the opposite setup (increased monthly precipitation and suppressed evaporation), whereas the normal scenario uses monthly median values for these variables. The capabilities of this new tool are showcased in this study, using a dataset from a mining site in the northern part of Brazil. The region is characterized by a tropical savanna climate, with warm temperatures year-round, abundant annual rainfall, and pronounced wet and dry seasons. The precipitation in the region is also heavily influenced by cycles of the El Niño Southern Oscillation. Thus, Acquatailings was used to enable the proper long-term planning of mining water budgets for a tailings dam in the aforementioned region, ahead of the current El Niño cycle. Key words: mine water, simulation, tools, water budgets, climate 1226


2 Introduction Water balance studies are a fundamental step in the design, construction schedule, and operation of the tailings management facilities used in the mining industry. They are paramount not only to determine the stability of the balance in a given site, but they also allow for project managers to better understand the likelihood of scenarios where water scarcity or excess can develop. According to Papageorgiou et al. (2003) the vast majority of failures in tailings dams during the 1980s and early 1990s were a result of inappropriate water management. Consequently, examining the volatility of water budget results to the various contributing factors used in their calculation is essential to fully grasp the range of conditions for which a site manager must prepare, such as variations due to climatic oscillations. In order to expedite the sensitivity of our hydrological balance studies to various mining and hydrometeorological conditions observed at tailing dams, GeoHydroTech Engineering spearheaded a project to develop, in-house, a new software tool in the form of a user-friendly Graphical User Interface (GUI): AcquaTailings. This tool is useful to assess the uncertainty of the results due to climatic variation and unmeasurable empirical parameters, such as the system s efficiency and runoff coefficients. This software was designed to quickly simulate monthly forecasts for a myriad of mining water variables, such as the dam s water level, flooded area, and water volume, as well as its storage capacity (for sediment and water), and the reservoir s proportional occupation by water and sediment. It also calculates any potential water deficits at the dam site, the meteorological balance (i.e. the total monthly natural gain/loss of water at the reservoir solely due to precipitation and evaporation), and any volume of water released through a spillway. AcquaTailings is capable of producing an animation illustrating a three-dimensional cross-section of the water level in the dam, as well as the normal intervals for precipitation and evaporation, and elevation-area-volume plots. Figure 1 displays a picture of the AcquaTailings GUI workspace. Figure 1 Screen Capture of the AcquaTailings Graphics User Interface. 1227
3 Data & Methodology The method for calculating the bulk of the prognostic variables in AcquaTailings is fundamentally based on the continuity equation. As such, the reservoir s water budget is calculated as: V P A Δt D f = Vi + C1 + C2 P A Δt F + Q RW + Q RJ + Q NW + Q OG Q PW Q Where: V f = final volume at the beginning of each month (m 3 ); V i = initial volume at the end of each month (m 3 ); C 1 = runoff coefficient over dry land; C 2 = runoff coefficient over flooded areas; P = monthly precipitation (mm); A D = dry watershed area (m 2 ); A F = flooded watershed area (m 2 ); Q RW = water flowing back into the reservoir (m 3 /month); Q RJ = solid reject flow into the reservoir (m 3 /month); Q NW = new water captured into the reservoir (m 3 /month); Q OG = other inflows (m 3 /month); Q PW = flow of water pumped out of the reservoir to the mining plant (m 3 /month); Q OS = outflow of water due to seepage (m 3 / month); Q LW = water flow locked in the reject (m 3 / month); E = monthly evaporation (mm); and Q OL = other outflows (m 3 /month). OS Q LW E A Δt The simulations presented in this study are based on a tailings dam built for a copper mining site in the Brazilian State of Pará. This mining site, developed and operated by Avanco Resources Limited, and its watershed are characterized by the following general conditions: Dry Density: 1.67 t/m 3 Bulk Density: 2.95 t/m 3 Solid Rate: 20.4% Returned Reject: 90% Watershed Area: 0.87 km 2 Talweg Length: 1.24 km Relief: 28 m A Q OL For this site, we chose to make use of monthly precipitation and evaporation data for the city of Marabá, Brazil (obtained from the Brazilian Meteorology National Institute - INMET) as it meets the requirements of a reference station that can be used for climatic studies (World Meteorological Organization 1986). The Oceanic Niño Index (ONI) was obtained from NOAA s Climate Prediction Center to define the periods of El Niño. Warm episodes of the El Niño Southern Oscillation (ENSO), commonly known simply as El Niño, are characterized by ONI values greater or equal to 0.5 ºC (Kousky and Higgins 2007). The monthly precipitation and evaporation data were then divided into two groups. The El Niño dataset contains solely the monthly data during periods when that climatic phenomenon was identified in the ONI dataset. The other group, labeled Non El Niño, contains the remainder of the dataset. Three statistical parameters were calculated for each of these two data groups to define the range of most likely monthly meteorological conditions: the median, the lower tercile, and the upper tercile. The latter two parameters represent the limits of what could be considered climatologically normal to expect in an El Niño vs. a non El Niño month. In addition to developing forecasts using the median precipitation and evaporation during El Niño and non El Niño years, simulations were also made using a combination of the lower tercile of precipitation and upper tercile of evaporation (dubbed the dry threshold ), as well as a combination of the upper tercile of precipation and lower tercile of evaporation (hereby named wet threshold ). 1228
4 The statistical results for the precipitation and evaporation data are presented, respectively, in Tables 1 and 2. In broad terms, Table 1 shows that El Niño years in the region of Marabá are characterized by lower precipitation than non El Niño years, with statistically significant differences (p <0.05) observed between March and June, as well as in December. Trends in the evaporation data (Table 2) are not so obvious, but statistically significant differences are seen during the peak rainy months of March and April, both of which display higher evaporation rates in the region during El Niño years. Table 1 Precipitation climatology (in mm) for Marabá, Brazil between 1973 and 2011 during El Niño years and during years without El Niño. Month Lower Tercile Median Upper Tercile El Niño Non El Niño El Niño Non El Niño El Niño Non El Niño Jan Feb Mar Apr May Jun Jul Aug Sep Oct Nov Dec Table 2 Evaporation climatology (in mm) for Marabá, Brazil between 1973 and 2011 during El Niño years and during years without El Niño. Month Lower Tercile Median Upper Tercile El Niño Non El Niño El Niño Non El Niño El Niño Non El Niño Jan Feb Mar Apr May Jun Jul Aug Sep Oct Nov Dec In this study we showcase three of the products generated by AcquaTailings: The Reservoir s Water Level, the Reservoir s Water Volume, and the Reservoir s Occupied Volume. These products will be initially assessed in a situation when no additional new water is captured from an adjoining stream into the reservoir (i.e. all water in the reservoir is the result of the rainfall and runoff). Five-year forecasts will be generated under El Niño and non-el Niño meteorological conditions for the dry and wet thresholds. Based on these results, a schedule for capturing new water from the stream is proposed and a new set of forecasts is generated. 1229
5 Results Figure 2 reveals the monthly forecasts generated by AcquaTailings for the Water Volume (in cubic meters) inside the tailings dam reservoir. The top panel shows the 5-year simulation using the dry threshold of El Niño years, which corresponds to the driest scenario in our study. It reveals a grave drought situation in the reservoir, which displays significant water accumulation only during the first half of Using the dry threshold for Non El Niño years (second panel), a slightly better picture emerges, with water accumulating during the wet season and depleting during the dry season in the middle of each calendar year. The third panel exhibits a marginally improved condition for the El Niño wet threshold, albeit one where water is still fully depleted in the reservoir during the first few dry seasons. Lastly, using Non El Niño wet threshold conditions, the reservoir manages to store water starting in January 2016, and peaking at 1.5x10 6 m 3 of water at the of the simulation in May Figure 3 presents the same set of simulations as the previous figure, but displays the monthly water level. In the absence of any water, the values represent the reservoir floor level (which will progressively rise as the tailings are deposited each month). The red line denotes the elevation of the dam s crest, which undergo two planned heightening construction phases, while the yellow line corresponds to the level at which water from the reservoir begins to flow out through the spillway. It reveals that water levels remain safely under the spillway level in all four simulations, the closest situation being observed in mid-2018 and mid-2020 using the wet threshold of Non El Niño years (bottom panel). The percentage volume occupation of reservoir by tailings deposits and water is presented in Figure 4. It unveils a time-lapse forecast of the proportional occupation of the reservoir. It is important to keep in mind that every time the dam undergoes a heightening period, the reservoir capacity increases, driving downward the reservoir s occupation percentage values. Once again, in the top panel (El Niño dry threshold) we observe a situation of water scarcity that would, in practice, not allow the mining plant to operate. The second and third panels once again illustrate when the reservoir s water is depleted whilst the tailings accumulation forecasts do not change (even though, in practice, exhausting the water supply would effectively shut down the plant and cease the tailings deposits in the reservoir). Only in the wet threshold for Non El Niño years (bottom panel) we observe a situation where water is consistently present and the reservoir s capacity is near 100% at the end of the simulation. The aforementioned results reveal the necessity of developing a new water capture plan, from an adjacent stream into the reservoir, in order to maintain a volume of water that can safely enable the continuous operation of the mining plant under all potential climatic scenarios simulated here. An examination of the meteorological balance product in AcquaTailings (not shown), indicated that the period from June to November of each year is the most conducive for natural water losses in the reservoir. Thus, we proposed the monthly capture of m 3 of new water from the adjoining stream during these 6 months for the first 3 years of operation of this tailings dam. Figure 5 presents the same product displayed in Figure 4, but the monthly forecasts are obtained while incorporating the proposed plan for new water capture. The top panel of Figure 5 (El Niño dry threshold), which represents the case where the hydrological setup of the reservoir is most strained, demonstrates that the suggested plan is sufficient to maintain some water stored in the reservoir even under this difficult scenario. Conversely, by looking at the simulation that uses the wet threshold of Non El Niño years, the proposed schedule of new water capture maintains the water level just below full capacity during its projected peak occupation months (January 2018 and April 2020). Therefore, one can conclude that this would be an ideal plan to prepare for the entire array of climatic conditions under which the tailings dams at this site may need to be ready to operate. 1230


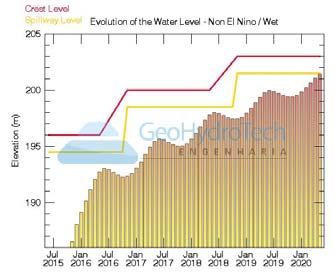
6 Figure 2 Monthly forecasts for the Reservoir s Water Volume under 4 scenarios (top to bottom): Dry Threshold in El Niño Years, Dry Threshold in Non El Niño Years, Wet Threshold in El Niño Years, and Wet Threshold in Non El Niño Years. Figure 3 Monthly forecasts for the Reservoir s Water Level under 4 scenarios (top to bottom): Dry Threshold in El Niño Years, Dry Threshold in Non El Niño Years, Wet Threshold in El Niño Years, and Wet Threshold in Non El Niño Years. The red line represents the dam s crest level, and the yellow line represents the spillway base level. 1231
: Dry Threshold in El Niño Years, Dry Threshold in Non El Niño")


7 Figure 4 Monthly forecasts for the Reservoir s Occupied Volume under 4 scenarios (top to bottom): Dry Threshold in El Niño Years, Dry Threshold in Non El Niño Years, Wet Threshold in El Niño Years, and Wet Threshold in Non El Niño Years. The brown shading indicates percentage occupied by tailings, and the blue shading indicates the percentage occupied by water. Figure 5 Same as Figure 4, but including a proposed schedule of new water capture from an adjoining stream into the reservoir. 1232
8 Conclusions Acquatailings is a tool newly developed by GeoHydroTech to produced monthly forecasts of mining water parameters that are useful in planning and operating tailings dams. The usefulness of this tool is showcased for a tailings dam located in the northern part of Brazil, a region known to be significantly impacted by the climatic cycles of ENSO. Warm ENSO episodes (i.e. El Niño) are characterized by below normal precipitation during the rainy season at this tailings dam site. Consequently, we examined the susceptibility of mining water budgets at this location under four climatic scenarios: El Niño dry threshold, Non El Niño dry threshold, El Niño wet threshold, and Non El Niño wet threshold. The results of this study reveal that this tailings dam, as it was designed, would not be able operate without the capture of a new water. While the dry and wet threshold represent the upper and lower limits of what could be considered climatologically normal in a region, observing five consecutive years of El Niño-like conditions is far less reasonable and, as such, the El Niño simulations represent a more extreme situation under which this mining site may need to operate. Nonetheless, examining these four scenarios provide a safe margin for the mining operator to plan their production. The simulation for the El Niño dry threshold produced the hydrologic setup with greatest water scarcity, whereas the Non El Niño wet threshold generated the environment with greatest abundance of water. Using the reservoir water volume, water level, and occupied volume products, it was possible to determine that an adequate water budget balance can be reached by capturing m 3 of new water per month, in the first three years of the simulation, between the months of June and November. The forecasts obtained using this proposed water capture plan was capable of providing a constant supply of water at the reservoir while maintaining the water level within safety regulations (i.e. beneath the spillway base level). One of the other capabilities of Acquatailings that was not explored here, is the ability to quickly determine the sensitivity of the results to various unmeasurable empirical parameters used in the forecast, such as the efficiency of the system, the runoff coefficient in flooded areas (which is impacted by the uneven distribution of tailings and the presence of dead pools). The usage of all features in AcquaTailings enables the time-efficient development of sound hydrological balance studies. Furthermore, AcquaTailings offers a tool to quickly obtain a better alternative to deterministic studies that are solely based on mean values for all the various components used in this type of study. Acknowledgements The authors would like to sincerely express gratitude to Avanco Resources Limited for authorizing the usage of the data for one of their mining projects in this study. In particular, we would like to recognize Antonio Landi Borges and Otávio Monteiro for facilitating this authorization. References Kousky VE, Higgins RW (2007) An Alert Classification System for Monitoring and Assessing the ENSO Cycle. Weather and Forecasting 22: Papageorgiou G, Fourie A, Blight GE (2003) An investigation of flow failures from breached tailings dams. In: A review of scientific contributions on the Stava Valley disaster, 19th July 1985, Pitagora Editrice, Bologna, Italy. World Meteorological Organiation (1986) Guidelines on the selection of Reference Climatological Stations (RCSs) from the existing Climatological Station Network. WMO/TD-Number 130, Geneva, Switzerland. 1233
Variability in the tropical oceans - Monitoring and prediction of El Niño and La Niña -
 Variability in the tropical oceans - Monitoring and prediction of El Niño and La Niña - Jun ichi HIROSAWA Climate Prediction Division Japan Meteorological Agency SST anomaly in Nov. 1997 1 ( ) Outline
GEOS 513 ENSO: Past, Present and Future
 GEOS 513 ENSO: Past, Present and Future Jessica Conroy Department of Geosciences Stephen W. Bieda, III Department of Atmospheric Sciences February 22, 2006: Regional Teleconnections (Observations) References:
Properties. terc.ucdavis.edu 8
 Physical Properties 8 Lake surface level Daily since 1900 The lowest lake level on record was 6,220.26 feet on Nov. 30, 1992. Since 1900, lake level has varied by more than 10 feet. Lake level typically
El Niño climate disturbance in northern Madagascar and in the Comoros
 El Niño climate disturbance in northern Madagascar and in the Comoros Rabeharisoa J. M.¹, Ratiarison A.¹, Rakotovao N.¹, Salim Ahmed Ali¹ ² (*) ¹ Laboratoire de Dynamique de l Atmosphère, du Climat et
Drought and the Climate of the Ogallala Aquifer
 Drought and the Climate of the Ogallala Aquifer Nolan J. Doesken Colorado Climate Center Colorado State University Presented at Ogallala Symposium, Wray, Colorado February 20, 2006 Prepared by Odie Bliss
CUPSIM Water Supply Variability Study All information subject to change.
 . 1 IN A NUTSHELL The CUP Water Supply Variability Study is an opportunistic, proactive example of responsible water system management The CUP is very complex and approaching full demand The study capitalizes
Drought: What is the Status?
 Drought: What is the Status? Nolan J. Doesken Colorado Climate Center Colorado State University http://ccc.atmos.colostate.edu Presented at 2005 Peak to Prairie Landscape Symposium, February 11, 2005,
Mechanistic links between the tropical Atlantic and the Indian monsoon in the absence of El Nino Southern Oscillation events
 Mechanistic links between the tropical Atlantic and the Indian monsoon in the absence of El Nino Southern Oscillation events Vijay Pottapinjara 1*, Roxy Mathew Koll2, Raghu Murtugudde3, Girish Kumar M
 A Brief Analysis of the Impact of the El Niño Southern Oscillation (ENSO) Cycle In specific areas around East Timor In the Climate Change section of Seeds of Life, we believe it would be beneficial for
Drought! When Do We Know It s Over?
 Drought! When Do We Know It s Over? Nolan J. Doesken Colorado Climate Center Colorado State University http://ccc.atmos.colostate.edu Presented at the 2004 Peak to Prairie Landscape Symposium, February
Water budgets of the two Olentangy River experimental wetlands in 2001
 Water Budgets 23 Water budgets of the two Olentangy River experimental wetlands in 2001 Li Zhang and William J. Mitsch School of Natural Resources, The Ohio State University Introduction Hydrologic conditions
Climate briefing. Wellington region, February Alex Pezza and Mike Thompson Environmental Science Department
 Climate briefing Wellington region, February 2016 Alex Pezza and Mike Thompson Environmental Science Department For more information, contact the Greater Wellington Regional Council: Wellington PO Box
Nolan Doesken Colorado Climate Center
 Nolan Doesken Colorado Climate Center Presented to: Colorado Cattleman s s Association, Pueblo, CO, June 19, 2006 http://ccc.atmos.colostate.edu Prepared by Odie Bliss 1 Let s s Talk About Precipitation
Hydrological Condition Report including the issues of High Flow Fluctuation in Chiang Saen
 Hydrological Condition Report including the issues of High Flow Fluctuation in Chiang Saen Technical Symposium for ESCIR and MRC on Social Impact Assessment in River Basin Management Sothea KHEM, HENG
ENSO Cycle: Recent Evolution, Current Status and Predictions. Update prepared by Climate Prediction Center / NCEP 4 September 2012
 ENSO Cycle: Recent Evolution, Current Status and Predictions Update prepared by Climate Prediction Center / NCEP 4 September 2012 Outline Overview Recent Evolution and Current Conditions Oceanic Niño Index
COMPARISON OF FIXED & VARIABLE RATES (25 YEARS) CHARTERED BANK ADMINISTERED INTEREST RATES - PRIME BUSINESS*
 CHARTERED BANK ADMINISTERED INTEREST RATES - PRIME BUSINESS*") COMPARISON OF FIXED & VARIABLE RATES (25 YEARS) Fixed Rates Variable Rates FIXED RATES OF THE PAST 25 YEARS AVERAGE RESIDENTIAL MORTGAGE LENDING RATE - 5 YEAR* (Per cent) Year Jan Feb Mar Apr May Jun Jul
COMPARISON OF FIXED & VARIABLE RATES (25 YEARS) Fixed Rates Variable Rates FIXED RATES OF THE PAST 25 YEARS AVERAGE RESIDENTIAL MORTGAGE LENDING RATE - 5 YEAR* (Per cent) Year Jan Feb Mar Apr May Jun Jul
ENSO Cycle: Recent Evolution, Current Status and Predictions. Update prepared by Climate Prediction Center / NCEP 8 March 2010
 ENSO Cycle: Recent Evolution, Current Status and Predictions Update prepared by Climate Prediction Center / NCEP 8 March 2010 Outline Overview Recent Evolution and Current Conditions Oceanic Niño Index
LESOTHO HIGHLANDS DEVELOPMENT AUTHORITY
 LESOTHO HIGHLANDS DEVELOPMENT AUTHORITY FLOW RELEASES DOWNSTREAM OF THE LESOTHO HIGHLANDS WATER PROJECT (LHWP) STRUCTURES (April 2003 to September 2003) TOWER ON MALIBAMATŠO RIVER @ KAO MARCH 2004 OPERATIONS,
Aspects and Case Studies of the Effects of Climate Change on Water Resources. Part II (Case Studies)
") Aspects and Case Studies of the Effects of Climate Change on Water Resources Part II (Case Studies) Manfred Koch Department of Geohydraulics and Engineering Hydrology, University of Kassel, Germany Email:
Aspects and Case Studies of the Effects of Climate Change on Water Resources Part II (Case Studies) Manfred Koch Department of Geohydraulics and Engineering Hydrology, University of Kassel, Germany Email:
ENSO Update Eastern Region. Michelle L Heureux Climate Prediction Center / NCEP/ NOAA 29 November 2016
 ENSO Update Eastern Region Michelle L Heureux Climate Prediction Center / NCEP/ NOAA 29 November 2016 Summary La Niña conditions are present.* ENSO Alert System Status: La Niña Advisory Equatorial sea
Manitoba Water Stewardship. Coping with Drought. Drought Research Initiative Workshop. Inn at the Forks, Winnipeg. A.A. Warkentin. January 11-13, 2007
 Manitoba Water Stewardship Coping with Drought Drought Research Initiative Workshop Inn at the Forks, Winnipeg A.A. Warkentin January 11-13, 2007 Annual Renewal of Water Supplies Important Precipitation-based
Drought or Not? Nolan J. Doesken Colorado Climate Center Colorado State University
 Drought or Not? Nolan J. Doesken Colorado Climate Center Colorado State University http://ccc.atmos.colostate.edu Presented at Horticultural Art Society meeting, November 19, 2004, Colorado Springs, Colorado
APPENDIX B NOAA DROUGHT ANALYSIS 29 OCTOBER 2007
 APPENDIX B NOAA DROUGHT ANALYSIS 29 OCTOBER 2007 ENSO Cycle: Recent Evolution, Current Status and Predictions Update prepared by Climate Prediction Center / NCEP October 29, 2007 Outline Overview Recent
GROWING SEASON TEMPERATURES
 Ag-Weather Update: Review of Summer Growing Season & Update on the Wet Forecast for Fall & Winter Paul W. Brown Extension Specialist, Biometeorology College of Agriculture & Life Sciences University of
SECTION 2 HYDROLOGY AND FLOW REGIMES
 SECTION 2 HYDROLOGY AND FLOW REGIMES In this section historical streamflow data from permanent USGS gaging stations will be presented and discussed to document long-term flow regime trends within the Cache-Bayou
Colorado Weather and Climate Update
 Colorado Weather and Climate Update Nolan J. Doesken State Climatologist Colorado Climate Center, Atmospheric Science Department, Colorado State University Presented to Colorado Livestock Association,
What Can We Expect From El Niño This Winter?
 What Can We Expect From El Niño This Winter? Water Forum September 8, 2015 Pete Fickenscher Senior Hydrologist NOAA / National Weather Service California-Nevada River Forecast Center Sacramento, CA What
Colorado River Drought Response and System Sustainability. Chuck Cullom July 16, 2014
 Colorado River Drought Response and System Sustainability Chuck Cullom July 16, 2014 Study Structure and Schedule Summary of Key Activities Upcoming Meetings Further Discussion, Follow-up Colorado River
Wind Resource Assessment for NOME (ANVIL MOUNTAIN), ALASKA Date last modified: 5/22/06 Compiled by: Cliff Dolchok
, ALASKA Date last modified: 5/22/06 Compiled by: Cliff Dolchok") 813 W. Northern Lights Blvd. Anchorage, AK 99503 Phone: 907-269-3000 Fax: 907-269-3044 www.akenergyauthority.org SITE SUMMARY Wind Resource Assessment for NOME (ANVIL MOUNTAIN), ALASKA Date last modified:
813 W. Northern Lights Blvd. Anchorage, AK 99503 Phone: 907-269-3000 Fax: 907-269-3044 www.akenergyauthority.org SITE SUMMARY Wind Resource Assessment for NOME (ANVIL MOUNTAIN), ALASKA Date last modified:
System Flexibility Indicators
 System Flexibility Indicators Place your chosen image here. The four corners must just cover the arrow tips. For covers, the three pictures should be the same size and in a straight line. Operational Forum
Utility Debt Securitization Authority 2013 T/TE Billed Revenues Tracking Report
 Utility Debt Securitization Authority 2013 T/TE Billed Revenues Tracking Report Billing Budgeted Billed Dollar Percent Month Revenues Revenues Variance Variance Jan 2018 11,943,180.68 12,697,662.47 754,481.79
Equatorial upwelling. Example of regional winds of small scale
 Example of regional winds of small scale Sea and land breezes Note on Fig. 8.11. Shows the case for southern hemisphere! Coastal upwelling and downwelling. Upwelling is caused by along shore winds, that
El Niño / Southern Oscillation (ENSO) and inter-annual climate variability
 and inter-annual climate variability") El Niño / Southern Oscillation (ENSO) and inter-annual climate variability seasonal cycle what is normal? monthly average conditions through a calendar year sea level pressure and surface winds surface
El Niño / Southern Oscillation (ENSO) and inter-annual climate variability seasonal cycle what is normal? monthly average conditions through a calendar year sea level pressure and surface winds surface
Wind Regimes 1. 1 Wind Regimes
 Wind Regimes 1 1 Wind Regimes The proper design of a wind turbine for a site requires an accurate characterization of the wind at the site where it will operate. This requires an understanding of the sources
Appendix E Mangaone Stream at Ratanui Hydrological Gauging Station Influence of IPO on Stream Flow
 NZ Transport Agency Peka Peka to North Ōtaki Expressway Hydraulic Investigations for Expressway Crossing of Mangaone Stream and Floodplain Appendix E Mangaone Stream at Ratanui Hydrological Gauging Station
Visualising seasonal-diurnal trends in wind observations
 Visualising seasonal-diurnal trends in wind observations Nicholas J. Cook Highcliffe on Sea, Dorset Introduction One of the most amazing inherent attributes of the human brain is its ability to see patterns
Hui Wang, Mike Young, and Liming Zhou School of Earth and Atmospheric Sciences Georgia Institute of Technology Atlanta, Georgia
 Water Cycle between Ocean and Land and Its Influence on Climate Variability over the South American-Atlantic Regions as Determined by SeaWinds Scatterometers Rong Fu Hui Wang, Mike Young, and Liming Zhou
The South American monsoon system and the 1970s climate transition L. M. V. Carvalho 1, C. Jones 1, B. Liebmann 2, A. Silva 3, P. L.
 The South American monsoon system and the 1970s climate transition L. M. V. Carvalho 1, C. Jones 1, B. Liebmann 2, A. Silva 3, P. L. Silva Dias 3 1 University of California Santa Barbara 2 CIRES, NOAA,
Nolan Doesken. Colorado Climate Center.
 Nolan Doesken Colorado Climate Center Presented to: Colorado Conservation Tillage Association, Greeley, CO, February 1-2, 1 2005 http://ccc.atmos.colostate.edu Prepared by Odie Bliss 1 Key Features of
Dr. Vera Potop & Prof. Josef Soukup
 IMPACTS OF DROUGHT AT VARIOUS TIME SCALES ON THE PRODUCTIVITY OF AGRICULTURAL CROPS Czech University of Life Sciences Prague Česká zemědělská univerzita v Praze Acronym in Czech: ČZU Dr. Vera Potop & Prof.
Global Climate Change: Just the Facts
 Global Climate Change: Just the Facts Nolan Doesken State Climatologist, Colorado Climate Center Atmospheric Science Department Colorado State University Presented at Club 20 Fall Meeting, Grand Junction,
New Zealand Fisheries Assessment Research Document 98/21. Not to be cited without permission of the authork) Malcolm Clark
 Malcolm Clark") Not to be cited without permission of the authork) New Zealand Fisheries Assessment Research Document 98/21 A summary of commercial catch and effort information for orange roughy (Hoplostethus atlanticus)
Not to be cited without permission of the authork) New Zealand Fisheries Assessment Research Document 98/21 A summary of commercial catch and effort information for orange roughy (Hoplostethus atlanticus)
Assessing salmon vulnerability to climate change
 Assessing salmon vulnerability to climate change Tim Beechie NW Fisheries Science Center Alisa Wade-Wilcox University of California, Santa Barbara The big question Will climate change negate salmon restoration
GLMM standardisation of the commercial abalone CPUE for Zones A-D over the period
 GLMM standardisation of the commercial abalone for Zones A-D over the period 1980 2015 Anabela Brandão and Doug S. Butterworth Marine Resource Assessment & Management Group (MARAM) Department of Mathematics
Meteorology of Monteverde, Costa Rica 2007
 Meteorology of Monteverde, Costa Rica 2007 Technical Report submitted to the Monteverde Institute Andrew J. Guswa, Associate Professor, Picker Engineering Program Amy L. Rhodes, Associate Professor, Department
Wind Resource Assessment for CHEFORNAK, ALASKA
 813 W. Northern Lights Blvd. Anchorage, AK 99503 Phone: 907-269-3000 Fax: 907-269-3044 www.akenergyauthority.org Wind Resource Assessment for CHEFORNAK, ALASKA Date last modified: 3/15/2006 Compiled by:
What does El Niño mean for South Africa this year and what to expect?
 What does El Niño mean for South Africa this year and what to expect? Seminar El Niño 19 November 2015; Johannesburg By Mnikeli Ndabambi General Manager: Operations South African Weather Service www.weathersa.co.za
Staying in Tune with South Florida s Water Cycle for Scientists, Managers, and Policy Makers in 5 Minutes per Week
 Staying in Tune with South Florida s Water Cycle for Scientists, Managers, and Policy Makers in 5 Minutes per Week Robert Sobczak (Big Cypress Nat l Pres), Todd Hopkins (FWS), Kevin Kotun (Everglades National
Table 1. Monthly precipitation totals from the on-site rain gage and from the Dulles weather station and their differences.
 Table 1. Monthly precipitation totals from the on-site rain gage and from the Dulles weather station and their differences. Precipitation Month On-Site Rain Dulles Weather Difference Ratio 1996-97 Gage
Water budgets of the two Olentangy River experimental wetlands in 1998
 Water budgets of the two Olentangy River experimental wetlands in 1998 Naiming Wang and William J. Mitsch School of Natural Resources The Ohio State University Water Budgets 17 Introduction An understanding
Kodiak, Alaska Site 1 Wind Resource Report
 Kodiak, Alaska Site 1 Wind Resource Report Report written by: Douglas Vaught, P.E., V3 Energy LLC, Eagle River, AK Date of report: March 16, 2007 Photo by Doug Vaught, V3 Energy LLC Summary Information
Chart Discussion: Fri-17-Aug-2018 (Harvey Stern) Combining Forecasts (Apr 13th to Aug 15th)
 Combining Forecasts (Apr 13th to Aug 15th)") Combining Forecasts (Apr 13th to Aug 15th) 1 Last Week s Rainfall 1 Chart Discussion: Fri-17Aug-2018 (Harvey Stern) Last Week s Surface Charts 3 Chart Discussion: Fri-17Aug-2018 (Harvey Stern) This Month
Combining Forecasts (Apr 13th to Aug 15th) 1 Last Week s Rainfall 1 Chart Discussion: Fri-17Aug-2018 (Harvey Stern) Last Week s Surface Charts 3 Chart Discussion: Fri-17Aug-2018 (Harvey Stern) This Month
ENSO Wrap-Up. Current state of the Pacific and Indian Ocean
 18-11-2014 ENSO Wrap-Up Current state of the Pacific and Indian Ocean Tropical Pacific Ocean moves closer to El Niño The Pacific Ocean has shown some renewed signs of El Niño development in recent weeks.
Justification for Rainbow Trout stocking reduction in Lake Taneycomo. Shane Bush Fisheries Management Biologist Missouri Department of Conservation
 Justification for Rainbow Trout stocking reduction in Lake Taneycomo Shane Bush Fisheries Management Biologist Missouri Department of Conservation December 14, 2017 Lake Taneycomo was formed by the construction
Subsurface Ocean Indices for Central-Pacific and Eastern-Pacific Types of ENSO
 Subsurface Ocean Indices for Central-Pacific and Eastern-Pacific Types of ENSO Jin-Yi Yu 1*, Hsun-Ying Kao 1, and Tong Lee 2 1. Department of Earth System Science, University of California, Irvine, Irvine,
Appendix ELP El Paso, Texas 2003 Annual Report on Freeway Mobility and Reliability
 (http://mobility.tamu.edu/mmp) Office of Operations, Federal Highway Administration Appendix ELP El Paso, Texas 2003 Annual Report on Freeway Mobility and Reliability This report is a supplement to: Monitoring
The Summer of 2007: A Look at Niagara
 The Summer of 27: A Look at Niagara By Wayne Heinen (maps generated by Piper McKinnon) OVERVIEW The summer of 27 was yet another challenging growing season. One look at the inch-wide cracks in the soil,
EFFECT OF LARGE-SCALE RESERVOIR OPERATION ON FLOW REGIME IN THE CHAO PHRAYA RIVER BASIN, KINGDOM OF THAILAND
 EFFECT OF LARGE-SCALE RESERVOIR OPERATION ON FLOW REGIME IN THE CHAO PHRAYA RIVER BASIN, KINGDOM OF THAILAND TAICHI TEBAKARI Hydraulic Engineering Research Group, Public Works Research Institute 1, Minamihara,
Monitoring and prediction of El Niño and La Niña
 Monitoring and prediction of El Niño and La Niña Akio NARUI El Niño Monitoring and Prediction Group Climate Prediction Division Japan Meteorological Agency Outline 1. Introduction of El Niño and La Niña
Climate Change and Hydrology in the Sierra Nevada. Lorrie Flint U.S. Geological Survey Sacramento CA
 Climate Change and Hydrology in the Sierra Nevada Lorrie Flint U.S. Geological Survey Sacramento CA Discussion Topics Climate change for California Methods to evaluate hydrologic impacts Water balance
Chart Discussion: Fri-15-Jun-2018 Rainfall Last Week
 Chart Discussion: Fri-15-Jun-2018 Rainfall Last Week 1 Last Week s Charts 2 Last Week s Melbourne Wind Forecasts Forecast 3 PM WIND for 1,2,3,4,5,6,7,8,9,10 Days Ahead [ACCESS model] 1- Jun- 18 SSE SSE
Analysis of 2012 Indian Ocean Dipole Behavior
 Analysis of 2012 Indian Ocean Dipole Behavior Mo Lan National University of Singapore Supervisor: Tomoki TOZUKA Department of Earth and Planetary Science, University of Tokyo Abstract The Indian Ocean
Investigation of Common Mode of Variability in Boreal Summer Intraseasonal Oscillation and Tropospheric Biennial Oscillation
 Investigation of Common Mode of Variability in Boreal Summer Intraseasonal Oscillation and Tropospheric Biennial Oscillation 5. Introduction The Asian summer monsoon is one of the most vigorous and energetic
CCoWS. Central Coast Watershed Studies. Summary of Precipitation and Streamflow for Potrero and San Clemente Creeks in 2010
 Central Coast Watershed Studies CCoWS Summary of Precipitation and Streamflow for Potrero and San Clemente Creeks in Water-Year 2010 Santa Lucia Preserve Monterey County, California Publication No. WI-2011-01
Influence of El Nino Southern Oscillation and Indian Ocean Dipole in biennial oscillation of Indian summer monsoon
 Influence of El Nino Southern Oscillation and Indian Ocean Dipole in biennial oscillation of Indian summer monsoon 4.1 Introduction The main contributors to the interannual variability of Indian summer
The Great Paradox of Indian Monsoon Failure (Unraveling The Mystery of Indian Monsoon Failure During El Niño)
") The Great Paradox of Indian Monsoon Failure (Unraveling The Mystery of Indian Monsoon Failure During El Niño) K. Krishna Kumar, B. Rajagopalan, M. Hoerling, G. Bates and M. Cane Point-by-point response
The Great Paradox of Indian Monsoon Failure (Unraveling The Mystery of Indian Monsoon Failure During El Niño) K. Krishna Kumar, B. Rajagopalan, M. Hoerling, G. Bates and M. Cane Point-by-point response
Global Impacts of El Niño on Agriculture
 Global Impacts of El Niño on Agriculture Presented to the University of Arkansas Division of Agriculture s Food and Agribusiness Series Webinar Series Presented by: Mark Brusberg and Brian Morris USDA
GLOBE Data Explorations
 Rainfall in the GLOBE Africa Region: A GLOBE Data Exploration Purpose Through explorations of GLOBE rain depth data from Africa, students learn about seasonal patterns in locations affected by monsoons.
OIL AND GAS INDUSTRY
 This case study discusses the sizing of a coalescer filter and demonstrates its fouling life cycle analysis using a Flownex model which implements two new pressure loss components: - A rated pressure loss
Evaluating Extreme Storm Power and Potential Implications to Coastal Infrastructure Damage, Oregon Coast, USA
 Evaluating Extreme Storm Power and Potential Implications to Coastal Infrastructure Damage, Oregon Coast, USA 1.0 INTRODUCTION Heidi P. Moritz, P.E. and Hans R. Moritz, P.E. U. S. Army Corps of Engineers,
Monthly Webinar 12.07/2010
 Monthly Webinar 12.07/2010 -Assessment of current water conditions - Precipitation Forecast - Recommendations for Drought Monitor Upper Colorado Normal Precipitation Upper Colorado River Basin Normal
Wisconsin 511 Traveler Information Annual Usage Summary January 3, Wisconsin 511 Phone Usage ( )
") Wisconsin 511 Traveler Information 211 Annual Usage Summary January 3, 212 Overall to-date Summary 36 months of operation 1,16,63 total calls the 1 Million mark was passed on December 3, 212 3,627,527
Wisconsin 511 Traveler Information 211 Annual Usage Summary January 3, 212 Overall to-date Summary 36 months of operation 1,16,63 total calls the 1 Million mark was passed on December 3, 212 3,627,527
Mango Bay_Resort. Fiji nearshore wave hindcast ' ' 19 00'
 Mango Bay_Resort Fiji nearshore wave hindcast 1 00' 1 30' 1 00' 177 00' 177 30' 17 00' 17 30' Figure 1. Location maps of the site. The map on the left shows the region. The map on the right shows the island
Ocean Inter-annual Variability: El Niño and La Niña. How does El Niño influence the oceans and climate patterns?
 Name: Date: Guiding Question: Ocean Inter-annual Variability: El Niño and La Niña How does El Niño influence the oceans and climate patterns? Introduction What is El Niño/La Niña? The El Niño/La Niña cycle
Challenges in communicating uncertainty of production and timing forecasts to salmon fishery managers and the public
 Challenges in communicating uncertainty of production and timing forecasts to salmon fishery managers and the public Alaska Fisheries Science Center Joseph A. Orsi and Phillip R. Mundy Auke Bay Laboratories
COST EFFECTIVE STORAGE CAPACITY INCREASE FOR ALUMINA TAILINGS DISPOSAL AREA THROUGH SPILLWAY OPTIMISATION
 COST EFFECTIVE STORAGE CAPACITY INCREASE FOR ALUMINA TAILINGS DISPOSAL AREA THROUGH SPILLWAY OPTIMISATION Abstract Lonie I * Tailings and Dams, GHD Brisbane, QLD, Australia Queensland Alumina Limited operates
Prudhoe Bay Oil Production Optimization: Using Virtual Intelligence Techniques, Stage One: Neural Model Building
 Prudhoe Bay Oil Production Optimization: Using Virtual Intelligence Techniques, Stage One: Neural Model Building Shahab D. Mohaghegh, West Virginia University Lynda A. Hutchins, BP Exploration (Alaska),
MINUTES. International Kootenay Lake Board of Control Public Meeting. Kootenai River Inn 7169 Plaza Street Bonners Ferry, Idaho
 MINUTES Public Meeting Kootenai River Inn 7169 Plaza Street Bonners Ferry, Idaho Wednesday, September 26, 2012 7:30-9:30 PM Attendance United States Canada Chairs Col. Bruce Estok (host) Kirk Johnstone
Forecasting of Lower Colorado River Basin Streamflow using Pacific Ocean Sea Surface Temperatures and ENSO
 Forecasting of Lower Colorado River Basin Streamflow using Pacific Ocean Sea Surface Temperatures and ENSO Glenn A. Tootle 1 and Thomas C. Piechota 2 1 Dept. of Civil and Environmental Engineering, University
USING A LABYRINTH WEIR TO INCREASE HYDRAULIC CAPACITY. Dustin Mortensen, P.E. 1 Jake Eckersley, P.E. 1
 USING A LABYRINTH WEIR TO INCREASE HYDRAULIC CAPACITY Dustin Mortensen, P.E. 1 Jake Eckersley, P.E. 1 Plum Creek Floodwater Retarding Structure No. 6 is located in an area of Kyle, Texas, that is currently
The Child. Mean Annual SST Cycle 11/19/12
 Introduction to Climatology GEOGRAPHY 300 El Niño-Southern Oscillation Tom Giambelluca University of Hawai i at Mānoa and Pacific Decadal Oscillation ENSO: El Niño-Southern Oscillation PDO: Pacific Decadal
Climatic and marine environmental variations associated with fishing conditions of tuna species in the Indian Ocean
 Climatic and marine environmental variations associated with fishing conditions of tuna species in the Indian Ocean Kuo-Wei Lan and Ming-An Lee Department of Environmental Biology and Fisheries Science,
A pheasant researcher notebook:
 A pheasant researcher notebook: what we are learning about pheasants and pheasant hunters in Nebraska TJ Fontaine Nebraska Cooperative Fish and Wildlife Research Unit Managing pheasants is challenging
A high-resolution cellulose δ 18 O record of Pinus merkusii from Cambodia and its climate implications
 A high-resolution cellulose δ 18 O record of Pinus merkusii from Cambodia and its climate implications Mengfan Zhu, Lowell Stott University of Southern California Brendan Buckley LDEO, Columbia University
Adopted Regulation Strategy LWCB Regulation Meeting - March 22, 2010
 Adopted Regulation Strategy LWCB Regulation Meeting - March 22, 2010 The Lake of the Woods Control Board held a Regulation Meeting in Kenora on March 25, 2010 and adopted the following strategy. The strategy
The impact of the El Niño Southern Oscillation. on Rainfall Variability in Timor-Leste
 The impact of the El Niño Southern Oscillation on Rainfall Variability in Timor-Leste A TLSA conference paper submitted by: Samuel Bacon, Florindo Morais Neto, Isabel Soares Pereira, Robert Williams. Seeds
The State of the Climate Address
 The State of the Climate Address Nolan J. Doesken Colorado Climate Center, Atmospheric Science Dept, Colorado State University Presented to Colorado Water Officials Association, 2005 Annual Meeting, September
REMINDERS: UPCOMING REVIEW SESSIONS: - Thursday, Feb 27, 6:30-8:00pm in HSS 1330
 REMINDERS: Midterm 2: Friday, February 28 - lecture material covering chapters 6, 7, and 15 (since first midterm and through Wed lecture) - same Format as first midterm UPCOMING REVIEW SESSIONS: - Thursday,
Danish gambling market statistics Third quarter, 2017
 Danish gambling market statistics Third quarter, Third Quarter, 7. december Third Quarter, Danish gambling market statistics 1 Indhold A. Introduction... 2 B. Quarterly market statistics for the Danish
Gas Gathering System Modeling The Pipeline Pressure Loss Match
 PETROLEUM SOCIETY CANADIAN INSTITUTE OF MINING, METALLURGY & PETROLEUM PAPER 2005-230 Gas Gathering System Modeling The Pipeline Pressure Loss Match R.G. MCNEIL, P.ENG. Fekete Associates Inc. D.R. LILLICO,
SPE Fuel gas supply (at the flowstations and gathering centers) and artificial lift gas supply for the lift gas compressors at GC1 are
 and artificial lift gas supply for the lift gas compressors at GC1 are") SPE 77659 Prudhoe Bay Oil Production Optimization: Using Virtual intelligence Techniques, Stage One: Neural Model Building Shahab D. Mohaghegh SPE, West Virginia University, Lynda A. Hutchins SPE, BP Exploration
SPE 77659 Prudhoe Bay Oil Production Optimization: Using Virtual intelligence Techniques, Stage One: Neural Model Building Shahab D. Mohaghegh SPE, West Virginia University, Lynda A. Hutchins SPE, BP Exploration
General Introduction to Climate Drivers and BoM Climate Services Products
 General Introduction to Climate Drivers and BoM Climate Services Products Climate Information Services Australian Bureau of Meteorology Yuriy Kuleshov El Niño Southern Oscillation (ENSO) El Niño Southern
INFLUENCE OF TRAFFIC FLOW SEPARATION DEVICES ON ROAD SAFETY IN BRAZIL S MULTILANE HIGHWAYS
 INFLUENCE OF TRAFFIC FLOW SEPARATION DEVICES ON ROAD SAFETY IN BRAZIL S MULTILANE HIGHWAYS Gabriel Andrade Lanzaro Universidade de Brasília Departamento de Engenharia Civil e Ambiental, Faculdade de Tecnologia,
El Niño as a drought-buster in Texas: How reliable is it, or what can we expect this winter? Are the September rains a sign of things to come?
 U.S. Drought Monitor Forum, Austin 8oct09 El Niño as a drought-buster in Texas: How reliable is it, or what can we expect this winter? Are the September rains a sign of things to come? Klaus Wolter (klaus.wolter@noaa.gov)
SWISS Traffic Figures May 2004
 SWISS Traffic Figures May 2004 SWISS continues seat load factor improvement in May SWISS s load factor for May was 4.8 percentage points better than for the same period last year. Seat load factor for
World Leading Traffic Analysis
 World Leading Traffic Analysis Over the past 25 years, has worked closely with road authorities and traffic managers around the world to deliver leading traffic monitoring equipment. With products now
Os eventos extremos estão aumentando na Amazônia? Javier Tomasella e José A. Marengo. Centro de Ciência do Sistema Terrestre, INPE
 Os eventos extremos estão aumentando na Amazônia? Javier Tomasella e José A. Marengo Centro de Ciência do Sistema Terrestre, INPE Hamburgo, Março 2011 The Amazon Basin River Drainage area (km 2 ) Rainfall
INTERNATIONAL JOURNAL OF CIVIL AND STRUCTURAL ENGINEERING Volume 5, No 2, 2014
 INTERNATIONAL JOURNAL OF CIVIL AND STRUCTURAL ENGINEERING Volume 5, No 2, 2014 Copyright by the authors - Licensee IPA- Under Creative Commons license 3.0 Research article ISSN 0976 4399 Modification of
Presented by. Mr.Danish.D.R. M.Tech Coastal Management Institute for Ocean Management Anna University, Chennai Tamil Nadu, India.
 MATHEMATICAL MODEL STUDY OF THE EFFLUENT DISPOSAL FROM A DESALINATION PLANT IN THE MARINE ENVIRONMENT AT TUTICORIN Presented by Mr.Danish.D.R M.Tech Coastal Management Institute for Ocean Management Anna
INNCOM SYSTEM MONITORING MARRIOT HOTEL DOWNTOWN PHILADELPHIA, PA. Report 9. July 2, CH2M HILL Project No
 INNCOM SYSTEM MONITORING MARRIOT HOTEL DOWNTOWN PHILADELPHIA, PA Report 9 CH2M HILL Project No. 421631 1. PURPOSE The purpose of this report is to present observations of the Inncom system operation in