Updating temperature and salinity mean values and trends in the Western Mediterranean: The RADMED project
|
|
|
- Nancy Hawkins
- 6 years ago
- Views:
Transcription
1 1 Progress In Oceanography September 2017, Volume 157 Pages The Authors. Published by Elsevier Ltd. This is an open access article under the CC BY-NC-ND license ( Achimer Updating temperature and salinity mean values and trends in the Western Mediterranean: The RADMED project Vargas-Yanez M. 1, *, Garcia-Martinez M. C. 1, 2, Moya F. 1, Balbin R. 3, Lopez-Jurado J. L. 3, Serra M. 3, Zunino Rodriguez Patricia 4, Pascual J. 5, Salat J. 5 1 Ctr Oceanog Malaga, Inst Espanol Oceanog, Malaga, Spain. 2 Univ Malaga, Dept Ecol, Malaga, Spain. 3 Ctr Oceanog Baleares, Inst Espanol Oceanog, Palma De Mallorca, Spain. 4 Inst Francais Rech Exploitat Mer, Brest, France. 5 CSIC, Inst Ciencies Mar, Barcelona, Spain. * Corresponding author : M. Vargas-Yanez, address : manolo.vargas@ieo.es Abstract : The RADMED project is devoted to the implementation and maintenance of a multidisciplinary monitoring system around the Spanish Mediterranean waters. This observing system is based on periodic multidisciplinary cruises covering the coastal waters, continental shelf and slope waters and some deep stations (>2000 m) from the Westernmost Alboran Sea to Barcelona in the Catalan Sea, including the Balearic Islands. This project was launched in 2007 unifying and extending some previous monitoring projects which had a more reduced geographical coverage. Some of the time series currently available extend from 1992, while the more recent ones were initiated in The present work updates the available time series up to (included) and shows the capability of these time series for two main purposes: the calculation of mean values for the properties of main water masses around the Spanish Mediterranean, and the study of the interannual and decadal variability of such properties. The data set provided by the RADMED project has been merged with historical data from the MEDAR/MEDATLAS data base for the calculation of temperature and salinity trends from 1900 to. The analysis of these time series shows that the intermediate and deep layers of the Western Mediterranean have increased their temperature and salinity with an acceleration of the warming and salting trends from Trends for the heat absorbed by the water column for the 1943 period, range between 0.2 and 0.6 W/m2 depending on the used methodology. The temperature and salinity trends for the same period and for the intermediate layer are C/yr and yr 1 respectively. Deep layers warmed and increased their salinity at a rate of C/yr and yr 1. Please note that this is an author-produced PDF of an article accepted for publication following peer review. The definitive publisher-authenticated version is available on the publisher Web site.
2 2 Highlights Updating temperature and salinity mean values and trends in the WMed: RADMED project. Monitoring systems: average ocean conditions and the detection of long term trends. RADMED is an appropriate monitoring program within the Western Mediterranean. Previous results have been updated after adding 9 years to previous time series. Keywords : Western Mediterranean, Monitoring program, Warming and salting trends, Climate change Please note that this is an author-produced PDF of an article accepted for publication following peer review. The definitive publisher-authenticated version is available on the publisher Web site.
3 42 1. Introduction The oceans play a key role in the climate change process as it is very likely that their upper 700 m have warmed from 1971 to 2010 and it is probable that this warming process extends from 1871 to 2010 (Rhein et al., 2013). This warming corresponds to a heat absorption of 0.55 W/m 2 through the ocean surface and represents the 93% of the net heat absorbed by the Earth due to the present radiative imbalance (Levitus et al., 2012). In this context, the Mediterranean Sea has received an increasing attention since the early 1990s. Due to the reduced dimensions of the Mediterranean (if compared with the world oceans) the effects of climate change on the temperature and salinity of its water masses could be more easily detected. Furthermore, the Mediterranean has its own thermohaline circulation. Changes in deep water formation and the thermohaline circulation can be studied in the Mediterranean Sea more easily than in the world oceans as deep water formation areas in the Mediterranean are more accessible than other regions of the world. Finally, water masses and circulation in the Mediterranean are affected by other anthropogenic factors different from climate change such as the damming of the main rivers draining into the Mediterranean Sea (Rohling and Bryden, 2
4 ; Krahmann and Schott, 1998). All these factors have led to consider the Mediterranean Sea as a natural laboratory for climate change studies (Bethoux et al., 1999) Lacombe et al. (1985) reported a temperature and salinity increase of the deep waters in the Western Mediterranean. These results were based on the comparison of temperature and salinity data provided in previous works (Nielsen, 1912; Sverdrup, 1942) with those data collected along several cruises carried out from the early 1950s to the 1970s. Later works analyzed the long term evolution of the upper, intermediate and deep layers both in the Western and Eastern Mediterranean. The upper layer corresponds to the AW and is usually considered as that extending from the surface to 150 or 200 m depth. The intermediate layer is mainly occupied by LIW and is usually considered as extending from 150 or 200 m to 600 m. Finally, the deep layer is below the intermediate layer and extends to the sea bottom. These works revealed the warming and salting of the deep waters (Bethoux et al., 1998; Leamann and Schott, 1991; Rohling and Bryden, 1992; Karhmann and Schott, 1998; Rixen et al., 2005; Vargas-Yáñez et al., 2010a, 2010b). The existence of long term trends in the thermohaline properties of the intermediate and upper layers was not so clear. Some of these works reported changes in the salinity and temperature of the Levantine Intermediate Waters (LIW, Leaman and Schott, 1991; Rohling and Bryden, 1992; Bethoux et al., 1998; Rixen et al., 2005). On the contrary, other works found no significant trends for this water mass (Krahmann and Schott, 1998; Painter and Tsimplis, 2003). Concerning the upper layer, occupied by Atlantic Waters (AW), several studies have used Sea Surface Temperature data from radiometers operated from satellite from the mid 1980s to show a clear warming of the Mediterranean surface waters. These results are confirmed by Skliris et al. (2012) who used in situ measurements from NOCs (National Oceanographic Center Southampton) to extend the analyses to the period Nevertheless, when in situ data are used to study the upper part of the water column, some discrepancies appear. Once again, some works show no warming trends (Krahmann and Schott, 1998; Sparnocchia et al., 1994), while others present positive trends for the AW temperature (Pascual et al., 1995; Salat and Pascual, 2006). 3
5 Other changes detected in the Mediterranean Sea are related to the abrupt shift of the deep water formation sites and rates in the Eastern Mediterranean. This event, commonly known as the Eastern Mediterranean Transient (EMT), occurred at some moment between 1987 and 1995 and led to a dramatic increase of the temperature and salinity of the new Eastern Mediterranean Deep Waters (EMDW) which replaced and uplifted the old EMDW (Roether et al., 1996; 2007). The changes observed in the Eastern Mediterranean have been transmitted to the Western Mediterranean as saltier and warmer intermediate waters would flow through the Sicily channel after the EMT (Gasparini et al., 2005). The arrival of these saltier intermediate waters and some exceptional atmospheric conditions during winters 2005 and 2006 in the Western Mediterranean would have been responsible for the appearance of a new and anomalous Western Mediterranean Deep Water (WMDW). This water mass is warmer, saltier and denser than the previous or old WMDW and has occupied the bottom layer of this basin. These events are known as the Western Mediterranean Transition (WMT, Schroether, 2010; 2016; Zunino et al., 2012; López-Jurado et al., 2005) Most of the results outlined above have been derived from the comparison of data obtained in different oceanographic cruises. In most of the cases such cruises had no common purpose nor belonged to any monitoring program. As a consequence of the lack of long term monitoring programs in the Mediterranean Sea during the last century, oceanographic data are scarce and unevenly distributed. Vargas-Yáñez et al. (2009; 2012a) have shown that this could be the cause for some of the discrepancies between different works. These authors concluded that the data scarcity and their irregular distribution could make the results very sensitive to the data analysis methodology. More recently, Llasses et al. () and Jordá and Gomis (2013) have evidenced differences between the results obtained when analyzing temperature and salinity time series from different data bases and monitoring programs. Once again such discrepancies are attributed to the data scarcity, the interpolation method or even the data quality control During the late 1990s and the beginning of the twenty first century, several monitoring programs have been implemented in the Mediterranean Sea. Each of these programs is 4
6 based on a different strategy and methodology, but all of them will contribute to a better understanding of the changes currently affecting the Mediterranean Sea. The Hydrochanges network is based on the mooring of CTDs at key places for the monitoring of the temperature and salinity variability of the water masses within the Mediterranean Sea (Schroeder et al., 2013). Time series collected under Hydrochanges umbrella have already revealed changes in the composition of the Mediterranean outflow through the Strait of Gibraltar (Millot, 2009). The MEDARGO program maintains an array of profiling floats in the Mediterranean Sea (Poulain et al., 2007). As an example, these data have been useful in the description of the deep water formation (Smith and Bryden, 2007) or the study of the Mediterranean mesoscale circulation (Sánchez-Román et al., 2016). The Lion Mooring Line monitors in a continuous way the deep water formation in the MEDOC area since 2007 (Houpert et al., 2016). This mooring line, equipped with instruments along the water column, is part of the Mediterranean Ocean Observing System The RADMED program is devoted to the implementation and maintenance of a monitoring system around the continental shelf and slope, including some deep stations (>2000m) around the Spanish Mediterranean (López-Jurado et al., ; Tel et al., 2016). This monitoring program is aimed at the study of the seasonal and long term variability of the Westernmost Mediterranean waters from a multisdisciplinary point of view. Oceanographic stations are visited on a seasonal basis since 1992 in some cases and since 2007 in the case of the stations most recently included in the RADMED project. Vargas-Yáñez et al., (2010b) have shown that temperature and salinity data from the RADMED project can be merged with historical data in order to construct long time series, providing valuable information about long term changes in the Western Mediterranean. As previous analyses considered TS data up to 2008, they did not include the new stations operated since The goal of the present work is to update temperature and salinity time series by extending the previous ones to (inclusive). The new available information will allow us to obtain mean values for the properties of the Atlantic and Mediterranean waters around the Spanish Mediterranean. At the same time, linear trends will be computed in order to check the behavior of these variables along the twenty first century. The analysis of updated time series, including for the first time those stations initiated in 2007, and the use of historical data, will allow us to 5
7 evaluate new long-term trends. The data set is described in section 2, results are presented in section 3, and finally, discussion and conclusions are in sections 4 and Data and methods A network of oceanographic stations are periodically visited in the frame of the RADMED project, funded by the Instituto Español de Oceanografía. The stations are distributed in transects perpendicular to the coast. Stations are named by a letter corresponding to each transect and a number increasing from the coast to the open sea. In the Alboran Sea, the westernmost transects are Cape Pino (P in fig. 1), Málaga (M) and Vélez (V). For instance, the closest station to the coast in Cape Pino transect is named as P1, and the most offshore station is P4. Sacratif transect extends from Cape Sacratif in the central part of the Alborán Sea, and Cape Gata transect (CG) is on its eastern limit. Those transects extending from the eastern Spanish coast are Cape Palos (CP), Tarragona (T) and Barcelona (BNA). Two more transects are located in the Balearic islands, one of them to the south of Mallorca Island (B) and another one extending in a northeast direction from Menorca Island (MH). 37 oceanographic stations forming two triangles cover the Balearic channels: The Ibiza channel between the peninsula and Ibiza Island and the Mallorca channel between Ibiza and Mallorca. These stations are labeled as C. Finally a deep station (>2200m) is located to the south of Cabrera Island (EPC). All the stations are visited three-monthly, that is, once per season of the year and the samplings are multidisciplinary including temperature and conductivity profiles by means of a CTD periodically calibrated. Water samples are taken at discrete depths for oxygen, nutrients (nitrate, nitrite, silicate and phosphate) and chlorophyll determinations. In addition, water samples are taken for determination of the abundance and taxonomic composition of phytoplankton. Oblique trawls with BONGO nets are carried out for determination of zooplanktonic abundance and taxonomic composition. More details about the sampling protocols can be found in
8 The RADMED stations are the result of the unification and extension of previous monitoring programs: ECOMALAGA, ECOMURCIA, ECOBALEARES and CIRBAL. Table I summarizes the name of the previous projects and the year when sampling was initiated. Since 2007 all the stations are under the umbrella of the RADMED project. In some cases, the new oceanographic stations were initiated in 2007 when the RADMED project was lunched The longest time series from the RADMED project are 24 years long as 2016 is not included in the present work, while the shortest ones are 9 years long. These time series are suitable for analyzing the temperature and salinity mean values in the continental shelf and slope around the Spanish Mediterranean as well as those changes operating on these properties during the last decade. For each oceanographic station and for each depth level from the surface to the sea bottom, temperature and salinity data where split into winter, spring, summer and autumn data. For each data set outliers were discarded, normality tests were carried out and mean and standard deviation values were calculated. Confidence limits at the 95 % confidence levels were calculated for the mean values considering a t-student distribution Nevertheless, these variables exhibit both inter-annual and decadal variability making it difficult to distinguish long term changes such as possible trends linked to climate change. In order to extend back in time our time series, four geographical areas were chosen. These regions are delimited by rectangles in figure 1 and are named Alborán, Cape Palos, Balearic Sea and Northern Sector (see fig. 1). All available temperature and salinity data within each of these regions (rectangles) were obtained from the MEDAR/MEDATLAS data base (MEDAR Group 2002). Vertical profiles were seasonally averaged obtaining four data per year and then these four data were averaged to get one temperature and salinity profile for each year and region. Finally, the RADMED profiles within the same region were annually averaged extending in time annual time series of temperature and salinity. The final results are annual temperature and salinity time series at different depth levels (from 0 to 2500m) extending from 1900 to. The homogeneity of the extended time series was checked by means of a 7
9 standard normal homogeneity test (Alexanderson, 1986; Alexanderson and Moberg, 1997) The methodology followed for the analysis of the time series is similar to that used in Vargas-Yáñez et al. (2010a, 2010b). In some years, there were not data corresponding to the four seasons of the year (winter, spring, summer and fall). In these cases two different approaches were followed. In the first one, the missing seasonal value was substituted by a climatological or long term mean value calculated from the complete series (1900-). This method is equivalent to consider that the missing data has a zero anomaly or deviation from the climatological value. In the second approach the annual temperature or salinity is calculated averaging the anomalies or residuals from the available seasons. Therefore it is considered that the part of the year which is not sampled had a behavior (anomaly) similar to the one sampled. In other words, the anomalies from the seasons with data are considered as representative of those seasons with no data Gouretski and Koltermann (2007), Domingues et al. (2008), Levitus et al. (2009) among others, detected errors in inter-annual and decadal variability and trends in temperature time series caused by biases in the bathythermograph data. In the aforementioned works, the observed biases were corrected. In our case, as the required information for the data correction is not available, the following approach is followed. All the calculations are repeated both including and excluding bathythermograph data Temperature data from l Estartit station have been analyzed. L Estartit oceanographic station is located on the continental shelf of the Catalan Sea (Fig. 1) over a bottom depth of 80m. This station is visited on a weekly basis by the Institut de Ciències del Mar (ICM). Four discrete temperature measurements are obtained at 0, 20, 50 and 80m depth since These time series are included in order to obtain further information concerning the upper AW in the northern sector of our study region
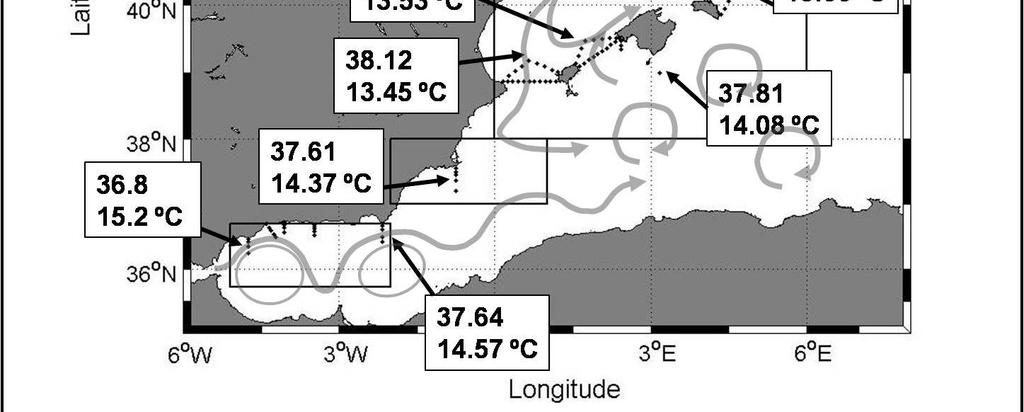
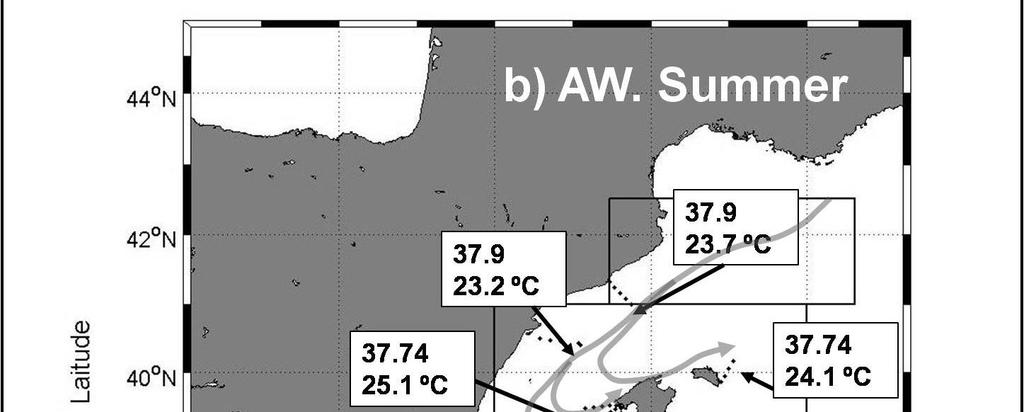
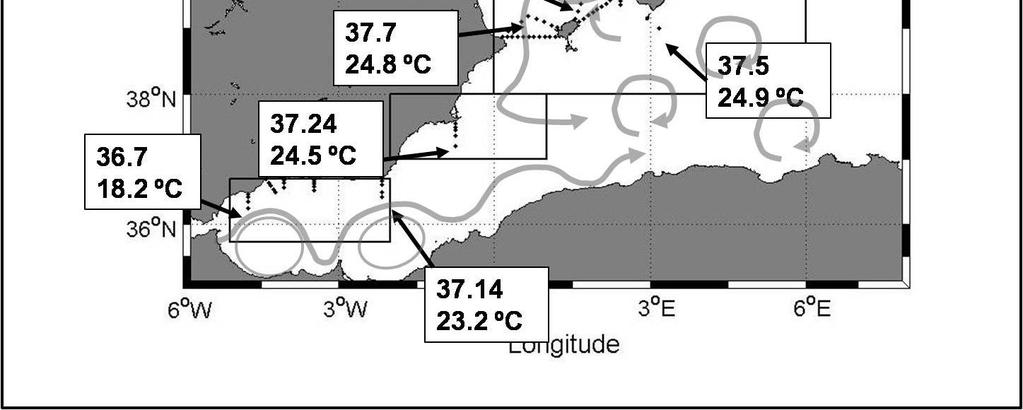
10 Finally, daily temperature measurements are taken at the sea shore (2 m depth) in Fuengirola beach (close to Cape Pino section, Fig.1). This time series extends from 1985 to and is used as an indication of temperature variability of AW recently advected into the Mediterranean Sea through the Strait of Gibraltar Results Mean Values Figures 2 to 9 show the mean potential temperature and salinity seasonal profiles and θs diagrams for some selected stations around the peninsular waters and the Balearic Islands. Confidence intervals for the mean values, associated to the interannual variability around such mean values have not been included for the clarity of the plot. Nevertheless, a complete information about the mean values, standard deviations and the number of data used for the calculations can be found in table SI of supplementary material Vertical profiles show clearly the salinity gradient from the south to the north indicating the decreasing influence of AW arriving from the Strait of Gibraltar. Another interesting feature in these profiles is the clear seasonality of AW salinity values increasing in winter and reaching lowest values in summer. Concerning the seasonal cycle of the upper layer temperature, it is interesting that in winter, AW are warmer in the Alboran Sea (Fig. 2 and 3), decreasing the temperature northwards (see Fig. 6 and 7). The opposite situation stands for summer when AW in the Catalan and mainly the Balearic Sea is warmer than in the southern regions. Figure 10 summarizes these temperature and salinity values in the context of the general circulation in the Western Mediterranean. Salinity values to the south of the Balearic Islands and to the East of Menorca Island are slightly lower than in the Ibiza and Mallorca Channels
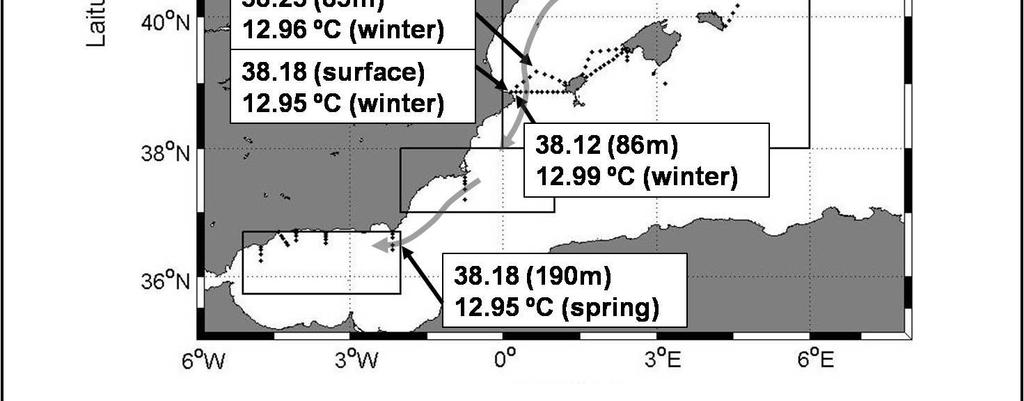
11 The intermediate layer in the Western Mediterranean is occupied by Western Intermediate Water (WIW) and Levantine Intermediate Water (LIW). Lower panels in figures 2 to 9 are the θs diagrams (left lower plot) and a zoom for the deepest part of the water column (right lower plot). All the available temperature and salinity values from the RADMED project have been included (grey dots) and the average θs diagrams have been included for winter (blue), spring (green), summer (red) and autumn (yellow). López-Jurado et al. (1995) described the WIW in the Balearic Channels as a water mass with θ < 13ºC and 38 S 38.3 and Vargas-Yáñez et al. (2012b) considered that the temperature and salinity range defining this water mass should be widen ( , 11.5ºC-13 ºC). This water mass is clearly distinguishable in θs diagrams as it is the coldest water mass in the Western Mediterranean and its temperature can be lower than the bottom water temperature. If all the RADMED profiles are considered (grey dots in figures 2 to 9), the presence of this water mass can be observed in the MH transect (Fig. 8) or at EPC station (Fig. 9). The occurrence of this water mass is more frequent at station C33, in the Mallorca Channel (Fig. 5) and it can also be found to the South of Mallorca Island at B transect (not shown). Nevertheless, when the mean seasonal profiles are considered, the temperature of the intermediate layer is always above 13 ºC and the presence of the WIW cannot be established from the average profiles at these stations (colored θs diagrams in Fig. 5, 8 and 9). Figure 11 shows the presence of WIW from the average seasonal profiles. It is also included the depth and season of the year when intermediate waters reach the WIW values according to Vargas-Yáñez et al. (2012b) criterion. According to this figure, the mean or average temperature and salinity values in the Balearic Sea show the presence of WIW at the Ibiza Channel mainly in winter and spring. On the contrary, although some years this water mass can be observed at the aforementioned Mallorca Channel (C33), Mahon transect (MH) and EPC station, the average values do not reflect its presence, suggesting that the preference pathway of this water mass would be through the Ibiza Channel. The average temperature and salinity profiles show evidence of WIW in Cape Gata, the eastern limit of the Alboran Sea, indicating that this water mass reaches this southern region in most of the years (Fig. 3 and Fig. 11). Although a clear signal of WIW is not obtained in the mean θs profiles for the other Alboran sea stations, figure 2 shows that this water mass is present in the Alboran Sea as far as P3 station during some years (grey dots). It is also worth mentioning that WIW is found in the Balearic Channels at a depth ranging 10
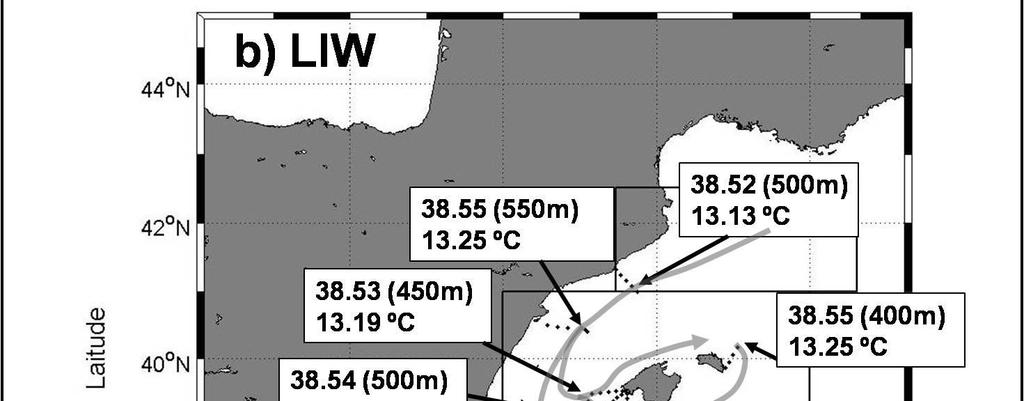
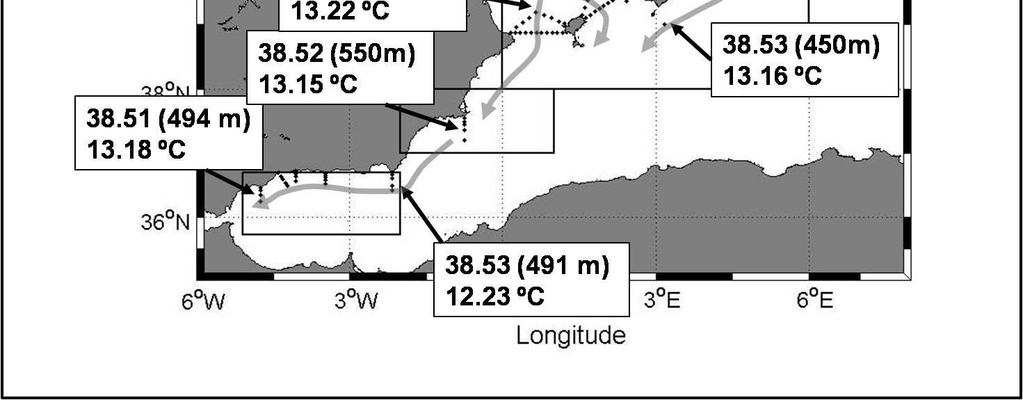
12 between 80 and 200m, just above the LIW waters, but also at the sea surface in some locations (Fig. 11a). This latter result indicates that these are locations of WIW formation. This result is supported by those in Vargas-Yáñez et al. (2012b) who found the winter vertical homogenization of the water column with WIW values at the continental shelf of the Ibiza Channel and Cape Palos. This process was coincident with episodes of strong heat losses LIW is found below the WIW and is characterized by a relative temperature maximum and an absolute salinity maximum. This water mass is observed in all the transects (figures 2 to 9) and during all the seasons of the year. Figure 11b summarizes the mean values of the LIW around the Spanish waters. LIW values correspond to winter season. The rest of the year is not presented as the LIW seasonal variability is very weak. LIW is observed in the average θs profiles in all the sections of the RADMED project coinciding with the usually accepted LIW pathway. Its presence at P3 station simply reflects the well known result that this water mass is one of the major contributors to the Mediterranean water outflow at the Strait of Gibraltar Deep waters extend below the LIW to the sea bottom. Mean values for the period analyzed in the RADMED project (2007-) range between ºC and 12.9 ºC for potential temperature and for salinity. It is interesting to note that the RADMED project was initiated after the beginning of the Western Mediterranean Transition (López-Jurado et al., 2005; Schroeder et al., 2010; 2016) and therefore the hook shape for the deepest part of the θs diagrams is clearly visible in most of the CTD casts and also in the average or mean profiles in the deepest oceanographic stations: CP4 (Fig. 4), C33 (Fig. 5), MH4 (Fig. 8) and EPC (Fig. 9) Decadal changes from the RADMED, L Estartit and Fuengirola stations Linear trends were estimated for each depth level within each oceanographic station. Figure 12 is an example of potential temperature, salinity and potential density trends as 11
13 a function of depth for P3 and CG5 stations. Thin lines represent the trends plus and minus the 95% confidence interval. Figure 13 is the same for two of the deepest stations CP4 and MH4. Confidence intervals for the upper 200 or 300m of the water column are too large in order to conclude about the existence of any significant trend. The intermediate layer from 200m to 600m seems to show positive temperature and salinity trends, but the statistical significance is not clear. P3 shows significant warming and salting trends at the 95 % confidence level for most of the depth levels, but not for all of them. Decadal changes are significant from 300m depth for temperature in CG5 and from 400m in the case of salinity. For the deepest stations such as CP4 and MH4, intermediate layers seem to have increased its temperature and salinity for the last 9 years, but these results are not statistically significant. On the contrary, deep waters below 1000m show a clear warming and salting trend The only changes that are clearly observed in the surface waters are those associated to the salinity of waters to the south of Mallorca Island and the temperature at l Estartit station. In the first case, station B3 increased its salinity from the sea surface to the sea bottom at 200m depth. Although temperature results are not significant, they seem to have decreased (results not shown). In the case of l Estartit station, located in the continental shelf of the Catalan Sea (over a bottom depth of 80m), temperatures at 0, 20, 50 and 80m depth showed clear and positive significant trends ranging from 0.18 ± 0.05 ºC/decade to 0.26 ± 0.08 ºC/decade (Fig.14). Notice that these time series are the longest ones in the present study (Figure 14) as the monitoring of this station was initiated in The second time series according to its length is that corresponding to the sea surface temperature in Fuengirola beach. This time series shows a positive trend of 0.12 ºC/decade, but this result is not statistically significant at the 95% confidence level. For comparison of the AW behavior at Fuengirola beach and at l Estartit station, linear trends were also calculated for the common period for the l Estartit temperature time series. The results corresponding to this period of time were very similar to those obtained for the complete series from 1969 to (Fig. 14)
14 Long term changes from historical time series Following the methodology in Vargas-Yáñez et al. (2010b), the Mediterranean waters surrounding the Spanish coast were divided into four areas (Fig. 1). All available temperature and salinity profiles from the MEDAR/MEDATLAS data base were obtained and merged with TS data from the RADMED stations within the same region. These time series have been extended until in the present work Tables II to V show the potential temperature and salinity trends and the absorbed heat for the upper Atlantic waters (AW, dbar), intermediate waters (IW, dbar) and deep waters (DW, 600 dbar-bottom). Results are presented for each of the four analyzed regions: Alboran Sea, Cape Palos region, Balearic Sea and Northern Sector. In the case of temperature and salinity, time series for each layer are constructed averaging the available data within the corresponding depth range. In the case of the absorbed heat, it is calculated for each area and year as the heat absorbed with respect to the reference temperature profile. The absorbed heat in Joules is obtained by means of the expression: z2 Q = S( z) ρ ( z) c z1 p ( z) T ( z) dz Being S(z) the surface of the box considered, ρ density, c p specific heat capacity and T the temperature difference for a particular year respect to the reference profile. The depth limits for the considered layer are expressed by z 1 and z For the absorbed heat estimation we include two different calculations. The first one considers that the missing values correspond to the climatological or long term mean. The second one considers that the available values for the layer considered are representative of the whole layer (see section 2). The absorbed heat is also included for the complete water column. All the calculations are repeated including and excluding the bathythermograph data. Trends are estimated for the complete period of time, from 1900 to and for the period extending from 1943 to. Table VI shows the 13
15 trends obtained when the four areas are considered as a single one. Time series of absorbed heat and salinity for the whole area and for the three aforementioned layers (AW, IW, DW) plus the water column are presented in figure 15 and For the period 1900-, the temperature of the AW does not show significant trends with the only exception of the Northern Sector. Nevertheless, in this case the significance of the warming trend is sensitive to the inclusion of bathythermograph data in the time series. For the more recent period the warming trends are significant in the Alboran Sea while they are not in the case of Cape Palos region and the Balearic Sea. In the Northern Sector, once again, the significance of the estimated trends is dependent on the data set used. The same lack of significant results is obtained for the whole area (table VI). From these time series we cannot conclude the existence of robust warming trends in the AW. The AW salinity increased in the Alboran Sea and Cape Palos region for the two periods analyzed, while no significant trends were obtained in the Northern Sector. The mean values for the four areas show an increase of the AW salinity from 1900 to which is intensified during the period With very few exceptions, the IW increased its temperature with an intensification of the warming trends for the period. Trends for the four areas analyzed and for the whole area, range between 0.02 ºC/decade and 0.05 ºC/decade. The salinity of this layer increased in all the cases despite the region or the data set used. Trends are intensified for the period ranging between 0.01 decade -1 and 0.02 decade -1. A similar result is obtained for the deep layer with positive trends for the two periods analyzed and for all the regions and data sets. The most intense warming trends, once again, correspond to the period, ranging between 0.01 ºC/decade and 0.05 ºC/decade Results concerning the heat absorbed by the water column follow the same evolution to those of temperature time series. Slight differences are attributed to the different data analysis methods. In summary, the water column in the Spanish Mediterranean has absorbed heat in a significant way since This process was intensified after
16 with at a rate ranging between 0.26 W/m 2 and 0.56 W/m 2 depending on the methodology applied (see Figure 15 and table VI). Notice that the absorbed heat time series are in Joules and the trends should be in J/yr. Years have been converted into seconds and the trends divided by the surface of the region in order to express trends as W/m Discussion Mean temperature and salinity profiles. The θs diagrams in figures 2 to 9 show the large variability in the water masses surrounding the Spanish peninsular and insular waters. Colored profiles and θs diagrams in such figures show the mean values obtained after averaging all the available data from the beginning of the time series to. Those characteristics present in the mean profiles reflect the most frequent situations corresponding to each season of the year and each region. Nevertheless we should keep in mind that any particular measurement corresponding to one single cruise can differ from the long term mean value in a certain range. Variability ranges expressed as a standard deviation or simply as a maximum minus minimum recorded values are very helpful information as they can be used in order to detect anomalous situations or extreme climatic events. For brevity, the present work only provides information concerning the long term mean values for temperature and salinity in some key points (Figures 2 to 9 and figures 10 and 11). Table SI in supplementary material provides more information from such key points Mean values estimated in the present work cannot be considered as proper climatologies because of the present length of the available time series, nevertheless the present work aims at showing the capability of the RADMED project for providing such climatologies in the future. The accuracy of these climatologies depends both on the number of data points and the natural variability of the time series. It is worth noticing that for the estimation of climatological profiles from the MEDAR data base, a large 15
17 area should be used. For instance, climatological potential temperature and salinity profiles were calculated for the Alboran Sea, Cape Palos sector and the Balearic Sea using the boxes in Fig. 1. The use of RADMED stations provides a better spatial resolution. Confidence intervals for the climatological values estimated from MEDAR data were compared with those estimated for some stations from the RADMED project at the same area. The accuracy for MEDAR climatologies was slightly better than that for the RADMED mean values for the case of the upper layer (from the surface to m). On the contrary, confidence intervals for RADMED mean profiles were similar or even lower below this depth level (supplementary material figures S1 and S2). The explanation is the data scarcity at deep levels in the MEDAR data base. This is clearer if we consider the number of data points available for each year and for different depth levels in MEDAR (supplementary material figures S3, S4 and S5). When considering MEDAR data over large areas, several years lasting periods with no data can be found. Beside this, the average number of annual data decreases considerably with depth. This average number can be under four data per year below the 200m or 500m level depending on the geographical area. Therefore, in most of the cases, the RADMED sampling frequency improves the MEDAR data availability for deep levels Water masses and circulation. Temperature and salinity data collected from 1996 to in the Balearic Islands and from 2007 to in the Catalan Sea are analyzed. These data allowed us to speculate about the most frequent circulation of water masses within the Catalan and Balearic Seas. According to Salat and Cruzado (1981) three different water masses occupy the Catalan-Balearic Sea. The first one is named as Continental Water. These waters are found close to the coast and have low salinity values because of the influence of river discharges. The second one is named as Mediterranean Water, which occupies the area of cyclonic circulation between the peninsula and the Balearic Islands. These waters are characterized by high salinity values around 38. The branch of this cyclonic cell flowing along the continental slope of the Iberian Peninsula constitutes an extension of the northern current. The third water mass is the Atlantic Water which origin is in the Algerian current. This latter water mass would be advected to the north within eddies detached from such current (Millot, 1999). Figure 10 shows that winter surface waters 16
18 along the Catalan Slope have temperatures ranging between ºC and ºC and salinity values between 38 and These values seem to agree with the presence of the northern current and its extension to the south along the Catalan continental slope and its bend to the North East to form the Balearic Current along the northern Balearic continental slope (Font and Ballester, 1984; Font et al., 1988). This conclusion would be supported by the salinity values at the vertexes of the triangles formed by the oceanographic stations C (Fig.10). These values indicate the presence of Mediterranean Water (according to Salat and Cruzado, 1981 definition) to the north of the islands. Winter salinity values at the upper 25 m at the base of the triangle between Ibiza and the peninsula are between and At the base of the triangle between Ibiza and Mallorca, these values are lower, ranging between and This result would indicate that the Ibiza Channel could be the main pathway for the Mediterranean surface waters flowing to the south. This result would coincide with those in Font et al. (1988) who reported a southward geostrophic transport of 1 Sv for the surface and intermediate waters that flew through the Ibiza Channel. Lower salinity values at the Mallorca Channel and those at the B transect to the south of Mallorca Island (37.6) would also support the frequent intrusions of Atlantic Waters through this second channel. Early works by Font and Miralles (1978) support this conclusion. These authors analyzed two hydrographic cruises corresponding to October 1976 and March The winter cruise evidenced the existence of a surface current flowing to the south through the Ibiza Channel, while Atlantic Water intrusions were observed at the Mallorca and Menorca Channels Nevertheless, not all the information concerning the circulation through the Balearic channels fully supports the picture depicted above. Pinot et al. (1995), Pinot and Ganachaud (1999) analyzed cruises carried out in May 1991 and June 1993 respectively. These authors described the extension of the northern current along the Catalan slope with a transport around 1 Sv. These works show that most of the transport is deflected to the NE forming the Balearic current with an important contribution of Atlantic Waters flowing through the Mallorca Channel and also through the Ibiza Channel. These authors hypothesize that large volumes of WIW arriving at the channels in spring could form anticyclonic gyres. According to Balbín et al. (2014) these eddies would block the southward circulation of both upper and intermediate waters. 17
19 Results in Pinot et al. (1995) and Pinot and Ganachaud (1999) are not necessarily in contradiction with those works that had considered the Ibiza channel as the main path of modified Atlantic Water and intermediate waters towards the south, neither they are in contradiction with the results presented in this work. Results in Pinot et al.(1995), Pinot and Ganachaud (1999) are based on spring cruises. According to these authors the blocking of the circulation through the channels would be caused by large volumes of WIW which source would be to the north in the Catalan or the Ligurian Sea, arriving to the Balearic Sea in spring. On the contrary, results in early works by Font and Miralles (1978) would be based on data from winter cruises. On the other hand, the results shown in the present work are based on long term mean values obtained from observations along more than a decade. These mean values suggest that the Ibiza channel seems to be the preferential path for both surface modified Atlantic waters and WIW flowing southward, while the Mallorca and Menorca channels would be more favorable places for northward AW intrusions. Lower salinity values to the East of Menorca Island also indicate the frequent presence of AW which, according to Millot (1999), would have its origin in eddies detached from the Algerian current. According to present data, these intrusions would be more frequent and progress further to the north during summer months. Nevertheless, it should be kept in mind that these conclusions concern the mean values and only represent the most likely situation. Any particular year can differ substantially from the general pattern proposed in this work It is also worth mentioning the presence of temperature and salinity values within the WIW range both in winter and spring at a depth range from the sea surface to 200m (Figure 11a). López-Jurado et al. (1995) studied the circulation of WIW in the Balearic Channels and concluded that low salinity WIW (S 37.7) with a local origin could be found in the channels during winter, while higher salinity WIW (38.1 S 38.3) which origin could be further to the north would arrive to the channels in spring. Figure 11a shows that WIW temperature and salinity values can be observed in winter at the sea surface in Barcelona (BNA) and Tarragona (T) sections and in the peninsular continental shelf of the Ibiza channel. These results would support that WIW is formed not only at the northern sector of the Liguro-Provençal basin, but also in the continental shelf of the Balearic Channels. Vargas-Yáñez et al. (2012b) have shown that WIW can be formed even further to the south in locations such as Cape Palos (CP) during very 18
20 severe winters. Nevertheless, the mean values presented in figures 2 to 9 and figure 11a indicate that this is not the most frequent situation. The analysis of the RADMED data allows us to distinguish a clear signal of the WIW in the mean values obtained at the eastern limit of the Alboran Sea (CG section, Fig. 11a). Furthermore, according to figure 2, large volumes of WIW can reach as far to the southwest as Cape Pino section (P) during some particular years. Nevertheless, when average temperature and salinity profiles are obtained, the temperature for the layer above LIW is higher than 13 ºC, suggesting that an important presence of WIW is not the most likely situation in this section Below the WIW, all the stations show the presence of a relative maximum of temperature and an absolute maximum for salinity which characterize the LIW. This feature is observed along the Catalan slope and to the north and south of the Balearic Islands. This result would suggest that the northern current is extended to the south transporting intermediate waters, both WIW and LIW, coinciding with previous works mentioned above. The presence of LIW along the continental slope in the Alboran Sea would also coincide with the commonly accepted pathway for this water mass. In fact, Parrilla et al. (1986) used the core method to identify the presence of LIW in the Alboran Sea (S > ). These authors found that the LIW occupies the m layer in the Alboran Sea from the Spanish to the Moroccan coast. Nevertheless, the thickness of the high salinity layer associated to the LIW maximum was higher at the northern part of the Alboran Sea, decreasing to the south. As this water mass progresses from East to West, Parrilla et al. (1986) concluded that the stronger presence of LIW at the northern sector of the Alboran Sea was caused by the effect of the Coriolis force The layer from 800m to the sea bottom is occupied by WMDW formed by winter deep convection in the Gulf of Lions. Mean values for potential temperature and salinity from 1000 m to 2400 m are very homogeneous in the deep stations occupied in the RADMED project. In this depth range and for the four seasons of the year, the potential temperature mean values ranged between ºC and ºC, while salinity values were between and The lowest mean values estimated in the RADMED project (12.89 ºC, 38.47) are much higher than those values reported during the last 19
21 century. Lacombe et al. (1985) reported WMDW potential temperature and salinity values increasing from ºC, in 1909 to ºC, in Bethoux and Gentili (1996) showed time series of potential temperature and salinity monotonically increasing up to Maximum values reached in these series were lower than 12.8 ºC and The differences between present calculations and previous works could be caused by the increasing long term trends already detected in the Mediterranean Sea deep layers (Vargas-Yáñez et al., 2010a, 2010b; Borghini et al., 2014). Beside these trends, the recent Western Mediterranean Transition has been responsible for the formation of very warm and salty deep waters, denser than previous WMDW. This new water mass has occupied the bottom layer uplifting old WMDW. The signature of this new water mass on temperature and salinity time series is an important increase of both variables. Its signal on θs diagrams is a hook shape at the deepest levels. Below the classical mixing line between the LIW salinity and temperature maxima and the WMDW minima, the presence of this new WMDW produces an increase of both potential temperature and salinity below the previous minima. This behavior has been extensively described in López-Jurado et al. (2005), Schroeder et al. (2016, 2010), Smith and Bryden (2007). This feature can be clearly observed in the deepest stations of the RADMED project MH4 (Fig. 8) and EPC1 (Fig. 9) and is also suggested in shallower stations such as C33 (Fig. 5) and CP4 (Fig. 4). It is also worth mentioning that the new bottom water is not only observed during some years (grey dots in figures 4, 5, 8, 9), but also in the mean profiles. This latter situation would suggest the persistence of this water mass since the beginning of the RADMED project in Finally, it is worth mentioning that the circulation in the Balearic channels and in the Alboran Sea is subject to interannual and decadal variability and the results outlined above could be sensitive to the period of time analyzed. As the RADMED time series get longer, the present results will become more robust or will allow us to study such inter-annual and decadal variability in the circulation patterns already described
22 Long term changes. Concerning the long term changes operating in the Mediterranean since the beginning of the twentieth century, the update and extension of time series by means of the RADMED data seem to confirm some previous results and clarify others (see tables II to VI and figures 15 and 16). In the case of the upper layer occupied by AW, Vargas- Yáñez et al. (2010b) had shown a warming of this layer until the RADMED data extension until is not able to produce significant results. The sampling interval (four times per year) does not allow us to filter out short time scale variability and the final seasonal and annual time series contain a very large variance associated to time scales different from the long term changes. Beside this, the large natural variability of the upper layers makes the long trend estimations very sensitive to the addition of a few new years. The Fuengirola beach time series is made of daily temperature measurements. Annual series filter out most of the short time scale variability. The linear trend for this time series is 0.12 ± 0.13 ºC/decade.The confidence interval is calculated at the 95% confidence level. If the 90% level is considered the result is 0.12 ± 0.10 ºC/decade. Following the IPCC terminology, it is very likely that the AW in the Fuengirola beach increased its temperature. However, this trend is not significant in the 95% level that is followed in the rest of this work and in previous ones (Vargas-Yáñez et al., 2009, 2010a, 2010b). If the temperature time series in l Estartit station are considered (Fig. 14), the temperature at 0, 20, 50 and 80m increased at a rate ranging between 0.18 ± 0.05 ºC/decade to 0.26 ± 0.08 ºC/decade, being these results significant at the 95% level (extremely likely). There are several possibilities for this difference in the confidence levels obtained for these two results. First, the AW in Fuengirola arrives directly from the Strait of Gibraltar without being modified by atmospheric conditions and mixing within the Mediterranean Sea. On the contrary, AW in l Estartit is the result of intense modifications after completing a cyclonic circuit in the Western Mediterranean. Therefore it could be speculated that the warming of Mediterranean waters is the result of processes occurring within the Mediterranean, while these changes would not affect or would not be so intense in the nearby Atlantic Ocean. This hypothesis is not supported by the increase of the heat content in the Atlantic reported by Levitus et al. (2012). This work shows a large increase of the heat content in the North Atlantic from to in the same latitude range corresponding to the Mediterranean Sea. A second possibility is that the Fuengirola beach and l'estartit 21
23 time series cover a different period of time. Nevertheless, when linear trends were calculated using l'estartit time series for the same period of time corresponding to Fuengirola time series, the results did not change substantially (Fig. 14). A third possibility is that this is simply a statistical result caused by the different length and variance of these time series. In the case of Fuengirola beach, the length of the temperature time series is 31 years and the standard deviation depends on the month of the year varying between 0.56 ºC for winter months to 1.8 ºC in September. L Estartit time series are 47 years long and the standard deviations range between 0.45 ºC and 1 ºC. The larger the variability superimposed on linear trends, the longer the time series should be in order to detect such trends in a significant way. Therefore we consider that this is the explanation for the lower significance of warming trends in Fuengirola beach temperature time series Updated time series from 1900 to show that the intermediate layer has increased its salinity in all the regions analyzed (Alboran Sea, Cape Palos, Balearic Sea and northern sector, tables II to V) and for the whole area (Fig. 16, table VI). The salting trends have intensified after 1943 with values between 0.01 and 0.02 decade -1. The temperature of the intermediate layer has also increased (Fig. 15, table VI). As in the case of salinity, these warming trends have intensified after 1943 with values between 0.02 and 0.04 ºC/decade. The extension of present time series with the inclusion of the new data ( ) seems to confirm previous results in Vargas-Yáñez et al. (2010a, b) indicating that the last decade had a similar behavior to the previous ones Finally, the deep waters of all the areas analyzed have increased its temperature and salinity. The temperature and salinity trends for the whole area and from 1900 to were 0.02 ºC/decade and decade -1. Once again there was an acceleration of the warming and salting rates since the mid twentieth century (0.04 ºC/decade and 0.01 decade -1 ). These warming trends are higher than those previously reported in Vargas- Yáñez et al. (2010b). The increase in the temperature trends could be linked to the new bottom water masses appeared in the WMED after These results are very robust as they do not depend on the period of time analyzed or the methodology. 22
24 The positive trends for the l Estartit station and those in Fuengirola beach (with a lower degree of confidence) and the salinity and temperature increase of the intermediate layer make us hypothesize that the deep water warming and salting is the result of the positive temperature and salinity trends in the water masses contributing to deep water formation: AW and LIW. Furthermore, this would be the result of an increase in net evaporation and heat absorption through the sea surface. These trends would be enhanced during the last years of the series by the influence of the Western Mediterranean Transition. This is a phenomenon which should be monitored in order to determine whether it will change the structure of the Western Mediterranean water masses or the old situation will be restored. Updated time series show that the heat content of the water column in the area of study has increased at a rate between 0.2 and 0.6 W/m 2 since This result is consistent with that in Levitus et al. (2012) who estimated the heat absorption of 0.27 W/m 2 for the upper 2000 m of the world ocean Conclusions The RADMED time series have shown to be a valuable tool for assessing the mean or average hydrographic conditions along the continental shelf and slope in the Spanish Mediterranean as well as long term changes or trends. Temperature and salinity mean values in winter are coherent with the extension of the northern current along the Catalan continental slope carrying severely modified AW and WIW and LIW below. The three water masses would partially flow to the south, mainly through the Ibiza channel while another fraction of these water masses would be deflected to the North East flowing to the north of the Balearic Islands forming the Balearic current. The Mallorca channel, the Menorca channel and the eastern side of Menorca Island would be more favorable places for AW northward intrusions. This picture would correspond to the average or more frequent situation, but some particular years could present important alterations such as the Ibiza channel blocking by WIW eddies. The summer temperature and salinity mean values indicate that the AW would progress further to the north decreasing the surface water salinity. The highest temperatures from all the sections analyzed correspond to summer surface waters in the Balearic Islands. 23
25 WIW is mainly formed during winter in the Gulf of Lions and the Ligurian Sea arriving to the Balearic channels in spring. Nevertheless, the RADMED project has revealed that the Balearic channels could also be a frequent site of intermediate water formation and exceptionally this process could be displaced further to the south reaching areas as Cape Palos. As already stated, the WIW progresses to the south mainly through the Ibiza channel and is diluted by mixing with waters above and below on its pathway. Nevertheless, it can be considered that this water mass is clearly identifiable as a temperature and salinity minimum above the LIW in Cape Gata (within the Alboran Sea) during most of the years. Although it would not be so frequent, some years this water mass can maintain its characteristics with temperatures below 13 ºC in Cape Pino section, close to the Gibraltar Strait The inclusion of new deep stations in the RADMED project since 2007 and the maintenance of some deep stations from previous projects (ECOMURCIA and CIRBAL) have allowed us to detect and monitor the effects of the Western Mediterranean Transition in the Western Mediterranean. Deep stations have revealed that the new bottom waters, warmer and saltier than previous WMDW have been present in this area of the Western Mediterranean during this period of time It is extremely likely that intermediate and deep layers have increased their temperature and salinity during the last century and the beginning of the present one, being these trends accelerated during the second half of the twentieth century. Considering the large variance of the upper layer, the RADMED time series are not long enough neither they have the appropriate frequency for the detection of long term trends. Nevertheless, based on Fuengirola beach and l Estartit time series, we speculate that the upper layer has also increased its temperature during the last 30 or 40 years. The increase in the water column heat content seems to be in agreement with those figures obtained for the rest of the world ocean Acknowledgements. The RADMED monitoring programme is funded by the Instituto Español de Oceanografìa, and has been partially funded by the DESMMON project (PN 24
26 I+D+I CTM C02-01), the PERSEUS project (FP ), the IRIS-SES project (DG ENV GA /2013/659540/SUB/C2.), the ActionMed project (DG- ENVGA //12631/SUB/ENVC.2)ATHAPOC project (PN I+D+I CTM R). Some of the infrastructures involved have been funded by the European Fund for Regional Development under project Mejora del Equipamiento Científico-Técnico Para Estudios de Oceanografía Biogeofísica en Baleares (IEOC13-4E- 1844). Some of the instruments used during the cruises were made available to the RADMED programme by the Balearic Islands Coastal Observing and Forecasting System, SOCIB References Alexanderson, H., A homogeneity test applied to precipitation data. J. Climatol., 6, Alexanderson, H., A. Moberg, Homogeneitation of Swedish temperature data. Part 1: Homogeneity test for linear trends. Int. J. Climatol., 17, Balbín, R., J.L. López-Jurado, M.M. Flexas, P. Reglero, P. Vélez-Velchí, C. González- Pola, J.M. Rodríguez, A. García, F. Alemany, Interannual variability of the early summer circulation around the Balearic Islands: Driving factors and potential effecs on the marine ecosystem. J. Mar. Syst., 138, Doi: /j.jmarsys Bethoux, J.P., B. Gentili, P. Morin, E. Nicolas, C. Pierre, D. Ruiz-Pino, The Mediterranean Sea: a miniature ocean for climatic and environmental studies and a key for the climatic functioning of the North Atlantic. Prog. In Oceanogr., 44,
27 Béthoux, J.P., B. Gentili, D. Taillez, Warming and freshwatr budget change in the Mediterranean since 1940s, their possible relation to the greenhouse effect. Geophys. Res. Lett., 25, No 7, Bethoux, J.P., B. Gentili, The Mediterranean Sea, coastal and deep-sea signatures of climatic and environmental changes. J. Mar. Syst., 7, Borghini, M., H. Bryden, K. Schroeder, S. Sparnocchia, A. Vetrano, The Mediterranean is becoming saltier. Ocean Sci., 10, Doi: /os Domingues, C.M., J.A. Church, N.J. White, P.J. Glecker, S.E. Wijffels, P.M. Barker, J. Dunn, Improved estimates of upper-ocean warming and multidecadal sea level rise, Nature, 453, , doi: /nature Font, J., L. Miralles, Res. Exp. Cient. B/O Cornide, 7, Font, J., A. Ballester, Seasonal velocity variations in the continental side of the Catalan Gyre. Rapp. Comm. Int. Mer Médit., 29, 3, Font, J., J. Salat, J. Tintoré, Permanent features of the circulation in the Catalan Sea. Oceanol. Acta, 9, Gasparini, G.P., A. Ortona, G. Budillon, M. Astraldi, E. Sansone, The effect of the Eastern Mediterranean Transient on the hydrographic characteristics in the Strait of Sicily and in the Tyrrhenian. Deep-See Res. I, 52,
28 Gouretski, V., K.P. Koltermann, How much is the ocean really warming? Geophys. Res. Lett., 34, L01610, doi: /2006GL Houpert, L., X. Durrieu de Madron, P. Testor, A. Bosse, F. D Ortenzio, M.N. Bouin, D. Dausse, H. Le Goff, K. Kunesch, M. Labaste, L. Coppola, L. Mortier, P. Raimbault, Observations of open-ocean deep convection in the northwestern Mediterranean Sea: Seasonal and interannual variability of mixing and deep water masses for the period. J. Geophys. Res., Oceans, 121, doi: /2016JC Jordá, G., D. Gomis, Reliability of the steric and mass components of the Mediterranean sea level es estimated from hydrographic gridded products. Geophys. Res. Lett., 40, , doi: /grl Krahmann, G., F. Schott, Longterm increases in Western Mediterranean salinities and temperatures: anthropogenic and climatic sources. Geophys. Res. Lett. Vol. 25, No. 22, Lacombe, H., P. Tchernia, L. Gamberoni, Variable bottom water in the Western Mediterranean Basin. Prog. In Oceanogr., 14, Leaman, K.D., F. Schott, Hydrographic structure of the convection regime in the Gulf of Lions: Winter J. Phys. Oceanogr., Vol. 21, Levitus S., J.I. Antonov, T.P. Boyer, O.K. Baranova, H. E. García, R. A. Locarnini, A. V. Mishonov, J. R. Reagan, D. Seidov, E. S. Yarosh, M. M. Zweng, World ocean heat content and thermosteric sea level change ( m), Geophys. Res. Lett., Vol. 39, L10603, doi: /2012GL
29 Levitus, S., J.I. Antonov, T.P. Boyer, R.A. Locarnini, H.E. García, A.V. Mishonov, Global ocean heat content in light of recently revealed instrumentation problems. Geophys. Res. Lett., 36, L07608, doi: /2008GL Llasses, J., G. Jordá, D. Gomis,. Skills of different hydrographic networks in capturing changes in the Mediterranean Sea at climate scales. Climate Research, 63, López-Jurado, J.L., R. Balbín, B. Amengual, A. Aparicio-González, M.L. Fernández de Puelles, M.C. García-Martínez, M. Gaza, J. Jansá, A. Morillas-Kieffer, F. Moya, R. Santiago, M. Serra, M. Vargas-Yáñez, L. Vicente,. The RADMED monitoring program: towards an ecosystem approach. Ocean Sci. Discuss, 12, doi: /osd López-Jurado, J.L., C. González-Pola, P. Vélez-Belchí, Observation of an abrupt diruption of the long-term warming trend at the Balearic Sea, western Mediterranean Sea, in summer Geophysical Research Letters, vol 32. doi: /2005GL López-Jurado, J.L., J. García-Lafuente, N. Cano, Hydrographic conditions of the Ibiza Channel during November 1990, March 1991 and July Oceanol. Acta, Vol. 18, nº 2, MEDAR Group, MEDATLAS/2002 database Mediterranean and Black Sea database of temperature salinity and bio-chemical parameters. Climatological Atlas MEDOC Group, Observation of the formation of Deep Water in the Mediterranean Sea, Nature, Vol., 227, No. 5262,
30 Millot, C., Another description of the Mediterranean Sea outflow. Prog. In Oceanogr., 82(2), Doi: /j.pocean Millot, C., Circulation in the Western Mediterranean Sea. J. Mar. Syst., 20, Nielsen, J.N., Hydrography od the Mediterranean and adjacent waters. Report on the Danish Oceanographical expeditions to the Mediterranean and adjacent seas. Vol. I, Nykjaer, L Mediterranean Sea surface warming Climate Research. Vol.39, Doi: /cr Painter, S.C., M.N. Tsimplis, Temperature and salinity trends in the upper waters of the Mediterranean Sea as determined from MEDATLAS data set. Cont. Shelf Res., 23, Parrilla, G., T.H. Kinder, R. Preller, Deep and Intermediate Mediterranean Water in the Western Alboran Sea. Deep-Sea Res., 33, Nº 1, Pascual, J., J. Salat, M. Palau, Evolución de la temperatura del mar entre 1973 y 1994, cerca de la costa catalana, en Int. Coll. Okeanos, 23-28, Montpellier. Pinot, J.M., A. Ganachaud, The role of Winter intermediate waters in springsummer circulation of the Balearic Sea 1. Hydrography and inverse modeling. J. Geophys. Res., 104, No. C12,
31 Pinot, J.M., J. Tintoré, D. Gomis, Multivariate analysis of the surface circulation in the Balearic Sea. Prog. Oceanogr., 36, Poulain, P.M., R. Barbanti, J. Font, A. Cruzado, C. Millot, I. Gertman, A. Griffa, A. Molcard, V. Rupolo, S. Le Bras, L. Petit de la Villeon, MedArgo: a drifting profiler program in the Mediterranean Sea. Ocean Sci., 3, Rhein, M., S.R. Rintoul, S. Aoki, E. Campos, D. Chambers, R.A. Feely, S. Gulev, G.C. Johnson, S.A. Josey, A. Kostianoy, C. Mauritzen, D. Roemmich, L.D. Talley and F. Wang, 2013: Observations: Ocean. In: Climate Change 2013: The Physical Science Basis. Contribution of Working Group I to the Fifth Assessment Report of the Intergovernmental Panel on Climate Change [Stocker, T.F., D. Qin, G.-K. Plattner, M. Tignor, S.K. Allen, J. Boschung, A. Nauels, Y. Xia, V. Bex and P.M. Midgley (eds.)]. Cambridge University Press, Cambridge, United Kingdom and New York, NY, USA Rixen, M., J.M. Bakers, S. Levitus, J. Antonov, T. Boyer, C. Maillard, M. Fichaut, E. Balopoulos, S. Iona, H. Dooley, M.J. García, B. Manca, A. Giorgetti, G. Mazella, N. Mikhailov, N. Pinardi, M. Zavatarelli, The Western Mediterranean Deep Water: A proxy for climate change. Geophys. Res. Lett., 32, L12608, doi: /2005GL Roether, W., B. Klein, B. B. Manca, A. Theocharis, S. Kioroglou, Transient Eastern Mediterranean deep waters in response to massive dense-water output of the Aegean Sea in the 1990s Roether, W., B.B. Manca, B. Klein, D. Bregant, D. Georgopoulos, V. Beitzel, V. Kovacevic, A. Luchetta, Recent changes in the Eastern Mediterranean Deep Waters. Science, Vol. 271,
32 Rohling, E.J., H.L. Bryden, Man-induced salinity and temperature increase in Western Mediterranean Deep Water. J. Geophys. Res., Vol. 97, No. C7, Salat, J., J. Pascual, Principales tendencias climatológicas en el Mediterráneo Noroccidental a partir de más de 30 años de observaciones oceanográficas en la costa catalana. En Clima, Sociedad y Medio Ambiente. J.M. Cuadrat Prats, M.A. Sánchez, S.M. Vicente Serrano, S. Lanjeri, N. De Luis Arrillaga, J.C. González-Hidalgo (Editores). Publicaciones de la Asociación Española de Climatología (AEC), serie A, nº 5, Salat, J., A. Cruzado, Masses d eau dans la Mediterranee Occidentale: Mer Catalan et eaux adjacentes. Rapp. Comm. Int. Médit., 27, 6, Sánchez-Román, A., S. Ruiz, A. Pascual, B. Mourre, S. Guinehut, On the mesoscale monitoring capability of Argo floats in the Mediterranean Sea. Ocean Sci. Discuss., doi: /os Schroeder, K., J. Chiggiato, H.L. Bryden, M. Borghini, S.B. Ismail, Abrupt climate shift in the Western Mediterranean Sea. Scientific Reports, 6: 23009, doi: /srep Schroeder K., Millot C., Bengara L., Ben Ismail S., Bensi M., Borghini M., Budillon G., Cardin V., Coppola L., Curtil C., Drago A., El Moumni B., Font J., Fuda J.L., García- Lafuente J., Gasparini G.P., Kontoyiannis H., Lefevre D., Puig P., Raimbault P., Rougier G., Salat J., Sammari C., Sánchez Garrido J.C., Sanchez-Roman A., Sparnocchia S., Tamburini C., Taupier-Letage I., Theocharis A., Vargas-Yáñez M. and Vetrano A., Long-term monitoring programme of the hydrological variability in the Mediterranean Sea: a first overview of the HYDROCHANGES network. Ocean Sci., 9: , doi: /os
33 Schroeder, K., S.A. Josey, M. Hermann, L. Grignon, G.P. Gasparini, H.L. Bryden, Abrupt warming and salting of the Western Mediterranean Deep Water after 2005: Atmiospheric forcing and lateral advection. J. Geophys. Res., 115, C Doi: /2009JC Tignor, S.K. Allen, J. Boschung, A. Nauels, Y. Xia, V. Bex and P.M. Midgley (eds.)]. Cambridge University Press, Cambridge, United Kingdom and New York, NY, USA Skliris, N., S. S. Sofianos, A. Gkanasos, A. Mantziafou, V. Versatis, P. Axaopoulos, A. Lascaratos, Decadal scale variability of sea surface temperatura in the Mediterranean Sea in relation to atmospheric variability. Ocean Dynamics, doi: /s Smith, R.O., H.L. Bryden, Observations of new western Mediterranean deep water formation using ARGO floats Ocean Sci. Discuss., 4, Sparnocchia, S., G.M.R. Manzella, P.E. La Violette, The interanual and seasonal variability of the MAW and LIW core properties in the Western Mediterranean Sea. En Seasonal and Interannual variability of the Western Mediterranean. Coastal and Estuarine Studies. P.E. La Violette (Editor), American Geophysical Union, Washington Sverdrup, H.U., M.W. Johnson and R.H. Fleming, The Oceans, Their Physics, Chemistry, and General Biology. Prentice Hall, New York, 1087 pp Tel, E., R. Balbín, J.M. Cabanas, M.J. García, M.C. García-Martínez, C. González-Pola, A. Lavín, J.L. López-Jurado, C. Rodríguez, M. Ruiz-Villareal, R.F. Sánchez-Leal, M. Vargas-Yáñez, P. Vélez-Belchi, IEOOS: The Spanish Institute of Oceanography Observing System. Ocean Sci. Discuss., 12, doi /os
34 Vargas-Yáñez, M., E. Mallard, M. Rixen, P. Zunino, M.C. García-Martínez, F. Moya, 2012a. The effect of interpolation methods in temperatura and salinity trends in the Western Mediterranean. Medit. Mar. Sci., 13/1, Vargas-Yáñez, M., P. Zunino, K. Schroeder, J.L. López-Jurado, F. Plaza, M. Serra, C. Castro, M.C. García-Martínez, F. Moya, J. Salat, 2012b. Extreme Western Intermediate Water formation in Winter J. Mar. Syst. Doi: /j.jmarsys Vargas-Yáñez, M., P. Zunino, A. Benali, M. Delpy, F. Pastre, F. Moya, M. C. García- Martínez, E. Tel, 2010a. How much is the Western Mediterranean really warming and salting?. J. Geophys. Res., 115, C04001, doi: /2009JC Vargas-Yáñez, M., F. Moya, M.C. García-Martínez, E. Tel, P. Zunino, F. Plaza, J. Salat, J. Pascual, J.L. López-Jurado, M. Serra, 2010b. Climate change in the Western Mediterranean Sea J. Mar. Syst., 82, Vargas-Yáñez, M., F. Moya, E. Tel, M.C. García-Martínez, E. Guerber, M. Bourgeon, Warming and salting in the Western Mediterranean during the second half of the 20th century: Inconsistencies, unknowns and the effect of data processing. Sci. Mar. 73(1), doi: /scimar n Zunino, P., K. Schroeder, M. Vargas-Yáñez, G.P. Gasparini, L. Coppola, M.C. García- Martínez, F. Moya, Effects of the Western Mediterranean Transition on the resident water masses: Pure warming, pure freshening and pure heaving. J. Mar. Syst., vol , 15-23, doi: /j.jmarsys
35 Oceanographic station Initial project Initial year Maximum depth(m) P1-P M1-M M4-M5 ECOMALAGA V1-V V P S1-S5 RADMED CG1-CG CP1, CP3, CP4 ECOMURCIA CP2 RADMED B1-B3 ECOBALEARES C1-C10 south Mallorca Channel C11-C21 south Ibiza Channel CIRBAL C22-C29 North Ibiza Channel C30-C37 North Mallorca Channel EPC MH1-MH RADMED T1-T BNA1-BNA Table I. Stations included in the RADMED project. It is included the year when the sampling was initiated, the maximum depth sampled and the project under which it was initiated
36 Alboran Sea With BT θ S Q abs. Q abs Zero anom. Repr. Anom. AW IW DW bottom Without BT θ S Q abs. Q abs Zero anom. Repr. anom. AW IW DW bottom Table II. Linear trends in the Alboran Sea for temperature (ºC/decade), salinity (decade - 1 ) and heat absorbed (W/m 2 ), for the AW (0-200 dbar), Intermediate layer ( dbar), deep layer (600 dbar-bottom) and for the water column (surface-sea bottom). All the trends are calculated for two periods: and. The estimation of the heat absorbed is made following two different methods named in the text as zero anomalies and representative anomalies. Numbers in bold are significant at the 95% confidence level. All the calculations are repeated included bathythermograph data and excluding them Cape Palos region With BT θ S Q abs. Q abs Zero anom. Repr. anom. AW IW DW bottom Without BT θ S Q abs. Q abs Zero anom. Repr. anom. AW IW DW bottom Table III. The same as in table I, but for Cape Palos region. 35
37 Balearic Sea With BT θ S Q abs. Q abs Zero anom. Repr. anom. AW IW DW bottom Without BT θ S Q abs. Q abs Zero anom. Repr. anom. AW IW DW bottom Table IV. The same as in table I, but for the Balearic Sea region Northern sector. With BT θ S Q abs. Q abs Zero anom. Repr. anom. AW IW DW bottom Without BT θ S Q abs. Q abs Zero anom. Repr. anom. AW IW DW bottom Table V. The same as in table I, but for the northern sector
38 The whole area With BT θ S Q abs. Q abs Zero anom. Repr. anom. AW IW DW bottom Without BT θ S Q abs. Q abs Zero anom. Repr. anom. AW IW DW bottom Table VI. The same as in table I, but for the whole area Figures caption Figure 1. Oceanographic stations from the RADMED project. Stations are distributed along transects. Each transect is labeled with a letter related to some geographical feature or location: Cape Pino P, Málaga M, Vélez V, Cape Sacratif S, Cape Gata CG, Cape Palos CP, Tarragona T, Barcelona BNA, Mallorca B, Mahón MH, Cabrera deep station EPC and two triangles in the Balearic channels C. Each station is labeled with its corresponding letter and a number increasing seaward. Stations in the Balearic channels are labeled from C1 to C37. Black triangle is l Estartit oceanographic station operated by the Institut de Ciències del Mar in Barcelona. Four rectangles are included in figure 1. Each rectangle is one area where temperature and salinity data have been obtained from the MEDAR/MEDATLAS data base. The four rectangles or geographical areas considered are: Alborán, Cape Palos, Balearic Sea and Northern sector
39 Figure 2. Mean values for temperature and salinity in P3 station. Upper left corner shows the P3 position. The upper right figures are the average vertical temperature and salinity profiles. Blue lines are for winter, green for spring, red for summer and yellow for autumn. A zoom for the upper 200m of the water column is included. The lower left figure shows the θs diagram for the P3 station. Grey dots correspond to all the available CTD casts from this oceanographic station. Mean θs values for winter are included in blue, green for spring, red for summer and yellow for autumn. The lower right figure is a zoom for the deepest waters in order to enhance the properties of WIW, LIW and WMDW Figure 3. The same as in figure 2, but for the oceanographic station CG4 in Cape Gata transect Figure 4. The same as in figure 2, but for the oceanographic station CP4 in Cape Palos transect Figure 5. The same as in figure 2, but for the oceanographic station C33 in the Ibiza Channel Figure 6. The same as in figure 2, but for the oceanographic station T4 in Tarragona transect Figure 7. The same as in figure 2, but for the oceanographic station BNA4 in Barcelona transect Figure 8. The same as in figure 2, but for the oceanographic station MH4 in Mahón transect. 38
40 Figure 9. The same as in figure 2, but for the oceanographic station EPC to the south of Cabrera Island Figure 10. A) Sea surface temperature and salinity mean values from the RADMED summer cruises in some selected stations. B) The same for winter Figure 11 A) WIW values detected in the RADMED averaged profiles. WIW values are considered as θ < 13 ºC 37.7 S It is included the depth and the season when the WIW is present in the mean profiles. B) Potential temperature and salinity for the salinity maximum associated to LIW in winter mean profiles Figure 12. Linear trends for potential temperature (left), salinity (centre) and potential density (right) as a function of depth. Linear trends are calculated from the RADMED time series. A) for P3 station and B) for CG5 station Figure 13. The same as in figure 12, but for CP4 station (A) and MH4 station (B) Figure 14. Temperature times series at 0, 20, 50 and 80 m depth from l Estartit station. Linear trends and 95% confidence intervals are included Figure 15. Heat absorbed by the upper layer (0-200m), Intermediate layer ( m), deep layer (600m-bottom) and water column (surface-bottom). The heat absorbed is calculated with respect to the climatological temperature profile averaged for the period Heat content data are averaged for the four regions analyzed (Alboran Sea, Cape Palos, Balearic Sea and northern sector)


41 Figure 16. Salinity time series for the upper, intermediate and deep layer and the water column. Salinity data are averaged for the four regions analyzed (Alboran Sea, Cape Palos, Balearic Sea and northern sector) Figure 1. 40

42 Figure 2 41

43 Figure 3 42

44 Figure 4 43
45 Figure 5 44

46 Figure 6 45

47 Figure 7 46

48 Figure

49 Figure

50 Figure

51 Figure
Temperature, Salinity, Dissolved Oxygen and Water Masses of Vietnamese Waters
 Southeast Asian Fisheries Development Center Temperature, Salinity, Dissolved Oxygen and Water Masses of Vietnamese Waters Penjan Rojana-anawat, Siriporn Pradit, Natinee Sukramongkol and Somboon Siriraksophon
Currents measurements in the coast of Montevideo, Uruguay
 Currents measurements in the coast of Montevideo, Uruguay M. Fossati, D. Bellón, E. Lorenzo & I. Piedra-Cueva Fluid Mechanics and Environmental Engineering Institute (IMFIA), School of Engineering, Research
SIO 210 Introduction to Physical Oceanography Mid-term examination November 4, 2013; 50 minutes
 SIO 210 Introduction to Physical Oceanography Mid-term examination November 4, 2013; 50 minutes Closed book; one sheet of your own notes is allowed. A calculator is allowed. (100 total points.) Possibly
THE CIRCULATION IN THE NORTERN PART OF THE DENMARK STRAIT AND ITS VARIABILITY ABSTRACT
 ICES em 19991L:06 THE CIRCULATION IN THE NORTERN PART OF THE DENMARK STRAIT AND ITS VARIABILITY Steingrimur J6nsson Marine Research Institute and University of Akureyri, Glenirgata 36, 600 Akureyri, Iceland,
Plate 3. CZCS-derived chl Climatological Monthly Means
 Plate 3. CZCS-derived chl Climatological Monthly Means 15 16 2. Interannual variability The assessment of interannual variability in the 1998-2003 SeaWiFSderived data set was carried out by generating
Data Analysis of the Seasonal Variation of the Java Upwelling System and Its Representation in CMIP5 Models
 Data Analysis of the Seasonal Variation of the Java Upwelling System and Its Representation in CMIP5 Models Iulia-Mădălina Ștreangă University of Edinburgh University of Tokyo Research Internship Program
Geostrophic and Tidal Currents in the South China Sea, Area III: West Philippines
 Southeast Asian Fisheries Development Center Geostrophic and Tidal Currents in the South China Sea, Area III: West Philippines Anond Snidvongs Department od Marine Science, Chulalongkorn University, Bangkok
6.28 PREDICTION OF FOG EPISODES AT THE AIRPORT OF MADRID- BARAJAS USING DIFFERENT MODELING APPROACHES
 6.28 PREDICTION OF FOG EPISODES AT THE AIRPORT OF MADRID- BARAJAS USING DIFFERENT MODELING APPROACHES Cecilia Soriano 1, Darío Cano 2, Enric Terradellas 3 and Bill Physick 4 1 Universitat Politècnica de
Climate Change Impacts on Sea Surface Temperature in the Eastern Mediterranean, Levantine Basin
 Climate Change Impacts on Sea Surface Temperature in the Eastern Mediterranean, Levantine Basin Yianna Samuel-Rhoads *, George Zodiatis, Daniel Hayes, Gregory Konnaris, Georgios Georgiou, Marios Nikolaides
10% water in the world is tied up in the surface ocean currents. (above the pycnocline) Primary source is wind: Westerlies, Trades, Polar Easterlies
 Primary source is wind: Westerlies, Trades, Polar Easterlies") Oceanography Chapter 9 10% water in the world is tied up in the surface ocean currents. (above the pycnocline) Primary source is wind: Westerlies, Trades, Polar Easterlies Coriolis deflects winds (and
Oceanography Chapter 9 10% water in the world is tied up in the surface ocean currents. (above the pycnocline) Primary source is wind: Westerlies, Trades, Polar Easterlies Coriolis deflects winds (and
Temperature, salinity, density, and the oceanic pressure field
 Chapter 2 Temperature, salinity, density, and the oceanic pressure field The ratios of the many components which make up the salt in the ocean are remarkably constant, and salinity, the total salt content
Lesson: Ocean Circulation
 Lesson: Ocean Circulation By Keith Meldahl Corresponding to Chapter 9: Ocean Circulation As this figure shows, there is a connection between the prevailing easterly and westerly winds (discussed in Chapter
Introduction to Oceanography OCE 1001
 Introduction to Oceanography OCE 1001 Lecture Notes Chantale Bégin & Jessica Fry Version 2.1 10. Ocean Circulation (Trujillo, Chapter 7) Major ocean currents are stable and predictable; they have been
The Ocean is a Geophysical Fluid Like the Atmosphere. The Physical Ocean. Yet Not Like the Atmosphere. ATS 760 Global Carbon Cycle The Physical Ocean
 The Physical Ocean The Ocean is a Geophysical Fluid Like the Atmosphere Three real forces: Gravity Pressure gradients Friction Two apparent forces: Coriolis and Centrifugal Geostrophic & Hydrostatic balances
EARTH, PLANETARY, & SPACE SCIENCES 15 INTRODUCTION TO OCEANOGRAPHY. LABORATORY SESSION #6 Fall Ocean Circulation
 EARTH, PLANETARY, & SPACE SCIENCES 15 INTRODUCTION TO OCEANOGRAPHY LABORATORY SESSION #6 Fall 2017 Ocean Circulation The focus of the Lab this week is circulation of the ocean and atmosphere. Here, you
CHAPTER 7 Ocean Circulation
 1 2 3 4 5 6 7 8 9 10 11 12 13 14 CHAPTER 7 Ocean Circulation Words Ocean currents Moving seawater Surface ocean currents Transfer heat from warmer to cooler areas Similar to pattern of major wind belts
Eddy transport of Western Mediterranean Intermediate Water to the Alboran Sea
 Click Here for Full Article JOURNAL OF GEOPHYSICAL RESEARCH, VOL. 113,, doi:10.1029/2007jc004649, 2008 Eddy transport of Western Mediterranean Intermediate Water to the Alboran Sea J. T. Allen, 1 S. C.
The Coriolis force, geostrophy, Rossby waves and the westward intensification
 Chapter 3 The Coriolis force, geostrophy, Rossby waves and the westward intensification The oceanic circulation is the result of a certain balance of forces. Geophysical Fluid Dynamics shows that a very
Impact of the tides, wind and shelf circulation on the Gironde river plume dynamics
 Impact of the tides, wind and shelf circulation on the Gironde river plume dynamics F. Toublanc 1, N. Ayoub 2, P. Marsaleix 3, P. De Mey 2 1 CNES/LEGOS 2 CNRS/LEGOS 3 CNRS/LA, Toulouse, France 5th GODAE
ATS150: Global Climate Change. Oceans and Climate. Icebergs. Scott Denning CSU 1
 The Oceans Wind-Driven Gyre Circulations Icebergs Scott Denning CSU 1 Surface Balance of Forces friction coriolis wind stress resultant current Wind stress accelerates surface water Friction couples surface
Effects of very harsh 2012 winter conditions on the deep layer of the Southern Adriatic Sea
 Effects of very harsh 2012 winter conditions on the deep layer of the Southern Adriatic Sea Bensi M.*1, Cardin V.1, Rubino A.2, Notarstefano G.1, Poulain P.M.1 1 Istituto Nazionale di Oceanografia e di
SIO 210 MIDTERM, 26 October 2009.
 SIO 210 MIDTERM, 26 October 2009. Please mark your answers on the attached answer sheet, and turn in ONLY THE ANSWER SHEET. Donʼt forget to put your name on the answer sheet!! Here are some constants,
Submitted to Scientia Marina on September 29,
 1 1 1 1 1 1 1 1 0 1 0 1 0 1 Submitted to Scientia Marina on September, 0 ------- The LIW characteristics: an astounding general misunderstanding! Claude Millot Laboratoire d'océanographie Physique Biogéochimique
Chapter 10 Lecture Outline. The Restless Oceans
 Chapter 10 Lecture Outline The Restless Oceans Focus Question 10.1 How does the Coriolis effect influence ocean currents? The Ocean s Surface Circulation Ocean currents Masses of water that flow from one
TEMPERATURE BEHAVIOR during WINTER in ANTARCTICA
 TEMPERATURE BEHAVIOR during WINTER in ANTARCTICA The temperature behaviour during winter in Antarctica was investigated. Special attention was devoted to anomalous strong warmings, ranging between 20 and
CHANGE OF THE BRIGHTNESS TEMPERATURE IN THE MICROWAVE REGION DUE TO THE RELATIVE WIND DIRECTION
 JP4.12 CHANGE OF THE BRIGHTNESS TEMPERATURE IN THE MICROWAVE REGION DUE TO THE RELATIVE WIND DIRECTION Masanori Konda* Department of Geophysics, Graduate School of Science, Kyoto University, Japan Akira
ESS15 Lecture 12. Review, tropical oceans & El Nino, and the thermohaline ocean circulation. Please see new reading material on website.
 ESS15 Lecture 12 Review, tropical oceans & El Nino, and the thermohaline ocean circulation. Please see new reading material on website. Review. I-clicker exercise: In this graph of Earth s energy imbalances
MODELING INDIAN OCEAN CIRCULATION: BAY OF BENGAL FRESH PLUME AND ARABIAN SEA MINI WARM POOL
 MODELING INDIAN OCEAN CIRCULATION: BAY OF BENGAL FRESH PLUME AND ARABIAN SEA MINI WARM POOL P. N. Vinayachandran* 1 1, *2 and J. Kurian* * 1 Centre for Atmospheric and Oceanic Sciences, Indian Institute
Lecture 13 El Niño/La Niña Ocean-Atmosphere Interaction. Idealized 3-Cell Model of Wind Patterns on a Rotating Earth. Previous Lecture!
 Lecture 13 El Niño/La Niña Ocean-Atmosphere Interaction Previous Lecture! Global Winds General Circulation of winds at the surface and aloft Polar Jet Stream Subtropical Jet Stream Monsoons 1 2 Radiation
Monitoring Cruise Report
 r/v Gunnar Thorson Monitoring Cruise Report Cruise no.: 214 Time: 1-19 February 23 Area: The Sound, the Kattegat, the Skagerrak, the North Sea, the Belt Sea and the Arkona Sea Ministry of the Environment
Appendix E Mangaone Stream at Ratanui Hydrological Gauging Station Influence of IPO on Stream Flow
 NZ Transport Agency Peka Peka to North Ōtaki Expressway Hydraulic Investigations for Expressway Crossing of Mangaone Stream and Floodplain Appendix E Mangaone Stream at Ratanui Hydrological Gauging Station
Assessment Schedule 2016 Earth and Space Science: Demonstrate understanding of processes in the ocean system (91413)
") NCEA Level 3 Earth & Space Science (91413) 2016 page 1 of 6 Assessment Schedule 2016 Earth and Space Science: Demonstrate processes in the ocean system (91413) Evidence Statement Q Evidence with with Excellence
NCEA Level 3 Earth & Space Science (91413) 2016 page 1 of 6 Assessment Schedule 2016 Earth and Space Science: Demonstrate processes in the ocean system (91413) Evidence Statement Q Evidence with with Excellence
High Water Vapor and Associated Signatures from MLS in the Monsoon Lower Stratosphere: Implications for Posited Ozone Destruction
 Jet Propulsion Laboratory California Ins5tute of Technology High Water Vapor and Associated Signatures from MLS in the Monsoon Lower Stratosphere: Implications for Posited Ozone Destruction Michael J.
Lecture 24. El Nino Southern Oscillation (ENSO) Part 1
 Part 1") Lecture 24 El Nino Southern Oscillation (ENSO) Part 1 The most dominant phenomenon in the interannual variation of the tropical oceanatmosphere system is the El Nino Southern Oscillation (ENSO) over the
Lecture 24 El Nino Southern Oscillation (ENSO) Part 1 The most dominant phenomenon in the interannual variation of the tropical oceanatmosphere system is the El Nino Southern Oscillation (ENSO) over the
Distribution and abundance of bullet tuna larvae (Auxis rochei) off the Balearic Sea during the spawning seasons
 off the Balearic Sea during the spawning seasons") Distribution and abundance of bullet tuna larvae (Auxis rochei) off the Balearic Sea during the 2003-2005 spawning seasons García, A., F. Alemany, J.M. Rodríguez, D. Cortes, F. Corregidor, E. Ceballos,
Distribution and abundance of bullet tuna larvae (Auxis rochei) off the Balearic Sea during the 2003-2005 spawning seasons García, A., F. Alemany, J.M. Rodríguez, D. Cortes, F. Corregidor, E. Ceballos,
Winds and Ocean Circulations
 Winds and Ocean Circulations AT 351 Lab 5 February 20, 2008 Sea Surface Temperatures 1 Temperature Structure of the Ocean Ocean Currents 2 What causes ocean circulation? The direction of most ocean currents
Surface Circulation in the Northeastern Mediterranean (NEMED)
") DISTRIBUTION STATEMENT A. Approved for public release; distribution is unlimited. Surface Circulation in the Northeastern Mediterranean (NEMED) Pierre-Marie Poulain Istituto Nazionale di Oceanografia e
DISTRIBUTION STATEMENT A. Approved for public release; distribution is unlimited. Surface Circulation in the Northeastern Mediterranean (NEMED) Pierre-Marie Poulain Istituto Nazionale di Oceanografia e
SIO 210 Final examination Wednesday, December 11, PM Sumner auditorium Name:
 SIO 210 Final examination Wednesday, December 11, 2013 2-5 PM Sumner auditorium Name: Turn off all phones, ipods, etc. and put them away. This is a closed book exam. You may use one page of notes, both
Variability in the tropical oceans - Monitoring and prediction of El Niño and La Niña -
 Variability in the tropical oceans - Monitoring and prediction of El Niño and La Niña - Jun ichi HIROSAWA Climate Prediction Division Japan Meteorological Agency SST anomaly in Nov. 1997 1 ( ) Outline
Changes of The Hadley Circulation Since 1950
 Changes of The Hadley Circulation Since 1950 Xiao-Wei Quan, Henry F. Diaz, Martin P. Hoerling (NOAA-CIRES CDC, 325 Broadway, Boulder, CO 80305) Abstract The Hadley circulation is changing in response to
LONG- TERM CHANGE IN PRE- MONSOON THERMAL INDEX OVER CENTRAL INDIAN REGION AND SOUTH WEST MONSOON VARIABILITY
 LONG- TERM CHANGE IN PRE- MONSOON THERMAL INDEX OVER CENTRAL INDIAN REGION AND SOUTH WEST MONSOON VARIABILITY *S.S. Dugam Indian Institute of Tropical Meteorology, Pune-411008 *Author for Correspondence
Directed Reading. Section: Ocean Currents. a(n). FACTORS THAT AFFECT SURFACE CURRENTS
. FACTORS THAT AFFECT SURFACE CURRENTS") Skills Worksheet Directed Reading Section: Ocean Currents 1. A horizontal movement of water in a well-defined pattern is called a(n). 2. What are two ways that oceanographers identify ocean currents? 3.
Skills Worksheet Directed Reading Section: Ocean Currents 1. A horizontal movement of water in a well-defined pattern is called a(n). 2. What are two ways that oceanographers identify ocean currents? 3.
El Niño Lecture Notes
 El Niño Lecture Notes There is a huge link between the atmosphere & ocean. The oceans influence the atmosphere to affect climate, but the atmosphere also influences the ocean, which can also affect climate.
Water circulation in Dabob Bay, Washington: Focus on the exchange flows during the diurnal tide transitions
 Water circulation in Dabob Bay, Washington: Focus on the exchange flows during the diurnal tide transitions Jeong-in Kang School of Oceanography University of Washington (206) 349-7319 nortiumz@u.washington.edu
CORIOLIS, A FRENCH PROJECT FOR IN SITU OPERATIONAL OCEANOGRAPHY. S. Pouliquen, A. Billant, Y. Desaubies, G. Loaec, F. Gaillard, G.
 CORIOLIS, A FRENCH PROJECT FOR IN SITU OPERATIONAL OCEANOGRAPHY S. Pouliquen, A. Billant, Y. Desaubies, G. Loaec, F. Gaillard, G. Maudire IFREMER, BP70, 29280 Plouzané, France Sylvie.Pouliquen@ifremer.fr
OCN 201, Chemistry & Physics Section
 , A 1-April-2015 Name: Answer the True/False and Multiple Choice questions on the scantron sheet. Answer the remaining questions on this exam handout. Turn in both the scantron and exam at the end of class.
CHLOROPHYLL A AND NUTRIENTS FLUXES AND TRANSPORTS IN THE SOUTH PORTUGUESE COAST
 CHLOROPHYLL A AND NUTRIENTS FLUXES AND TRANSPORTS IN THE SOUTH PORTUGUESE COAST Sara Cardeira, Alexandra Cravo and Paulo Relvas CIMA, FCT, University of Algarve, Campus de Gambelas, 85-139 Faro, PORTUGAL
(20 points) 1. ENSO is a coupled climate phenomenon in the tropical Pacific that has both regional and global impacts.
 1. ENSO is a coupled climate phenomenon in the tropical Pacific that has both regional and global impacts.") SIO 210 Problem Set 4 Answer key December 1, 2014 Due Dec. 12, 2014 (20 points) 1. ENSO is a coupled climate phenomenon in the tropical Pacific that has both regional and global impacts. (2 points) a)
SIO 210 Problem Set 4 Answer key December 1, 2014 Due Dec. 12, 2014 (20 points) 1. ENSO is a coupled climate phenomenon in the tropical Pacific that has both regional and global impacts. (2 points) a)
Impact of fine-scale wind stress curl structures on coastal upwelling dynamics : The Benguela system as a case of study.
 IOVWST Meeting May 21, 2015, Portland (OR) Impact of fine-scale wind stress curl structures on coastal upwelling dynamics : The Benguela system as a case of study. Fabien Desbiolles1,2, Bruno Blanke1,
ENSO Cycle: Recent Evolution, Current Status and Predictions. Update prepared by Climate Prediction Center / NCEP 8 March 2010
 ENSO Cycle: Recent Evolution, Current Status and Predictions Update prepared by Climate Prediction Center / NCEP 8 March 2010 Outline Overview Recent Evolution and Current Conditions Oceanic Niño Index
The drift of Modified Atlantic Water from the Alboran Sea to the eastern Mediterranean*
 SCI. MAR., 62 (3): 211-216 SCIENTIA MARINA 1998 The drift of Modified Atlantic Water from the Alboran Sea to the eastern Mediterranean* J. FONT 1, C. MILLOT 2, J. SALAS 1, A. JULIÀ 1 and O. CHIC 1 1 Institut
RECTIFICATION OF THE MADDEN-JULIAN OSCILLATION INTO THE ENSO CYCLE
 RECTIFICATION OF THE MADDEN-JULIAN OSCILLATION INTO THE ENSO CYCLE By William S. Kessler and Richard Kleeman Journal of Climate Vol.13, 1999 SWAP, May 2009, Split, Croatia Maristella Berta What does give
Ocean Currents that Redistribute Heat Globally
 Ocean Currents that Redistribute Heat Globally Ocean Circulation Ocean Currents Fig. CO7 OCEAN CURRENTS Surface ocean currents are similar to wind patterns: 1. Driven by Coriolis forces 2. Driven by winds
Lecture Outlines PowerPoint. Chapter 15 Earth Science, 12e Tarbuck/Lutgens
 Lecture Outlines PowerPoint Chapter 15 Earth Science, 12e Tarbuck/Lutgens 2009 Pearson Prentice Hall This work is protected by United States copyright laws and is provided solely for the use of instructors
The Child. Mean Annual SST Cycle 11/19/12
 Introduction to Climatology GEOGRAPHY 300 El Niño-Southern Oscillation Tom Giambelluca University of Hawai i at Mānoa and Pacific Decadal Oscillation ENSO: El Niño-Southern Oscillation PDO: Pacific Decadal
Monday, October 2, Watch for new assessment (Week 4/5 review) TA s have your tests, please see key (at course website)
 TA s have your tests, please see key (at course website)") Monday, October 2, 2017 Watch for new assessment (Week 4/5 review) TA s have your tests, please see key (at course website) Homework 3 Due date Wednesday, Oct 11 (8 pm) Be ready to watch another important
Monday, October 2, 2017 Watch for new assessment (Week 4/5 review) TA s have your tests, please see key (at course website) Homework 3 Due date Wednesday, Oct 11 (8 pm) Be ready to watch another important
Vertical structure and temporal evolution of an anticyclonic eddy in the Balearic Sea (western Mediterranean)
") JOURNAL OF GEOPHYSICAL RESEARCH: OCEANS, VOL. 118, 2097 2106, doi:10.1002/jgrc.20150, 2013 Vertical structure and temporal evolution of an anticyclonic eddy in the Balearic Sea (western Mediterranean)
JOURNAL OF GEOPHYSICAL RESEARCH: OCEANS, VOL. 118, 2097 2106, doi:10.1002/jgrc.20150, 2013 Vertical structure and temporal evolution of an anticyclonic eddy in the Balearic Sea (western Mediterranean)
Monitoring Cruise Report
 r/v Gunnar Thorson Monitoring Cruise Report Cruise no.: 228 Time: 7-18 February 25 Area: The Sound, the Kattegat, the Skagerrak, the North Sea, the Belt Sea and the Arkona Sea Ministry of the Environment
Chapter 8 Air Masses
 Chapter 8 Air Masses Air Masses - 1 1. An Air Mass is a large body of air usually about 1500 km across and several km thick, that has homogeneous physical properties. 2. The important physical properties
OCN 201 Surface Circulation
 OCN 201 Surface Circulation Excess heat in equatorial regions requires redistribution toward the poles 1 In the Northern hemisphere, Coriolis force deflects movement to the right In the Southern hemisphere,
The Surface Currents OCEA 101
 The Surface Currents OCEA 101 Why should you care? - the surface ocean circulation controls the major ocean biomes - variations in ocean circulation control the supply of nutrients for marine organisms
Atmospheric Rossby Waves in Fall 2011: Analysis of Zonal Wind Speed and 500hPa Heights in the Northern and Southern Hemispheres
 Atmospheric Rossby Waves in Fall 211: Analysis of Zonal Wind Speed and 5hPa Heights in the Northern and Southern s Samuel Cook, Craig Eckstein, and Samantha Santeiu Department of Atmospheric and Geological
3 The monsoon currents in an OGCM
 3 The monsoon currents in an OGCM The observations show that both Ekman drift and geostrophy contribute to the surface circulation in the north Indian Ocean. The former decays rapidly with depth, but the
Chapter 22, Section 1 - Ocean Currents. Section Objectives
 Chapter 22, Section 1 - Ocean Currents Section Objectives Intro Surface Currents Factors Affecting Ocean Currents Global Wind Belts (you should draw and label a diagram of the global wind belts) The Coriolis
Upstream environment for SBI - Modeled and observed biophysical conditions in the northern Bering Sea
 Upstream environment for SBI - Modeled and observed biophysical conditions in the northern Bering Sea Jaclyn Clement 1, Wieslaw Maslowski 1, Lee Cooper 2, Jacqueline Grebmeier 2, Waldemar Walczowski 3,
7.4 Temperature, Salinity and Currents in Jamaica Bay
 7.4 Temperature, Salinity and Currents in Jamaica Bay Arnold Gordon, Bruce Huber and Robert Houghton 7.4.1 INTRODUCTION Jamaica Bay stratification is weakly indicative of a shallow, tidally active environment,
OCEANOGRAPHY STUDY GUIDE
 OCEANOGRAPHY STUDY GUIDE Chapter 2 Section 1 1. Most abundant salt in ocean. Sodium chloride; NaCl 2. Amount of Earth covered by Water 71% 3. Four oceans: What are they? Atlantic, Pacific, Arctic, Indian
General Oceanography Geology 105 Expedition #19 The Ocean and Climate
 General Oceanography Geology 105 Expedition #19 The Ocean and Climate Name Not attempting to answer questions on expeditions will result in point deductions on course workbook (two or more blank answers
This article appeared in a journal published by Elsevier. The attached copy is furnished to the author for internal non-commercial research and
 This article appeared in a journal published by Elsevier. The attached copy is furnished to the author for internal non-commercial research and education use, including for instruction at the authors institution
OCN201 Spring14 1. Name: Class: Date: True/False Indicate whether the statement is true or false.
 Name: Class: _ Date: _ OCN201 Spring14 1 True/False Indicate whether the statement is true or false. 1. Short residence time elements are uniformly distributed in the oceans 2. Thermohaline circulation
Wednesday, September 27, 2017 Test Monday, about half-way through grading. No D2L Assessment this week, watch for one next week
 Wednesday, September 27, 2017 Test Monday, about half-way through grading No D2L Assessment this week, watch for one next week Homework 3 Climate Variability (due Monday, October 9) Quick comment on Coriolis
What s UP in the. Pacific Ocean? Learning Objectives
 What s UP in the Learning Objectives Pacific Ocean? In this module, you will follow a bluefin tuna on a spectacular migratory journey up and down the West Coast of North America and back and forth across
Fine-Scale Survey of Right and Humpback Whale Prey Abundance and Distribution
 DISTRIBUTION STATEMENT A. Approved for public release; distribution is unlimited. Fine-Scale Survey of Right and Humpback Whale Prey Abundance and Distribution Joseph D. Warren School of Marine and Atmospheric
Lecture 5.1 Surface Ocean Circulation. Image from Daily Mail Newspaper, UK
 Lecture 5.1 Surface Ocean Circulation Image from Daily Mail Newspaper, UK Announcements Midterm is Thursday, consists of 25 multiple choice, 3 pages short answer questions No Scantron needed Calculators,
JIMAR PFRP ANNUAL REPORT FOR FY 2006
 JIMAR PFRP ANNUAL REPORT FOR FY 2006 P.I./Sponsor Name: Michael P. Seki and Jeffrey J. Polovina Project Proposal Title: Oceanographic Characterization of the American Samoa Longline Fishing Grounds for
Variability of surface transport in the Northern Adriatic Sea from Finite-Size Lyapunov Exponents" Maristella Berta
 Variability of surface transport in the Northern Adriatic Sea from Finite-Size Lyapunov Exponents" Maristella Berta Marseille, 29 November 2011 Outline Geographical setting (winds and circulation of Adriatic
Currents. History. Pressure Cells 3/13/17. El Nino Southern Oscillation ENSO. Teleconnections and Oscillations. Neutral Conditions
 Teleconnections and Oscillations Teleconnection climate anomalies being related to each other over a large scale Oscillations: Macroscale movement of atmospheric systems that can influence weather, climate,
Ocean Circulation. Si Hui Lee and Frances Wen. You can access ME at
 Ocean Circulation Si Hui Lee and Frances Wen You can access ME at http://tinyurl.com/oceancirculation Earth - the blue planet - 71% area covered by the oceans - 3/4 of ocean area between 3000-6000m deep
PROC. ITB Eng. Science Vol. 36 B, No. 2, 2004,
 PROC. ITB Eng. Science Vol. 36 B, No. 2, 2004, 133-139 133 Semiannual Kelvin Waves Propagation along the South Coast of Sumatra-Jawa-Bali and the Lesser Sunda Islands Observed by TOPEX/POSEIDON and ERS-1/2
THE RESPONSE OF THE GULF OF MAINE COASTAL CURRENT SYSTEM TO LATE-SPRING
 THE RESPONSE OF THE GULF OF MAINE COASTAL CURRENT SYSTEM TO LATE-SPRING NORTHEASTERLY WIND FORCING Neal R Pettigrew and Huijie Xue School of Marine Sciences University of Maine, Orono ME 04469 The Gulf
Zooplankton community changes on the Canadian northwest Atlantic continental shelves during recent warm years
 Zooplankton community changes on the Canadian northwest Atlantic continental shelves during recent warm years Catherine L. Johnson 1, Stéphane Plourde 2, Pierre Pepin 3, Emmanuel Devred 1, David Brickman
The Setting - Climatology of the Hawaiian Archipelago. Link to Video of Maui Waves
 The Setting - Climatology of the Hawaiian Archipelago Link to Video of Maui Waves What caused this week s weather? What caused this weekend s weather? Today s Objective: Provide overview and description
HYDROSPHERE, OCEANS AND TIDES
 HYDROSPHERE, OCEANS AND TIDES Revision 10x10learning.com 1 Chapter 12. In the Earth s Atmosphere On surface of the Earth Under the ground Hydrosphere comprises of ALL WATER Water Vapour = 0.001% Is very
Subsurface Ocean Indices for Central-Pacific and Eastern-Pacific Types of ENSO
 Subsurface Ocean Indices for Central-Pacific and Eastern-Pacific Types of ENSO Jin-Yi Yu 1*, Hsun-Ying Kao 1, and Tong Lee 2 1. Department of Earth System Science, University of California, Irvine, Irvine,
Chapter. Air Pressure and Wind
 Chapter Air Pressure and Wind 19.1 Understanding Air Pressure Air Pressure Defined Air pressure is the pressure exerted by the weight of air. 19.1 Understanding Air Pressure Air Pressure Defined Air pressure
ON THE CYPRUS EDDY KINEMATICS
 ON THE CYPRUS EDDY KINEMATICS Arthur Prigent 1,2 and Pierre-Marie Poulain 1 1 Istituto Nazionale di Oceanografia e di Geofisica Sperimentale (OGS), Trieste, Italy 2 Ecole Nationale Supérieure de Techniques
Wind Driven Circulation Indian Ocean and Southern Ocean
 Wind Driven Circulation Indian Ocean and Southern Ocean Lecture 18 MAR 350 Spring 2017 Reading: Knauss Chapter 7 ECCO2 model animation ecco2_sst_flow (2).mp4 Mean surface height and currents DPO Fig. 11.1
2016 ANNUAL FISH TRAWL SURVEY REPORT
 216 ANNUAL FISH TRAWL SURVEY REPORT The University of Rhode Island Graduate School of Oceanography The Graduate School of Oceanography (GSO) Fish trawl survey began weekly sampling two stations in Narragansett
1 INTRODUCTION. Figure 2: Synoptical situation at the beginning of the simulation: 5th January 1999 at 12UTC.
 2.2 NOCTURNAL CIRCULATIONS UNDER WEAK PRESSURE GRADIENTS IN THE ISLAND OF MALLORCA J. Cuxart and M.A. Jiménez Universitat de les Illes Balears, Spain 1 INTRODUCTION To study the local nocturnal circulations
W3 Global Circulation Systems
 W3 Global Circulation Systems Which regions of Earth receive the most energy from the Sun? If not for global circulation systems There would only be two narrow regions that would support life What
Atmospheric and Ocean Circulation Lab
 Atmospheric and Ocean Circulation Lab name Key Objectives: The main goal of this lab is to learn about atmospheric and oceanic circulation and how these two processes are strongly inter-dependent and strongly
Multiscale variability in the Balearic Sea: An altimetric perspective
 JOURNAL OF GEOPHYSICAL RESEARCH: OCEANS, VOL. 118, 3007 3025, doi:10.1002/jgrc.20234, 2013 Multiscale variability in the Balearic Sea: An altimetric perspective Evan Mason 1 and Ananda Pascual 1 Received
Sailing the Seas: Wind Driven Ocean Circulation Ocean Gyres
 Sailing the Seas: Wind Driven Ocean Circulation Ocean Gyres Ocean Currents What Happens at the Coast? Readings: Ch 9: 9.2-9.6, 9.8-9.13 Graphic: America's Cup sailboat race off Newport, Rhode Island. J.
Chapter 9: Circulation of the Ocean
 Chapter 9: Circulation of the Ocean Tropical gardens on Britain s Scilly Isles. Only 48 kilometers (30 miles) off the coast of Cornwall at 50 N, these scenic islands lie in the path of the warm waters
APPENDIX B NOAA DROUGHT ANALYSIS 29 OCTOBER 2007
 APPENDIX B NOAA DROUGHT ANALYSIS 29 OCTOBER 2007 ENSO Cycle: Recent Evolution, Current Status and Predictions Update prepared by Climate Prediction Center / NCEP October 29, 2007 Outline Overview Recent
Sea and Land Breezes METR 4433, Mesoscale Meteorology Spring 2006 (some of the material in this section came from ZMAG)
") Sea and Land Breezes METR 4433, Mesoscale Meteorology Spring 2006 (some of the material in this section came from ZMAG) 1 Definitions: The sea breeze is a local, thermally direct circulation arising from
Sea and Land Breezes METR 4433, Mesoscale Meteorology Spring 2006 (some of the material in this section came from ZMAG) 1 Definitions: The sea breeze is a local, thermally direct circulation arising from
Argo National Data Management Report Italy (2016)
") Argo National Data Management Report Italy (2016) 1. Status Data acquired from floats: 335 floats were deployed in the Mediterranean and in Black Seas between 2001 and 2016 (the floats temporal distribution
Argo National Data Management Report Italy (2016) 1. Status Data acquired from floats: 335 floats were deployed in the Mediterranean and in Black Seas between 2001 and 2016 (the floats temporal distribution
Thermohaline Front at the Mouth of Ise Bay
 Journal of Oceanography, Vol. 53, pp. 403 to 409. 1997 Short Contribution Thermohaline Front at the Mouth of Ise Bay TETSUO YANAGI 1, XINYU GUO 1, TOSHIRO SAINO 2, TAKASHI ISHIMARU 3 and SINICHIRO NORIKI
Air Pressure and Wind
 Air Pressure and Wind 19.1 Understanding Air Pressure Air Pressure Defined Air pressure is the pressure exerted by the weight of air. Air pressure is exerted in all directions down, up, and sideways. The
Systematic Errors in the Hydrographic Data and Their Effect on Global Heat Content Calculations
 Systematic Errors in the Hydrographic Data and Their Effect on Global Heat Content Calculations Titelmasterformat durch Klicken bearbeiten Viktor Gouretski KlimaCampus, University of Hamburg Frascati,