Bankable Wind Resource Assessment
|
|
|
- Merryl Blankenship
- 5 years ago
- Views:
Transcription


1 Bankable Wind Resource Assessment


2 Bankable Wind Resource Assessment Pramod Jain, Ph.D. Presented to: DFCC Bank and RERED Consortia Members January 25 27, 2011 Colombo, Sri Lanka
3 Agenda What is wind resource assessment? Measure wind speed: Do profits measure up? Extrapolation: Do profits extrapolate? Shape factor: Are profits shapely? Shear: Will profits get sheared? Turbulence: Are profits turbulent? Roughness & terrain: Are profits in rough terrain? Losses: How much loss of profit? Uncertainty: How uncertain are profits? Example of Bankable WRA Common reasons for rejecting B-WRA Checklist Conclusions 2/4/ Pramod Jain; Jan 26 27, 2011
4 Module Objectives Learning Objectives Understand the role of wind resource assessment (WRA) Understand the three levels of WRA Understand factors that are influence wind energy production Understand losses in energy production Understand the uncertainty associated with WRA An accurate wind resource assessment is absolutely crucial to the success of the proposed project. Unless the promoter can present a high quality wind resource assessment which satisfies lending institutions, the probability of securing debt financing is low. Kapila Subasinghe 2/4/2011 4


5 Role of WRA in Wind Project 3 months to evaluate multiple sites Prospecting 5 Criteria: Wind, env. grid, cost, rev At least 15 months. 2 to 3 yrs for large wind farms Wind Resource Assessment Locale specific: 6 to 12 months Siting: Permits, EIA, Interconnection Operations & Maintenance Construction Installation Commissioning Engineering Procurement Contracting PPA Financing Ongoing As fast as 1 turbine/mo Locale specific: 3 mos. Turbine delivery: 9 to 18 mos Locale specific: 3 mos 2/4/ Pramod Jain; Jan 26 27, 2011

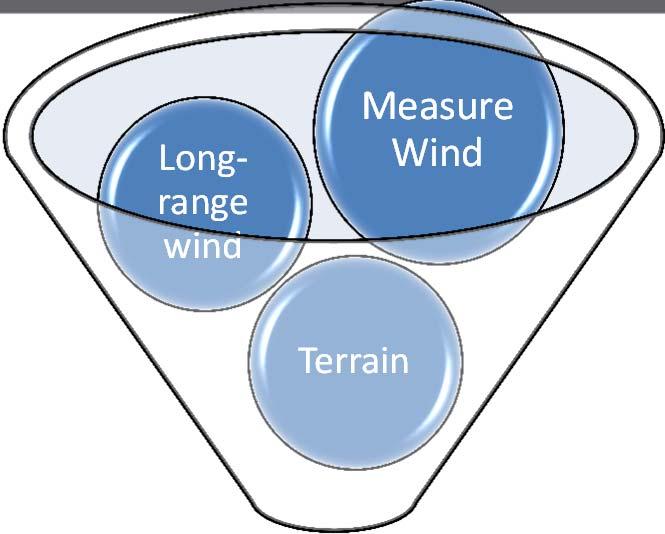


6 Components of Level 3 WRA Longrange wind Measure Wind Rev Cost Terrain Wind Statistics Turbine options P84 P50 AEP P99 2/4/2011 UC Loss P95 6 Pramod Jain; Jan 26 27, 2011

7 Process of WRA 2/4/ Source: P. Jain, Wind Energy Engineering, 2010
 is quantification of wind resources Level 1 Preliminary Publicly available wind data: Airport,")

8 What is Wind Resource Assessment? Wind Resource Assessment (WRA) is quantification of wind resources Level 1 Preliminary Publicly available wind data: Airport, NCAR, Weather stations Tools: RetScreen Energy estimate: +/ 50% Level 2 Preliminary Modeling of elevation contours & terrain WindPRO, Wind Farmer Energy Estimate: +/ 30% Level 3 Based on onsite measurement Bankable under certain conditions WindPRO, WAsP, Wind Farmer Energy Estimate: +/ 10% to 15% 2/4/ Why am I quantifying? Pramod Jain; Jan 26 27, 2011
9 Why is WRA Accuracy Important? Wind Speed Estimate Energy estimate Annual Income IRR NPV 14.0% 30.0% $ % $ % 20.0% $ % $ % 10.0% $ % $ % 0.0% $ % $ (1.68) 5.1% 10.0% $ % $ (10.77) 10.6% 20.0% $ % $ (19.87) 16.3% 30.0% $ % $ (28.96) 14% higher wind speed, which is 30% higher energy =>49% higher IRR 16% lower wind speed, which is 30% lower energy =>56% lower IRR In above example: TIC=$100; Base case annual income=$10; Discount rate=8% 2/4/2011 9
10 Level 1 WRA Wind resource is assessed from publicly available wind data or wind resource maps (from NREL) Source 1: Publicly available wind data Airports Weather stations Meteorological tower Reanalysis data (NCAR or ECMWF) Tools: RetScreen: Spreadsheet-based tools Issues Quality of wind data is poor for wind projects Quality of instruments is unknown Often only partial data is available Shear is not available Turbulence is not available Not site specific data Statistical distribution of wind speed is not available Output Average annual wind 80m= 6.91 m/s Average annual wind direction = 94.5 deg Average energy 80m=available if distribution is assumed Average annual energy production= Approximate, e.g. 4.34GWh With a 1.5MW GE XLE Hub height=80m Rotor dia=82.5m 2/4/2011 Pramod Jain; Jan 26 27, 2011


11 Level 1 WRA, Contd. Source 2: Online wind resource mapping applications or noninteractive color maps of wind resources Issues: NREL SWERA Quality of wind data & instrument is poor Not available: Shear, Turbulence, Statistical distribution Not site specific data Issues: Geographical resolution is coarse:, e.g.5km x 5Km grid Computations are based on numerical models; data used by numerical models is suspect +/ 50% Output: 2/4/2011 Source of graphics: 3Tier & NREL


12 Level 2 WRA Wind resource is assessed by creating a GIS model of site with elevation and terrain data Source of wind data is from publicly available sources Airports Weather stations Meteorological tower Reanalysis data (NCAR or ECMWF) Tools: WindPRO WAsP WindFarmer Issues Quality of wind data is poor Extrapolations are not valid: Spatial Height Temporal +/ 30% Output Average annual wind speed, direction, energy density Average AEP= 4.34GWh With a 1.5MW GE XLE, hub=80m, rotor dia.=82.5m 2/4/2011 Graphics created in WindPRO
13 Level 3 WRA Wind resource assessment is based on onsite wind measurement and GIS model of site with elevation and terrain data Source of wind data is from At least one year of onsite met-tower data at 3 heights Long-term reference data Tools: WindPRO WAsP WindFarmer Output Output Average annual wind Average AEP= 4.34GWh speed, direction, energy With a 1.5MW GE density XLE, hub=80m, rotor Wind shear based on dia.=82.5m measured wind speed Capacity factor at multiple heights Wind farm layout* Diurnal and monthly Wake losses* variation Turbulence Spatial extrapolation Temporal extrapolation +/ 15% 2/4/2011 Pramod Jain; Jan 26 27, 2011


14 Level 3 WRA: Diurnal & Monthly profile, Weibull Distribution 2/4/ Daily and monthly profile of WS, WD and TI Statistical distribution of wind speed Graphics created in WindPRO

15 Level 3 WRA: Shear Profile 2/4/ Principal energy is from SSE direction. Wind speed profile indicates shear Elevation indicates contour along SSE direction Graphics created in WindPRO


16 Level 3 WRA: Turbulence 2/4/ Turbulence Intensity Vs Wind Speed. Plot of IEC Turbine category: TI Vs WS Graphics created in WindPRO
17 Level 3 WRA: Extreme Wind Speed 50 year extreme wind speed based on 10min wind speed data is 28 m/s IEC Turbine category is determined based on extreme wind speed 2/4/ Graphics created in WindPRO
18 QUESTIONS? Questions? 2/4/


19 Measure wind speed: Do my profits measure up? Wind speed is one of the key determinants to a viable project It is expensive It takes at least one year, in most cases longer High degree of care must be exercised in planning and executing wind measurement Gold standard: Hub height measurement Location, Configuration Where? Best wind spot, worst wind spot or median How tall? As close to hub height as possible Boom length? 9 times diameter Orientation? Redundant? Instruments Individually calibrated 1 to 2% error in measurement Good record keeping Data Processing Keep the raw data as is with timestamp Document the rules of processing data Detecting faulty readings; removing bad data Auditable process 2/4/2011 Is data trustworthy?
20 Extrapolation: Will my profits be extrapolated? Three extrapolations Temporal: One to 3 year measurement. What is projected wind speed for 20 yrs life of wind project? Spatial: During wind farm one met-tower per 6 to 10 turbines. What is wind speed at proposed turbine locations? Vertical: Typical heights are 60, 40 and 30m. What is wind speed at hub height 85m to 100m? Temporal Extrapolation Comparison of measurement and long range reference, Chart of year-to-year variation Measure-Correlate-Predict (MCP) method is used. If correlation is good, then prediction is done Process is also called Hind-casting vs Forecasting 2/4/
 RWC strips out the affect of terrain, roughness and obstacles from measured data RWC is then localized by reapplying site")
21 Spatial Extrapolation For resource assessment of wind farm one met-tower per 6 to 10 turbines are used. Rough terrain requires more met-towers What is wind speed at proposed turbine locations? Spatial extrapolation is done by deriving Regional Wind Climate (RWC) RWC strips out the affect of terrain, roughness and obstacles from measured data RWC is then localized by reapplying site specific terrain, roughness and obstacles Layout of met-towers and turbines 2/4/
22 Example: Vertical Extrapolation Case 1: Wind measurement for one year yields Annual average wind speed at 30m = 6.9 m/s Average temperature 30C High winds during day time Case 2: Wind measurement for one year yields Annual average wind speed at 30m = 6.5 m/s Average temperature 18C High winds during night time If hub height is 85m, which location is preferable? Using standard shear factor of 0.15, speed at hub height is: 8 m/s in case m/s in case 2 Shear in case 1 is low due to thermal mixing/convection Shear in case 2 is high Results in item 1 are incorrect With shear of in case 1 and 0.25 in case 2, speeds are 7.86 and 8.44 m/s 2/4/2011

23 Shear: Will my profits get sheared? Wind Shear defines vertical extrapolation Measured height to hub height Energy is derived from entire swept area. E.g. 135m to 35m AGL. Large diurnal variation in shear Large seasonal variation in shear Models for computing shear are approximate Shear model predicts monotonic curve, but profile may be complex, as indicated by the red line 2/4/2011 Source: P. Jain, Wind Energy Engineering, Graphics created in WindPRO
24 Example: Wind Class/Energy Density Wind measurement for one year yields: Annual average wind speed at 50m = 7.9m/s What is the wind class in this area? What is the power density? NREL Wind class table 50 m Wind Wind Class Power density, Average wind Class Name W/m 2 speed, m/s 1 Poor Marginal Fair Good Wind Class: Class 5 wind regime Power density: ~ 580 W/m 2 Above numbers are incorrect, it assumes a Rayleigh distribution of wind speed Correct class = 4 Correct power density = 424 W/m 2 Power density is 27% lower, and therefore energy production will be 27% lower 5 Excellent Outstanding Superb 800 2, /4/ Source: P. Jain, Wind Energy Engineering, 2010
25 Shape factor: Are my profits shapely? Statistical Distribution of Wind Speed Cubic relationship to energy makes the shape of wind speed distribution important If no statistics is available k=2 is assumed K=3, yields 10% less energy K=1 yields 10% more energy Norm is to compute Weibull distribution parameters in all 12 sectors Average Wind speed, m/s Incorrect Power Density, W/m 2 Correct Power density, W/m Caribbean example Inland versus near the shore projects k=2 versus k=3; skewed distribution versus Gaussian distribution Energy production will be significantly lower Note: Highest energy production occurs at much higher wind speed compared to median or average 2/4/2011 Source: P. Jain, Wind Energy Engineering, 2010
 and the average wind speed (10-min) According to IEC turbine classification")
26 Turbulence: Are my profits turbulent? Turbulence is a measure of variation in wind speed TI is defined as ratio of standard deviation of wind speed (10-min) and the average wind speed (10-min) According to IEC turbine classification scheme, higher turbulence requires different class of machine Higher TI leads to larger forces and fatigue loads Wake causes turbulence to significantly increase RESULT Lower tower heights Smaller rotor diameters Lower energy production In wind farm with multiple rows of turbines, losses may be higher due to Wind Sector Management IEC turbine class, I ref is TI at 15 m/s 2/4/ Source: P. Jain, Wind Energy Engineering, 2010

27 Roughness & terrain: Are my profits in rough terrain? Terrain can have a large impact on wind speed and direction Roughness is used to predict shear. Models are rules of thumb for classifying different surface friction due to vegetation and habitation Most models used for WRA are linear, not accurate for rough terrain CFD based models may improve WRA 2/4/ Source of grid graphic: Meteodyn WT Workshop, G. DuPont, 2010
28 Losses: How much profits will I lose? Loss category Wake losses Plant availability Electrical losses Turbine performance Environmental Curtailment Others Loss estimate Comments 5 15% WindPRO and WindFarmer have tools to compute wake losses 2 5% Turbine related, BPO related, Grid unavailability 2 4% Transformer losses, Transmission losses, Internal power consumption 1.5 5% Power curve loss, High wind hysteresis, Wind modeling 1 3% Outside operating range, Icing, Wildlife, Lightning, Roughness change 1 3% Grid, Wind sector Earthquake: Seismic database may be used estimate frequency 2/4/ Source: P. Jain, Wind Energy Engineering, 2010


29 Uncertainty: How uncertain are my profits? Uncertainty is a key component of Bankable WRA In wind projects uncertainty is expressed in terms of: P50 P90 P95 Key: Valuation depends on P90, P95 Methods to reduce uncertainty: Higher quality measurement instruments 2 to 3 year of wind speed measurement Measurement close to hub height Layout to reduce affect of wake 2/4/2011 Source: P. Jain, Wind Energy Engineering, 2010


30 Checklist for Bankable WRA Properties of Bankable Wind Resource Assessment Wind measurements at multiple height Duration of measurement is one year or more Wind measurement is done within acceptable distance of site Proper location and configuration of met-towers Average, max, min and standard deviation of wind speed are recorded every 10 minutes Quality and calibrated wind measurement instruments Auditable wind data management Documented logic for processing wind speed data Long-term correction has been applied Losses have been quantified Uncertainty has been quantified Average Annual Energy Production is computed along with P50, P95, P99, and others 2/4/ Pramod Jain; Jan 26 27, 2011
31 Table of Contents of Bankable Wind Resource Assessment 1. Executive Summary 2. Introduction 3. Description of site 4. Description of measurement campaign i. Summary of measured quantities ii. Summary of computed quantities iii. Analysis 5. Long-term correction of wind data i. Selection of reference data and hindcasting ii. Summary of MCP results 6. Wind resource map 7. Wind turbine class selection and vendor options 8. Layout of proposed wind farm 9. Estimated annual energy production of wind farm 10. Description and estimation of losses 11. Description and analysis of uncertainties 12. Preliminary financial analysis 13. Conclusions 14. Next Steps 15. Appendix I: Charts of data 16. Appendix II: Tables of data 2/4/ Pramod Jain; Jan 26 27, 2011

32 Refer to Chapter 5 of Riso s Burgos Project Review QUESTIONS? 2/4/

33 Case Study: Island Nation Land concessions were granted by government for wind farm development Wind data was collected from 13 sites from Jan 2001 to Aug 2004 Background Data Average wind speed: 6.5 m/s Wind direction: Trade winds, single direction PPA+Incentives: $150/MWh Interconnection: No problem Environmental: Not done, but see no problem Logistics: 200m elevation; flat ridges; no major issues Total installed cost: $1,800 to $1,900/kW 7 year payback Is this a bankable wind project? Wind data is hourly Documentation of instruments, met-tower configuration are not available Duration of measurement is variable: 1.5 years, 1 year, 6 months Data is not auditable: Raw data is not available Result Low valuation Measurement has to be redone 2/4/2011 Pramod Jain; Jan 26 27, 2011
34 Conclusions Wind development requires attention to details, a lot of details If done well, it can reduce overall cost and reduce time to completion If wind resource is very good, but the WRA was not done with rigor, expect a bank to apply a very high uncertainty, which will: Reduce project s P90, P95 Reduce project s valuation Increase Bank s risk, therefore reduce your return 2/4/ Pramod Jain; Jan 26 27, 2011
The Wind Resource: Prospecting for Good Sites
 The Wind Resource: Prospecting for Good Sites Bruce Bailey, President AWS Truewind, LLC 255 Fuller Road Albany, NY 12203 bbailey@awstruewind.com Talk Topics Causes of Wind Resource Impacts on Project Viability
Wind Project Siting & Resource Assessment
 Wind Project Siting & Resource Assessment David DeLuca, Project Manager AWS Truewind, LLC 463 New Karner Road Albany, NY 12205 ddeluca@awstruewind.com www.awstruewind.com AWS Truewind - Overview Industry
Increased Project Bankability : Thailand's First Ground-Based LiDAR Wind Measurement Campaign
 Increased Project Bankability : Thailand's First Ground-Based LiDAR Wind Measurement Campaign Authors: Velmurugan. k, Durga Bhavani, Ram kumar. B, Karim Fahssis As wind turbines size continue to grow with
Wind Projects: Optimizing Site Selection
 Wind Projects: Optimizing Site Selection ECOWAS Regional Workshop on Wind Energy Babul Patel, Principal Alain Rosier, Vice President Nexant, Inc. Praia, Cape Verde November 4-5, 2013 Basic Criteria for
Site Description: LOCATION DETAILS Report Prepared By: Tower Site Report Date
 Wind Resource Summary for Holyoke Site Final Report Colorado Anemometer Loan Program Monitoring Period:: 6/21/26 /6/27 Report Date: December 2, 27 Site Description: The site is 17.4 miles south of the
Site Description: Tower Site
 Wind Resource Summary for Elizabeth Site Final Report Colorado Anemometer Loan Program Monitoring Period: 7/3/6 /15/7 Report Date: December 22, 7 Site Description: The site is.6 miles northeast of the
WindProspector TM Lockheed Martin Corporation
 WindProspector TM www.lockheedmartin.com/windprospector 2013 Lockheed Martin Corporation WindProspector Unparalleled Wind Resource Assessment Industry Challenge Wind resource assessment meteorologists
Site Summary. Wind Resource Summary. Wind Resource Assessment For King Cove Date Last Modified: 8/6/2013 By: Rich Stromberg & Holly Ganser
 Site Summary Wind Resource Assessment For King Cove Date Last Modified: 8/6/2013 By: Rich Stromberg & Holly Ganser Station ID: 2857 Latitude: 55 7 45.8 N Longitude: 162 16 10.6 W Tower Type: 30 m NRG Tall
Torrild - WindSIM Case study
 Torrild - WindSIM Case study Note: This study differs from the other case studies in format, while here another model; WindSIM is tested as alternative to the WAsP model. Therefore this case should be
Site Assessment Report. Wind farm: Ascog Farm (GB)
") Site Assessment Report Energy Yield Estimation Wind farm: (GB) 3 x E- kw with 5m hh Imprint Publisher Copyright notice ENERCON GmbH 5 Aurich Germany Phone: +9 91 97- Fax: +9 91 97-19 E-mail: info@enercon.de
Site Assessment Report Energy Yield Estimation Wind farm: (GB) 3 x E- kw with 5m hh Imprint Publisher Copyright notice ENERCON GmbH 5 Aurich Germany Phone: +9 91 97- Fax: +9 91 97-19 E-mail: info@enercon.de
Comparison of flow models
 Comparison of flow models Rémi Gandoin (remga@dongenergy.dk) March 21st, 2011 Agenda 1. Presentation of DONG Energy 2. Today's presentation 1. Introduction 2. Purpose 3. Methods 4. Results 3. Discussion
Snare Wind Monitoring Update 2016
 2016 Prepared for by Jean Paul Pinard, P. Eng., PhD. 703 Wheeler St., Whitehorse, Yukon Y1A 2P6 Tel. (867) 336 2977, jpp@northwestel.net March 31, 2016 Executive Summary This project is part of the assessment
WindPRO version Nov 2012 Project:
 23/11/2012 15:21 / 1 WAsP interface - Main Result Calculation: WAsP Interface example Name for WAsP Site coordinates UTM NAD27 Zone: 14 East: 451,101 North: 5,110,347 Air density calculation mode Result
Predicting climate conditions for turbine performance
 Predicting climate conditions for turbine performance Mark Žagar, Vinay Belathur Krishna, Alvaro Matesanz Gil Vestas Data Engineering & Analytics / Advanced Plant Modelling Resource assessment, power curve,
LES* IS MORE! * L ARGE E DDY S IMULATIONS BY VORTEX. WindEnergy Hamburg 2016
 LES* IS MORE! * L ARGE E DDY S IMULATIONS BY VORTEX WindEnergy Hamburg 2016 OUTLINE MOTIVATION Pep Moreno. CEO, BASIS Alex Montornés. Modelling Specialist, VALIDATION Mark Žagar. Modelling Specialist,
Wind Resource Assessment Østerild National Test Centre for Large Wind Turbines
 Downloaded from orbit.dtu.dk on: Jan 21, 2018 Wind Resource Assessment Østerild National Test Centre for Large Wind Turbines Hansen, Brian Ohrbeck; Courtney, Michael; Mortensen, Niels Gylling Publication
Session 2a: Wind power spatial planning techniques. IRENA Global Atlas Spatial planning techniques 2-day seminar
 Session 2a: Wind power spatial planning techniques IRENA Global Atlas Spatial planning techniques 2-day seminar Central questions we want to answer After having identified those areas which are potentially
Wind Resource Assessment for NOME (ANVIL MOUNTAIN), ALASKA Date last modified: 5/22/06 Compiled by: Cliff Dolchok
, ALASKA Date last modified: 5/22/06 Compiled by: Cliff Dolchok") 813 W. Northern Lights Blvd. Anchorage, AK 99503 Phone: 907-269-3000 Fax: 907-269-3044 www.akenergyauthority.org SITE SUMMARY Wind Resource Assessment for NOME (ANVIL MOUNTAIN), ALASKA Date last modified:
813 W. Northern Lights Blvd. Anchorage, AK 99503 Phone: 907-269-3000 Fax: 907-269-3044 www.akenergyauthority.org SITE SUMMARY Wind Resource Assessment for NOME (ANVIL MOUNTAIN), ALASKA Date last modified:
Meteorological Measurements OWEZ
 Meteorological Measurements OWEZ Half year report 01-01-2008-30-06-2008 H. Korterink P.J. Eecen ECN-E--08-062 OWEZ_R_121_20080101-20080630_wind_resource_2008_1 Abstract NoordzeeWind carries out an extensive
Session 2: Wind power spatial planning techniques
 Session 2: Wind power spatial planning techniques IRENA Global Atlas Spatial planning techniques 2-day seminar Central questions we want to answer After having identified those areas which are potentially
3D Nacelle Mounted Lidar in Complex Terrain
 ENERGY 3D Nacelle Mounted Lidar in Complex Terrain PCWG Hamburg, Germany Paul Lawson 25.03.2015 1 DNV GL 125.03.2015 SAFER, SMARTER, GREENER Agenda Introduction and Project Background Lidar Specifications
How an extreme wind atlas is made
 How an extreme wind atlas is made AC Kruger South African Weather Service X Larsén DTU Wind Energy Wind 1 Atlas for South Africa (WASA) Why do we need extreme wind statistics? Statistical background for
Meteorological Measurements OWEZ
 Meteorological Measurements OWEZ Half year report - 01-07-2008-31-12-2008 H. Korterink P.J. Eecen J.W. Wagenaar ECN-E--09-018 OWEZ_R_121_20080701-20081231_WIND_RESOURCE_2008_2 Abstract NoordzeeWind carries
Inuvik Wind Monitoring Update 2016
 Inuvik Wind Monitoring Update 2016 Source: MACA Prepared for By Jean Paul Pinard, P. Eng., PhD. 703 Wheeler St., Whitehorse, Yukon Y1A 2P6 Tel. (867) 336 2977; Email jpp@northwestel.net March 31, 2016
renewable energy projects by renewable energy people
 renewable energy projects by renewable energy people Our Services Full lifecycle services across renewable energy sectors 2 Time variant energy yield analysis A case study Presenter: Daniel Marmander Date:
Pre Feasibility Study Report Citiwater Cleveland Bay Purification Plant
 SOLAR POWER SPECIALISTS.Pure Power ACN 074 127 718 ABN 85 074 127 718 POWER MAGIC PTY LTD 245 INGHAM RD GARBUTT QLD 4814 Phone: 1800 068 977 Fax: 07 4725 2479 Email: FNQSOLAR@bigpond.com Pre Feasibility
Energy Output. Outline. Characterizing Wind Variability. Characterizing Wind Variability 3/7/2015. for Wind Power Management
 Energy Output for Wind Power Management Spring 215 Variability in wind Distribution plotting Mean power of the wind Betz' law Power density Power curves The power coefficient Calculator guide The power
Wind Farm Power Performance Test, in the scope of the IEC
 Wind Farm Power Performance Test, in the scope of the IEC 61400-12.3 Helder Carvalho 1 (helder.carvalho@megajoule.pt) Miguel Gaião 2 (miguel.gaiao@edp.pt) Ricardo Guedes 1 (ricardo.guedes@megajoule.pt)
PARK - Main Result Calculation: PARK calculation (5 x 166m, + LT CORR + MITIGATION) N.O. Jensen (RISØ/EMD)
 N.O. Jensen (RISØ/EMD)") PRK - Main Result Calculation: PRK calculation (5 x V15 @ 166m, + LT CORR + MITIGTION) Wake Model N.O. Jensen (RISØ/EMD) Calculation Settings ir density calculation mode Result for WTG at hub altitude
PRK - Main Result Calculation: PRK calculation (5 x V15 @ 166m, + LT CORR + MITIGTION) Wake Model N.O. Jensen (RISØ/EMD) Calculation Settings ir density calculation mode Result for WTG at hub altitude
HOUTEN WIND FARM WIND RESOURCE ASSESSMENT
 CIRCE CIRCE Building Campus Río Ebro University de Zaragoza Mariano Esquillor Gómez, 15 50018 Zaragoza Tel.: 976 761 863 Fax: 976 732 078 www.fcirce.es HOUTEN WIND FARM WIND RESOURCE ASSESSMENT CIRCE AIRE
National Renewable Energy Laboratory. Wind Resource Data Summary Guam Naval Ordnance Annex Data Summary and Retrieval for November 2009
 National Renewable Energy Laboratory Wind Resource Data Summary Guam Naval Ordnance Annex Data Summary and Retrieval for November 2009 Prepared for: National Renewable Energy Laboratory 1617 Cole Boulevard
Validation of Measurements from a ZephIR Lidar
 Validation of Measurements from a ZephIR Lidar Peter Argyle, Simon Watson CREST, Loughborough University, Loughborough, United Kingdom p.argyle@lboro.ac.uk INTRODUCTION Wind farm construction projects
Atqasuk Wind Resource Report
 Atqasuk Wind Resource Report Report by: Douglas Vaught, P.E., V3 Energy LLC, Eagle River, Alaska Date of Report: August 26, 2010 Atqasuk met tower; D. Vaught photo Contents Summary... 2 Test Site Location...
Shorter wind measurement campaigns Re-thinking with LiDAR
 Shorter wind measurement campaigns Re-thinking with LiDAR 31/05/2013 Ecofys Lidewij van den Brink, Anthony Crockford, Hector Villanueva, Jean Grassin Introducing Ecofys > Consultancy, 30 year experience
Kodiak, Alaska Site 1 Wind Resource Report for Kodiak Electric Association
 Kodiak, Alaska Site 1 Wind Resource Report for Kodiak Electric Association Report written by: Douglas Vaught, V3 Energy LLC, Eagle River, AK Date of report: August 23, 2006 Photo Doug Vaught General Site
Buckland Wind Resource Report
 Buckland Wind Resource Report By: Douglas Vaught, P.E., V3 Energy LLC, Eagle River, Alaska Date: September 17, 2010 Buckland met tower; D. Vaught photo Contents Summary... 2 Test Site Location... 2 Photographs...
Wind Regimes 1. 1 Wind Regimes
 Wind Regimes 1 1 Wind Regimes The proper design of a wind turbine for a site requires an accurate characterization of the wind at the site where it will operate. This requires an understanding of the sources
Wind Resource Assessment for FALSE PASS, ALASKA Site # 2399 Date last modified: 7/20/2005 Prepared by: Mia Devine
 813 W. Northern Lights Blvd. Anchorage, AK 99503 Phone: 907-269-3000 Fax: 907-269-3044 www.aidea.org/wind.htm Wind Resource Assessment for FALSE PASS, ALASKA Site # 2399 Date last modified: 7/20/2005 Prepared
Wind Resource Assessment for CHEFORNAK, ALASKA
 813 W. Northern Lights Blvd. Anchorage, AK 99503 Phone: 907-269-3000 Fax: 907-269-3044 www.akenergyauthority.org Wind Resource Assessment for CHEFORNAK, ALASKA Date last modified: 3/15/2006 Compiled by:
Advanced pre and post-processing in Windsim
 University of Perugia Department of Industrial Engineering Francesco Castellani Advanced pre and post-processing in Windsim CONTENTS Pre-processing 1) Domain control: *.gws construction 2) Advanced grid
Outline. Wind Turbine Siting. Roughness. Wind Farm Design 4/7/2015
 Wind Turbine Siting Andrew Kusiak 2139 Seamans Center Iowa City, Iowa 52242-1527 andrew-kusiak@uiowa.edu Tel: 319-335-5934 Fax: 319-335-5669 http://www.icaen.uiowa.edu/~ankusiak Terrain roughness Escarpments
Pitka s Point, Alaska Wind Resource Report
 Pitka s Point, Alaska Wind Resource Report Pitka s Point met tower, photo by Doug Vaught April 25, 2012 Douglas Vaught, P.E. V3 Energy, LLC Eagle River, Alaska Page 2 Summary The wind resource measured
MEMO CC: Summary. ESMWT16419: _MEM_RVO_HKZ floating LiDAR uncertainty_v3.docx 1/8
 MEMO Prepared: Anthony Crockford 23.02.2016 Reviewed: Erik Holtslag 24.02.2016 Approved: Michiel Müller 29.02.2016 Filename 20160224_MEM_RVO_HKZ floating LiDAR uncertainty_v3.docx Pages 8 Version Author
Wind Flow Modeling: Are computationally intensive models more accurate?
 June 23 rd, 2015 Wind Flow Modeling: Are computationally intensive models more accurate? Philippe Beaucage, PhD Lead Research Scientist Michael C. Brower, PhD President & Chief Technical Officer Jose Vidal,
Draft Kivalina Wind Resource Report
 Draft Kivalina Wind Resource Report Kivalina aerial photo by Doug Vaught, July 2011 May 31, 2012 Douglas Vaught, P.E. dvaught@v3energy.com V3 Energy, LLC Eagle River, Alaska Draft Kivalina Wind Resource
WIND DATA REPORT. Paxton, MA
 WIND DATA REPORT Paxton, MA July 1, 2011 September 30, 2011 Prepared for Massachusetts Clean Energy Center 55 Summer Street, 9th Floor Boston, MA 02110 by Eric Morgan James F. Manwell Anthony F. Ellis
Are Advanced Wind Flow Models More Accurate? A Test of Four Models
 Are Advanced Wind Flow Models More Accurate? A Test of Four Models Philippe Beaucage, PhD Senior Research Scientist Michael C. Brower, PhD Chief Technical Officer Brazil Wind Power Conference 2012 Albany
LONG TERM SITE WIND DATA ANNUAL REPORT WBZ
 LONG TERM SITE WIND DATA ANNUAL REPORT WBZ July 1, 2012 June 30, 2013 Prepared for Massachusetts Clean Energy Center 55 Summer Street, 9th Floor Boston, MA 02110 by Dylan D. Chase James F. Manwell Anthony
7 th International Conference on Wind Turbine Noise Rotterdam 2 nd to 5 th May 2017
 7 th International Conference on Wind Turbine Noise Rotterdam 2 nd to 5 th May 2017 Sound power level measurements 3.0 ir. L.M. Eilders, Peutz bv: l.eilders@peutz.nl ing. E.H.A. de Beer, Peutz bv: e.debeer@peutz.nl
Why does T7 underperform? Individual turbine performance relative to preconstruction estimates.
 Why does T7 underperform? Individual turbine performance relative to preconstruction estimates. P. Stuart, N. Atkinson, A. Clerc, A. Ely, M. Smith, J. Cronin, M. Zhu & T Young. EWEA Technology Workshop
Evaluation of four numerical wind flow models
 EWEA Resource Assessment Workshop 2013 Evaluation of four numerical wind flow models Michael C. Brower, PhD Chief Technical Officer Jose Vidal, MSc Consulting Services Europe & Latin America Manager Philippe
Yellowknife Area Wind Potential
 Yellowknife Area Wind Potential Prepared for by Jean-Paul Pinard, P. Eng., PhD. 703 Wheeler St., Whitehorse, Yukon Y1A 2P6 Tel. (867) 336-2977; Email jpp@northwestel.net, and Annika Trimble (Ed.), Aurora
On the use of rotor equivalent wind speed to improve CFD wind resource mapping. Yavor V. Hristov, PhD Plant Performance and Modeling Vestas TSS
 On the use of rotor equivalent wind speed to improve CFD wind resource mapping Yavor V. Hristov, PhD Plant Performance and Modeling Vestas TSS Firestorm- Number 53 on Top500 list from June 2011 14664 processors
Wind farm performance
 Wind farm performance Ali Marjan Wind Energy Submission date: June 2016 Supervisor: Lars Sætran, EPT Norwegian University of Science and Technology Department of Energy and Process Engineering Wind
WIND RESOURCE ASSESSMENT FOR THE STATE OF WYOMING
 WIND RESOURCE ASSESSMENT FOR THE STATE OF WYOMING Performed by Sriganesh Ananthanarayanan under the guidance of Dr. Jonathan Naughton, Professor, Department of Mechanical Engineering University of Wyoming,
CORRELATION EFFECTS IN THE FIELD CLASSIFICATION OF GROUND BASED REMOTE WIND SENSORS
 CORRELATION EFFECTS IN THE FIELD CLASSIFICATION OF GROUND BASED REMOTE WIND SENSORS Will Barker (1), Julia Gottschall (2), Michael Harris (3), John Medley (4), Edward Burin des Roziers (5), Chris Slinger
On- and Offshore Assessment of the ZephIR Wind-LiDAR
 On- and Offshore Assessment of the ZephIR Wind-LiDAR Detlef Kindler Kaiser-Wilhelm-Koog GmbH Andy Oldroyd Oldbaum Services Ltd. IEA R&D Task 11, Wind Energy 51 st Topical Expert Meeting on Remote Sensing
Yawing and performance of an offshore wind farm
 Yawing and performance of an offshore wind farm Troels Friis Pedersen, Julia Gottschall, Risø DTU Jesper Runge Kristoffersen, Jan-Åke Dahlberg, Vattenfall Contact: trpe@risoe.dtu.dk, +4 2133 42 Abstract
windnavigator Site Analyst Report
 windnavigator Site Analyst Report for Central NY Created for Stephen Meister April 27, 2010 ID NUMBER: N2-128 AWS Truepower, LLC Albany - Barcelona - Bangalore p: +1.518.21.00 e: info@awstruepower.com
Kake, Alaska Wind Resource Report
 Kake, Alaska Wind Resource Report Kake met tower, photo provided by SEACC January 6, 2012 Douglas Vaught, P.E. V3 Energy, LLC Eagle River, Alaska Kake, Alaska Met Tower Wind Resource Report Page 2 Project
Wind Data Verification Report Arriga 50m
 Page 1 of 11 Site Name Site Details 9531 - Arriga 5m Arriga 5m Date/Time of report generation 27/11/212 4:22 PM Site Number 9531 Mast Height 5m Mast Location 32568 E 811256 N Coordinate System UTM 55K
Rotor Average wind speed for power curve performance. Ioannis Antoniou (LAC), Jochen Cleve (LAC), Apostolos Piperas (LAC)
, Jochen Cleve (LAC), Apostolos Piperas (LAC)") Rotor Average wind speed for power curve performance Ioannis Antoniou (LAC), Jochen Cleve (LAC), Apostolos Piperas (LAC) March 2, 23 Contents Rotor Average wind speed EU flat terrain wind profiles vs.
Rotor Average wind speed for power curve performance Ioannis Antoniou (LAC), Jochen Cleve (LAC), Apostolos Piperas (LAC) March 2, 23 Contents Rotor Average wind speed EU flat terrain wind profiles vs.
Session 2b: Wind power spatial planning techniques
 Session 2b: Wind power spatial planning techniques IRENA Global Atlas Spatial planning techniques 2-day seminar Central questions we want to answer After having identified those areas which are potentially
WIND DATA REPORT. Bourne Water District
 WIND DATA REPORT Bourne Water District July to September 2010 Prepared for Massachusetts Clean Energy Center 55 Summer Street, 9th Floor Boston, MA 02110 by Dylan Chase James F. Manwell Utama Abdulwahid
Wind Project Siting and Permitting Blaine Loos
 Wind Project Siting and Permitting Blaine Loos Energy Project Analyst Center for Wind Energy at James Madison University Wind Project Siting and Permitting The Energy in Wind Resource Assessment (Macro-siting)
Test Summary Report Giraffe 2.0 Hybrid Wind-Solar Power Station - for wind: according to IEC Annex M - for solar: measurement report
 Contact person Tanja Tränkle 2016-06-29 4P05805-R01 rev. 1 1 (7) Safety +46 10 516 57 19 Tanja.Trankle@sp.se Innoventum AB Morgan Widung / Marcus Ulmefors Turning Torso office 275 Lilla Varvsgatan 14 211
LONG TERM SITE WIND DATA ANNUAL REPORT. Mass Turnpike Authority Blandford, MA
 LONG TERM SITE WIND DATA ANNUAL REPORT Mass Turnpike Authority Blandford, MA July 1, 2012 June 30, 2013 Prepared for Massachusetts Clean Energy Center 55 Summer Street, 9th Floor Boston, MA 02110 by Dylan
OFFSHORE CREDENTIALS. Accepted for wind resource assessment onshore and offshore by leading Banks Engineers, globally
 OFFSHORE CREDENTIALS Accepted for wind resource assessment onshore and offshore by leading Banks Engineers, globally ZEPHIR OFFSHORE CREDENTIALS Accepted for wind resource assessment onshore and offshore
WIND CONDITIONS MODELING FOR SMALL WIND TURBINES
 U.P.B. Sci. Bull., Series C, Vol. 77, Iss. 2, 2015 ISSN 2286-3540 WIND CONDITIONS MODELING FOR SMALL WIND TURBINES Viorel URSU 1, Sandor BARTHA 2 Wind energy systems are a solution which became cost effective
Saint Mary s, Alaska Wind Resource Report (for Pitka s Point and Saint Mary s met towers)
") Saint Mary s, Alaska Wind Resource Report (for Pitka s Point and Saint Mary s met towers) Report written by: Douglas Vaught, P.E., V3 Energy, LLC Date of Report: February 9, 2009 Doug Vaught photo Summary
Saint Mary s, Alaska Wind Resource Report (for Pitka s Point and Saint Mary s met towers) Report written by: Douglas Vaught, P.E., V3 Energy, LLC Date of Report: February 9, 2009 Doug Vaught photo Summary
WIND DATA REPORT. Mt. Lincoln Pelham, MA
 WIND DATA REPORT Mt. Lincoln Pelham, MA May 2009 to April 2010 Prepared for Massachusetts Department of Energy Resources 100 Cambridge Street, Suite 1020 Boston, MA 02114 by Jonathan D. Black James F.
New IEC and Site Conditions in Reality
 New IEC 61400-1 and Site Conditions in Reality Udo Follrichs Windtest Kaiser-Wilhelm-Koog GmbH Sommerdeich 14b, D-25709 Kaiser-Wilhelm-Koog Tel.: +49-4856-901-0, Fax: +49-4856-901-49 Axel Andreä, Kimon
Wind Farm Blockage: Searching for Suitable Validation Data
 ENERGY Wind Farm Blockage: Searching for Suitable Validation Data James Bleeg, Mark Purcell, Renzo Ruisi, and Elizabeth Traiger 09 April 2018 1 DNV GL 2014 09 April 2018 SAFER, SMARTER, GREENER Wind turbine
Workshop Session 1: Resources, technology, performance
 IBC 3rd Annual Wind Energy Conference Adelaide February 2004 Workshop Session 1: Resources, technology, performance Iain MacGill and Hugh Outhred School of Electrical Engineering and Telecommunications
CSM3403 Renewable Energy Dissertation (T, TERM2 2015/6)
") University of Exeter coursework header sheet CSM3403 Renewable Energy Dissertation (T, TERM2 2015/6) 1023089 031299 Coursework: Dissertation (T) Peter Connor Submission Deadline: Mon 25th Apr 2016 12:00
University of Exeter coursework header sheet CSM3403 Renewable Energy Dissertation (T, TERM2 2015/6) 1023089 031299 Coursework: Dissertation (T) Peter Connor Submission Deadline: Mon 25th Apr 2016 12:00
Offshore Micrositing - Meeting The Challenge
 Offshore Micrositing - Meeting The Challenge V. Barth; DEWI GmbH, Oldenburg English Introduction Offshore wind is increasingly gaining importance in the wind energy sector. While countries like the UK
Wind resource assessment over a complex terrain covered by forest using CFD simulations of neutral atmospheric boundary layer with OpenFOAM
 Wind resource assessment over a complex terrain covered by forest using CFD simulations of neutral atmospheric boundary layer with OpenFOAM Nikolaos Stergiannis nstergiannis.com nikolaos.stergiannis@vub.ac.be
Computational Fluid Dynamics
 Computational Fluid Dynamics A better understanding of wind conditions across the whole turbine rotor INTRODUCTION If you are involved in onshore wind you have probably come across the term CFD before
Power curves - use of spinner anemometry. Troels Friis Pedersen DTU Wind Energy Professor
 Power curves - use of spinner anemometry Troels Friis Pedersen DTU Wind Energy Professor Spinner anemometry using the airflow over the spinner to measure wind speed, yaw misalignment and flow inclination
Wind Power. Kevin Clifford METR 112 April 19, 2011
 Wind Power Kevin Clifford METR 112 April 19, 2011 Outline Introduction Wind Turbines Determining Wind Power Output The Price of Wind Power Wind Power Availability across the World and US California Wind
LiDAR Application to resource assessment and turbine control
 ENERGY LiDAR Application to resource assessment and turbine control Dr. Avishek Kumar The New Zealand Wind Energy Conference 13 th April 2016 1 SAFER, SMARTER, GREENER Agenda What is LiDAR? Remote Sensing
Stefan Emeis
 The Physics of Wind Park Optimization Stefan Emeis stefan.emeis@kit.edu INSTITUTE OF METEOROLOGY AND CLIMATE RESEARCH, Photo: Vattenfall/C. Steiness KIT University of the State of Baden-Wuerttemberg and
Yawing and performance of an offshore wind farm
 Downloaded from orbit.dtu.dk on: Dec 18, 217 Yawing and performance of an offshore wind farm Friis Pedersen, Troels; Gottschall, Julia; Kristoffersen, Jesper Runge; Dahlberg, Jan-Åke Published in: Proceedings
Wind Resource Assessment for SAINT PAUL, ALASKA
 813 W. Northern Lights Blvd. Anchorage, AK 99503 Phone: 907-269-3000 Fax: 907-269-3044 www.akenergyauthority.org Wind Resource Assessment for SAINT PAUL, ALASKA Date last modified: 3/1/2006 Compiled by:
Wind Monitoring Update for Tuktoyaktuk, Winter 2009
 Wind Monitoring Update for Tuktoyaktuk, Winter 2009 Prepared for by Jean-Paul Pinard, P. Eng., Ph.D. 703 Wheeler St., Whitehorse, Yukon Y1A 2P6 Phone: (867) 393-2977 E-mail: jpp@northwestel.net Acknowledgement
Hollandse Kust (zuid) Wind resource assessment. 17 January 2017 Anthony Crockford
 Wind resource assessment. 17 January 2017 Anthony Crockford") Hollandse Kust (zuid) Wind resource assessment 17 January 2017 Overview > Introduction > Wind measurements > Mesoscale model > Calculation of wind climate > Comparisons > Conclusions 2 ECOFYS WTTS 17/01/2017
Hollandse Kust (zuid) Wind resource assessment 17 January 2017 Overview > Introduction > Wind measurements > Mesoscale model > Calculation of wind climate > Comparisons > Conclusions 2 ECOFYS WTTS 17/01/2017
Fuga. - Validating a wake model for offshore wind farms. Søren Ott, Morten Nielsen & Kurt Shaldemose Hansen
 Fuga - Validating a wake model for offshore wind farms Søren Ott, Morten Nielsen & Kurt Shaldemose Hansen 28-06- Outline What is Fuga? Model validation: which assumptions are tested? Met data interpretation:
Strategic Advice about Floating LiDAR Campaigns. Borssele offshore wind farm
 Strategic Advice about Floating LiDAR Campaigns Borssele offshore wind farm Strategic Advice about Floating LiDAR Campaigns Borssele offshore wind farm Project number: ESMWT16419 Prepared: Dhruv Dhirendra
WIND DATA REPORT. Swan s Island, ME
 WIND DATA REPORT Swan s Island, ME June 1, 2009 August 31, 2009 Prepared for US Department of Energy by Daniel T. Grip Utama Abdulwahid James F. Manwell Anthony F. Ellis September 17, 2009 Report template
Testing and Validation of the Triton Sodar
 Testing and Validation of the Triton Sodar September 24, 2008 AWEA Resource Assessment Workshop Ron Nierenberg, Consulting Meteorologist Liz Walls, Second Wind Inc. Ron Consulting Nierenberg Meteorologist
Vindatlas i Ægypten. Mortensen, Niels Gylling; Badger, Jake; Hansen, Jens Carsten. Publication date: Document Version Peer reviewed version
 Downloaded from orbit.dtu.dk on: Dec 19, 2017 Vindatlas i Ægypten Mortensen, Niels Gylling; Badger, Jake; Hansen, Jens Carsten Publication date: 2006 Document Version Peer reviewed version Link back to
Wind Assessment Basics
 Wind Assessment Basics 120 Power curve for Northwind 100 100 80 60 40 kwh For Island Institute Fall 2013 by Mick Womersley 20 0 1 2 3 4 5 6 7 8 9 1011121314151617181920212223 Wind speed in M/S A misspent
Effect of wind flow direction on the loads at wind farm. Romans Kazacoks Lindsey Amos Prof William Leithead
 Effect of wind flow direction on the loads at wind farm Romans Kazacoks Lindsey Amos Prof William Leithead Objectives: Investigate the effect of wind flow direction on the wind turbine loads (fatigue)
Flow analysis with nacellemounted
 Flow analysis with nacellemounted LiDAR E.T.G. Bot September 2016 ECN-E--16-041 Acknowledgement The work reported here is carried out in the TKI LAWINE project which is partially funded by the Dutch government
WIND DATA REPORT. Paxton, MA
 WIND DATA REPORT Paxton, MA September 1 2003 November 30 2003 by James F. Manwell Anthony F. Ellis Kai Wu April 15, 2004 Renewable Energy Research Laboratory 160 Governors Drive, www.ceere.org/rerl (413)
Tidal influence on offshore and coastal wind resource predictions at North Sea. Barbara Jimenez 1,2, Bernhard Lange 3, and Detlev Heinemann 1.
 Tidal influence on offshore and coastal wind resource predictions at North Sea Barbara Jimenez 1,2, Bernhard Lange 3, and Detlev Heinemann 1. 1 ForWind - Center for Wind Energy Research, University of
July Interim Report. National Institute of Wind Energy (NIWE) Wind Resource Assessment & Offshore Unit Chennai, India.
 Wind Resource Assessment & Offshore Unit Chennai, India.") Interim Report (First Offshore Lidar wind data analysis) July 2018 Prepared by National Institute of Wind Energy (NIWE) Wind Resource Assessment & Offshore Unit Chennai, India. W I N D R E S O U R C E
Interim Report (First Offshore Lidar wind data analysis) July 2018 Prepared by National Institute of Wind Energy (NIWE) Wind Resource Assessment & Offshore Unit Chennai, India. W I N D R E S O U R C E
Windcube FCR measurements
 Windcube FCR measurements Principles, performance and recommendations for use of the Flow Complexity Recognition (FCR) algorithm for the Windcube ground-based Lidar Summary: As with any remote sensor,
Remote sensing standards: their current status and significance for offshore projects
 Remote sensing standards: their current status and significance for offshore projects Peter J M Clive Technical Development Consultant SgurrEnergy Ltd 225 Bath Street Glasgow G2 4GZ E: peter.clive@sgurrenergy.com
Comparing the calculated coefficients of performance of a class of wind turbines that produce power between 330 kw and 7,500 kw
 World Transactions on Engineering and Technology Education Vol.11, No.1, 2013 2013 WIETE Comparing the calculated coefficients of performance of a class of wind turbines that produce power between 330