The Summer of 2007: A Look at Niagara
|
|
|
- Amanda Reed
- 5 years ago
- Views:
Transcription

1 The Summer of 27: A Look at Niagara By Wayne Heinen (maps generated by Piper McKinnon)
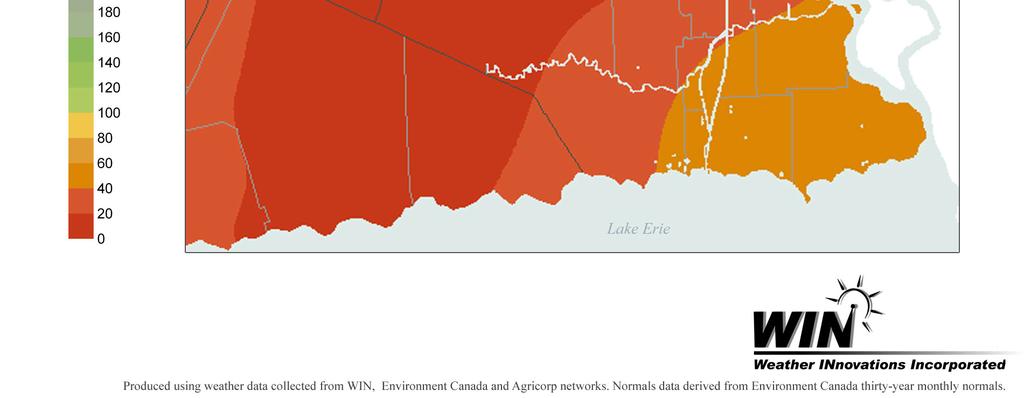
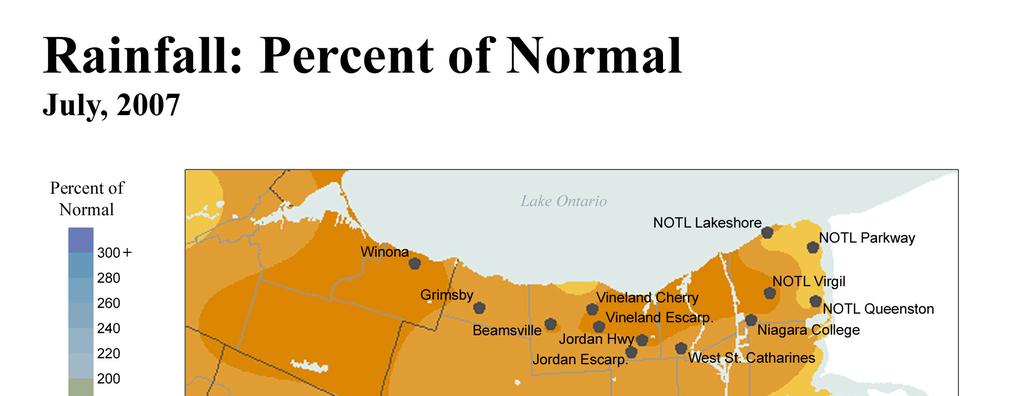
2 OVERVIEW The summer of 27 was yet another challenging growing season. One look at the inch-wide cracks in the soil, the lack in fruit size, and the substantial number of sunny days and everyone would concur with Niagara growers that it was a dry growing season. Indeed, the Niagara region fell much below the 3-year normals for rainfall this summer. The following maps show how monthly rainfall accumulation, from May through September, was consistently well below normal. The growing season got off to a dry start, as May and June were especially dry. July shows a bit of relief, as values are closer to average. However, even the total rainfall for July was well below average for all of Niagara. The remainder of the summer continued to be extremely dry. The lack of rainfall in the Niagara region this summer led to one certain conclusion: those who had access to water for irrigation were thankful for that option. If you were privileged enough to have access to water this summer, you may have managed to prevent serious losses, although smaller fruit was likely still the outcome. Niagara s farmers definitely experienced lower yields this year. On the positive side, however, the lack of days with rainfall led to much lower disease pressures. This was a warm welcome compared to the contrary conditions in 26. All growers found relief this year compared to the extremely high disease pressures last year. This is no surprise, as fungal disease development is driven by leaf wetness and temperature. In other words, during periods of leaf wetness, the temperature determines how fast the disease infects the plant. The lack of rain this summer led to less leaf wetness hours, inhibiting mildew development. Therefore, although the lack of rainfall was unfavorable to high yields in 27, less fruit was lost to disease.
3
4
5 Temperature Analysis ANALYSIS The following chart illustrates that the lack of rainfall coincided with consistently higher daily maximums. On average, for each NAWN location, maximum daily temperatures were higher than the 3-year normal for the entire summer. Overall, May, August and September average daily maximums were 2-4 C higher than normal. June daily maximums were much hotter than normal, by approximately 4-5 C. July was the closest month to normal, although still slightly above average. Higher-than-normal temperatures are depicted in red in the following tables, while lower-than-normal temperatures are shown in blue. Average Daily Maximums for May- September Compared to Normal May June July Aug Sept Normal (Vineland Station) Grimsby Beamsville Vineland Cherry Ave Vineland Escarpment Jordan Hwy Jordan Escarpment West St. Catharines Niagara College Virgil Queenston Lakeshore Parkway In contrast, average daily minimums for these months were mainly below normal, with the exception of the month of June. Almost all stations recorded warmer than normal daily lows in June, while July minimums were consistently cooler. However, although average July minimum temperatures were lower, daily maximums still remained higher than normal. The following table shows how most nights were warmer than normal during the month of June. With average daily maximum and minimum temperatures being well above average already in June, it is not surprising how quickly soil moisture was depleted. Regardless of the amount of rainfall Niagara received, these higher temperatures would increase evapotranspiration rates and thus, soil moisture would deplete faster.

6 Average Daily Minimums for May- September Compared to Normal May June July Aug Sept Normal (Vineland Station) Grimsby Beamsville Vineland Cherry Ave Vineland Escarpment Jordan Hwy Jordan Escarpment West St. Catharines Niagara College Virgil Queenston Lakeshore Parkway In fact, the number of days where the temperature soared above 3 C was significantly higher this summer. Normally, there are only 11 days from May through September when the temperature climbs higher than 3 C. This year, all of the NAWN stations recorded this occurring more than twice as often as normal. Remarkably, the Beamsville, West St. Catharines, and Parkway stations recorded this occurring more than three times as often! As shown on the map, Vineland escarpment had the least number of days with these extreme temperatures. Overall, it is quite evident that temperatures were much higher this year than normal.


7 Number of days The Number of Days from May-Sept Where Tmax was Greater Than 3 C Grimsby Beamsville Vineland Cherry Ave Vineland Escarpment Jordan Hwy 8 Jordan Escarpment West St. Catharines NAWN station Niagara College Virgil Queenston Lakeshore Parkway Days Tmax > 3'C Normal # of Days Tmax > 3'C Growing Degree Day Analysis Accumulated growing degree-days from April 1 to October 31 surpassed the 3- year normal for Vineland Station. The Base 1 C GDD 3-year normal for Vineland station is heat units, and all stations had between 1466 and 1679 heat units. Likewise, the base 5 C GDD 3-year normal is heat units and all stations had between 247 and 2649 heat units. Beamsville had the highest accumulation, followed by Niagara College. Grimsby had the least accumulation of heat units.
8 Base 1'C GDD from April 1 - October 31, 27 GDD Apr 1-May 1-Jun 1-Jul 1-Aug 1-Sep 1-Oct 1-Nov Date Grimsby Beamsville Vineland Cherry Ave Vineland Escarpment Jordan Hwy 8 Jordan Escarpment West St. Catharines Niagara College Virgil Queenston Lakeshore Parkway Seasonal Accumulation of Base 1'C GDD (April 1 - October 31, 27) Compared to Normal for Vineland Station GDD Grimsby Beamsville Vineland Cherry Ave Vineland Escarpment Jordan Hwy 8 Jordan Escarpment West St. Catharines Niagara College NAWN Station Virgil Queenston Lakeshore Parkway 3-year Normal (132.1 GDD)
9 Base 5'C GDD from April 1 - October 31, 27 GDD Apr 1-May 1-Jun 1-Jul 1-Aug Date 1-Sep 1-Oct 1-Nov Grimsby Beamsville Vineland Cherry Ave Vineland Escarpment Jordan Hwy 8 Jordan Escarpment West St. Catharines Niagara College Virgil Queenston Lakeshore Parkway Normal GDD Seasonal Accumulation of Base 5'C GDD (April 1 - October 31, 27) Compared to Normal for Vineland Station Grimsby Beamsville Vineland Cherry Ave Vineland Escarpment Jordan Hwy 8 Jordan Escarpment West St. Catharines Niagara College Virgil Queenston Lakeshore Parkway NAWN station 3-year Normal ( GDD)
10 Rainfall Analysis The following graph shows the May September rainfall deficit, compared to the 3 year normal for Vineland station. Each station across Niagara experienced well below normal rainfall for this time period. Grimsby had the closest to normal rainfall for this time period, with a deficit of 196.3mm (that s still nearly 8 inches!). All of the remaining areas had a rainfall deficit well over 2mm! Vineland escarpment had the greatest lack of rainfall, with a deficit of over 261.1mm (approx. 1.3 inches). Rainfall Below Normal (May 1 - September 3, 27) -5 Rainfall (mm) Grimsby Beamsville Vineland Cherry Ave Vineland Escarpment Jordan Hwy 8 Jordan Escarpment West St. Catharines Niagara College Virgil Queenston Lakeshore Parkway NAWN station In addition, mainly of the rainfall events that occurred this summer were not significant enough to increase soil moisture. For example, there were quite a number of rainfall events that were so small, most of the moisture evaporated before plants could take it up. Evapotranspiration Analysis Evapotranspiration (ET) is the amount of water lost by transpiration from the crop canopy and evaporation from the soil. If this amount is not equivalent to rainfall, the amount of water drawn from the soil is not replenished. Thus, the soil water balance drops. The estimated ET values on this graph are based on a standard for turf grass. It clearly illustrates how rainfall was lacking this summer since each month s ET losses were much higher than rainfall. June had both the highest ET losses as well as the lowest rainfall total for all the months. In addition, it emphasizes how soil moisture conditions would quickly decline under these circumstances.
11 Calculated Evapotranspiration Compared to Measured Rainfall for Virgil (May 1 - Sep 3, 27) Monthly totals (mm) Evapotranspiration (calculated) Rainfall May June July August September Month Soil Moisture Analysis The following graph shows the soil moisture profile of a peach orchard in Niagara, via a capacitance probe (c-probe). Unless you are a drip irrigator, this graph would be typical of the soil moisture drying trend Niagara s soils experienced this summer. This particular block was irrigated using a stationary gun. The profile can be broken into seven noteworthy sections (A-G). Section (A) shows the downward soildrying trend at all 1, 3, and 5cm depths, particularly at the 3 and 5cm depths. The rainfall events can be seen at the bottom of the graph and it is clear that the rainfall events were not significant enough to maintain the soil moisture conditions at that time.
12 It was not until the first irrigation event, on June 2, that the drying trend was halted at the top 1cm soil depth (B). However, although 32.2mm (1.27 ) of water was added, even this amount was not significant enough to infiltrate to the 3 and 5cm depths. Unfortunately, the lack of significant rainfall continued and the drying trend began again. A second irrigation event took place on July 11 (C), adding 35.6mm of water, which again stopped the drying trend, but only at the 1cm level. The rest of July was greeted with a few more rainfall events (D), which maintained the soil moisture conditions at the 1cm depth. However, it is evident in the graph (E) that the 3 and 5cm depths were nearly depleted of available soil moisture, as the drying trend had flat-lined. A third and final irrigation event added 38.6mm of water, and took place on July 21, approximately 1 days before the harvest onset. Finally, due to the 1cm soil depth having sufficient moisture from a slightly wetter (though still dry) July, this irrigation event managed to infiltrate to the 3cm depth (F). August was an especially dry month, lacking any rainfall events to maintain soil moisture conditions and the drying trend continued (G). A few rainfall events in September and October were significant enough to infiltrate the 1cm soil depth; however, the 3 and 5cm depths remained completely dry. Thus, Niagara soils will require a few long and steady rainfall events to replenish the entire soil profile. SUMMARY Overall, the 27 growing season can be summed up as warmer and drier. The summer of 27 can be characterized by having warmer than average days, but cooler nights. The only exception was June, which had consistently warmer-than-normal nighttime lows as well as daytime highs. These above-average temperatures led to increased evapotranspiration. However, effective precipitation was lower; thus, ideal soil moisture conditions could not be maintained by natural rainfall alone. Consequently, soil moisture levels have been of particular interest this year as many needed to determine when and how much to irrigate. Once again, the need for water management has been recognized. The c-probe gives a clear indication of what s happening beneath the soil. A downward sloping line on the graph ending in a flat-line indicates a depletion of soil moisture at that level. One can easily maintain the soil moisture conditions at the rooting zone with the use of this probe. One can also make sure that water is not infiltrating past the rooting zone, and thus, over irrigating. In order to improve upon our services to our clients, WIN welcomes any feedback you may have on the desired frequency, content and delivery of the reports. Comments on the presentation of the data, the usefulness of this information or what you would like to receive in future reports would be greatly appreciated. Please contact Wayne Heinen (wheinen@weatherinnovations.com) or WIN ( ) with your feedback.
February 2011: Niagara Peninsula
 February 2011: Niagara Peninsula WIN Staff March 7, 2011 OVERVIEW The vine deacclimation process began in February, as the coldest winter temperatures passed and the temperature trend increased throughout
Properties. terc.ucdavis.edu 8
 Physical Properties 8 Lake surface level Daily since 1900 The lowest lake level on record was 6,220.26 feet on Nov. 30, 1992. Since 1900, lake level has varied by more than 10 feet. Lake level typically
Background Preliminary Review... 3
 January 23, 2012 Evaluation of Prop osed NRWC Wind Farm on Lo cal Micro climate: Preliminary Review & Work Plan For: Debbie Zimmerman Chief Executive Officer Grap e Growers of Ontario P.O. Box 100 Vineland
Table 1. Monthly precipitation totals from the on-site rain gage and from the Dulles weather station and their differences.
 Table 1. Monthly precipitation totals from the on-site rain gage and from the Dulles weather station and their differences. Precipitation Month On-Site Rain Dulles Weather Difference Ratio 1996-97 Gage
Dr. Vera Potop & Prof. Josef Soukup
 IMPACTS OF DROUGHT AT VARIOUS TIME SCALES ON THE PRODUCTIVITY OF AGRICULTURAL CROPS Czech University of Life Sciences Prague Česká zemědělská univerzita v Praze Acronym in Czech: ČZU Dr. Vera Potop & Prof.
WISCONSIN ALFALFA YIELD AND PERSISTENCE (WAYP) PROGRAM 2018 SUMMARY REPORT
 PROGRAM 2018 SUMMARY REPORT") WISCONSIN ALFALFA YIELD AND PERSISTENCE (WAYP) PROGRAM 2018 SUMMARY REPORT Program Objectives: 1. To verify the yield and quality of alfalfa harvested from production fields over the life of the stand
WISCONSIN ALFALFA YIELD AND PERSISTENCE (WAYP) PROGRAM 2018 SUMMARY REPORT Program Objectives: 1. To verify the yield and quality of alfalfa harvested from production fields over the life of the stand
Drought: What is the Status?
 Drought: What is the Status? Nolan J. Doesken Colorado Climate Center Colorado State University http://ccc.atmos.colostate.edu Presented at 2005 Peak to Prairie Landscape Symposium, February 11, 2005,
Nolan Doesken. Colorado Climate Center.
 Nolan Doesken Colorado Climate Center Presented to: Colorado Conservation Tillage Association, Greeley, CO, February 1-2, 1 2005 http://ccc.atmos.colostate.edu Prepared by Odie Bliss 1 Key Features of
MAR DASHBOARD MAR. Compliant % Breakdown Mar % Late % On-time MAR APR MAY JUN JUL AUG SEP OCT NOV DEC
 Positive Response Compliance 215 Compliant 215 Non-Compliant 216 Compliant 216 Non-Compliant 1% 87% 96% 86% 96% 88% 97% 89% 89% 88% 86% 92% 93% 94% 96% 94% 8% 6% 4% 2% 13% JAN 4% 14% FEB 4% 12% 3% 11%
ROLLING HILLS COUNTRY CLUB McMurray, Pennsylvania
 ROLLING HILLS COUNTRY CLUB McMurray, Pennsylvania Visit Date: October 10, 2014 Present: Chris Markel, Golf Course Superintendent Dave Ball, President Bill Suffern, Green Committee Chairman (Briefly) Larry
Drought or Not? Nolan J. Doesken Colorado Climate Center Colorado State University
 Drought or Not? Nolan J. Doesken Colorado Climate Center Colorado State University http://ccc.atmos.colostate.edu Presented at Horticultural Art Society meeting, November 19, 2004, Colorado Springs, Colorado
Drought and the Climate of the Ogallala Aquifer
 Drought and the Climate of the Ogallala Aquifer Nolan J. Doesken Colorado Climate Center Colorado State University Presented at Ogallala Symposium, Wray, Colorado February 20, 2006 Prepared by Odie Bliss
Golf Course Water Use Survey Timmothy Gergeni and Karen Panter Department of Plant Sciences, University of Wyoming November 22, 2013
 Golf Course Water Use Survey Timmothy Gergeni and Karen Panter Department of Plant Sciences, University of Wyoming November 22, 2013 As reported by the 115 respondents, the largest percentage of the golf
Nolan Doesken Colorado Climate Center
 Nolan Doesken Colorado Climate Center Presented to: Colorado Cattleman s s Association, Pueblo, CO, June 19, 2006 http://ccc.atmos.colostate.edu Prepared by Odie Bliss 1 Let s s Talk About Precipitation
 A Brief Analysis of the Impact of the El Niño Southern Oscillation (ENSO) Cycle In specific areas around East Timor In the Climate Change section of Seeds of Life, we believe it would be beneficial for
COMPARISON OF FIXED & VARIABLE RATES (25 YEARS) CHARTERED BANK ADMINISTERED INTEREST RATES - PRIME BUSINESS*
 CHARTERED BANK ADMINISTERED INTEREST RATES - PRIME BUSINESS*") COMPARISON OF FIXED & VARIABLE RATES (25 YEARS) Fixed Rates Variable Rates FIXED RATES OF THE PAST 25 YEARS AVERAGE RESIDENTIAL MORTGAGE LENDING RATE - 5 YEAR* (Per cent) Year Jan Feb Mar Apr May Jun Jul
COMPARISON OF FIXED & VARIABLE RATES (25 YEARS) Fixed Rates Variable Rates FIXED RATES OF THE PAST 25 YEARS AVERAGE RESIDENTIAL MORTGAGE LENDING RATE - 5 YEAR* (Per cent) Year Jan Feb Mar Apr May Jun Jul
July 2015 Sept Cork City Pedestrian Counter Report
 July 2015 Sept 2015 Cork City Pedestrian Counter Report Disclaimer Cork City Council has produced this report based on information extracted from our Pedestrian Counter Monitoring System. Although care
Estimated Puerto Rican Rainfall Variability through the Little Ice Age and its implication for sustained long term shifts in the ITCZ
 Estimated Puerto Rican Rainfall Variability through the Little Ice Age and its implication for sustained long term shifts in the ITCZ Abstract: Meghan Gray Senior Thesis, USC Earth Sciences, Spring 2007
Drought! When Do We Know It s Over?
 Drought! When Do We Know It s Over? Nolan J. Doesken Colorado Climate Center Colorado State University http://ccc.atmos.colostate.edu Presented at the 2004 Peak to Prairie Landscape Symposium, February
White Paper. Draft Variable Depth Root Zones for Golf Putting Greens. James Crum and Trey Rogers. Michigan State University.
 White Paper Draft Variable Depth Root Zones for Golf Putting Greens James Crum and Trey Rogers Michigan State University January 2017 Variable-Depth Root Zones for Golf Putting Greens Introduction The
A review of 2015 fatal collision statistics as of 31 December 2015
 A review of fatal collision statistics as of 31 December This report summarises the main trends in road fatalities that have emerged in. This has been prepared by the Road Safety Authority following analysis
Applied Earth Science Climate Exam Practice Questions Page 1
 Name: 1. Which combination of climate factors generally results in the coldest temperatures? A) low elevation and low latitude B) low elevation and high latitude C) high elevation and low latitude D) high
A Snapshot of Our Changing Climatology
 A Snapshot of Our Changing Climatology Dr. Kenneth ( Kenny ) Blumenfeld Sr. Climatologist DNR State Climatology Office 11/17/2018 1 Items to bear in mind 1. Climate news elsewhere may not apply here 2.
S EVERAL YEARS AGO the
 Finding Solutions for Poorly Drained Greens by JAMES T. SNOW National Director, USGA Green Section Greens subject to poor air circulation and shade do not dryas quickly as greens in more exposed locations.
Manitoba Water Stewardship. Coping with Drought. Drought Research Initiative Workshop. Inn at the Forks, Winnipeg. A.A. Warkentin. January 11-13, 2007
 Manitoba Water Stewardship Coping with Drought Drought Research Initiative Workshop Inn at the Forks, Winnipeg A.A. Warkentin January 11-13, 2007 Annual Renewal of Water Supplies Important Precipitation-based
2017 Cricket Frass as a Potential Nitrogen Fertility Source
 2017 Cricket Frass as a Potential Nitrogen Fertility Source Dr. Heather Darby, UVM Extension Agronomist Abha Gupta, Erica Cummings, Lindsey Ruhl, and Sara Ziegler UVM Extension Crops and Soils Technicians
Example Report. EXAMPLE How to perform. infrared trending of Electric Motors. Plant Air Wash Supply Fan. Temperature Rise = High Temp = Ambient =
 Plant Air Wash Supply Fan How to perform in-house infrared trending of Electric Motors High Temp = Ambient = Temperature Rise = Example Report Plant Air Wash Supply Fan Procedure for trending temperatures
CALIFORNIA DEPARTMENT OF FISH AND WILDLIFE RECOMMENDATIONS ON ADDITIONAL WINTER-RUN PROTECTIONS IN 2016 OCEAN FISHERIES
 Agenda Item E.1 CDFW Supplemental Report April 216 CALIFORNIA DEPARTMENT OF FISH AND WILDLIFE RECOMMENDATIONS ON ADDITIONAL WINTER-RUN PROTECTIONS IN 216 OCEAN FISHERIES In April 215, CDFW recommended
of various turfgrass species How to save irrigation water without sacrificing Turfgrass evapotranspiration coefficients
 How to save irrigation water without sacrificing turf quality Part 1 Turfgrass evapotranspiration (ET) and crop coefficients Water use of various turfgrass species on greens and fairways By Trygve S. Aamlid,
NEVADA SLOT MACHINES: HISTORICAL HOLD PERCENTAGE VARIATIONS ANNUAL AND MONTHLY HOLD PERCENTAGES, CENTER FOR GAMING RESEARCH, NOVEMBER 2017
 NEVADA SLOT MACHINES: HISTORICAL HOLD PERCENTAGE VARIATIONS ANNUAL AND MONTHLY HOLD PERCENTAGES, 2004-2017 CENTER FOR GAMING RESEARCH, NOVEMBER 2017 Executive Summary Hold percentage the portion of money
Rice Yield And Dangue Haemorrhagic Fever(DHF) Condition depend upon Climate Data
 Condition depend upon Climate Data") Rice Yield And Dangue Haemorrhagic Fever(DHF) Condition depend upon Climate Data Dr Lai Lai Aung, Assistant Director( Met Service) Dr Khaing Khaing Soe Assistant Director(Public Health) Dr Thin Nwe htwe
Rice Yield And Dangue Haemorrhagic Fever(DHF) Condition depend upon Climate Data Dr Lai Lai Aung, Assistant Director( Met Service) Dr Khaing Khaing Soe Assistant Director(Public Health) Dr Thin Nwe htwe
System Flexibility Indicators
 System Flexibility Indicators Place your chosen image here. The four corners must just cover the arrow tips. For covers, the three pictures should be the same size and in a straight line. Operational Forum
P artners in. Peanut Variety Tests. rogress. C. B. Godsey and W. Vaughan Department of Plant and Soil Sciences. Variety Tests.
 P artners in Peanut Variety Tests C. B. Godsey and W. Vaughan Department of Plant and Soil Sciences 2009 p made possible through OPC and NPB support ARSOK-R1 was consistently in the higher yield group
Chicago District Golf Association Scouting Report
 Chicago District Golf Association Scouting Report 9-1-13 Timing, timing, timing. It s that part of the year where winding down starts with much of the heavy play starting to decline on the courses and
Local Winds & Microclimates. Unit 2- Module 1
 Local Winds & Microclimates Unit 2- Module 1 Objectives Overview of local winds (sea & land breezes, valley winds) Overview of microclimates (valley, urban, woodland) Local Winds Local Winds Local winds
Hydrological Condition Report including the issues of High Flow Fluctuation in Chiang Saen
 Hydrological Condition Report including the issues of High Flow Fluctuation in Chiang Saen Technical Symposium for ESCIR and MRC on Social Impact Assessment in River Basin Management Sothea KHEM, HENG
Tuesday, January 11, :11 AM (CST)
") Tuesday, January 11, 2011 11:11 AM (CST) -Assessment of current water conditions - Precipitation Forecast - Recommendations for Drought Monitor Upper Colorado Normal Precipitation Upper Colorado River
Tuesday, January 11, 2011 11:11 AM (CST) -Assessment of current water conditions - Precipitation Forecast - Recommendations for Drought Monitor Upper Colorado Normal Precipitation Upper Colorado River
Water Management Plan For The Blue Ocean Golf Club
 Water Management Plan For The Blue Ocean Golf Club A water management plan reviews current water management practices and identifies opportunities for improvement in water use efficiency/conservation for
Recent Events in the Market for Canadian Snow Crab
 Recent Events in the Market for Canadian Snow Crab Overview The quantity of snow crab produced and exported by Canada increased dramatically through the late 1990s, but has levelled off and remained quite
DMU 005 Antrim County Deer Management Unit
 DMU 005 Antrim County Deer Management Unit Area Description Antrim County Deer Management Unit is in the Northern Lower Peninsula Region (NLP). It has roughly 74 square miles (47,451 acres) of public land
Golf Course Environmental Profile
 Golf Course Environmental Profile Phase II, Volume I Water Use and Conservation Practices on U.S. Golf Courses Funded by the USGA through the Environmental Institute for Golf, the philanthropic organization
Danish gambling market statistics Third quarter, 2017
 Danish gambling market statistics Third quarter, Third Quarter, 7. december Third Quarter, Danish gambling market statistics 1 Indhold A. Introduction... 2 B. Quarterly market statistics for the Danish
DEC DASHBOARD. Positive Response Compliance DEC. Compliant Tickets : On-Time Performance Analysis. December % Late.
 Positive Response Compliance 215 Compliant 215 Non-Compliant 216 Compliant 216 Non-Compliant 1% 87% 96% 86% 96% 88% 97% 89% 97% 89% 98% 88% 97% 86% 96% 92% 97% 93% 97% 94% 97% 96% 97% 94% 97% 8% 6% 4%
8/29/20098 SAHRA - Watershed Visualization
 Module 3 Narration Southwestern Water Cycle 001.wav 26 sec 002.wav 10 sec 003 wav 17 sec Water on Earth is constantly on the move. Water continually circulates between the surface of Earth and the atmosphere
Image courtesy of NASA/GSFC
 Image courtesy of NASA/GSFC Impact of Weather Extremes and Climate Change on Midwest Agriculture Eugene S. Takle Professor Department of Agronomy Department of Geological and Atmospheric Science Director,
Researchers propose a cost effective solution for failing native soil athletic fields across Michigan.
 Sand Cap Build-up Systems for Michigan High School Fields A.R. Kowalewski, J.R. Crum and J.N. Rogers, III Department of Crop and Soil Sciences Michigan State University January 2008 Researchers propose
Arizona Climate Summary
 Arizona Climate Summary March 2012 Summary of conditions for February 2012 February 2012 Temperature and Precipitation Summary February 1 st 17 th : February continued where January left off with a high
Weather of the Promised Land
 Biblical Geography Basics NT110 LESSON 10 of 10 Jack Beck, Ph.D. Experience: Author and faculty member at Jerusalem University College in Israel Introduction There s geography in my Bible. Remember, we
Arizona Climate Summary September 2012
 Arizona Climate Summary September 2012 Summary of conditions for August 2012 August 2012 Temperature and Precipitation Summary August 1 st 15 th : During the month of August, at least one location received
Golf Course Managers Monthly Report
 Golf Course Managers Monthly Report Church Course MAINTENANCE Water Management on a Links Golf Course Low spots The term links historically applies specifically to strips of land in seaside areas that
Objective: Experimental Procedures:
 Evaluation of various soil surfactants for creeping bentgrass summer fairway management. Purdue University, 2006 Cale A. Bigelow and Adam C. Moeller Agronomy Department Objective: Experimental Procedures:
SESSION THREE: FACTORS THAT INFLUENCE WEATHER IN SOUTH AFRICA
 SESSION THREE: FACTORS THAT INFLUENCE WEATHER IN SOUTH AFRICA KEY CONCEPTS: In this section we will focus on the following aspects: Factors determining the weather of South Africa Influence of the oceans
Baberton Golf Club. Advisory Report on the Golf Course. Report Date: 10 th December 2015 Consultant: Ian Craig. Baberton Golf Club 1
 Baberton Golf Club Advisory Report on the Golf Course Report Date: 10 th December 2015 Consultant: Ian Craig Baberton Golf Club 1 CONFIDENTIAL Date of Visit: 22 nd October 2015 Visit Objective: Present:
Design Criteria Data
 MEMPHIS TN Latitude = 35.35 N WMO No. 723345 Longitude = 89.87 W Elevation = 322 feet Period of Record = 1973 to 1996 Average Pressure = 29.68 inches Hg Design Criteria Data Mean Coincident (Average) Values
Design Criteria Data
 FRESNO CA Latitude = 36.77 N WMO No. 72389 Longitude =119.7 W Elevation = 328 feet Period of Record = 1972 to 1996 Average Pressure = 29.62 inches Hg Design Criteria Data Mean Coincident (Average) Values
Danish gambling market statistics First quarter 2017
 Danish gambling market statistics First quarter 2017 6. juni 2017 Danish gambling market statistics 1 Introduction The Danish gambling market underwent a partial liberalisation in 2012, with the markets
Design Criteria Data
 TUCUMCARI NM Latitude = 35.18 N WMO No. 723676 Longitude =13.6 W Elevation = 465 feet Period of Record = 1973 to 1996 Average Pressure = 25.86 inches Hg Design Criteria Data Mean Coincident (Average) Values
UNIVERSITY OF CALIFORNIA Economics 134 DEPARTMENT OF ECONOMICS Spring 2018 Professor David Romer
 UNIVERSITY OF CALIFORNIA Economics 134 DEPARTMENT OF ECONOMICS Spring 2018 Professor David Romer LECTURE 2 OVERVIEW OF THE GREAT DEPRESSION January 22, 2018 I. THE 1920S A. GDP growth and inflation B.
High-Rise Fireground Field Experiments Results
 High-Rise Fireground Field Experiments Results These graphs show average times for each critical task by crew size. Percentage calculations for all the charts were based on the overall time from detection
Appendix ELP El Paso, Texas 2003 Annual Report on Freeway Mobility and Reliability
 (http://mobility.tamu.edu/mmp) Office of Operations, Federal Highway Administration Appendix ELP El Paso, Texas 2003 Annual Report on Freeway Mobility and Reliability This report is a supplement to: Monitoring
Turf-Tec Precipitation and Uniformity Gauges
 Turf-Tec Precipitation and Uniformity Gauges NEW Design!!! Precipitation and Uniformity Gauges can be set up in a head to head layout or in a grid pattern. Sold in a set of 16 large gauges and 4 small
MBMG Butte Mine Flooding Monthly Report BMFOU Consent Decree BU-SEH Remedial Action Monitoring Program Contract No TO-35 September 2013
 MBMG Monthly Report BMFOU Consent Decree 02-35-BU-SEH Remedial Action Monitoring Program Contract No. 400022-TO-35 September 20 The Montana Bureau of Mines and Geology (MBMG) continued to perform monitoring
Site Description: Tower Site
 Wind Resource Summary for Elizabeth Site Final Report Colorado Anemometer Loan Program Monitoring Period: 7/3/6 /15/7 Report Date: December 22, 7 Site Description: The site is.6 miles northeast of the
2004 GREEN MAINTENANCE STUDIES Dr. Thomas Nikolai, L.D. McKinnon, C. Johnson Michigan State University
 2004 GREEN MAINTENANCE STUDIES Dr. Thomas Nikolai, L.D. McKinnon, C. Johnson Michigan State University Putting greens must have turf of fine texture and of uniform surface. To accomplish this, close cutting
Weather and Climate Impacts on Water Supply
 Weather and Climate Impacts on Water Supply Nolan Doesken Colorado Climate Center Atmospheric Science Department Colorado State University http://ccc.atmos.colostate.edu Presented at the South Platte Forum,
The Golf Course Is Back
 The Golf Course Is Back st May 2018 1 st The start of the season is now upon us and the first competitions have already come and gone. The course has started to get some much needed definition due to them
Water Resources Planning Department. Projection Analysis Work Sheets for Bakersfield District. Printed on 4/12/2016 at 2:11 PM
 Water Resources Planning Department Projection Analysis Work Sheets for Bakersfield District 2015 Printed on 4/12/2016 at 2:11 PM Table of Contents for Worksheets Worksheet Title 1 Annual Services 2 Service
Colorado Weather and Climate Update
 Colorado Weather and Climate Update Nolan J. Doesken State Climatologist Colorado Climate Center, Atmospheric Science Department, Colorado State University Presented to Colorado Livestock Association,
WIM #36 MN 36 MP 15.0 LAKE ELMO APRIL 2014 MONTHLY REPORT
 WIM #36 MN 36 MP 15.0 LAKE ELMO APRIL 2014 MONTHLY REPORT In order to understand the vehicle classes and groupings, the MnDOT Vehicle Classification Scheme and the Vehicle Class Groupings for Forecasting
JAN DASHBOARD. Positive Response Compliance JAN. Compliant Tickets : On-Time Performance Analysis. January % Late.
 Positive Response Compliance 216 Compliant 216 Non-Compliant 217 Compliant 217 Non-Compliant 1% 96% 97% 8% 6% 4% 2% 4% 3% FEB MAR APR MAY JUN JUL AUG SEP OCT NOV DEC 8% Late Compliant Tickets : On-Time
STATIONARY SPRINKLER IRRIGATION SYSTEM
 STATIONARY SPRINKLER North Carolina Cooperative Extension Service North Carolina State University STATIONARY SPRINKLER General Guidelines Operating an irrigation system differently than assumed in the
The Awesome, Wonderful, Beautiful, Exciting and Terrible Climate of the West What a Hoot!
 The Awesome, Wonderful, Beautiful, Exciting and Terrible Climate of the West What a Hoot! Nolan J. Doesken, State Climatologist Colorado Climate Center Presented to Four States Irrigation Council, 54 th
WeatherTRAK ET plus Series Quick Reference Guide
 For 6, 9, 12, 18 and 24 station models plus Quick Start Guide WeatherTRAK plus Series Quick Reference Guide 3. 4. 5. 6. Upper line knob. Controls the upper line of the display. Function knob. Provides
Global Climate Change: Just the Facts
 Global Climate Change: Just the Facts Nolan Doesken State Climatologist, Colorado Climate Center Atmospheric Science Department Colorado State University Presented at Club 20 Fall Meeting, Grand Junction,
Back to TOC. Title: Encouraging adoption of precision irrigation technology through on-course application and demonstration of water savings
 2017-37-647 Title: Encouraging adoption of precision irrigation technology through on-course application and demonstration of water savings Project Leaders: Josh Friell1, Brian Horgan2, Sam Bauer2, and
CCoWS. Central Coast Watershed Studies. Summary of Precipitation and Streamflow for Potrero and San Clemente Creeks in 2010
 Central Coast Watershed Studies CCoWS Summary of Precipitation and Streamflow for Potrero and San Clemente Creeks in Water-Year 2010 Santa Lucia Preserve Monterey County, California Publication No. WI-2011-01
WARM-SEASON TURFGRASS N RATES & IRRIGATION BMP VERIFICATION DEP WM 869 COMPLETED STUDIES REPORT. Principal Investigators
 WARM-SEASON TURFGRASS N RATES & IRRIGATION BMP VERIFICATION DEP WM 869 COMPLETED STUDIES REPORT Principal Investigators Dr. Laurie E. Trenholm University of Florida, Institute of Food and Agricultural
Manufacturers Continue Capacity Expansion as Technology Orders Grow
 Contact: Penny Brown, AMT, 703-827-5275 pbrown@amtonline.org For Release: October 8th, 2018 Manufacturers Continue Capacity Expansion as Technology Orders Grow Manufacturing technology orders posted an
Bicycle Crashes. Number of Bike Crashes. Total Bike Crashes. are down 21% and severe bike crashes down 8% since 2013 (5 years).
.") Bicycle Crashes The City of Fort Collins is well known for its bike culture, and there is a strong focus on encouraging increased riding. Bike safety is an important component of supporting these efforts.
Bicycle Crashes The City of Fort Collins is well known for its bike culture, and there is a strong focus on encouraging increased riding. Bike safety is an important component of supporting these efforts.
2009 Forecast for the Chicago CBD
 TR Mandigo & Company 2009 Forecast for the Chicago CBD Presented to: Council of Chicago Hotel General Managers By Ted Mandigo Director of TR Mandigo & Company 8/4/2009 Let s cut to the chase. There s a
Wisconsin 511 Traveler Information Annual Usage Summary January 3, Wisconsin 511 Phone Usage ( )
") Wisconsin 511 Traveler Information 211 Annual Usage Summary January 3, 212 Overall to-date Summary 36 months of operation 1,16,63 total calls the 1 Million mark was passed on December 3, 212 3,627,527
Wisconsin 511 Traveler Information 211 Annual Usage Summary January 3, 212 Overall to-date Summary 36 months of operation 1,16,63 total calls the 1 Million mark was passed on December 3, 212 3,627,527
Seasonal Summary. For The Great Lakes. Winter
 Seasonal Summary For The Great Lakes Winter 2007-2008 Produced by the North American Ice Service August 2008 Table of Contents General General overview of the past season...4 Lake Superior...9 Lake Michigan
Recent changes in temperature and rainfall trends and variability over Bangladesh
 Recent changes in temperature and rainfall trends and variability over Bangladesh Authors: Dewan Abdul Quadir; Catharien Terwisscha van Scheltinga; Fulco Ludwig Bangladesh Delta Plan Project & Toma Rani
Canada s Natural Systems. Canadian Geography 1202
 Canada s Natural Systems Canadian Geography 1202 Canada s Natural Systems Natural System: A system found in nature Here are the four natural systems that we will explore in the next few weeks 1. Canada
COURSE SUPERINTENDENT S REPORT
 COURSE SUPERINTENDENT S REPORT 24 th July 218 21 st August 218 July rainfall 218 2mm Same time last year June 1mm Number of rain days 1 YTD 218 19.3 YTD 217 442.4mm 35 325 3 275 25 225 2 175 15 125 1 75
Why do different beaches have different types of vegetation?
 Why do different beaches have different types of vegetation? Allan Crowe Environment Canada National Water Research Institute Burlington, Ontario Environment Canada Environnement Canada NATIONAL WATER
The Spartan Cap Athletic Field System
 The Spartan Cap Athletic Field System A.R. Kowalewski 1, J.R. Crum 2 and J.N. Rogers, III 2 1 Abraham Baldwin Agricultural College, Environmental Horticulture, Tifton, GA 2 Michigan State University, Crop
Utilizing Drought-Resistant Plants in Urban Riparian Areas. Texas A&M Institute of Renewable Natural Resources Texas Water Resources Institute
 Utilizing Drought-Resistant Plants in Urban Riparian Areas Texas A&M Institute of Renewable Natural Resources Texas Water Resources Institute Research Objective To analyze urban landscaping for outdoor
Meteorology of Monteverde, Costa Rica 2007
 Meteorology of Monteverde, Costa Rica 2007 Technical Report submitted to the Monteverde Institute Andrew J. Guswa, Associate Professor, Picker Engineering Program Amy L. Rhodes, Associate Professor, Department
Staying in Tune with South Florida s Water Cycle for Scientists, Managers, and Policy Makers in 5 Minutes per Week
 Staying in Tune with South Florida s Water Cycle for Scientists, Managers, and Policy Makers in 5 Minutes per Week Robert Sobczak (Big Cypress Nat l Pres), Todd Hopkins (FWS), Kevin Kotun (Everglades National
August 2018 Las Vegas Strip Gaming Revenue Analysis
 August 2018 Las Vegas Strip Gaming Revenue Analysis Brent Pirosch Director of Gaming Consulting CBRE T: 702.369.4803 brent.pirosch@cbre.com GGG has completed market studies and feasibility studies for
Producer Price Index - Agriculture (PPI-A) (January March 2001)
 (January March 2001)") Producer Price Index - Agriculture (PPI-A) (January March 2001) Introduction The Producer Price Index-Agriculture (PPI-A) gives a measure of the average change in the selling prices which producers receive
Producer Price Index - Agriculture (PPI-A) (January March 2001) Introduction The Producer Price Index-Agriculture (PPI-A) gives a measure of the average change in the selling prices which producers receive
Winter 2015/ Halibut & Blackcod Market Bulletin
 Winter 215/216 - Halibut & Blackcod Market Bulletin The Seafood Market Information Service is funded by a portion of the seafood marketing assessment paid by Alaska seafood producers. McDowell Group provides
SARASOTA BAY ESTUARY PROGRAM OYSTER HABITAT MONITORING RESULTS: YEAR 1. Jay R. Leverone
 SARASOTA BAY ESTUARY PROGRAM OYSTER HABITAT MONITORING RESULTS: YEAR 1 by Jay R. Leverone Mote Marine Laboratory 1600 Ken Thompson Parkway Sarasota, Fl 34236 to Gary Raulerson Sarasota Bay Estuary Program
LAB H - ATMOSPHERE AND CLIMATE LAB II STABILITY AND PRECIPITATION PATTERNS
 Introduction LAB H - ATMOSPHERE AND CLIMATE LAB II STABILITY AND PRECIPITATION PATTERNS This lab will provide students with the opportunity to become familiar with the concepts of atmospheric stability
Climate Issues A State s s Perspective
 Climate Issues A State s s Perspective Nolan J. Doesken Colorado State Climatologist, President Elect AASC Colorado Climate Center, Colorado State University FYO8 Central Regional MIC/HIC Conference, Kansas
Danish gambling market statistics First quarter 2018
 Danish gambling market statistics First quarter, 2018 First quarter 2018 28. juni 2018 Indhold A. Introduction... 1 B. Overview over market developments in first quarter of 2018... 2 C. Online casinos...
6 th Meeting of the Scientific Committee Puerto Varas, Chile, 9-14 September 2018
 6 th Meeting of the Scientific Committee Puerto Varas, Chile, 9-14 September 218 SC6-Doc24 China s Annual Report, part II (Jumbo squid) Gang Li, Bilin Liu, Luoliang Xu & Xinjun Chen Annual Report of China
Os eventos extremos estão aumentando na Amazônia? Javier Tomasella e José A. Marengo. Centro de Ciência do Sistema Terrestre, INPE
 Os eventos extremos estão aumentando na Amazônia? Javier Tomasella e José A. Marengo Centro de Ciência do Sistema Terrestre, INPE Hamburgo, Março 2011 The Amazon Basin River Drainage area (km 2 ) Rainfall
Overview of tuna fisheries in the Western and Central Pacific Ocean, including economic conditions 2015 (WCPFC-SC /GN WP-1)
") Overview of tuna fisheries in the Western and Central Pacific Ocean, including economic conditions 2015 (WCPFC-SC12-2016/GN WP-1) Peter Williams1 and Peter Terawasi2 Co-presented by Dr Chris Reid Twelfth
Overview of tuna fisheries in the Western and Central Pacific Ocean, including economic conditions 2015 (WCPFC-SC12-2016/GN WP-1) Peter Williams1 and Peter Terawasi2 Co-presented by Dr Chris Reid Twelfth