Wind Atlas for South Africa (WASA) Best practice guide for application of WASA
|
|
|
- Violet Shepherd
- 5 years ago
- Views:
Transcription
1 Downloaded from orbit.dtu.dk on: Oct 20, 2018 Wind Atlas for South Africa (WASA) Best practice guide for application of WASA Hansen, Jens Carsten; Mortensen, Niels Gylling; Cronin, Tom; Nielsen, Morten; Hahmann, Andrea N.; Badger, Jake; Larsén, Xiaoli Guo Publication date: 2014 Document Version Publisher's PDF, also known as Version of record Link back to DTU Orbit Citation (APA): Hansen, J. C., Mortensen, N. G., Cronin, T., Nielsen, M., Hahmann, A. N., Badger, J., & Larsén, X. G. (2014). Wind Atlas for South Africa (WASA) Best practice guide for application of WASA. DTU Wind Energy. DTU Wind Energy E, Vol General rights Copyright and moral rights for the publications made accessible in the public portal are retained by the authors and/or other copyright owners and it is a condition of accessing publications that users recognise and abide by the legal requirements associated with these rights. Users may download and print one copy of any publication from the public portal for the purpose of private study or research. You may not further distribute the material or use it for any profit-making activity or commercial gain You may freely distribute the URL identifying the publication in the public portal If you believe that this document breaches copyright please contact us providing details, and we will remove access to the work immediately and investigate your claim.


2 Wind Atlas for South Africa (WASA) Best practice guide for application of WASA Department of Wind Energy E Report 2016 Hansen, J.C., N.G. Mortensen, T. Cronin, M. Nielsen, A. Hahmann, J. Badger, X. Larsén, E. Mabille and E. Prinsloo DTU Wind Energy E-0073 April 2014
3 Authors: Hansen, J.C., N.G. Mortensen, T. Cronin, M. Nielsen, A. Hahmann, J. Badger, X. Larsén, E. Mabille and E. Prinsloo Title: Wind Atlas for South Africa (WASA) Best practice guide for application of WASA DTU Wind Energy E-0073 April 2014 Summary (max 2000 characters): The present report is a best practice guide for application of results from the Wind Atlas for South Africa (WASA). A general description of the methodological framework the wind atlas methodology is given, including validation results of the numerical wind atlas at 10 measurement sites. The atlas can be applied for different purposes from siting of wind turbines to planning of wind farms and the requirements and considerations for this are outlined. Furthermore, a number of case studies are described, which illustrate different applications and may serve as a guideline and inspiration for new wind energy projects. The report also contains detailed instructions for accessing and using the WASA data. ISBN no Project no I-1 Sponsorship Danida Front page default Pages: 57 Tables: 9 References: 8 Technical University of Denmark Department of Wind Energy Frederiksborgvej 399 Building Roskilde Denmark Telephone nimo@dtu.dk

 Eugéne Mabille and Eric Prinsloo Council for Scientific and")
4 Wind Atlas for South Africa (WASA) Western Cape and parts of Northern and Eastern Cape Best practice guide for application of WASA Jens Carsten Hansen, Niels G. Mortensen, Tom Cronin, Morten Nielsen, Andrea Hahmann, Jake Badger and Xiaoli Larsen Technical University of Denmark (DTU) Eugéne Mabille and Eric Prinsloo Council for Scientific and Industrial Research (CSIR) April 2014
5 Best practice guide for application of WASA Copyright 2014 All rights reserved. No part of this publication may be reproduced, stored in a retrieval system, or transmitted in any form or by any means, without the express written permission of the copyright owners. ii
6 Contents 1 Introduction WP04 of the WASA Project 1 2 Wind atlas methodology Introduction Microscale observational wind atlas Mesoscale numerical wind atlas Measurements 6 3 Verification of the Numerical Wind Atlas Some general aspects of uncertainties and sensitivities in wind resource assessment and production estimation 12 4 Application of the wind atlases Typical users and uses of the atlas Applications of the numerical wind atlas Wind-climatological inputs Topographical inputs Application in wind energy projects Wind farm calculations Wind resource mapping Reliability of wind resource estimates 22 5 Design wind condition A brief introduction to the IEC standard Assessment of wind conditions 25 6 Case studies Introduction Case study Planning Case study Wind farm energy yield Case study Extreme wind analysis 42 7 Accessing and using the WASA data 44 8 Concluding remarks and recommendations for applications 48 9 References 50 A. List of requirements, best practices and recommendations 52 i
7 ii
8 1 Introduction 1.1 WP04 of the WASA Project Work Package 04 (WP04) entitled Application is a part of the Wind Atlas for South Africa (WASA) project. Means / Immediate Development Objectives Objectives Improve incentive for investments in wind energy WP2: Establish 10 high quality wind measurement stations to provide 1 year of measurement data for calibration of mesomodelling Improve conditions for realization of national goals for development of wind energy Reduce cost of electricity from wind energy Improve efficiency of planning for wind energy Improve knowledge & quality of wind resource assessment methods & tools as well as to ensure availability of tools / data for planning / application for wind farm developments, off grid electrification & extreme wind Improve benefit and reduce uncertainty of investments in wind energy Create Numerical Wind Atlas (NWA) for South Africa through development of NWA for coastal areas of 3 provinces and capacity and skills development enabling NWA and application for the rest of South Africa WP 3: Verification of meso- and microscale modelling resulting in (i) Observational Wind Atlas (ii) CSIR established as resource centre for wind monitoring and micro scale modelling (iii) tools and software WP 4: Capacity building with respect to NWA and database application (i) min. 2 mid-term workshops for invited stakeholders (ii) Micro-scale resource map for 30-50% of the modelled coastal areas, (iii) min. 2 end-term stakeholder workshops Work package 1: Carry out mesoscale modelling and development of models and methods for coastal areas of Northern, Western and Eastern Cape: (a) Numerical Wind Atlas, database, (b) Research results for dynamical downscaling for wind resource mapping (iii) UCT established as resource centre for meso scale modelling Figure 1. Objective tree of the WASA project as described by the Project Document. In view of the objectives of the WASA project as shown in Figure 1, the project should build expertise in mesoscale modelling, microscale modelling with WAsP as well as in measurement techniques, data 1
9 analysis and preparation of wind atlases. This has all been achieved through WPs 01, 02, 03 and 05. However, the use of results for actual applications has been referred to this work package, WP04, in order to provide a particular focus on this aspect for relevant parties other than the project partners developing the wind atlas SANEDI, UCT, CSIR, SAWS and DTU. This report seeks to collect the necessary information and instructions for any interested party to be able to apply the results of the Wind Atlas for South Africa (WASA) project. The report will briefly describe the Wind Atlas Method its history and how it has been used by the project to generate o the Numerical Wind Atlas (KAMM based) o the Numerical Wind Atlas (WRF based) o the Observational Wind Atlases at WASA masts WM01-WM10 o the Extreme Wind Atlas The application opportunities who would be able to use the Numerical Wind Atlas and for what How to apply the Numerical Wind Atlas for wind energy planning or wind farm project development by employing the Wind Atlas Method and WAsP Case studies to illustrate possible ways of applying the Numerical Wind Atlas Summing-up best practices and brief guidance 2 Wind atlas methodology 2.1 Introduction The wind atlas methodology was developed in the 80 s and used initially for the creation of the European Wind Atlas. The wind resource assessment for the EWA highlighted the need for a microscale flow model and consequently the Wind Assessment software Program (WAsP) was conceived and developed at DTU Wind Energy (then Risø National Laboratory). WAsP made what we now call an observational wind atlas as described below. During the 90 s, techniques to employ mesoscale models were developed, which made it possible to model larger domains, mesoscale effects, and long-term wind climates. Recently, the techniques have been combined for the development of wind atlases in countries with scarce measurement stations and systematic verification against known values has proven effective. This section of the application report briefly describes the updated state-of-the-art of the wind atlas methodology as it is used in the WASA project. Figure 2 illustrates the elements in tabular form, showing the interfaces and process of: Microscale modelling leading to the Observational Wind Atlas Mesoscale modelling leading to the Numerical Wind Atlas Measurements as inputs to the Observational Wind Atlas and Verification Verification comparing the Observational and Numerical Wind Atlases to Measurement locations Application of results 2
10 Figure 2. Wind atlas methodologies use wind measurements, as well as microscale and mesoscale modelling for wind resource assessment and siting. 2.2 Microscale observational wind atlas As the name implies, an observational wind atlas is based on observed wind climates from a dense network of meteorological stations or, alternatively, it is a wind atlas with a geographical validity limited to the immediate surroundings of the mast (or masts) from which the observations for the wind atlas were made. The latter is the case in this project, using 10 masts for the verification of the mesoscale modelling (the Numerical Wind Atlas) that at the same time provide data for 10 discrete Observational Wind Atlases. The observed wind climates contain the wind speed and direction distributions derived from long-term time-series of wind speed and direction measurements at the meteorological stations. The observed wind climates are thus representative for specific locations and heights above ground level, so, in order to be able to predict the wind climate at a given wind turbine or wind farm site, the observed wind climates must be transformed into generalised regional wind climates. This may be done using the wind atlas methodology of the European Wind Atlas, see Figure 3. Employing detailed descriptions of terrain elevation, land-use and the occurrence of sheltering obstacles around each meteorological station, the observed wind climate is transformed into what would have been measured at the location of the station if the surroundings were completely flat, featureless and with a homogeneous surface and the measurements had been taken at 10, 25, 50, 100 and 200 m a.g.l. Through this transformation procedure, the observed wind climate is freed from the influence of local topography to become regionally representative. This results in an observational wind atlas, given in the form of detailed statistics of the generalized wind speed and direction distributions for the locations of the meteorological stations. These data sets can then be used as inputs to the application process, whereby the same models are used in reverse to transform the regional wind climate to the predicted wind climate at any specific site and height near the station. 3


11 Figure 3. The wind atlas methodology will generate the Observational Wind Atlas (regional wind climate) for the location of the mast providing the wind data (observed wind climate). 2.3 Mesoscale numerical wind atlas Numerical wind atlas methodologies have been devised to solve the issue of insufficient wind measurements, which render wind resource mapping efforts through observational methodologies problematic. Several so-called downscaling approaches exist, connecting the large-scale long-term global datasets via meso-scale modelling to the small-scale local wind climate at a given location. In this project two such methods have been applied. a) The KAMM/WAsP method developed at DTU (formerly Risø National Laboratory). An approach called statistical-dynamical downscaling is used [Frey-Buness, F., D. Heimann, R. Sausen, 1995.]. The basis for the method is that there is a robust relationship between meteorological situations at the large-scale and meteorological situations at the small-scale. Information about the large-scale meteorological situation is freely available from the NCEP/NCAR reanalysis data-set, see Kalnay et al Figure 4 shows a schematic diagram illustrating how the mesoscale modelling results are combined to give regional wind climates in the numerical wind atlas system. The mesoscale model, KAMM, is used to create a wind map for N, typically 150, different wind classes, representing the climate of the region. The results are combined by taking into account the frequency of occurrence of each wind class to create the mesoscale wind resource. The mesoscale wind resource can be transformed to the generalised regional wind climates, thus arriving at a numerical wind atlas (e.g. with 5 km resolution) comparable to the observational wind atlas (where observations exist). b) An adapted statistical-dynamical downscaling approach similar to the KAMM/WAsP method, however instead of KAMM using the mesoscale model WRF. 4

![modelling mean wind speed [m/s] 100 m above ground level, flat terrain, 3 cm roughness everywhere at 3km x 3 km resolution The results of the mesoscale numerical wind atlas can be](/docs-images/89/98345608/images/12-1.jpg "given in the form of maps of wind climate for conditions as they are represented in the mesoscale modelling, and as maps of wind climate for generalized conditions - regional wind")
12 Both these methods are described in great detail in the dedicated reports regarding the meso-scale modelling part of the project. Figure 4: Schematic showing the numerical wind atlas methodology Figure 5: The WASA NWA wind resource map for South Africa showing the generalised wind speeds based on WRF mesoscale modelling mean wind speed [m/s] 100 m above ground level, flat terrain, 3 cm roughness everywhere at 3km x 3 km resolution The results of the mesoscale numerical wind atlas can be given in the form of maps of wind climate for conditions as they are represented in the mesoscale modelling, and as maps of wind climate for generalized conditions - regional wind climates. For generalized conditions a conversion is carried out 5

13 to give the wind for flat terrain and homogeneous roughness. Figure 5 shows the wind resource map for South Africa (Western Cape and parts of Northern and Eastern Cape). The results are also given in the form of a database of detailed statistics giving the generalized wind speed and direction distributions for any location within the calculation domain for a set of standard heights above ground level. This information is given in a file format that is directly compatible with the WAsP software. 2.4 Measurements Figure 6 shows the positions of the project measurement sites in South Africa (Western Cape and parts of Northern and Eastern Cape). A total of 10 sites featuring 60 m masts are part of the project measurement programme. The site selection was aimed at best possibly fulfilling the criteria developed with the purpose of verification of the Numerical Wind Atlas. For details please see the dedicated Measurement Report and the Site Description Report, both available on At all 10 sites WM1, WM2, WM3, WM4, WM5, WM6, WM7, WM8, WM9 and WM10 the 60m masts are instrumented with DTU developed wind speed sensors. For the purpose of verification of the Numerical Wind Atlas, data from three years (Oct 2010 Sep 2013) were chosen. The data are available from the project database in the public domain through Permission to download data may be obtained from the download site subject to registration. Figure 6. Overview map showing the location of the meteorological masts referred to in the text Mast positions The positions of the meteorological masts were determined carefully and verified by independent visits as reported in the Site Description Report available on see Table 1. 6
14 Table 1. Mast coordinates and elevations. The datum used is WGS 84; elevations are determined by the WAsP flow model from SRTM3 maps with 5-m height contours. Mast ID Longitude Latitude Elevation Easting Northing UTM [ E] [ N] [m a.s.l.] [m] [m] zone WM WM WM WM WM WM WM WM WM WM Layout of wind measurement masts and sensor overview The ten 60 m masts, WM1-WM10, instrumented with DTU developed anemometers, have been the focus of the measurement programme and of the verification. The instrumentation has been used for studies worldwide and for obtaining maximum data recovery. The measurement equipment is described in detail in the dedicated Measurement Report. The instrumentation in each height level is briefly listed in Table 2 and the layout is shown in Figure 7. Table 2.: List of sensors and types used at each measurement station. Sensor instrument Heights Cup 5 WindSensor 10m, 20m, 40m, 60m, 62m anemometers P2546A Wind vane 2 Vector Instruments 20m, 60m W200P Absolute 1 Vaisala 60m temperature HMP45A Temperature 1 Risø DTU 60m - 10m gradient P2642A Pt 500 Barometric 1 Vaisala 6m pressure PTB110 Relative humidity 1 Vaisala HMP45A 60m Data loggers/ CompactFlash Module Model: CR1000 / CFM100 Manufacturer: Campbell Scientific, Inc, United Kingdom Height: 6 m Calibrated by: Campbell Scientific Ltd, United Kingdom 7
15 Data Capturing Data are sampled with 0.5 Hz. Every 10 minute statistics of the measurements average/minimum/maximum/standard deviation are calculated and recorded together with time information. Figure 7: Drawing of mast layout and sensor equipment Availability of wind measurements 8
16 Table 3 shows the status of the meteorological measurements at the time of writing. Table 3. Status of measurements as of 1 October The Recovery column shows the overall data recovery rate for the top-level anemometer/wind vane only; and the Years column show the available measurement period in years. Mast ID Province Data start Data start Days until Recovery Years Date Time 1 Oct 2013* [%] [y] WM01 N Cape : WM02 N Cape : WM03 W Cape : WM04 W Cape : WM05 W Cape : WM06 N Cape : WM07 W Cape : WM08 E Cape : WM09 N Cape : WM10 E Cape : * WM04: until 6 June 2013, where the station ceased operation Meteorological data download Meteorological data from the 10 measurement stations can be downloaded from the web site: wasadata.csir.co.za/wasa1/wasadata. Download is free of charge, but requires registration. The WASA data download site also contains links to the WASA Wind Atlas download site, which contains results from the micro- and mesoscale modelling, as well as further information, reports and tools. 9
17 3 Verification of the Numerical Wind Atlas The value of a wind atlas depends on the uncertainty of estimates made when applying it. It may vary for various applications like wind resource assessment, energy production estimates of a wind farm or design wind conditions or other uses. In any case a thorough verification against high quality measurements is essential for quantification of uncertainties. This may be achieved by comparison of wind speed and direction distributions derived from both numerical wind atlases and measurement. By comparing wind climates based on modelling to those based on measurements for several wind measurement stations, an assessment of the uncertainty of the modelling-based estimate can be made. The process of verification aims to evaluate the uncertainty of an estimate of wind resource, whether based on the observational wind atlas or the mesoscale numerical wind atlas methodologies. Central to the verification process is the principle that a proper comparison of wind characteristics is being made. As examples: just as it makes little sense to compare a mean wind measured at 25 m a.g.l. with a mean wind measured at 80 m a.g.l., even at the same location, without accounting for a vertical wind profile, it makes little sense to compare a mean wind measured at a lakeside with a mean wind measured in a semi-urban area, without accounting for the effect of surface roughness. Similarly for measurements made on top of a hill the orographic speed up effects must be accounted for. Accounting for these kinds of effects is the backbone of the wind atlas methodology and the models within the WAsP software. Therefore only wind climates transformed to standard conditions can be compared, i.e. winds at standard heights over flat terrain with a single homogenous surface roughness. This principle must also be used when comparing mesoscale modelling results to measurements, because the spatial representation of the terrain in the model is impacted by the spatial resolution, even at high resolutions. Roughness conditions varying on a scale smaller than the grid scale will not be represented. Sharp or steep surface elevation features will tend to be smoothed and rounded by the grid scale representation. Therefore, the wind climate given by a particular grid cell of a model cannot be directly compared to a measured wind in the vicinity of the same grid cell. The necessary step is to transform the mesoscale model winds to standard conditions to account for the effects of the roughness and orography as represented in the mesoscale model to provide the winds for generalised mean flat terrain with a single homogenous surface roughness. A number of high quality and well distributed wind measurement stations are needed to validate the model output and, as described above, these have been established in the South African geographical area for the Wind Atlas South Africa project. A chain of carefully executed and well documented activities are needed to provide these locally measured data. The same careful approach is needed regarding the use and interpretation of externally measured wind data. Overall the qualitative agreement of the modelling and measured results is good as seen from this verification. The mesoscale modelling in terms of agreement of mean wind speed gives a performance that is comparable to and even better than that found in other studies. The verification is carried out at the 10 WASA Masts, where the Numerical Wind Atlas (NWA) is compared to observational wind atlas (OWA). Generalized annual mean wind speed [m/s] at 100 m, z0 = 3 cm of the NWA are compared to the OWA. Verifications have been carried out for both the first KAMM-based NWA that was launched March 2012 and the researched WRF-based NWA that was released April 2014 after 2 years further work both of which are available on the Table 4 Comparison of the mean generalized wind speed (h=100m and z0=0.03m) for all WASA masts for the observations (U OBS ), and the NWA from KAMM (U KAMM ) and WRF (U WRF ). In the KAMM-derived NWA values, the period is 01 Oct 2010 to 30 Sep 2013 for all sites. In the WRF-derived NWA values, 10
18 the time period is 1 Oct 2010 to 30 Sep 2013 for most sites, but 1 Jun 2010 to 31 May 2013 for WM04; 1 Mar 2011 to 28 Feb 2012 and 1 Oct 2012 to 30 Sep 2013 for WM10. U OBS has been derived using default (-40 Wm -2 ) mean heat flux over land. U OBS U KAMM Δ(U KAMM U OBS ) U WRF Δ(U WRF U OBS ) (m/s) (m/s) (%) (m/s) (%) WM WM WM WM WM WM WM WM WM WM Mean Δ Mean absolute Δ Previous verifications of the KAMM-based NWA launched March 2012 were made as comparisons against 1 year of measured data at the 10 WASA masts and the generalisation of the wind speed observations were derived using adapted parameters instead of the default mean heat flux over land. This effect is more pronounced at WM01 (heat flux of 40 Wm -2 ) and WM10 (20 Wm -2 ) compared to the default value of -40 Wm -2 used in the standard WAsP. Now 3 years of data are available and the exercise has been repeated. Table 5 Comparison of the mean generalized wind speed (h=100m and z 0 =0.03m) for all WASA masts for the observations (U OBS ), and the KAMM-derived NWA (U KAMM ) for different time periods (2 and 3 years). The U OBS values are determined from the adapted wind profile as described in Table 16 of Mortensen et al. (2014b). The time periods are 2 years: 1 Oct 2010 to 30 Sep 2012; 3 years: 1 Oct 2010 to 30 Sep 2013 in the KAMM-derived values. Shorter time periods are used in the OBS values (for more details see Mortensen et al., 2014b) for WM04, WM09 and WM10. U OBS U KAMM Δ(U KAMM U OBS ) U OBS U KAMM Δ(U KAMM U OBS ) 2yrs (m/s) 2yrs (m/s) 2yrs (%) 3yrs (m/s) 3yrs (m/s) 3yrs (%) WM WM WM WM WM WM WM WM WM WM Mean Δ Mean absolute Δ
19 The biases between generalized wind derived from OWA (Mortensen et al., 2014b) and NWA vary greatly with model and site. Overall, the KAMM-derived mean generalized winds are underestimated for most sites except for WM02. The sites where thermal-induced flows are important in determining the wind climate (e.g. WM01, WM03) are the most affected. In the WRF-derived NWA, biases are mostly positive, except for WM01, WM03, and WM06, but the absolute value of all biases is smaller than 10% As it appears, the KAMM-based NWA that was launched March 2012 on average somewhat underestimated the wind resources, whereas the WRF-based NWA that was released April 2014 on average slightly overestimates the wind resources. It is noticeable that in certain conditions the overestimation reaches close to 10%. It is therefore recommended based on this verification to apply the NWA carefully in cases when it is important to arrive at a conservative estimate of the wind resources in particular in sites and areas with similar conditions as those near WM02, WM04 and WM10. Any user or application can establish their own mast and perform verification at any other point in South Africa and thereby confirm and quantify the usefulness and uncertainty levels associated with the application of the Numerical Wind Atlas in South Africa. 3.1 Some general aspects of uncertainties and sensitivities in wind resource assessment and production estimation Wind resource assessment is known to be associated with numerous types of uncertainties, many of which have been discussed in the literature for many years see e.g. Accuracy of Estimation of Energy Production from Wind Power Plants, Wind Engineering, Vol. 16 No This section contains some general comments on some of the main classical types of uncertainties that always have to be considered in wind resource assessment Uncertainties related to long-term and regional variations in wind climate Any wind resource assessment exercise should attempt to make the necessary corrections for the measurement period relative to the long-term average wind climate, i.e. climatic variability of the wind climate, longer-term variations and climatic change. Most of these WASA stations have recorded the wind climate for just three years and will therefore not be able to provide the full necessary information. However, there are SAWS station data available that have measured wind for long periods, although not necessarily with dedicated wind instrumentation or siting for wind energy purposes. Corrections when using such data should be applied following a careful investigation of the history of the station. Long-term wind data series are also available from various re-analyses datasets such as the NCEP/NCAR and other reanalysis data sets, but it is not yet fully clear how well these data can be used to estimate the long-term variations close to the ground in South Africa. Little is known about climatic change in this region and the impact this may have on the power output from wind farms in the very long term and it was not part of the project to investigate this aspect in depth Large-scale effects on wind climate by large wind farms It should be mentioned that large wind farms will potentially affect the wind climate at least in the surroundings and therefore affect the production of neighbouring wind farms. The uncertainty due to such large-scale effects on wind climate by large wind farms is difficult to quantify and it is currently a subject for research. However, results of this research will be relevant for large-scale land based applications in South Africa as well. 12
20 3.1.3 Gradients in wind climates It can be seen from the mesoscale modelling results and the Numerical Wind Atlas that gradients in the wind climate can be significant. The technique for interpolation between wind atlases may be considered. For sites with a large spatial extent interpolation using the WRF-based NWA results presented should be used. However, these results are not sufficiently accurate for obtaining bankable resource estimates for wind farm design optimization. On-site measurements must be carried out in order to increase the accuracy of the results. The NWA will be useful to design such a measurement programme both in terms of the number of measurement masts necessary and their location Uncertainties related to flow modelling WAsP, KAMM and WRF The uncertainties associated with WAsP flow modelling in general have been described by the Microscale Report and in the manual for WAsP. Most of these uncertainties are well known uncertainties that also apply to South Africa. Most of these uncertainties are not particularly pronounced in the large parts of South Africa with relatively flat and gently undulating terrain, and their sum will generally be relatively small when adhering to good engineering practices. Micro-scale modelling in complex terrain, however, is associated with potentially large uncertainties. One point that deserves more attention in the future, though, is the extrapolation of wind climate estimates to greater heights ( m above ground level) from measurements made at heights of m a.g.l. Significant uncertainties still seem to be related to meso-scale modelling and to the generation of the Numerical Wind Atlas, at least in certain parts of South Africa. Indications of the uncertainties of the meso-scale modelling are found from the verification shown in Table 4 and Table 5. It is however obvious from the Mesoscale Report that the WRF-based NWA in many respects is an improvement compared to the KAMM-based NWA at least in the set-up and runs that were developed by the WASA project. More details are available in the WASA Mesoscale Report Uncertainties related to wind measurements The Windsensor P2546A was used as standard for all the measurement levels on all the 10 measurement masts. Instrumentation was designed, implemented and checked as reported in the Site Description Report and the Measurement Report. All the data have been quality controlled in the WASA team in accordance with good measurement practice. Measurement uncertainty can be estimated from a traditional analysis based on the guidelines in the IEC standard Uncertainties related to topographic data Topographic data can be significant source of uncertainty e.g. regarding sourcing of good maps use of coordinate systems, projections, datum interpretation of terrain types major developments and their representation in maps The sensitivity of wind resource assessment with regard to the accuracy and detail of the topographical input data were studied in WASA Uncertainties of wind turbine and wind farm power performance The uncertainty of the wind turbine power performance has not been studied in this project. However, some parameters have been considered, including e.g. air density and the vertical profile. 13
21 4 Application of the wind atlases 4.1 Typical users and uses of the atlas In very general terms, the typical use of a wind atlas may be categorised as listed in Table 6 below. As shown, there is a very wide range of possible applications and therefore a corresponding range of needs and expectations when it comes to the form and even accuracy of the result. Table 6 Typical users of a wind atlas Authorities Planners Investors, owners and banks Developers (small and large) Industry (small and large) Power sector Consultants Academic community Policies, regulations and plans Resource and development planning Financial planning, risk assessment and decisions Project development Project design and implementation, Wind turbine design and development Power system planning, development and operation Independent expertise and tools development Research, tools development & education 4.2 Applications of the numerical wind atlas The use of a wind atlas is typically either related to planning or project development, each with a number of possible subtasks, like Planning National, Provincial and Local physical, resource and power system planning Project development Wind farm siting and layout energy production estimation, site assessment, wind turbine design conditions Useful inputs to these main types of tasks may be achieved through applying the wind atlas databases to one or more of these types of analyses. 1 Wind resource assessment and predicted wind climate (PWC) for a site, an area, or a region 2 Wind energy planning databases and graphics 3 Wind Farm Annual Energy Production (AEP) estimations 4 Wind turbine design conditions, e.g. as specified in IEC

22 This may all be achieved by using the Wind Atlas database, i.e. by transformation of the Generalised Wind Climate (wind atlas *.LIB files) to the Predicted Wind Climate, i.e. actual surface wind speed and direction distributions, using WAsP or a similar micro-scale model. 4.3 Wind-climatological inputs The wind-climatological inputs are described in some detail in the other WASA reports. The generalised wind climate data sets derived from the mesoscale modelling are described by Hahmann et al. (2014) and the data sets derived from the measurements by Mortensen et al. (2014). Figure 8 shows examples of these generalised wind climates. Note that the heights have been adapted to the measurement heights in the observation-based data set. Figure 8. Sample wind atlas data sets for mast WM05, Napier. Left-hand data set based on observations from October 2010 to September 2013, right-hand data set based on WRF mesoscale modelling. For application purposes such as the use of a wind atlas data set for estimation of the power production of a wind farm over the next 20 years or so it should be borne in mind that the data sets represent different time periods. The mesoscale data sets generally represent long-term estimates (WRF: 8-year period ?) whereas the data sets based on observations represent a 3-year period only ( ). It is essential in each project to evaluate how representative the chosen data set is for the long-term climatology of the site in question. Reliable wind index information is not readily available for South Africa, so the predictions must be referenced to any or all long-term data sets available. 4.4 Topographical inputs The terrain features that influence the wind flow close to the ground and therefore determine how the generalised wind climate is transformed into the site-specific wind resource are often categorized in three broad classes: Geometry of the terrain surface (elevation, slope, ruggedness, etc.) Surface characteristics of the terrain (land cover, roughness length, etc.) Near-by sheltering obstacles (houses, trees, shelter belts, etc.) The coordinate systems used with these topographical input data are described briefly at the end of this section Terrain surface elevation height contour maps 15

23 An accurate description of the overall geometry of the terrain surface is a prerequisite for reliable modelling of the wind flow over the terrain. The most important feature is the elevation of the terrain surface above mean sea level. The microscale model may require a height contour map for the flow modelling. This can be obtained by digitising the height contours from a standard topographical map; however, this is a labour-intensive and somewhat tedious process. Moreover, it may be impossible to find reliable and up-to-date maps for a given wind farm site. The contours can also be constructed from spot height elevations in a regular grid, so-called raster data. Version 3 of the Shuttle Radar Topography Mission (SRTM, 2005) elevation data set has recently become available. This data set consists of elevation values for node points in a 3 arc-second (90 m) grid, derived from radar measurements made by the space shuttle Endeavour. These data cover all of South Africa and version 3 is a complete data set where voids and spikes have been removed. Figure 9 shows an example of elevation maps derived from the SRTM data set Figure 9. Elevation maps of the area around the meteorological mast WM05. Left-hand map covers an area of km 2 with 10-m height contours; right-hand map covers an area of 4 4 km 2 with 5-m height contours. Investigations in South Africa (Mortensen et al., 2014) and elsewhere show that maps derived from SRTM data are sufficiently detailed and reliable for most wind flow modelling purposes. However, the spot heights or height contours should be compared to other reliable maps of the area, if such exist especially with respect to the height contours close to the site(s) of interest. When it comes to actual planning and construction of a wind farm, more detailed maps may be required. These can be established by a number of other techniques; an example of a very detailed elevation map of a wind farm site in Egypt is given in Figure 10 (Mortensen et al., 2005). 16
24 Figure 10. Elevation map of the Zafarana wind farm site in Egypt established by a site-specific survey employing kinematic GPS techniques. The height contour interval is 2 m. Four wind turbine groups, each of kW wind turbines, are indicated by black dots. In general, it is therefore straightforward to establish digital maps with 10- or 5-m height contours in most of South Africa. If spot heights from e.g. paper maps or raster data sets are considered as well, it will be possible to detail such maps in certain areas; but if a more detailed elevation description is needed, a site-specific survey of the terrain is required. The influence of the detail in the elevation description on the modelling of the wind flow and thereby the estimation of the annual energy production can be illustrated by using different maps of the same area; with different height contour intervals and detail. Examples are given by Mortensen et al. (2010) for the three case study sites in China, where AEP predictions have been made with maps derived from SRTM data only and maps improved by adding details from large-scale Chinese paper maps. The regional wind climate and wind turbine type used for the predictions are the same in both scenarios. The analysis shows that the AEP predictions are not very sensitive to the elevation map for the three case study areas; the maximum difference found is on the order of 1% Land cover and roughness length roughness maps An accurate description of the land cover and roughness lengths of the terrain surface is another prerequisite for reliable modelling of the wind flow over the terrain. The most important land cover classes in South Africa are: farmland, scrubland, water surfaces, forests, bare soil and rock, and builtup areas. The overall land cover pattern of a particular area can be established from topographical maps, aerial photographs or satellite imagery. The most up-to-date and readily available information on the type and distribution of land cover classes stems from satellite imagery. Evidently, the terrain descriptions should correspond to the scenario one wants to model. So, if historical data from a standard meteorological station are analysed, the maps (especially the land cover) should correspond to the terrain at the time of the observations. Since the wind data analysed here were measured from and possible wind power projects will be built in the near future, the elevation and land cover maps should correspond to present day conditions. The most common land cover type, corresponding to the back-ground roughness length, consists of farmland or scrubland. It may be difficult to estimate the roughness length of such surfaces; however, it should be borne in mind that this estimate is most critical if the meteorological mast is low and less critical the higher the mast. Preferably, the anemometer used for predicting the wind turbine production should be mounted at a height comparable to the hub height of the proposed wind turbine. The 17
25 sensitivity of changing the background roughness length by a factor of two (both lower and higher) was investigated by Mortensen et al. (2010). For predictions of wind power production between 75 and 125 m a.g.l. from 70-m measurements, the sensitivity was found to be less than 2% in all three case studies. In the present project, it has been found that reliable wind profile modelling can be obtained with a variety of land cover descriptions. However, it has also been found that a reliable roughness length classification is not sufficient; adjustments to the atmospheric stability must be employed too (Mortensen et al., 2014). There seems to be a clear pattern over the WASA domain in these stability adjustments, but it has not been possible in the present project to describe this in sufficient detail. It is therefore strongly recommended to employ several levels of anemometry at measurement masts; in order to check the modelling of the vertical wind profile Sheltering obstacles Sheltering obstacles are man-made structures like houses, walls or fences. Shelter belts and rows of trees may also be quite common. However, the height of typical obstacles and their distance to possible wind farm sites suggest that it will only rarely be necessary to model these structures as sheltering obstacles. Instead, the obstacles can usually be treated as adding to the roughness of the areas in question. The following rule of thumb may serve as a guideline when deciding whether to include obstacles in the terrain as sheltering obstacles or as roughness elements: if the point of interest (anemometer or wind turbine hub) is closer than about 50 obstacle heights to the obstacle and closer than about three obstacle heights to the ground, the object should probably be included as a sheltering obstacle. In this case the obstacle should not at the same time be considered as adding to the roughness of the terrain. if the point of interest is further away than about 50 obstacle heights or higher than about three obstacle height, the object should most likely be included in the roughness description. In this case the obstacle should not at the same time be considered as a sheltering obstacle. A wind turbine with a hub height of m a.g.l. and sited well away from buildings will therefore rarely experience shelter effects. Conversely, the shelter effects may be quite severe for a meteorological station with a 10-m mast sited close to built-up areas Coordinate systems Most of the information used in wind resource assessment and siting and indeed much of the information needed for wind farm planning and development is geo-referenced. The location of a given meteorological station, the elevation of the terrain, the extent and shape of significant land cover or roughness classes and the layout of a wind farm can only be described accurately by referring to the exact position or coordinates of the feature in question. Wind flow modelling requires accurate and reliable information on the coordinates of the inputs used. In WAsP and other microscale flow models, all coordinates must be given in the same Cartesian coordinate system. Two coordinates systems (projections) are used in the reports of the WASA project: common geographical coordinates (latitude, longitude) and the Cartesian Universal Transverse Mercator (UTM) system. Both systems are referenced to the World Geodetic System 1984 (WGS 84) datum. Figure 11 shows the geographical coordinate system lines of equal latitude and longitude for southern Africa. This system is not Cartesian and therefore not suited for microscale wind flow modelling or planning purposes. However, several input data are provided in this system, e.g. Google Earth images, other satellite images, Shuttle Radar Topography Mission elevation data, SRTM Water Body Data, Coastline Extractor data, etc. 18


26 Figure 11. Google Earth image of southern Africa showing the geographic coordinate grid latitude and longitude lines in degrees south and degrees east, respectively. Figure 12 shows the Cartesian UTM systems used. Because the WASA domain spans almost 15 degrees of longitude, three different UTM zones must be used; these are shown by the grid lines in Figure 12. For the meteorological stations of WASA Phase 1, it is necessary to use zones 33, 34 and 35. Figure 12. Google Earth image of southern Africa showing the three UTM zones covering the WASA Phase 1 domain: 33, 34 and 35. Each zonal coordinate system is Cartesian and the coordinates can be given in [m] or [km]. Each UTM zone has a local x-axis originating 500 km west of the central meridian of the zone. The y- axis originates 10,000 km south of the equator for all three zones. The meteorological station coordinates in the WASA project are referenced to either UTM zone 33, 34 or 35 (Mortensen et al., 2014). 19
27 Transformation between different coordinate systems is quite complicated and must be performed using specialised software. The WAsP Map Editor and the Geo-Projection Transformer are two software tools that can transform single points, lists of points and entire WAsP map files using several different map projections and almost 150 different map datums. Global Positioning System (GPS) devices also refer to a specific coordinate system. The default system in most receivers is (latitude, longitude) referred to WGS84, but this can be changed in a set-up menu. Coordinates downloaded from the GPS using some software may be referenced to WGS84, regardless of the setting of the GPS. 4.5 Application in wind energy projects Mesoscale and microscale models resolve different features of the terrain and flow, and they are useful in different phases of planning and project preparation. The mesoscale model output should not be used directly itself, since it represents an abstraction, namely the mesoscale wind in a mesoscale terrain, which has to be transformed to actual predicted surface wind by applying a microscale model. Application of mesoscale modelling for obtaining information about the predicted wind climate at a given location in South Africa therefore will use a *.LIB file generated from the mesoscale modelling as input to a microscale model such as WAsP, used according to recommendations. However, mesoscale modelling has to be employed in order to enable assessment of the validity of the assumptions used for microscale modelling. The wind farm site may include an area with a large regional wind climate gradient, which would violate the microscale modelling assumption constant regional wind climate over the microscale modelling domain. The mesoscale modelling may furthermore be used to identify locations with large gradients and thus locations where an extended measurement programme will be advisable in order to avoid gross errors in wind resource assessment. The terrain features that influence the wind flow close to the ground and thereby determine how the regional wind climate is transformed into the site-specific wind resource are often categorized in three broad classes: The geometry of the terrain surface (elevation, slope, complexity, ruggedness, etc.) The surface characteristics of the terrain (land use or roughness length) Near-by sheltering obstacles (houses, trees, shelter belts, etc.) As an example, the detail in the elevation description influences the modelling of the wind flow and thereby the estimation of the annual energy production (AEP). In microscale modelling, an increase in height contour intervals from 2 to 10 m has been found to increase the contribution to uncertainties in AEP estimates by more than 5% even in terrain with relatively little complexity or ruggedness. In more rugged, complex and mountainous terrain the uncertainty increases and the dependency on accuracy and resolution of terrain data increases. To test uncertainties associated with microscale and mesoscale flow modelling as well as with terrain data it is generally recommended to carry out model parameter studies and adaptation of models to local conditions sensitivity analyses, site calibration and verification against measurements Other aspects to be considered are wind climate variability within the time-frame of the data collection and the planned projects inter-annual variations, long-term averages and climate change 20

28 man-made large-scale effects on wind climate by changes in terrain and flow conditions due to the utilization of the land, especially building of new large wind farms and urbanisation In general inter-annual variations relative to long-term averages are often seen to be of the order of 10% on mean wind speed. Wind climate variability differs however in different climate zones. Longer-term wind data series that may be used to assess inter-annual variation and long-term averages are available from the NCEP/NCAR reanalysis data set, but any such dataset must be used with care in a wind power context. Global climate change modelling, rather than NCEP/NCAR reanalysis, may be valuable in the evaluation of impacts of global climate change on wind farm AEP. Regarding man-made, large-scale effects on wind climate, it should be noticed that the uncertainty due to any new large wind farm may be significant for its surroundings. Exact quantification is difficult, but up to 20% loss in energy production has been seen. This aspect will be relevant for all large wind farm projects and thereby also in planning phases when assessing the potential energy production from wind and the consequent impact on the economics of a project. 4.6 Wind farm calculations The wind resource map is one of the basic inputs in the wind turbine siting procedure and in the determining the wind farm layout. Figure 13 shows a sample layout for a 30-MW wind farm as analysed in the case study. The wind farm layout should (alongside other criteria that may be decided by the project developer, owner and authorities) aim at maximising wind farm production, minimising wind farm wake losses and minimising the wind turbine structural loads while at the same time also being aesthetically pleasing. Once the wind farm layout and turbine type have been chosen, the wind atlas methodology (WAsP) can be used to estimate the actual annual energy production from the wind farm, including wake effects. For this calculation to be reliable, it is important to use site-specific power and thrust curves for the wind turbine in question. Information on the average annual air density at the site is required; this may be calculated from site measurements of atmospheric pressure and air temperature. Figure 13. Sample layout for a 30-MW wind farm as analysed in the case study. 4.7 Wind resource mapping For a given wind farm site, the regional wind climate derived from the numerical wind atlas or a nearby meteorological station can be used to map the wind resource over the site. Examples are given in the 21
29 case studies, where the mean wind speeds at 80 m above ground level have been estimated by means of the WAsP model in areas surrounding the masts. For wind farm sites located close to the masts the regional wind climate from the meteorological station may be used for the modelling as well as the regional wind climate files generated for the relevant mesoscale grid cells by the mesoscale modelling. Even within fairly small and homogeneous sites, the estimated production easily varies by more than 20%, so for sites with ridges and other significant features, a very thorough site optimisation effort is essential. Wind resource maps for any area in South Africa can be established in the same manner by using the regional wind climate statistics from the numerical wind atlas. 4.8 Reliability of wind resource estimates The reliability of wind farm calculations, wind resource mapping from Observational Wind Atlases as well as of the verification of the Numerical Wind Atlas depend first of all on the reliability of the data from the meteorological stations from which the wind statistics have been derived. The accuracy of the wind speed and direction measurements and the amount of data available has to be assessed. Secondly, it depends on the complexity of the terrain; at the meteorological station as well as around the sites of interest. Finally, the geographical variability of the wind resource will necessarily add to the uncertainty of the estimates. The reliability of estimating the spatial variation of the wind resource and any extrapolation or interpolation depends on the performance of the mesoscale modelling and the generation of the Numerical Wind Atlas. Assessments in quite some detail from the results of the mesoscale modelling of South Africa and the modelling domains are presented in the Mesoscale Report, using the 10 measurement stations WM01-WM10 as verification points. These results may not be sufficiently detailed and accurate for micro-siting and bankable production calculations, but they provide a fairly reliable picture of the large-scale spatial variations of the wind resource, although considerably more accurate and reliable in the parts of South Africa with less complicated terrain than in the parts with complex terrain The similarity principle Current knowledge about the uncertainties in WAsP wind resource assessment may be summarised in the so-called similarity principle: Accurate predictions of wind climate and annual energy production based on observed wind climates require that the meteorological station (predictor) and the turbine site (predicted site) should be as similar as possible with respect to: Topographical setting o ruggedness (RIX index) o elevation and exposure o distance to significant roughness changes (for example, a coastline) o background roughness lengths Climatic conditions o regional wind climate (synoptic and mesoscale) o general forcing effects o atmospheric stability With respect to WAsP, accurate predictions using the WAsP BZ-flow model and indeed most other wind resource assessment and siting models may be obtained (Bowen and Mortensen, 1996) provided: 22
30 the meteorological station and wind turbine site are subject to the same overall weather regime, i.e. that mesoscale effects are not significant or, if present, the two sites are affected in the same way, the prevailing weather conditions are close to being neutrally stable, and the surrounding terrain (of both sites) is sufficiently gentle and smooth to ensure mostly attached flows. The latter requirement in particular has a significant impact on the accuracy of WAsP predictions in complex terrain. To what extent a similarity principle exists for the mesoscale modelling as well is not clear. Studies reported in the Mesoscale Report indicate that a relation can be established between uncertainties and terrain complexity. 5 Design wind condition In addition to the predicted wind climate the distribution of wind directions (wind rose) and the sectorwise distributions of mean wind speed other wind conditions may be important for the design of a wind farm. Some of these characteristics have been measured directly at the project measurement stations; others must be estimated from the meteorological data. 5.1 A brief introduction to the IEC standard The International Electrotechnical Commission provides the IEC standard for turbine safety (IEC 1999, 2005, 2009). The main principles are that manufacturers classify turbines and developers check that site conditions do not exceed the design limits of the class of the selected turbine Turbine classification according to IEC Edition 3 of IEC declares three turbine classes: I, II & III, each with a reference wind V ref set to 50 m/s, 47.5 m/s and 37.5 m/s, respectively (IEC 2005). This reference wind is defined as a 10-min average wind speed at hub height. In addition, there are three turbulence categories A, B & C, each characterized by a reference turbulence intensity I ref, which is set to 16%, 14% and 12%, respectively 1. The reference turbulence intensity is defined as the average turbulence intensity of the longitudinal velocity perturbations measured over random 10-min periods with a mean wind speed of 15m/s. A turbine is characterized by its wind class and turbulence category, e.g. a turbine for medium extreme wind and medium turbulence is classified as a class II B turbine, see Table 7.There is an additional class S for which the manufacture specifies the reference wind and reference turbulence intensity. Class S is typically used for offshore turbines. Table 7. IEC turbine classification scheme. Wind Turbine Class I II III S V ref (m/s) Values specified A I ref (-) 16% by the designer B I ref (-) 14% C I ref (-) 12% 1 IEC Ed. 2 (IEC 1999) used a slightly different classification scheme. 23
31 To verify that a turbine is of a given class it must be proven that it can survive a list of design load cases. These load cases are defined by combinations of: Turbine mode of operation e.g. normal mode of production, normal start or stop, emergency stop, sudden grid failure, operation under yaw error etc. Load type - either ultimate load or fatigue load, Wind conditions e.g. extreme wind, severe or normal turbulence, severe or normal wind shear or various gusts and wind direction changes. The design wind conditions are specified by simple models which are parameterized by: The reference wind speed V ref The reference turbulence intensity I ref The turbine hub height z hub An example of a load model is the normal turbulence model (NTM) which is applied for fatigue load simulations. In here the longitudinal velocity perturbations are modelled as 3 1 Iref 4 Vhub 5.6 m/s This model has wind-speed dependence and the intention is to model not the average turbulence level but the 90% percentile of a distribution of turbulence conditions. Reasons for such variation include variable atmospheric stability and trends in mean wind speed. The NTM turbulence is referred to as representative turbulence 2. Another example is the normal wind profile (NWP) defined as V z V z z hub hub The shear exponent in this profile is set to 0.11 for extreme load test and 0.2 for fatigue loads. The standard defines several gust and wind-direction change load cases. These are specified by design models which all are parameterized by V ref, I ref and z hub Site assessment according to IEC The general principle of IEC site assessment is that actual wind conditions must be less severe than assumed in the turbine design class. The following criteria apply: The 50-year extreme wind must be lower than the reference wind of the turbine class; Flow-line inclination at hub height must be less than ±8 for all wind directions; The average wind-shear exponent at hub height must be positive but less than 0.2. The reason for avoiding excessive shear is the risk of enhanced fatigue damage and the reason for avoiding negative shear is the risk of blade-tower interaction; The wind-speed distribution must be lower than the distribution used for turbine classification in a certain wind speed range. This range is either defined as 60% of rated wind speed to turbine cut-out wind speed or, in case the power curve is unknown, defined as 0.2 to 0.4 times the reference wind of the turbine class. More exposure in this wind-speed range would enhance fatigue damage; 2 IEC Ed. 2 defined a slightly different measure called characteristic turbulence intensity. It was based on mean plus standard deviation instead of the 90% level of Ed
32 The effective turbulence intensity, see below, must be lower than the applicable IEC model in a range from 60% of rated wind speed to the cut-out velocity. The applicable model is either characteristic or representative turbulence intensity depending on whether the turbine type is classified according to edition 2 or 3 of the standard. These criteria apply to individual turbine sites. An additional rule states that turbulence must be scaled by a safety factor if the terrain is complex and the turbulence intensity has not been measured. The reason is that turbulent kinetic energy in complex terrain is redistributed among the three velocity components. Terrain complexity is evaluated by criteria based on terrain slopes in the area around each turbine site Effective turbulence intensity Fatigue loads for turbine classification are simulated for a range of wind speeds using the representative turbulence intensity. However, due to non-uniform surface roughness the turbulence intensity will, however, often depend on wind direction. Turbulence from wakes of neighbouring turbines in wind farms will contribute significantly to the directional variation of the turbulence intensity. IEC Ed. 3 has an Annex D suggesting an optional model for the effects of wake turbulence - see also the detailed description of Frandsen (2007). In this model an effective turbulence intensity is defined as a constant turbulence intensity assumed to cause the same material damage as variable turbulence from all directions. 2 m Ieff u p ui u, d 0 1 m In this formula the Wöhler exponent m is a material constant, which is approximately m=10 for glass fibre. Annex D includes a simple model for the wake turbulence. Here, wake turbulence is modelled as a combination of background turbulence and added turbulence. I I I 2 2 wake ambient add The added turbulence intensity in the new IEC /A1 amendment (IEC 2009) is modelled by 1 Iadd x D CT u Here x is the distance to a neighbour turbine, with diameter D and thrust coefficient C T at wind speed u. 5.2 Assessment of wind conditions Extreme wind speed An extreme wind is defined by an averaging period and a recurrence period. The latter period is the expected waiting time for an event, which exceeds the extreme wind level. The IEC standard refers to extreme winds with 10-min averaging periods and 50-year recurrence periods. By fitting an extremewind model, typically a Gumbel distribution, to the observed extreme winds it is possible to extrapolate the statistics to the specified recurrence period, also when this is longer than the observation period. The accuracy of this extrapolation depends on the number of observation years and the slope parameter of the fitted Gumbel distribution. The IEC standard recommends a minimum of seven years. Furthermore, the Gumbel fit slope parameter is typically larger when modelling wind climates affected 25
33 by tropical storms than when modelling continental or extra-tropical extreme wind climates. This leads to extra extreme-wind uncertainty. According to the IEC standard, the extreme wind must be estimated at individual turbine sites. For this purpose we first use a micro-scale flow model to predict site-specific winds, then we fit local Gumbel distributions, and finally we extrapolate to local fifty-year extreme wind speeds. The reason for this procedure is that individual sites have different wind speed-up factors for winds coming from different wind directions. Unfortunately, most wind energy projects do not have local wind observations of sufficient duration for extreme wind prediction. An alternative, which is implemented in the WAsP Engineering program 3, is to use the wind atlas method to transform extreme wind climates at the reference site to the extreme wind climate for the wind energy project. The reference site should have a climate similar to that of the wind energy site. The procedure is to prepare two WAsP Engineering projects modelling the terrain around the reference mast and around the wind energy project, respectively. The first project is used to transform observed extreme wind climate to a generalized extreme wind climate free of local effects. This generalized extreme wind climate is stored on a file, which is loaded in the second project where it is used to predict extreme wind climates at individual turbine sites. If no representative observations of sufficient duration and quality can be found, a generalized extreme wind climate can be generated based on meso-scale models and reanalysis data Flow-line inclination This can be calculated by a micro-scale flow model, e.g. that of WAsP Engineering. The IEC standard also allows use of terrain inclination instead of flow-line inclination as this is considered a conservative estimate Wind shear exponent This can be evaluated by fitting a power law to micro-scale flow model results. WAsP Engineering calculates the shear exponent by the speed and its derivative at the hub height using the relation zhub du u dz hub hub Wind speed distribution This distribution is calculated by WAsP Effective turbulence intensity Effective turbulence intensity can be calculated by the Windfarm Assessment Tool 4 (WAT), which is based on the Frandsen (2005) model and uses a combination of model results from WAsP and WAsP Engineering. The calculation includes the conditional wind rose, i.e. the wind direction distribution given the wind speed, which is estimated by a WAsP wind climate. pup p uaj, kj frj p u N 1 pu p ua, 0 i ki fri i In this formula frequencies of occurrence fr i are defined sectors with index i and the Weibull distributions in these sectors are 3 See 4 See Nielsen et al. (2009) 26
34 ki1 i, i i i exp i p u A k k A u A u A i ki A problem with estimating effective turbulence intensity in WAT is that the background turbulence intensity modelled by WAsP Engineering is valid only for steady flow and neutral atmospheric stability and it lacks random variation among 10-min periods. Thus, the WAsP Engineering turbulence prediction will typically be smaller than the representative turbulence intensity, which should be a measure of 90% percentile of a scattered distribution. WAT has a method for correcting the WAsP Engineering predictions by observed turbulence intensity statistics based on data from a reference mast near the turbine sites Gust statistics A gust is a sudden increase in wind speed, which should not be mistaken for an extreme wind, which is a term referring to average wind. The spatial scale of a gust relates to its duration, so the gusts which are considered significant for wind turbine design have durations of the order of three seconds. Gusts are both important in the extreme wind situation and at moderate wind speeds where the turbine is operating. If turbulence is considered a Gaussian process, it is possible to calculate the most likely maximum gust in a 10-min periods. Extreme gusts will, however, typically deviate from the Gaussian model as they are associated with rare meteorological phenomena like downbursts of high-altitude winds inside a thundercloud. This can be modelled with mesoscale models such as WRF. The IEC site assessment rules will normally not include gust analysis. Even so, it might be a good idea to add gust detection to a field measurement system. This does not involve extra sensors only additional processing by the data acquisition system. The maximum and minimum excursion of a 3-sec moving average filtered cup anemometer signal from its mean value is of primary interest. Deviation from predictions by Gaussian theory could indicate flow separation from upwind terrain features. Analysis of pairs of signals are also of interest, e.g. wind shear detected by two vertically separated cup anemometers or wind veer detected by two wind vanes. The extreme-wind assessment is normally based on the 10-min average wind with fifty-year return period. It is permissible to make an alternative assessment based on 3-sec gusts with fifty-year return period, but then the reference wind used for comparison must be enhanced by 40%. 6 Case studies 6.1 Introduction The WASA Work Package 04 (WP04) on Application has made some case studies in order to illustrate the various aspects of possible applications of the WASA project results. These are also used for the seminars and the application training course material. The case studies have been designed to: Demonstrate specific uses of the WASA data Show certain features of wind resource assessment Indicate understanding needed when interpreting results Be followed by course participants 27

35 Serve as inspiration for exploring more about wind atlases The site has been chosen for the above purpose. Please bear the following in mind: They are not necessarily a suggestion of a good wind farm location Aspects other than wind resource have not been reviewed Case studies are not intended to be a course in the use of wind resource assessment software The case study area that has been chosen is in the Western Cape, in the vicinity of the town of Stanford (Figure 14). Figure 14 Approximate location of case study area 6.2 Case study Planning A typical use of the WASA data is for planning for wind energy by a municipality and as input to assess the wind resources in the planning area in order to: Understand the potential for wind power Identify where the best areas are physically located Know more as background for choice of planning approach and selection of zones for development Investigate any possible relations to other land uses A map of the wind resources for any given area can be generated from local measurement masts as shown in Figure 15 in this case WM05. 28

 data it is possible to make wind resource")
36 Figure 15 Wind resource map calculated for the surroundings of WASA mast WM Microscale modelling on a large scale The calculation area may in principle be extended to any given size as shown in Figure 16, which however is not recommendable in areas like this with large mesoscale effects and wind resource gradients. Figure 16 Wind resource maps of large areas made from just one wind measurement mast - NOT recommendable However, from the WASA Numerical Wind Atlas (NWA) data it is possible to make wind resource maps of similarly large regional areas that include the regional mesoscale effects and gradients across the area. As it will be seen from this section, it is recommended to use the NWA in combination with the verification that has been made by the NWA at the location of the WASA masts (such as WM05). The NWA data (LIB-files) are available from the WASA download site for every 3 km x 3 km. Based on selected NWA LIB-files, the wind resource in the local 3 3 km area can be modelled using a microscale modelling tool like WAsP. A large-scale map of estimated annual mean wind speed at 100 m (or any other height) above ground level may thus be produced by repeating the microscale modelling for every NWA grid point, i.e. every 3 km x 3 km. A tile will be made for each LIB.file grid point, and by patching all these together a map may be constructed. Such a map will have discontinuities along tile borders, but inside each tile, these wind resource values will take account of 29


37 regional mesoscale effects, which is the purpose of applying the NWA. The result still contains uncertainties due to the NWA methodology; however, this has been assessed through the verification of the NWA and may be assessed independently by any user of the NWA who can apply the user s own local wind data at the user s own site. The individual LIB-files can be found on the WASA download site and the files may then be selected and downloaded individually (or, alternatively, LIB-files for the entire WASA domain can be downloaded all in one process). See Figure 17 and Figure 18. Figure 17 WASA NWA LIB-file grid points shown in Google earth. Figure 18 WASA NWA LIB-file identification in the WASA download site tool Microscale modelling of an area than larger one tile may be achieved e.g. in WAsP by building the appropriate WAsP workspace as shown in Figure 19 and Figure


38 Figure 19 WAsP tiles calculated from WASA NWA LIB-files Figure 20 Wind resource tiles overlaid onto a Google Earth image So, microscale modelling of wind resources based on the WASA NWA may be done for any region or local area of any size and resolution, applying terrain elevation and surface roughness data that is 31
39 either user defined or in accordance with the approach specified by the guidelines available on the WASA download site Microscale modelling of the entire WASA domain Mapping the wind resources manually tile-by-tile using WAsP for a very large region or for the entire WASA domain is a large task. The WASA NWA has over virtual masts (LIB-files or GWC-files) in the entire WASA domain in the WRF NWA for South Africa. It has not been part of the project to microscale model all these manually. However, in parallel with the project, the WAsP software team has developed a WAsP Resource Mapping Tool that can automate the process. The additional benefit is that it also has an interpolation approach so that the discontinuities along boarders between tiles are eliminated. This WAsP Resource Mapping Tool is not yet available as a commercial tool, but it was in accordance with project plans applied as a pilot project in the WASA domain, and it is expected to be developed as a commercially available tool or service soon. Applying the WAsP Resource Mapping Tool, the mean wind speed at 100m for a grid spacing of 250m across the entire WASA domain was produced. Input data were: LIB-files (GWC data) from the 3 km x 3 km WASA NWA Terrain and roughness information of the whole WASA domain Elevation data from Space Shuttle Topography Mission, SRTM version 3. Land cover and roughness from USGS Global Land Cover Characteristics database applying Transformation table for z 0 The output is shown in Figure 21. As the modelling is done by WAsP, other outputs are also available e.g. power density, terrain ruggedness index, and elevation data. 32
 at 100 m agl in a grid spacing of 25")

40 Figure 21 High-resolution wind resource map for the entire WASA domain - mean wind speed (m/s) at 100 m agl in a grid spacing of 250 m Microscale modelling approach in brief In summary, wind resource mapping for planning purposes in a particular area may be generated applying microscale modelling using the WASA NWA through the following steps (see also Figure 22): Identify area to be mapped Identify NWA grid points and download GWC data (LIB-files) Make terrain maps for the area Elevation (orography) Land cover (roughness) Import maps and wind data into modelling software (e.g. WAsP) Run model (e.g. WAsP) to obtain resource maps as required for all 3 km x 3 km tiles covering the area to be mapped When done manually tile by tile for larger areas, this approach will require much work. For certain tasks the method may be applied at larger tile size than 3 km x 3 km (e.g. 9 km x 9 km or larger) or done automated by a dedicated software tool. When modeling in larger tiles, the uncertainties will be larger because only one LIB-file is used per tile and details regarding the mesoscale effects are lost. It is recommended to use the 3 km tiles in cases when accuracy is of importance. All data and a guide are available on the WASA download site 33

41 Figure 22 Microscale modelling mapping wind resources based on WASA NWA for a region or a local planning area 6.3 Case study Wind farm energy yield The assessment of the wind farm energy yield is a key process in wind farm development. This case study estimates the potential Annual Energy Production (AEP) of a wind farm and is designed to show how WASA data can help with input to assessing the wind resource in the process of making a good wind farm project or in other words: How good is the wind resource at a given candidate site? How would different wind farm layouts, wind turbines, and wind farm capacities affect the analyses and estimate of AEP? It should be noted that a WASA NWA-based estimate of the wind farm AEP will not make the project bankable, but it will contribute to understanding and deciding what further steps are necessary. A case study called Case study wind farm at Stanford has been made and the calculations have been performed in WAsP using WAsP version: Please bear in mind that this case study is just for illustration the name is just to be able to identify the study under discussion this is not a suggestion of a good wind farm location aspects other than wind resource have not been reviewed In fact, two WAsP calculations have been made for the Case study wind farm at Stanford: a) Applying the WASA NWA LIB-files in the best possible way i.e. for each wind turbine in the case study the LIB-file nearest to it is identified and used in the WAsP modelling representing the local wind climate b) Applying the wind climate determined at the WM05 location based on the three years of wind measurements at the mast location as input to the WAsP modelling at all wind turbine sites 34


42 Both these WAsP Workspace files are available on the website. These files are Case study wind farm at Stanford - with WRF LIB-files,wwh and Case study wind farm at Stanford - with WM05 LIB-file.wwh which contain all maps and input data used for the calculations. This makes it possible for anybody to view these case study calculations and all its data and assumptions This can be done by a licenced WAsP or even an unlicenced WAsP that can be downloaded from free of charge and that will work as a WAsP viewer WAsP calculations at Case study wind farm at Stanford a) using WASA NWA LIB-files A screen shot of the WAsP Workspace of the case study is shown below in Figure 23: Figure 23 Screen shot of case study using WASA NWA LIB-files Summary results Parameter Total Average Minimum Maximum Net AEP [GWh] Gross AEP [GWh] Wake loss [%] Site results Site Location [m] Turbine Elevation [m a.s.l.] Height [m a.g.l.] Net AEP [GWh] Wake loss [%] W1 ( , ) Vestas V90 (2 MW) W2 ( , ) Vestas V90 (2 MW) W3 ( , ) Vestas V90 (2 MW) W4 ( , ) Vestas V90 (2 MW)
43 W5 ( , ) Vestas V90 (2 MW) W6 ( , ) Vestas V90 (2 MW) W7 ( , ) Vestas V90 (2 MW) W8 ( , ) Vestas V90 (2 MW) W9 ( , ) Vestas V90 (2 MW) W10 ( , ) Vestas V90 (2 MW) W11 ( , ) Vestas V90 (2 MW) W12 ( , ) Vestas V90 (2 MW) 'W15' ( , ) Vestas V90 (2 MW) 'W14' ( , ) Vestas V90 (2 MW) 'W13' ( , ) Vestas V90 (2 MW) Site wind climates Site Location [m] Height [m a.g.l.] A [m/s] k U [m/s] E [W/m²] RIX [%] drix [%] W1 ( , ) N/A W2 ( , ) N/A W3 ( , ) N/A W4 ( , ) N/A W5 ( , ) N/A W6 ( , ) N/A W7 ( , ) N/A W8 ( , ) N/A W9 ( , ) N/A W10 ( , ) N/A W11 ( , ) N/A W12 ( , ) N/A 'W15' ( , ) N/A 'W14' ( , ) N/A 'W13' ( , ) N/A The wind farm lies in a map called 'WF-GL3-025+roughness'. 36
44 The wind farm is in a project called 'Case study wind farm'. A wind atlas called 'wrf_wasa_34.491s_19.569e_3km' was used to calculate the predicted wind climates WAsP calculations at Case study wind farm at Stanford b) using WM05 measurements A screen shot of the WAsP Workspace of the case study is shown below in Figure 24: 37
![Figure 24 Screen shot of case study using WM05 measurements Summary results Parameter Total Average Minimum Maximum Net AEP [GWh] 148.656 9.910 9.433 10.414 Gross AEP [GWh] 149.582 9.972 9.446 10.](/docs-images/89/98345608/images/45-0.jpg "487 Wake loss [%] 0.62 - - - Site results Site Location [m] Turbine Elevation [m a.s.l.] Height [m a.g.l.] Net AEP [GWh] Wake loss [%] W1 (367227.8,6183073.0) Vestas V90 (2 MW) 259.7328 80 9.433 0.")
 Vestas V90 (2 MW) 278.2917 80 9.693 0.68 W6 (367998.4,6185392.0) Vestas V90 (2 MW) 267.8617 80 9.837 0.58 W7 (368071.2,6185901.0) Vestas V90 (2 MW) 280 80 10.109 0.")
45 Figure 24 Screen shot of case study using WM05 measurements Summary results Parameter Total Average Minimum Maximum Net AEP [GWh] Gross AEP [GWh] Wake loss [%] Site results Site Location [m] Turbine Elevation [m a.s.l.] Height [m a.g.l.] Net AEP [GWh] Wake loss [%] W1 ( , ) Vestas V90 (2 MW) W2 ( , ) Vestas V90 (2 MW) W3 ( , ) Vestas V90 (2 MW) W4 ( , ) Vestas V90 (2 MW) W5 ( , ) Vestas V90 (2 MW) W6 ( , ) Vestas V90 (2 MW) W7 ( , ) Vestas V90 (2 MW) W8 ( , ) Vestas V90 (2 MW) W9 ( , ) Vestas V90 (2 MW) W10 ( , ) Vestas V90 (2 MW) W11 ( , ) Vestas V90 (2 MW) W12 ( , ) Vestas V90 (2 MW) 'W15' ( , ) Vestas V90 (2 MW) 'W14' ( , ) Vestas V90 (2 MW) 'W13' ( , ) Vestas V90 (2 MW) Site wind climates 38
46 Site Location [m] Height [m a.g.l.] A [m/s] k U [m/s] E [W/m²] RIX [%] drix [%] W1 ( , ) W2 ( , ) W3 ( , ) W4 ( , ) W5 ( , ) W6 ( , ) W7 ( , ) W8 ( , ) W9 ( , ) W10 ( , ) W11 ( , ) W12 ( , ) 'W15' ( , ) 'W14' ( , ) 'W13' ( , ) The wind farm lies in a map called 'WF-GL3-025+roughness'. The wind farm is in a project called 'Case study wind farm'. A wind atlas called 'WM05' was used to calculate the predicted wind climates. 39
47 6.3.3 Comparisons and remarks on the results of Case study wind farm at Stanford By comparing the results of the two different sets of WAsP calculations for the Case study wind farm at Stanford, it is evident that there is a significant impact of whether the calculations are based on the measurements at WM05 or whether they are based on the WASA NWA. The Table 8 below shows a summary of the two wind farm AEP calculations. Table 8 Comparison of Net AEP of the Case study wind farm at Stanford input to WAsP LIB-file from WM05 measurements Net AEP* Stanford case 149 GWh/y Several LIB-files nearest to each WTG 117 GWh/y WRF based NWA Over-estimation when using WM05 27 % * At simple assumptions incl. 100% availability, no losses, standard air density and standard WAsP parameters In view of the results of the WASA NWA verifications at WM05 seen in the Table 9 below it appears that the WRF-based NWA seems to be accurately representing the real wind as measured at the WM05. Table 9 Verification of WASA NWA at WM05 OWA [m/s] WRF [m/s] Difference WRF WM % The uncertainty of the AEP for the Case study wind farm at Stanford determined by the WASA NWA LIB-files is therefore most likely reasonably small. The difference of 27% between the AEP determined from the WM05 measurements and the estimate determined based on the WASA NWA, however, can be attributed to the regional mesoscale effects and the difference in the wind climate between the mast location and the wind farm location just 20 km to the west-north-west. The difference in the mesoscale wind climate can be seen in Figure 25, which shows the wind farm plotted on the generalised LIB-file values of annual average wind speed at 100m above flat ground level at 3 cm roughness for each 3 km x 3 km WRF grid cell. The case study site is still a quite good wind farm site from a wind resource point of view, which is seen in Figure 26. This shows the high-resolution wind resource values of annual average wind speed at 100m above ground level resulting from the microscale modelling. The reason for the good wind conditions found at the case study site is very much due to the local hill and the speed-up effect it generates, which is captured by the microscale modelling, whereas the mesoscale model does not see this hill due to its averaging of topography in its 3 km x 3km cells. 40

48 This case study shows the need for and value of combining mesoscale modelling and microscale modelling in order to capture the effects of the different scales in the flow modelling. Figure 25 Case study wind farm at Stanford - plotted on WASA NWA LIB-file values for each 3 km x 3 km WRF cell 41

49 Figure 26 Case study wind farm at Stanford - plotted on WASA high-resolution wind resource map with 250 m grid spacing 6.4 Case study Extreme wind analysis Wind farm development by a potential wind farm owner will also need a study of design wind conditions, for which the WASA Extreme Wind Atlas may be applied. The site assessment that a developer needs to do in order to classify the site can include the following: Use data downloaded from the WASA Extreme Wind Atlas to make an initial assessment of the site wind conditions. From this, the class of turbine suitable for the site can be determined from the IEC standard Analysis software (e.g. WAsP Engineering) can be used to then model the extreme wind and turbulence intensity at the point of interest (in this case nearest point to the WM05 location has been analysed). In case of using WAsP Engineering for the study, the site information concerning terrain is the same as that used in the WAsP modelling Figure 27 below is a screen image showing the Generalised Extreme Wind Climate imported into WAsP Engineering. 42

50 Figure 27 Generalised extreme wind climate (GEWC) file imported into WEng This estimate of the extreme 50 year return wind speed at 100m above ground level is 30.8m/s. 43


51 7 Accessing and using the WASA data There are two main project websites for data and documents: mainly for data and guidelines mostly news and information about the project There is also the website for forecast data: 44


52 Downloading the WASA data is basically possible by following the guidance available on the websites mentioned above. In this report it is briefly illustrated by showing some screen-shots of the key steps necessary, with a few comments intended to give an overview and guidance: 45

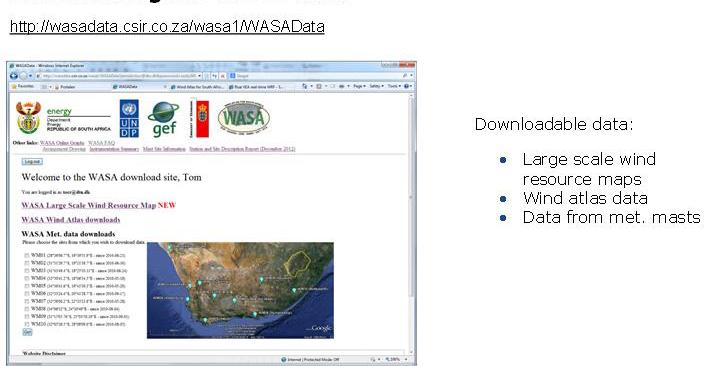
53 46

54 Reports and guidelines for WASA data are also available there directly: 47

55 News and information on the WASA project is available from: 8 Concluding remarks and recommendations for applications Wind atlas databases for the WASA domain of South Africa are now made available in the public domain from a WASA web-site although any use of these databases will be fully at the users own risk. Neither of the WASA partners SANEDI, CSIR, UCT, SAWS nor DTU will have any liability in connection with the use of the WASA databases or the reports made by the project. It is noted that WASA has produced Measurements and data from 3 years of measurement at 10 WASA stations 10 Observational Wind Atlases KAMM-based Numerical Wind Atlas March 2012 WRF-based Numerical Wind Atlas April 2014 Extreme Wind Atlas April 2014 All data and reports as well as guidelines for the application are available in the public domain. The WASA project has achieved a reduction in uncertainties and removed others completely in many aspects of wind resource assessment and assessment of wind turbine design conditions in South Africa. This has been achieved, firstly by setting up the 10 WASA met masts and recording wind data according to best practices for verification of the Numerical Wind Atlas for South Africa, and secondly through a thorough and systematic development of modelling methods that has included mesoscale 48
Vindatlas i Ægypten. Mortensen, Niels Gylling; Badger, Jake; Hansen, Jens Carsten. Publication date: Document Version Peer reviewed version
 Downloaded from orbit.dtu.dk on: Dec 19, 2017 Vindatlas i Ægypten Mortensen, Niels Gylling; Badger, Jake; Hansen, Jens Carsten Publication date: 2006 Document Version Peer reviewed version Link back to
Wind Resource Assessment Østerild National Test Centre for Large Wind Turbines
 Downloaded from orbit.dtu.dk on: Jan 21, 2018 Wind Resource Assessment Østerild National Test Centre for Large Wind Turbines Hansen, Brian Ohrbeck; Courtney, Michael; Mortensen, Niels Gylling Publication
Department of Wind Energy
 Planning and Development of Wind Farms: Wind Resource Assessment and Siting Department of Wind Energy I-Report Niels G. Mortensen DTU Wind Energy Report-I-45 December 2013 Author: Niels G. Mortensen Title:
Planning and Development of Wind Farms: Wind Resource Assessment and Siting
 Downloaded from orbit.dtu.dk on: Apr 21, 2018 Planning and Development of Wind Farms: Wind Resource Assessment and Siting Mortensen, Niels Gylling Publication date: 2012 Document Version Publisher's PDF,
Wind resource assessment using the WAsP software (DTU Wind Energy E-0135)
") Downloaded from orbit.dtu.dk on: Apr 21, 2018 Wind resource assessment using the WAsP software (DTU Wind Energy E-0135) Mortensen, Niels Gylling Publication date: 2016 Document Version Publisher's PDF,
Downloaded from orbit.dtu.dk on: Apr 21, 2018 Wind resource assessment using the WAsP software (DTU Wind Energy E-0135) Mortensen, Niels Gylling Publication date: 2016 Document Version Publisher's PDF,
How an extreme wind atlas is made
 How an extreme wind atlas is made AC Kruger South African Weather Service X Larsén DTU Wind Energy Wind 1 Atlas for South Africa (WASA) Why do we need extreme wind statistics? Statistical background for
Windcube FCR measurements
 Windcube FCR measurements Principles, performance and recommendations for use of the Flow Complexity Recognition (FCR) algorithm for the Windcube ground-based Lidar Summary: As with any remote sensor,
Torrild - WindSIM Case study
 Torrild - WindSIM Case study Note: This study differs from the other case studies in format, while here another model; WindSIM is tested as alternative to the WAsP model. Therefore this case should be
WP5 South African Extreme Wind Atlas (WASA)
") WP5 South African Extreme Wind Atlas (WASA) A Kruger South African Weather Service X Larsén DTU Wind Energy 1 Wind Atlas for South Africa project Why do we need extreme wind statistics? Origins of strong
WP5 South African Extreme Wind Atlas (WASA) A Kruger South African Weather Service X Larsén DTU Wind Energy 1 Wind Atlas for South Africa project Why do we need extreme wind statistics? Origins of strong
Complex terrain wind resource estimation with the wind-atlas method: Prediction errors using linearized and nonlinear CFD micro-scale models
 Downloaded from orbit.dtu.dk on: Dec 17, 2017 Complex terrain wind resource estimation with the wind-atlas method: Prediction errors using linearized and nonlinear CFD micro-scale models Troen, Ib; Bechmann,
Flow modelling hills complex terrain and other issues
 Flow modelling hills, complex terrain and other issues Modelling approaches sorted after complexity Rules of thumbs Codes and standards Linear model, 1 st order turbulence closure LINCOM/Wasp Reynolds-averaged
Validation of long-range scanning lidars deployed around the Høvsøre Test Station
 Downloaded from orbit.dtu.dk on: Dec 18, 2017 Validation of long-range scanning lidars deployed around the Høvsøre Test Station Lea, Guillaume; Courtney, Michael Publication date: 2016 Link back to DTU
Evaluation of four numerical wind flow models
 EWEA Resource Assessment Workshop 2013 Evaluation of four numerical wind flow models Michael C. Brower, PhD Chief Technical Officer Jose Vidal, MSc Consulting Services Europe & Latin America Manager Philippe
Fremtidens vindenergi en magisters historie på Risø og DTU
 Downloaded from orbit.dtu.dk on: Aug 15, 2018 Fremtidens vindenergi en magisters historie på Risø og DTU Mortensen, Niels Gylling Publication date: 2015 Document Version Peer reviewed version Link back
Comparison of NWP wind speeds and directions to measured wind speeds and directions
 Downloaded from orbit.dtu.dk on: Dec 3, 1 Comparison of NWP wind speeds and directions to measured wind speeds and directions Astrup, Poul; Mikkelsen, Torben Krogh Publication date: 1 Document Version
Measuring offshore winds from onshore one lidar or two?
 Downloaded from orbit.dtu.dk on: Dec 21, 2017 Measuring offshore winds from onshore one lidar or two? Vasiljevic, Nikola; Courtney, Michael; Pena Diaz, Alfredo; Lea, Guillaume; Vignaroli, Andrea Publication
Post-mortem study on structural failure of a wind farm impacted by super typhoon Usagi
 Downloaded from orbit.dtu.dk on: Nov 26, 2018 Post-mortem study on structural failure of a wind farm impacted by super typhoon Usagi Chen, Xiao; Li, Chuan Feng; Xu, Jian Zhong Publication date: 2015 Document
Aalborg Universitet. Published in: Proceedings of Offshore Wind 2007 Conference & Exhibition. Publication date: 2007
 Aalborg Universitet Design Loads on Platforms on Offshore wind Turbine Foundations with Respect to Vertical Wave Run-up Damsgaard, Mathilde L.; Gravesen, Helge; Andersen, Thomas Lykke Published in: Proceedings
Wind Atlas for the Gulf of Suez Satellite Imagery and Analyses
 Downloaded from orbit.dtu.dk on: Nov 09, 2017 Wind Atlas for the Gulf of Suez Satellite Imagery and Analyses Hasager, Charlotte Bay Publication date: 2003 Document Version Publisher's PDF, also known as
Sea state estimation from an advancing ship - The wave buoy analogy Presentation at Skibsteknisk Selskab
 Downloaded from orbit.dtu.dk on: Nov 17, 2018 Sea state estimation from an advancing ship - The wave buoy analogy Presentation at Skibsteknisk Selskab Nielsen, Ulrik Dam; Andersen, Ingrid Marie Vincent
Full Classification acc. to IEC for SoDAR AQ510 Wind Finder. Vincent Camier, Managing Director, Ammonit Measurement GmbH
 Full Classification acc. to IEC 61400-12-1 for SoDAR AQ510 Wind Finder Vincent Camier, Managing Director, Ammonit Measurement GmbH Ammonit Company Profile German company, based in Berlin +25 years of know-how
Are Advanced Wind Flow Models More Accurate? A Test of Four Models
 Are Advanced Wind Flow Models More Accurate? A Test of Four Models Philippe Beaucage, PhD Senior Research Scientist Michael C. Brower, PhD Chief Technical Officer Brazil Wind Power Conference 2012 Albany
The Wind Resource: Prospecting for Good Sites
 The Wind Resource: Prospecting for Good Sites Bruce Bailey, President AWS Truewind, LLC 255 Fuller Road Albany, NY 12203 bbailey@awstruewind.com Talk Topics Causes of Wind Resource Impacts on Project Viability
7 th International Conference on Wind Turbine Noise Rotterdam 2 nd to 5 th May 2017
 7 th International Conference on Wind Turbine Noise Rotterdam 2 nd to 5 th May 2017 Sound power level measurements 3.0 ir. L.M. Eilders, Peutz bv: l.eilders@peutz.nl ing. E.H.A. de Beer, Peutz bv: e.debeer@peutz.nl
Laser remote sensing for wind energy
 Downloaded from orbit.dtu.dk on: Sep 02, 2018 Mann, Jakob Published in: Proceedings Publication date: 2011 Document Version Publisher's PDF, also known as Version of record Link back to DTU Orbit Citation
Poland is one of the new countries, which seems to have the potential of being a large market for wind energy projects in the near future.
 Wind atlas for Midnorth POLAND. EMD/Per Nielsen 2001-10-31 Poland is one of the new countries, which seems to have the potential of being a large market for wind energy projects in the near future. EMD
Yawing and performance of an offshore wind farm
 Downloaded from orbit.dtu.dk on: Dec 18, 217 Yawing and performance of an offshore wind farm Friis Pedersen, Troels; Gottschall, Julia; Kristoffersen, Jesper Runge; Dahlberg, Jan-Åke Published in: Proceedings
Pre Feasibility Study Report Citiwater Cleveland Bay Purification Plant
 SOLAR POWER SPECIALISTS.Pure Power ACN 074 127 718 ABN 85 074 127 718 POWER MAGIC PTY LTD 245 INGHAM RD GARBUTT QLD 4814 Phone: 1800 068 977 Fax: 07 4725 2479 Email: FNQSOLAR@bigpond.com Pre Feasibility
CORRELATION EFFECTS IN THE FIELD CLASSIFICATION OF GROUND BASED REMOTE WIND SENSORS
 CORRELATION EFFECTS IN THE FIELD CLASSIFICATION OF GROUND BASED REMOTE WIND SENSORS Will Barker (1), Julia Gottschall (2), Michael Harris (3), John Medley (4), Edward Burin des Roziers (5), Chris Slinger
Wake effects at Horns Rev and their influence on energy production. Kraftværksvej 53 Frederiksborgvej 399. Ph.: Ph.
 Wake effects at Horns Rev and their influence on energy production Martin Méchali (1)(*), Rebecca Barthelmie (2), Sten Frandsen (2), Leo Jensen (1), Pierre-Elouan Réthoré (2) (1) Elsam Engineering (EE)
Meso- and Micro-scale modelling in China: Wind measurements at 12 meteorological stations in NE China (Dongbei)
") Downloaded from orbit.dtu.dk on: Nov 15, 2018 Meso- and Micro-scale modelling in China: Wind measurements at 12 meteorological stations in NE China (Dongbei) Lindelöw, Per Jonas Petter; Enevoldsen, Karen
Downloaded from orbit.dtu.dk on: Nov 15, 2018 Meso- and Micro-scale modelling in China: Wind measurements at 12 meteorological stations in NE China (Dongbei) Lindelöw, Per Jonas Petter; Enevoldsen, Karen
Exploring the limits of WAsP the wind atlas analysis and application program
 Downloaded from orbit.dtu.dk on: Jul 07, 2018 Exploring the limits of WAsP the wind atlas analysis and application program Bowen, A.J.; Mortensen, Niels Gylling Published in: 1996 European nion wind energy
Open Research Online The Open University s repository of research publications and other research outputs
 Open Research Online The Open University s repository of research publications and other research outputs Developing an intelligent table tennis umpiring system Conference or Workshop Item How to cite:
New Stuyahok-Ekwok Intertie Route Wind Power Site Options
 New Stuyahok-Ekwok Intertie Route Wind Power Site Options November 30, 2015 Douglas Vaught, P.E. V3 Energy, LLC Anchorage, Alaska www.v3energy.com New Stuyahok-Ekwok Intertie Wind Power Site Options Page
Wind Project Siting & Resource Assessment
 Wind Project Siting & Resource Assessment David DeLuca, Project Manager AWS Truewind, LLC 463 New Karner Road Albany, NY 12205 ddeluca@awstruewind.com www.awstruewind.com AWS Truewind - Overview Industry
Wind Flow Modeling: Are computationally intensive models more accurate?
 June 23 rd, 2015 Wind Flow Modeling: Are computationally intensive models more accurate? Philippe Beaucage, PhD Lead Research Scientist Michael C. Brower, PhD President & Chief Technical Officer Jose Vidal,
Wind Power Potential Assessment of Complex Terrain at RGPV Hill Top
 IJIRST International Journal for Innovative Research in Science & Technology Volume 1 Issue 10 March 2015 ISSN (online): 2349-6010 Wind Power Potential Assessment of Complex Terrain at RGPV Hill Top Syed
Reference wind speed anomaly over the Dutch part of the North Sea
 Reference wind speed anomaly over the Dutch part of the North Sea A.J. Brand This report has been presented at the European Offshore Wind 2009 Conference, Stockholm, 4-6 September, 2009 ECN-M--09-28 2
Outline. Wind Turbine Siting. Roughness. Wind Farm Design 4/7/2015
 Wind Turbine Siting Andrew Kusiak 2139 Seamans Center Iowa City, Iowa 52242-1527 andrew-kusiak@uiowa.edu Tel: 319-335-5934 Fax: 319-335-5669 http://www.icaen.uiowa.edu/~ankusiak Terrain roughness Escarpments
Study on wind turbine arrangement for offshore wind farms
 Downloaded from orbit.dtu.dk on: Jul 01, 2018 Study on wind turbine arrangement for offshore wind farms Shen, Wen Zhong; Mikkelsen, Robert Flemming Published in: ICOWEOE-2011 Publication date: 2011 Document
Remote sensing standards: their current status and significance for offshore projects
 Remote sensing standards: their current status and significance for offshore projects Peter J M Clive Technical Development Consultant SgurrEnergy Ltd 225 Bath Street Glasgow G2 4GZ E: peter.clive@sgurrenergy.com
Wade Reynolds 1 Frank Young 1,2 Peter Gibbings 1,2. University of Southern Queensland Toowoomba 4350 AUSTRALIA
 A Comparison of Methods for Mapping Golf Greens Wade Reynolds 1 Frank Young 1,2 Peter Gibbings 1,2 1 Faculty of Engineering and Surveying 2 Australian Centre for Sustainable Catchments University of Southern
LES* IS MORE! * L ARGE E DDY S IMULATIONS BY VORTEX. WindEnergy Hamburg 2016
 LES* IS MORE! * L ARGE E DDY S IMULATIONS BY VORTEX WindEnergy Hamburg 2016 OUTLINE MOTIVATION Pep Moreno. CEO, BASIS Alex Montornés. Modelling Specialist, VALIDATION Mark Žagar. Modelling Specialist,
New IEC and Site Conditions in Reality
 New IEC 61400-1 and Site Conditions in Reality Udo Follrichs Windtest Kaiser-Wilhelm-Koog GmbH Sommerdeich 14b, D-25709 Kaiser-Wilhelm-Koog Tel.: +49-4856-901-0, Fax: +49-4856-901-49 Axel Andreä, Kimon
Technical Brief - Wave Uprush Analysis Island Harbour Club, Gananoque, Ontario
 Technical Brief - Wave Uprush Analysis RIGGS ENGINEERING LTD. 1240 Commissioners Road West Suite 205 London, Ontario N6K 1C7 October 31, 2014 Table of Contents Section Page Table of Contents... i List
Wind Speed and Energy at Different Heights on the Latvian Coast of the Baltic Sea
 J. Energy Power Sources Vol. 1, No. 2, 2014, pp. 106-113 Received: July 1, 2014, Published: August 30, 2014 Journal of Energy and Power Sources www.ethanpublishing.com Wind Speed and Energy at Different
Tidal influence on offshore and coastal wind resource predictions at North Sea. Barbara Jimenez 1,2, Bernhard Lange 3, and Detlev Heinemann 1.
 Tidal influence on offshore and coastal wind resource predictions at North Sea Barbara Jimenez 1,2, Bernhard Lange 3, and Detlev Heinemann 1. 1 ForWind - Center for Wind Energy Research, University of
Increased Project Bankability : Thailand's First Ground-Based LiDAR Wind Measurement Campaign
 Increased Project Bankability : Thailand's First Ground-Based LiDAR Wind Measurement Campaign Authors: Velmurugan. k, Durga Bhavani, Ram kumar. B, Karim Fahssis As wind turbines size continue to grow with
Computational Fluid Dynamics
 Computational Fluid Dynamics A better understanding of wind conditions across the whole turbine rotor INTRODUCTION If you are involved in onshore wind you have probably come across the term CFD before
Comparison of flow models
 Comparison of flow models Rémi Gandoin (remga@dongenergy.dk) March 21st, 2011 Agenda 1. Presentation of DONG Energy 2. Today's presentation 1. Introduction 2. Purpose 3. Methods 4. Results 3. Discussion
Site Summary. Wind Resource Summary. Wind Resource Assessment For King Cove Date Last Modified: 8/6/2013 By: Rich Stromberg & Holly Ganser
 Site Summary Wind Resource Assessment For King Cove Date Last Modified: 8/6/2013 By: Rich Stromberg & Holly Ganser Station ID: 2857 Latitude: 55 7 45.8 N Longitude: 162 16 10.6 W Tower Type: 30 m NRG Tall
Introduction EU-Norsewind
 Satellite winds in EU-Norsewind Charlotte Bay Hasager, Risø DTU, Denmark Alexis Mouche, CLS, France Merete Badger, Poul Astrup & Morten Nielsen, Risø DTU, Denmark Romain Husson, ESA Introduction EU-Norsewind
Wind shear and its effect on wind turbine noise assessment Report by David McLaughlin MIOA, of SgurrEnergy
 Wind shear and its effect on wind turbine noise assessment Report by David McLaughlin MIOA, of SgurrEnergy Motivation Wind shear is widely misunderstood in the context of noise assessments. Bowdler et
Steady State Comparisons HAWC2 v12.5 vs HAWCStab2 v2.14: Integrated and distributed aerodynamic performance
 Downloaded from orbit.dtu.dk on: Jan 29, 219 Steady State Comparisons v12.5 vs v2.14: Integrated and distributed aerodynamic performance Verelst, David Robert; Hansen, Morten Hartvig; Pirrung, Georg Publication
On the use of rotor equivalent wind speed to improve CFD wind resource mapping. Yavor V. Hristov, PhD Plant Performance and Modeling Vestas TSS
 On the use of rotor equivalent wind speed to improve CFD wind resource mapping Yavor V. Hristov, PhD Plant Performance and Modeling Vestas TSS Firestorm- Number 53 on Top500 list from June 2011 14664 processors
P.O.Box 43 Blindern, 0313 Oslo, Norway Tel.: , Fax: Statkraft,Postboks 200 Lilleaker, 0216 Oslo, Norway ABSTRACT
 A NEW TESTSITE FOR WIND CORRECTION OF PRECIPITATION MEASUREMENTS AT A MOUNTAIN PLATEAU IN SOUTHERN NORWAY Mareile Wolff 1, Ragnar Brækkan 1, Ketil Isaaksen 1, Erik Ruud 2 1 Norwegian Meteorological Institute,
Influence of Persons' Movements on Ventilation Effectiveness Brohus, Henrik; Hyldig, Mikkel; Kamper, Simon; Vachek, Ulla Maria
 Aalborg Universitet Influence of Persons' Movements on Ventilation Effectiveness rohus, Henrik; Hyldig, Mikkel; Kamper, Simon; Vachek, Ulla Maria Published in: Proceedings of Indoor Air 2008 Publication
Aalborg Universitet. Estimation of wave conditions at Liseleje location Bogarino, Bruno; Brorsen, Michael. Publication date: 2007
 Aalborg Universitet Estimation of wave conditions at Liseleje location Bogarino, Bruno; Brorsen, Michael Publication date: 27 Document Version Publisher's PDF, also known as Version of record Link to publication
Temperature, salinity, density, and the oceanic pressure field
 Chapter 2 Temperature, salinity, density, and the oceanic pressure field The ratios of the many components which make up the salt in the ocean are remarkably constant, and salinity, the total salt content
WindPRO version Nov 2012 Project:
 23/11/2012 15:21 / 1 WAsP interface - Main Result Calculation: WAsP Interface example Name for WAsP Site coordinates UTM NAD27 Zone: 14 East: 451,101 North: 5,110,347 Air density calculation mode Result
Wind Flow Analysis on a Complex Terrain
 Wind Flow Analysis on a Complex Terrain A reliability study of a CFD tool on forested area including effects of forest module Eventuell figur/bild (Formatmall: Figure and picture text) Högskolan på Gotland
Evaluation of wind flow with a nacelle-mounted, continuous wave wind lidar
 Downloaded from orbit.dtu.dk on: Jun 30, 2018 Evaluation of wind flow with a nacelle-mounted, continuous wave wind lidar Medley, John; Barker, Will; Harris, Mike; Pitter, Mark; Slinger, Chris; Mikkelsen,
National Renewable Energy Laboratory. Wind Resource Data Summary Guam Naval Ordnance Annex Data Summary and Retrieval for November 2009
 National Renewable Energy Laboratory Wind Resource Data Summary Guam Naval Ordnance Annex Data Summary and Retrieval for November 2009 Prepared for: National Renewable Energy Laboratory 1617 Cole Boulevard
The OWEZ Meteorological Mast
 The OWEZ Meteorological Mast Analysis of mast-top displacements P.J. Eecen E. Branlard ECN-E--08-067 OWEZ_R_121_mast_top_movement Acknowledgement/Preface The Off Shore wind Farm Egmond aan Zee has a subsidy
Xiaoli Guo Larsén,* Søren Larsen and Andrea N. Hahmann Risø National Laboratory for Sustainable Energy, Roskilde, Denmark
 Quarterly Journal of the Royal Meteorological Society Q. J. R. Meteorol. Soc. 138: 274 279, January 2012 A Notes and Correspondence Origin of the waves in A case-study of mesoscale spectra of wind and
Validation of Measurements from a ZephIR Lidar
 Validation of Measurements from a ZephIR Lidar Peter Argyle, Simon Watson CREST, Loughborough University, Loughborough, United Kingdom p.argyle@lboro.ac.uk INTRODUCTION Wind farm construction projects
Wave Energy Atlas in Vietnam
 Wave Energy Atlas in Vietnam Nguyen Manh Hung, Duong Cong Dien 1 1 Institute of Mechanics, 264 Doi Can Str. Hanoi, Vietnam nmhungim@gmail.com; duongdienim@gmail.com Abstract Vietnam has achieved remarkable
2 Asymptotic speed deficit from boundary layer considerations
 EWEC Techn.track Wake, paper ID 65 WAKE DECAY CONSTANT FOR THE INFINITE WIND TURBINE ARRAY Application of asymptotic speed deficit concept to existing engineering wake model. Ole Steen Rathmann, Risø-DTU
CHANGE OF THE BRIGHTNESS TEMPERATURE IN THE MICROWAVE REGION DUE TO THE RELATIVE WIND DIRECTION
 JP4.12 CHANGE OF THE BRIGHTNESS TEMPERATURE IN THE MICROWAVE REGION DUE TO THE RELATIVE WIND DIRECTION Masanori Konda* Department of Geophysics, Graduate School of Science, Kyoto University, Japan Akira
HOUTEN WIND FARM WIND RESOURCE ASSESSMENT
 CIRCE CIRCE Building Campus Río Ebro University de Zaragoza Mariano Esquillor Gómez, 15 50018 Zaragoza Tel.: 976 761 863 Fax: 976 732 078 www.fcirce.es HOUTEN WIND FARM WIND RESOURCE ASSESSMENT CIRCE AIRE
Meteorological Measurements OWEZ
 Meteorological Measurements OWEZ Half year report 01-01-2008-30-06-2008 H. Korterink P.J. Eecen ECN-E--08-062 OWEZ_R_121_20080101-20080630_wind_resource_2008_1 Abstract NoordzeeWind carries out an extensive
Tutorial for the. Total Vertical Uncertainty Analysis Tool in NaviModel3
 Tutorial for the Total Vertical Uncertainty Analysis Tool in NaviModel3 May, 2011 1. Introduction The Total Vertical Uncertainty Analysis Tool in NaviModel3 has been designed to facilitate a determination
Upgrading Vestas V47-660kW
 Guaranteed performance gains and efficiency improvements Upgrading Vestas V47-660kW Newly developed controller system enables increased Annual Energy Production up to 6.1% and safe turbine lifetime extension
Siting classification for Surface. Michel Leroy, Météo-France
 Siting classification for Surface Observing Stations ti on Land Michel Leroy, Météo-France Content of the presentation Quality factors of a measurement Site representativeness Siting classification Experience
ASSESSING THE ACCURACY OF WASP IN NON-SIMPLE TERRAIN. Meteorological and Wind Energy Dept., Risø National Laboratory, Roskilde, Denmark 2
 Paper presented at the BWEA18 conference 24-27 Sept., 1996, University of Exeter, Exeter,UK. ASSESSING THE ACCURACY OF WASP IN NON-SIMPLE TERRAIN. Ole Rathmann 1, Niels G. Mortensen 1, Lars Landberg 1
Wind Plant Simulation and Validation Jonathan Naughton Department of Mechanical Engineering University of Wyoming
 Wind Plant Simulation and Validation Jonathan Naughton Department of Mechanical Engineering University of Wyoming 1 Overview Wind s Success Wind s Challenges Wind Plant Simulation and Validation Summary
Wind Regimes 1. 1 Wind Regimes
 Wind Regimes 1 1 Wind Regimes The proper design of a wind turbine for a site requires an accurate characterization of the wind at the site where it will operate. This requires an understanding of the sources
Urban Environmental Climate Maps for Urban Planning Considering Urban Heat Island Mitigation in Hiroshima
 Academic Article Journal of Heat Island Institute International Vol. 9-2 (2014) Urban Environmental Climate Maps for Urban Planning Considering Urban Heat Island Mitigation in Hiroshima Kaoru Matsuo* 1
Marine Renewables Industry Association. Marine Renewables Industry: Requirements for Oceanographic Measurements, Data Processing and Modelling
 Marine Renewables Industry Association Marine Renewables Industry: Requirements for Oceanographic Measurements, Data Processing and Modelling October 2009 Table of Contents 1. Introduction... 1 2. Measurements
Advanced pre and post-processing in Windsim
 University of Perugia Department of Industrial Engineering Francesco Castellani Advanced pre and post-processing in Windsim CONTENTS Pre-processing 1) Domain control: *.gws construction 2) Advanced grid
Meteorological Measurements OWEZ
 Meteorological Measurements OWEZ Half year report - 01-07-2008-31-12-2008 H. Korterink P.J. Eecen J.W. Wagenaar ECN-E--09-018 OWEZ_R_121_20080701-20081231_WIND_RESOURCE_2008_2 Abstract NoordzeeWind carries
USING SATELLITE SAR IN OFFSHORE WIND RESOURCE ASSESSMENT
 USING SATELLITE SAR IN OFFSHORE WIND RESOURCE ASSESSMENT B. R. Furevik (1), C. B. Hasager (2), M. Nielsen (2), T. Hamre (1), B. H. Jørgensen (2), O. Rathmann (2), and O. M. Johannessen (1,3) (1) Nansen
Available online at ScienceDirect. Energy Procedia 53 (2014 )
") Available online at www.sciencedirect.com ScienceDirect Energy Procedia 53 (2014 ) 156 161 EERA DeepWind 2014, 11th Deep Sea Offshore Wind R&D Conference Results and conclusions of a floating-lidar offshore
Available online at www.sciencedirect.com ScienceDirect Energy Procedia 53 (2014 ) 156 161 EERA DeepWind 2014, 11th Deep Sea Offshore Wind R&D Conference Results and conclusions of a floating-lidar offshore
OPERATIONAL AMV PRODUCTS DERIVED WITH METEOSAT-6 RAPID SCAN DATA. Arthur de Smet. EUMETSAT, Am Kavalleriesand 31, D Darmstadt, Germany ABSTRACT
 OPERATIONAL AMV PRODUCTS DERIVED WITH METEOSAT-6 RAPID SCAN DATA Arthur de Smet EUMETSAT, Am Kavalleriesand 31, D-64295 Darmstadt, Germany ABSTRACT EUMETSAT started its Rapid Scanning Service on September
RSKtools for Matlab processing RBR data
 Table of Contents Introduction... 1 RSKtools help... 1 Getting set up... 1 Remove atmospheric pressure from measured total pressure... 2 Correct for A2D zero-order hold... 2 Low-pass filtering... 3 Alignment
BASELINE SURVEY, VISUAL - SITE SPECIFIC
 BASELINE SURVEY, VISUAL - SITE SPECIFIC Introduction As stated in SEPA s policy and in the Fish Farm Manual (1998), scientific data are required by SEPA in order to assess the existing condition on the
WIND CONDITIONS MODELING FOR SMALL WIND TURBINES
 U.P.B. Sci. Bull., Series C, Vol. 77, Iss. 2, 2015 ISSN 2286-3540 WIND CONDITIONS MODELING FOR SMALL WIND TURBINES Viorel URSU 1, Sandor BARTHA 2 Wind energy systems are a solution which became cost effective
Characterizing Ireland s wave energy resource
 Snapshots of Doctoral Research at University College Cork 2011 Characterizing Ireland s wave energy resource Brendan Cahill Hydraulics & Maritime Research Centre, UCC Introduction In theory, the energy
Valerijs Bezrukovs, Vladislavs Bezrukovs Ventspils University College Latvia. WREF2012 Denver, CO May 13-17, 2012
 Valerijs Bezrukovs, Vladislavs Bezrukovs Ventspils University College Latvia WREF2012 Denver, CO May 13-17, 2012 Baltic countries 2 Currently rise of WPP development in Baltic countries. Attractive for
Wind Flow Validation Summary
 IBHS Research Center Validation of Wind Capabilities The Insurance Institute for Business & Home Safety (IBHS) Research Center full-scale test facility provides opportunities to simulate natural wind conditions
Wind Data Verification Report Arriga 50m
 Page 1 of 11 Site Name Site Details 9531 - Arriga 5m Arriga 5m Date/Time of report generation 27/11/212 4:22 PM Site Number 9531 Mast Height 5m Mast Location 32568 E 811256 N Coordinate System UTM 55K
ADVANCES ON WIND ENERGY RESOURCE MAPPING FROM SAR
 ADVANCES ON WIND ENERGY RESOURCE MAPPING FROM SAR C.B. Hasager, M. Nielsen, M.B. Christiansen, R. Barthelmie, P. Astrup Risoe National Laboratory, Wind Energy Department, Frederiksborgvej 399, DK-4000
Beamex. Calibration White Paper. Weighing scale calibration - How to calibrate weighing instruments
 Beamex Calibration White Paper info@beamex.com Weighing scale calibration - How to calibrate weighing instruments Weighing scale calibration - How to calibrate weighing instruments Weighing scales, weighing
Atmospheric air density analysis with Meteo- 40S wind monitoring system
 MATEC Web of Conferences, 7 (7) DOI:./ matecconf/77 IManE&E 7 Atmospheric air density analysis with Meteo- S wind monitoring system Dănuț Zahariea,*, and Dorin Emil Husaru Gheorghe Asachi Technical University
July Interim Report. National Institute of Wind Energy (NIWE) Wind Resource Assessment & Offshore Unit Chennai, India.
 Wind Resource Assessment & Offshore Unit Chennai, India.") Interim Report (First Offshore Lidar wind data analysis) July 2018 Prepared by National Institute of Wind Energy (NIWE) Wind Resource Assessment & Offshore Unit Chennai, India. W I N D R E S O U R C E
Interim Report (First Offshore Lidar wind data analysis) July 2018 Prepared by National Institute of Wind Energy (NIWE) Wind Resource Assessment & Offshore Unit Chennai, India. W I N D R E S O U R C E
3D Turbulence at the Offshore Wind Farm Egmond aan Zee J.W. Wagenaar P.J. Eecen
 3D Turbulence at the Offshore Wind Farm Egmond aan Zee J.W. Wagenaar P.J. Eecen OWEZ_R_121_3Dturbulence_20101008 ECN-E--10-075 OCTOBER 2010 Abstract NoordzeeWind carries out an extensive measurement and
Wind resource assessment over a complex terrain covered by forest using CFD simulations of neutral atmospheric boundary layer with OpenFOAM
 Wind resource assessment over a complex terrain covered by forest using CFD simulations of neutral atmospheric boundary layer with OpenFOAM Nikolaos Stergiannis nstergiannis.com nikolaos.stergiannis@vub.ac.be
SUPPLEMENTARY GUIDANCE NOTE 4: WIND SHEAR
 A GOOD PRACTICE GUIDE TO THE APPLICATION OF ETSU-R-97 FOR THE ASSESSMENT AND RATING OF WIND TURBINE NOISE SUPPLEMENTARY GUIDANCE NOTE 4: WIND SHEAR ISSUE 1 JULY 2014 Page 1 of 14 PREFACE This document
WindProspector TM Lockheed Martin Corporation
 WindProspector TM www.lockheedmartin.com/windprospector 2013 Lockheed Martin Corporation WindProspector Unparalleled Wind Resource Assessment Industry Challenge Wind resource assessment meteorologists
Session 2a: Wind power spatial planning techniques. IRENA Global Atlas Spatial planning techniques 2-day seminar
 Session 2a: Wind power spatial planning techniques IRENA Global Atlas Spatial planning techniques 2-day seminar Central questions we want to answer After having identified those areas which are potentially