FISH 415 LIMNOLOGY UI Moscow
|
|
|
- Lesley Thornton
- 5 years ago
- Views:
Transcription
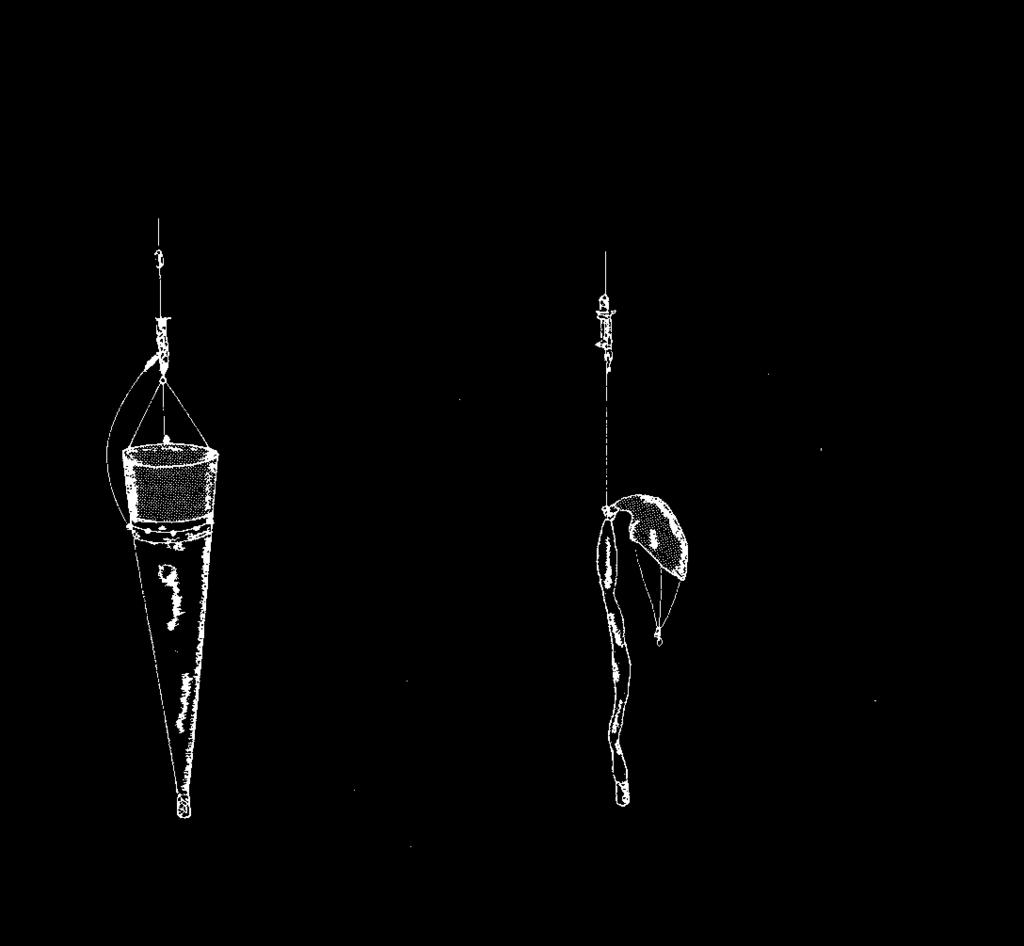
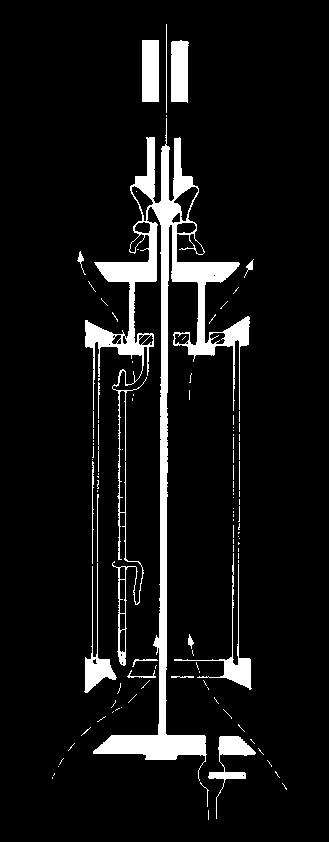
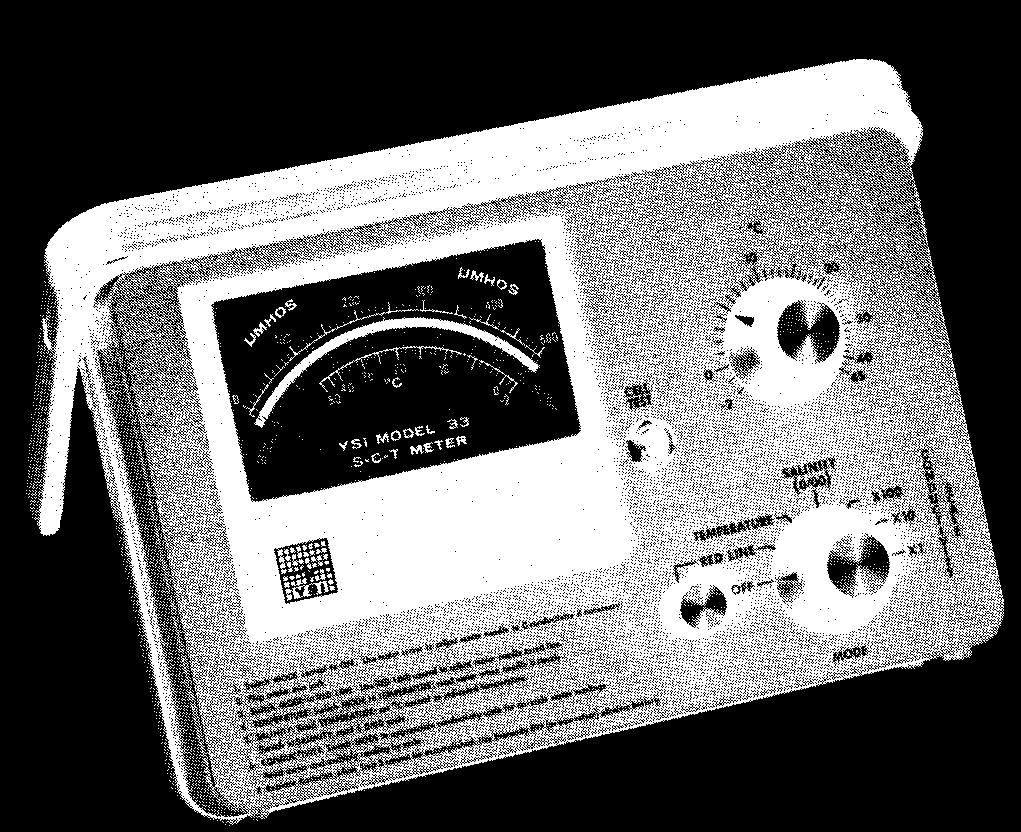
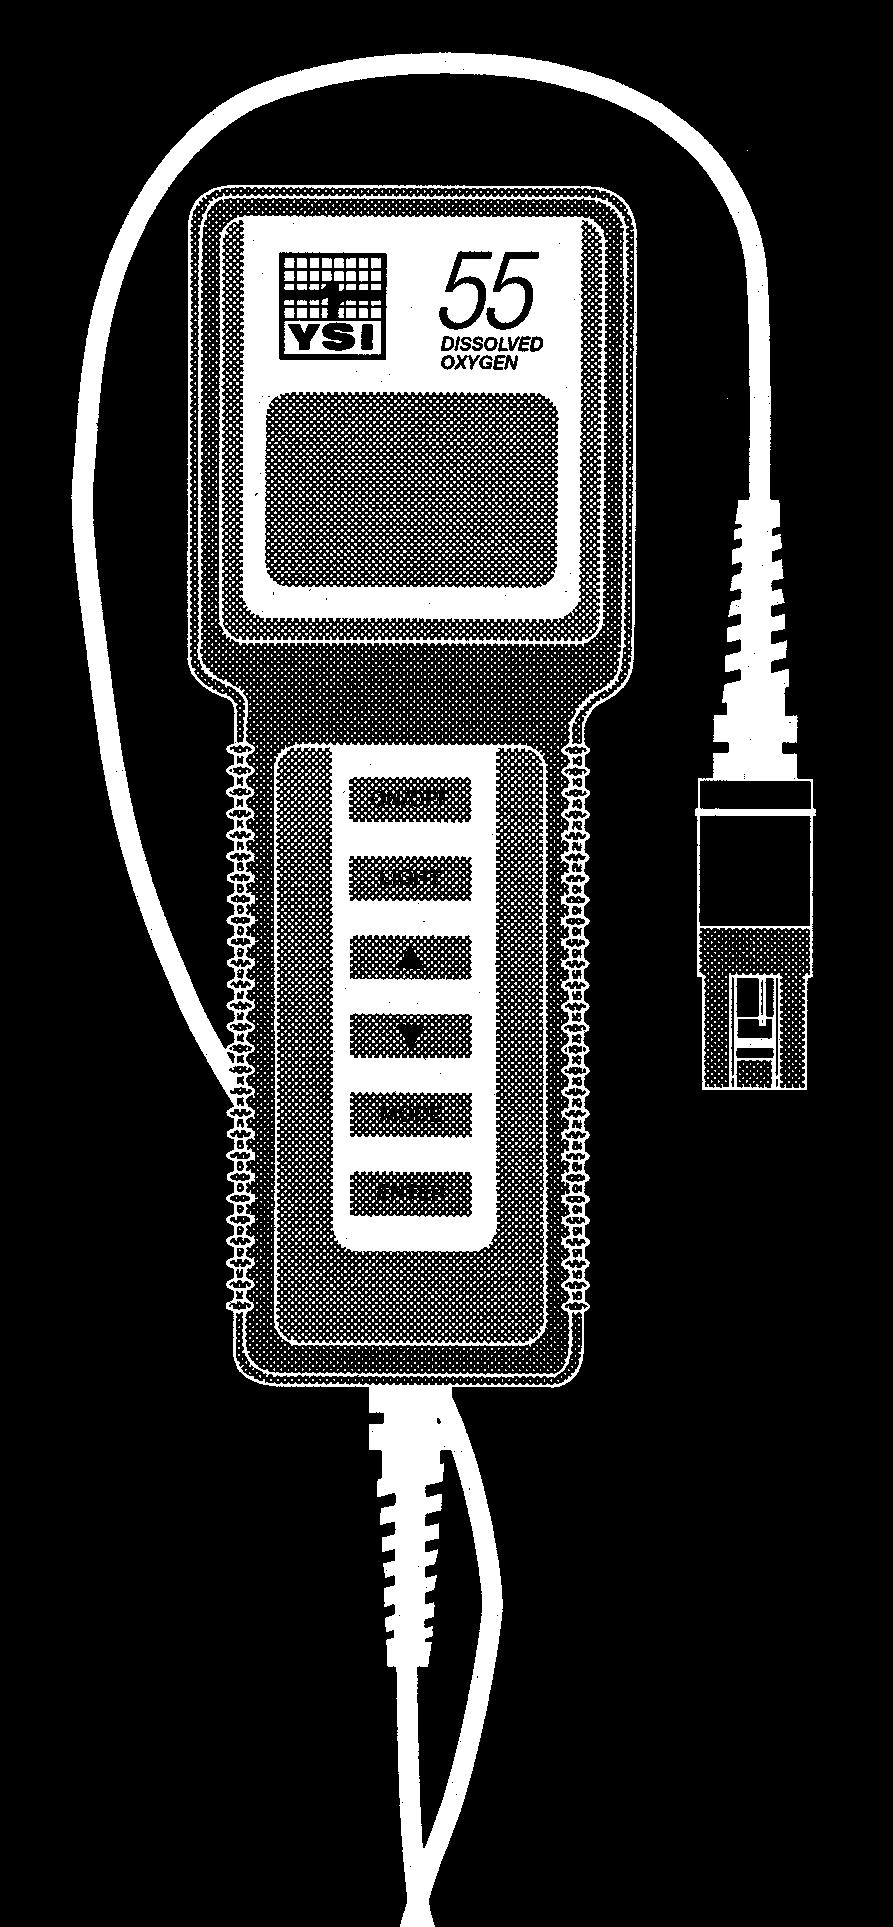
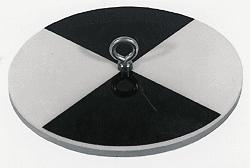
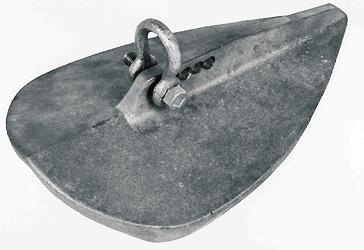
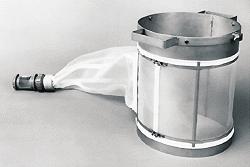
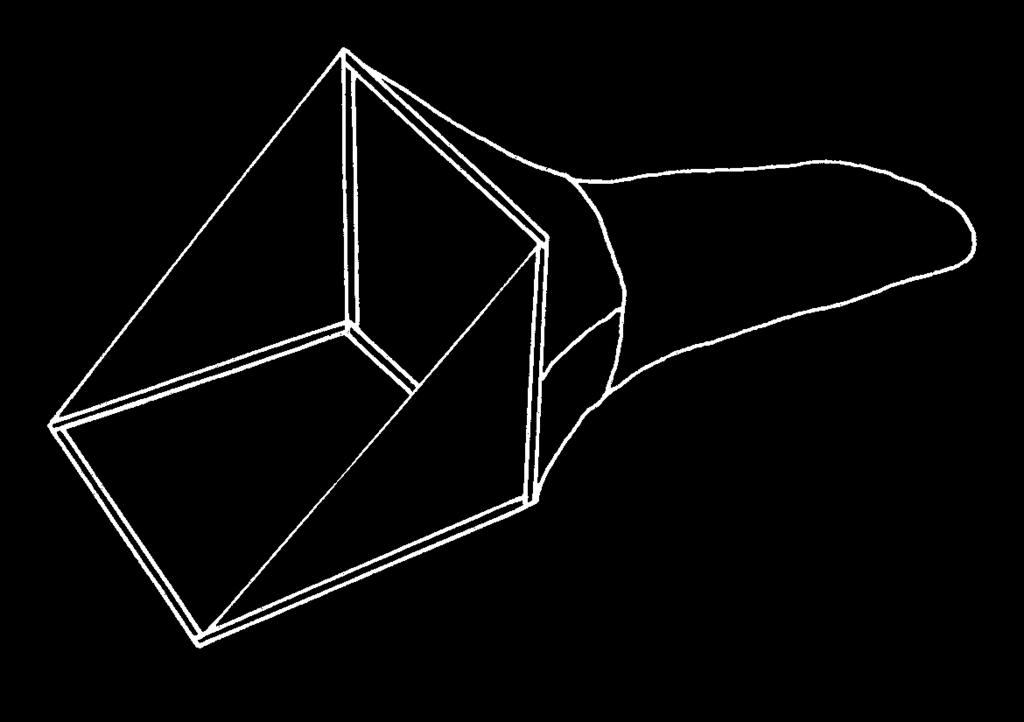
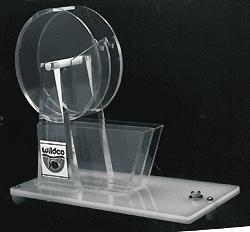
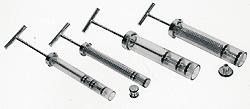
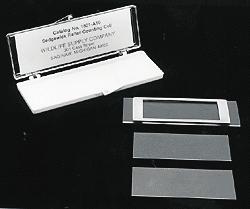
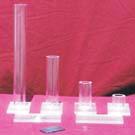
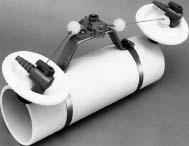
1 Sampling Equipment Lab FISH 415 LIMNOLOGY UI Moscow Purpose: - to familiarize you with limnological sampling equipment - to use some of the equipment to obtain profiles of temperature, dissolved oxygen, conductivity and light. - to produce limnological figures of the profiles. PART I EQUIPMENT Attached are drawings and pictures of standard limnological sampling equipment. You will be responsible for knowing the name and use of each. Be sure you understand the proper use of each as well as the operation of trigger mechanisms. If not sure ask. PART II SAMPLING We will use multi-probe meters to obtain data from two artificial lakes outside the CNR building. Record all of your observations and make sure a copy is turned in to the T.A. for posting. Your data will be available via and excel spreadsheet on the course web page after the lab. 1) Use the YSI DO/temp meters and probes to obtain profiles of temperature ( C), dissolved oxygen (mg/l and % saturation), conductivity (ìs) and ph of each of the two lakes. Use m intervals - the smaller the interval, the better your profile resolution. Typically the interval would be 0.5 to 1 m. ASSIGNMENT 1 Analysis of Profiles Purpose: - to analyze collected data and produce limnological figures - learn use of spreadsheets - perform simple statistics, regression analysis to calculate extinction coefficients. Data you will use are those you collected from the limnology lakes as well as some recent ones collected from a reservoir in Oregon. This will give you a chance to compare different water bodies. The data are available from the course website ( Labs and field trip tab. Computer spreadsheet You should be able to complete this lab on any computer running Microsoft Excel. (Note these instructions assume you are running Microsoft the most recent install on all university computers - if you are using an older version, the menus will be slightly different. Given the university software agreement with Microsoft you can obtain 2007 at no charge, use it. Be sure you are comfortable with how to maneuver around in the spreadsheet, graph the
2 data, combine plots on one page, and the proper anatomy of a scientific figure. You will be expected to hand in your figures in proper format. There are computer labs available for your use across campus - check the IT website for info and hours. Tasks: 1) Plot profiles of temperature, dissolved oxygen (mg/l only), conductivity, ph and light for the Limnology Lakes and Willow Creek Reservoir. Place the data for the two limnology lakes on separate graphs on one page (i.e., one plot for all temperature profiles, one for all oxygen etc. and those for Willow Creek on a separate page (5 graphs/page = 2 pages). Each profile on each graph should be easy to distinguish (use different symbols and line types - do not use color). Make sure each figure has a proper caption that indicates what is the figure is about. (The idea here is that if the figure fell out of your notebook and someone picked it up they could interpret it). Write a short paragraph to summarize major trends in the data for each figure. This should be similar to the results section of a published manuscript - check the results section of the primary literature (journals e.g., L&O) for examples. 2) For light profiles for Willow Creek Reservoir, calculate the extinction coefficient. Do the calculations in two ways: i) calculate the extinction coefficient for each interval for each profile and then calculate the average for each profile; and ii) perform a regression analysis using depth as the independent variable and ln (natural log) irradiance as the dependent variable. The slope of this relationship will be the extinction coefficient (ignore the negative). (For regression, you will need to have the MS Analysis Tool pack installed on your computer - Excel typically does not install this automatically during a normal install. Go to Tools and see if you have a Data Analysis option - if not, go to Add Ins and check Analysis ToolPack - Excel may require the original installation disk). Use the table on sheet 2 of the spreadsheet - it is already set up for you. Don t forget that you want to use ln (natural log) of irradiance as the dependent (Y) variable. Prepare a proper table listing your calculated extinction coefficient(s). Calculate the depth at which 1% of the surface irradiance remains for each profile. How does this compare to 2z? sd Figure 1A. Plot of temperature versus depth for Campus Lake on August 22, 2003, Jackson Co. Illinois, USA. Note: I expect figures to be in the proper limnological format, and properly labeled. Check a
3 common journal to ensure you have all the necessary information on each figure. Your narratives should be grammatically correct and free of spelling errors. You don t have to put the figure caption below each figure, instead you can hand in a page of figure captions listing the figure number and corresponding caption. Grading Criteria for assignment Figures (Each) 5 - figures complete including caption (labeled axes, units, lines and symbols different for different sites or times, all details present, no color). For profiles, Depth on y axis, increasing from top to bottom, variable measured on x axis at top of graph. 4 - figure caption missing or incomplete, use of color 3 - figure caption missing or incomplete, symbols and lines do not clearly distinguish sites or times. 2 - figure caption missing or incomplete, symbols and lines do not clearly distinguish sites or times, axes not labeled or units missing. 1 - figure caption missing or incomplete, symbols and lines do not clearly distinguish sites or times, axes not labeled or units missing, variables on wrong axes. Narrative (Each) 3 - complete paragraph, including topic sentence, highlights major trends seen in accompanying figure in writing. Includes range of numbers allowing reader to quantitatively reconstruct figure. 2 - paragraph structure incomplete, missing highlight of major trends or fails to include overview of main numbers from figure. 1 - paragraph not complete, does not include major trends in accompanying figure and does not include main numbers from figure. Extinction 5 - correctly calculated for all 3 profiles, table completed coefficient 4 - Not all extinction coefficients correct, table completed 3 - incorrect coefficients, tables not completed 2 - partial execution of calculations 1 - no extinction coefficients completed

4
5
6
FISH 415 LIMNOLOGY UI Moscow
 FISH 415 LIMNOLOGY UI Moscow Sampling Equipment Purpose: - to familiarize you with limnological sampling equipment - to use some of the equipment to obtain profiles of temperature, dissolved oxygen, conductivity
BEFORE YOU OPEN ANY FILES:
 Dive Analysis Lab * Make sure to download all the data files for the lab onto your computer. * Bring your computer to lab. * Bring a blank disk or memory stick to class to save your work and files. The
BEFORE YOU OPEN ANY FILES:
 Dive Analysis Lab *If you are using a school computer bring a USB drive to class to save your work and the files for the lab. *If you are using your own computer, make sure to download the data and files
Inquiry Investigation: Factors Affecting Photosynthesis
 Inquiry Investigation: Factors Affecting Photosynthesis Background Photosynthesis fuels ecosystems and replenishes the Earth's atmosphere with oxygen. Like all enzyme-driven reactions, the rate of photosynthesis
Graphing Activities This lab was created by Mr. Buckley from Edward Knox High School. Credit is given for this original activity to Mr. Buckley.
 Name: Date Completed: Class: Teacher: Graphing Activities This lab was created by Mr. Buckley from Edward Knox High School. Credit is given for this original activity to Mr. Buckley. Introduction Graphing
Chapter 12 Practice Test
 Chapter 12 Practice Test 1. Which of the following is not one of the conditions that must be satisfied in order to perform inference about the slope of a least-squares regression line? (a) For each value
LESSON 5: THE BOUNCING BALL
 352 - LINEAR B EHAVIOR LESSON 5: THE BOUNCING BALL y Notes to the Instructor Time: This lesson should take one class session. Materials: Two meter sticks or one tape measure per group, masking tape, balls
POTENTIAL ENERGY BOUNCE BALL LAB
 Energy cannot be created or destroyed. Stored energy is called potential energy, and the energy of motion is called kinetic energy. Potential energy changes as the height of an object changes due to gravity;
Boyle s Law: Pressure-Volume Relationship in Gases
 Boyle s Law: Pressure-Volume Relationship in Gases The primary objective of this experiment is to determine the relationship between the pressure and volume of a confined gas. The gas we will use is air,
[CROSS COUNTRY SCORING]
![[CROSS COUNTRY SCORING]](/thumbs/89/99405973.jpg "[CROSS COUNTRY SCORING]") 2018 The Race Director Guide [CROSS COUNTRY SCORING] This document describes the setup and scoring processes employed when scoring a cross country race with Race Director. Contents Intro... 3 Division
2018 The Race Director Guide [CROSS COUNTRY SCORING] This document describes the setup and scoring processes employed when scoring a cross country race with Race Director. Contents Intro... 3 Division
OXYGEN CONSUMPTION AND TEMPERATURE IN THE AQUATIC ENVIRONMENT
 OXYGEN CONSUMPTION AND TEMPERATURE IN THE AQUATIC ENVIRONMENT BACKGROUND READING Animal Physiology by Hill, Wyse & Anderson, 2004: pp. 130 139 & 198 201. PRE-LAB (Due at the start of the lab) ** In your
Boyle s Law. Pressure-Volume Relationship in Gases. Figure 1
 Boyle s Law Pressure-Volume Relationship in Gases The primary objective of this experiment is to determine the relationship between the pressure and volume of a confined gas. The gas we use will be air,
NAME: A graph contains five major parts: a. Title b. The independent variable c. The dependent variable d. The scales for each variable e.
 NAME: Graphing is an important procedure used by scientists to display the data that is collected during a controlled experiment. Line graphs demonstrate change over time and must be constructed correctly
Purpose: Hypothesis: Procedure:
 Name: Block: Properties of Water Lab As we have discussed in class and on notes, water has many unique properties that are critical to life on Earth. The goal of this lab is to study the properties of
100-Meter Dash Olympic Winning Times: Will Women Be As Fast As Men?
 100-Meter Dash Olympic Winning Times: Will Women Be As Fast As Men? The 100 Meter Dash has been an Olympic event since its very establishment in 1896(1928 for women). The reigning 100-meter Olympic champion
Boyle s Law: Pressure-Volume Relationship in Gases. PRELAB QUESTIONS (Answer on your own notebook paper)
") Boyle s Law: Pressure-Volume Relationship in Gases Experiment 18 GRADE LEVEL INDICATORS Construct, interpret and apply physical and conceptual models that represent or explain systems, objects, events
Boyle s Law: Pressure-Volume Relationship in Gases Experiment 18 GRADE LEVEL INDICATORS Construct, interpret and apply physical and conceptual models that represent or explain systems, objects, events
Aerobic Respiration. Evaluation copy
 Aerobic Respiration Computer 17 Aerobic cellular respiration is the process of converting the chemical energy of organic molecules into a form immediately usable by organisms. Glucose may be oxidized completely
Lesson 14: Modeling Relationships with a Line
 Exploratory Activity: Line of Best Fit Revisited 1. Use the link http://illuminations.nctm.org/activity.aspx?id=4186 to explore how the line of best fit changes depending on your data set. A. Enter any
Ozobot Bit Classroom Application: Boyle s Law Simulation
 OZO AP P EAM TR T S BO RO VE D Ozobot Bit Classroom Application: Boyle s Law Simulation Created by Richard Born Associate Professor Emeritus Northern Illinois University richb@rborn.org Topics Chemistry,
MoLE Gas Laws Activities
 MoLE Gas Laws Activities To begin this assignment you must be able to log on to the Internet using Internet Explorer (Microsoft) 4.5 or higher. If you do not have the current version of the browser, go
Solubility Unit. Solubility Unit Teacher Guide L1-3. Introduction:
 Solubility Unit Introduction: In this unit the students will learn about solubility. Students should already be familiar with the basic chemistry concepts. They should know that some substances are soluble
Higher, Lower; Faster, Slower? Student Data Page Activity 4B Part 2
 Activity Materials: (Per Group): Higher, Lower; Faster, Slower? Student Data Page Activity 4B Part 2 30 cm ramp made of cardboard Meter stick Table Ring stand 16 Washers or weight set Pom-Pom Granny Model
GEOG112 - Assignment 2. Site A Site B Site C Temp ( C) Altitude (km) Temp ( C)
 Altitude (km) Temp ( C)") GEOG112 - Assignment 2 Name Spring 2019 18 pts possible Site A Site B Site C Temp ( C) Altitude (km) Temp ( C) Altitude (km) Temp ( C) Altitude (km) 24 0 30 0 15 0 10 1 18 1 4 1 14 2 14 2-3 2 9 3 8 3-7
GEOG112 - Assignment 2 Name Spring 2019 18 pts possible Site A Site B Site C Temp ( C) Altitude (km) Temp ( C) Altitude (km) Temp ( C) Altitude (km) 24 0 30 0 15 0 10 1 18 1 4 1 14 2 14 2-3 2 9 3 8 3-7
Overview. Learning Goals. Prior Knowledge. UWHS Climate Science. Grade Level Time Required Part I 30 minutes Part II 2+ hours Part III
 Draft 2/2014 UWHS Climate Science Unit 3: Natural Variability Chapter 5 in Kump et al Nancy Flowers Overview This module provides a hands-on learning experience where students will analyze sea surface
In addition to reading this assignment, also read Appendices A and B.
 1 Kinematics I Introduction In addition to reading this assignment, also read Appendices A and B. We will be using a motion detector to track the positions of objects with time in several lab exercises
Quantitative Analysis of Hydrocarbons by Gas Chromatography
 Quantitative Analysis of Hydrocarbons by Gas Chromatography Introduction Gas-liquid chromatography (GLC) accomplishes a separation by partitioning solutes between a mobile gas phase and a stationary liquid
Name Student Activity
 Open the TI-Nspire document Boyles_Law.tns. In this activity, you will use a Gas Pressure Sensor to measure the pressure of an air sample inside a syringe. Using graphs, you will apply your results to
Add this important safety precaution to your normal laboratory procedures:
 Student Activity Worksheet Speed and Velocity Are You Speeding? Driving Question What is speed and how is it related to velocity? Materials and Equipment For each student or group: Data collection system
Vapor Pressure of Liquids
 Vapor Pressure of Liquids In this experiment, you will investigate the relationship between the vapor pressure of a liquid and its temperature. When a liquid is added to the Erlenmeyer flask shown in Figure
BIOL 101L: Principles of Biology Laboratory
 BIOL 101L: Principles of Biology Laboratory Sampling populations To understand how the world works, scientists collect, record, and analyze data. In this lab, you will learn concepts that pertain to these
Lab #12:Boyle s Law, Dec. 20, 2016 Pressure-Volume Relationship in Gases
 Chemistry Unit 6:States of Matter & Basic Gas Laws Name Lab Partner Lab #12:Boyle s Law, Dec. 20, 2016 Pressure-Volume Relationship in Gases Purpose: The primary objective of this experiment is to determine
Objective Determine how the speed of a runner depends on the distance of the race, and predict what the record would be for 2750 m.
 Mechanics Activity: Track Records Student Worksheet Objective Determine how the speed of a runner depends on the distance of the race, and predict what the record would be for 2750 m. Introduction Now
OXYGEN CONSUMPTION AND TEMPERATURE IN THE AQUATIC ENVIRONMENT
 OXYGEN CONSUMPTION AND TEMPERATURE IN THE AQUATIC ENVIRONMENT BACKGROUND READING Animal Physiology by Hill, Wyse & Anderson, 2004: pp. 130 139 & 198 201. Living material Freshwater fish, probably goldfish.
b. Graphs provide a means of quickly comparing data sets. Concepts: a. A graph can be used to identify statistical trends
 Baseball Bat Testing: Subjects: Topics: data. Math/Science Gathering and organizing data from an experiment Creating graphical representations of experimental data Analyzing and interpreting graphical
100-Meter Dash Olympic Winning Times: Will Women Be As Fast As Men?
 100-Meter Dash Olympic Winning Times: Will Women Be As Fast As Men? The 100 Meter Dash has been an Olympic event since its very establishment in 1896(1928 for women). The reigning 100-meter Olympic champion
See if you can determine what the following magnified photos are. Number your paper to 5.
 Challenge 7 See if you can determine what the following magnified photos are. Number your paper to 5. The Answers: EXPERIMENTAL DESIGN Science answers questions with experiments DEFINE THE PROBLEM Begin
Lab 1. Adiabatic and reversible compression of a gas
 Lab 1. Adiabatic and reversible compression of a gas Introduction The initial and final states of an adiabatic and reversible volume change of an ideal gas can be determined by the First Law of Thermodynamics
Life Support Team Mission Day Instructions
 Life Support Team Mission Day Instructions Overview The Environmental Control and Life Support System (ECLS) on the space station maintains the astronauts' environment. It makes sure that the atmospheric
Lab 13: Hydrostatic Force Dam It
 Activity Overview: Students will use pressure probes to model the hydrostatic force on a dam and calculate the total force exerted on it. Materials TI-Nspire CAS handheld Vernier Gas Pressure Sensor 1.5
STAT 115 : INTRO TO EXPERIMENTAL DESIGN. Science answers questions with experiments
 STAT 115 : INTRO TO EXPERIMENTAL DESIGN Science answers questions with experiments 1 DEFINE THE PROBLEM Begin by asking a question about your topic What is a good question for an experiment? One that is
Section I: Multiple Choice Select the best answer for each problem.
 Inference for Linear Regression Review Section I: Multiple Choice Select the best answer for each problem. 1. Which of the following is NOT one of the conditions that must be satisfied in order to perform
Shearwater Cloud Desktop Release Notes
 2.3.0 2019-01-28 Multi-Select available in Desktop version. Currently supports Export and Deletes. Search through your Dive Logs with the new Dive Log Filter! Fixed issue with Terics being displayed as
MiSP Solubility L2 Teacher Guide. Introduction
 MiSP Solubility L2 Teacher Guide Introduction In this unit students will learn about solubility. Students should already be familiar with the basic chemistry concepts. They should know that some substances
Cumulative Frequency Diagrams
 Save My Exams! The Home of Revision For more awesome GCSE and A level resources, visit us at www.savemyexams.co.uk/ Cumulative Frequency Diagrams Mark Scheme Level Subject Exam Board Topic Sub Topic Booklet
GLOBE Data Explorations
 Rainfall in the GLOBE Africa Region: A GLOBE Data Exploration Purpose Through explorations of GLOBE rain depth data from Africa, students learn about seasonal patterns in locations affected by monsoons.
Evaluation copy. Interdependence of Plants and Animals. computer OBJECTIVES MATERIALS
 Interdependence of Plants and Animals Computer 14 Plants and animals share many of the same chemicals throughout their lives. In most ecosystems, O 2, CO 2, water, food and nutrients are exchanged between
Vapor Pressure of Liquids
 Experiment 10 In this experiment, you will investigate the relationship between the vapor pressure of a liquid and its temperature. When a liquid is added to the Erlenmeyer flask shown in Figure 1, it
Grade: 8. Author(s): Hope Phillips
: Hope Phillips") Title: Tying Knots: An Introductory Activity for Writing Equations in Slope-Intercept Form Prior Knowledge Needed: Grade: 8 Author(s): Hope Phillips BIG Idea: Linear Equations how to analyze data from
Title: Tying Knots: An Introductory Activity for Writing Equations in Slope-Intercept Form Prior Knowledge Needed: Grade: 8 Author(s): Hope Phillips BIG Idea: Linear Equations how to analyze data from
Objectives. Materials
 . Objectives Activity 1 To investigate the relationship between temperature and the number of cricket chirps To find the x value of a function, given the y value To find the y value of a function, given
Lesson 2: Wave Speed and Wind Height on Lake Superior
 ED 5661 Mathematics & Navigation Teacher Institute Tiffany Scullion Summer 2011 Lesson 2: Wave Speed and Wind Height on Lake Superior Target Audience: Intro to Algebra (grades 9-12) Time Required: 1 class
[CROSS COUNTRY SCORING]
![[CROSS COUNTRY SCORING]](/thumbs/84/89721527.jpg "[CROSS COUNTRY SCORING]") 2015 The Race Director Guide [CROSS COUNTRY SCORING] This document describes the setup and scoring processes employed when scoring a cross country race with Race Director. Contents Intro... 3 Division
2015 The Race Director Guide [CROSS COUNTRY SCORING] This document describes the setup and scoring processes employed when scoring a cross country race with Race Director. Contents Intro... 3 Division
1. A rabbit can cover a distance of 80 m in 5 s. What is the speed of the rabbit?
 Chapter Problems Motion at Constant Speed Class Work. A rabbit can cover a distance of 80 m in 5 s. What is the speed of the rabbit?. During the first 50 s a truck traveled at constant speed of 5 m/s.
Boyle s Law: Pressure-Volume Relationship in Gases
 Boyle s Law: Pressure-Volume Relationship in Gases Computer 6 The primary objective of this experiment is to determine the relationship between the pressure and volume of a confined gas. The gas we use
Combination Analysis Tutorial
 Combination Analysis Tutorial 3-1 Combination Analysis Tutorial It is inherent in the Swedge analysis (when the Block Shape = Wedge), that tetrahedral wedges can only be formed by the intersection of 2
[ AB204 Macroeconomics]
![[ AB204 Macroeconomics]](/thumbs/93/113252920.jpg "[ AB204 Macroeconomics]") Assignment Unit 3 [ AB20 Macroeconomics] Unit 3 Assignment: Supply and Demand Model and PPF 1. Your Assignment should have a cover sheet with the following information: Your Name Course Number Section
Assignment Unit 3 [ AB20 Macroeconomics] Unit 3 Assignment: Supply and Demand Model and PPF 1. Your Assignment should have a cover sheet with the following information: Your Name Course Number Section
Tying Knots. Approximate time: 1-2 days depending on time spent on calculator instructions.
 Tying Knots Objective: Students will find a linear model to fit data. Students will compare and interpret different slopes and intercepts in a context. Students will discuss domain and range: as discrete
Performance Task # 1
 Performance Task # 1 Goal: Arrange integers in order. Role: You are a analyzing a Julie Brown Anderson s dive. Audience: Reader of article. Situation: You are interviewing for a job at a sports magazine.
Biology Project. Investigate and compare the quantitative effects of changing,
 Biology Project Investigate and compare the quantitative effects of changing, (i) the duration of light physical and (ii) the time elapsed since the stopped on the pulse rate of a person. www.mrcjcs.com
Evaluation copy. Vapor Pressure of Liquids. computer OBJECTIVES MATERIALS
 Vapor Pressure of Liquids Computer 10 In this experiment, you will investigate the relationship between the vapor pressure of a liquid and its temperature. When a liquid is added to the Erlenmeyer flask
Fall 2017: Problem Set 3 (DUE Oct 26; 50 points)
") ESS 445 Introduction to Fisheries Science and Management: Biology, Ecology, Management, and Conservation of North American Freshwater Fishes and Aquatic Ecosystems Fall 2017: Problem Set 3 (DUE Oct 26;
ESS 445 Introduction to Fisheries Science and Management: Biology, Ecology, Management, and Conservation of North American Freshwater Fishes and Aquatic Ecosystems Fall 2017: Problem Set 3 (DUE Oct 26;
Homeostasis and Negative Feedback Concepts and Breathing Experiments 1
 Homeostasis and Negative Feedback Concepts and Breathing Experiments 1 I. Homeostasis and Negative Feedback Homeostasis refers to the maintenance of relatively constant internal conditions. For example,
Name. University of Maryland Department of Physics
 Name University of Maryland Department of Physics Exam 1 (Makeup) 14. October. 2010 Instructions: Do not open this examination until the proctor tells you to begin. 1. When the proctor tells you to begin,
Background Information. Project Instructions. Problem Statement. EXAM REVIEW PROJECT Microsoft Excel Review Baseball Hall of Fame Problem
 Background Information Every year, the National Baseball Hall of Fame conducts an election to select new inductees from candidates nationally recognized for their talent or association with the sport of
Fun with Gas Laws. Prepared by Vance O. Kennedy and Ross S. Nord, Eastern Michigan University PURPOSE
 Experiment 2 Fun with Gas Laws Prepared by Vance O. Kennedy and Ross S. Nord, Eastern Michigan University PURPOSE The purpose of this laboratory experience is to explore the gas law relationships between
McKnight Hockey Association
 McKnight Hockey Association Electronic Evaluation Tool Manual 2013-2014 Table of Contents Introduction...3 Evaluation Tool...3 Login to OneClickIce...3 Evaluations...4 PROCESS...4 Evaluation Procedure...5
Sandy Hook #1: Produced Water Volume Inversion
 Brine evaporates Gas condenses Sandy Hook #1: Produced Water Volume Inversion Overview This chapter discusses the common client application of producing gas at a low water cut. In these cases, the production
Organizing Quantitative Data
 Organizing Quantitative Data MATH 130, Elements of Statistics I J. Robert Buchanan Department of Mathematics Fall 2018 Objectives At the end of this lesson we will be able to: organize discrete data in
MoLE Gas Laws Activities
 MoLE Gas Laws Activities To begin this assignment you must be able to log on to the Internet using Internet Explorer (Microsoft) 4.5 or higher. If you do not have the current version of the browser, go
Motion. 1 Describing Motion CHAPTER 2
 CHAPTER 2 Motion What You ll Learn the difference between displacement and distance how to calculate an object s speed how to graph motion 1 Describing Motion 2(D), 4(A), 4(B) Before You Read Have you
Bioequivalence: Saving money with generic drugs
 The Right Stuff: Appropriate Mathematics for All Students Promoting the use of materials that engage students in meaningful activities that promote the effective use of technology to support mathematics,
LOW PRESSURE EFFUSION OF GASES revised by Igor Bolotin 03/05/12
 LOW PRESSURE EFFUSION OF GASES revised by Igor Bolotin 03/05/ This experiment will introduce you to the kinetic properties of low-pressure gases. You will make observations on the rates with which selected
Unit: Catch, Kick, Foot Dribble & Strike. Grade: 5
 Unit: Catch, Kick, Foot Dribble & Strike Grade: 5 Allyson Barber ED 337 Performance Task Assessment 4/22/10 Purpose: This performance task assessment will be used at the end of this 5 th grade unit as
Walk - Run Activity --An S and P Wave Travel Time Simulation ( S minus P Earthquake Location Method)
") Walk - Run Activity --An S and P Wave Travel Time Simulation ( S minus P Earthquake Location Method) L. W. Braile and S. J. Braile (June, 2000) braile@purdue.edu http://web.ics.purdue.edu/~braile Walk
Walk - Run Activity --An S and P Wave Travel Time Simulation ( S minus P Earthquake Location Method) L. W. Braile and S. J. Braile (June, 2000) braile@purdue.edu http://web.ics.purdue.edu/~braile Walk
Cover Page for Lab Report Group Portion. Boundary Layer Measurements
 Cover Page for Lab Report Group Portion Boundary Layer Measurements Prepared by Professor J. M. Cimbala, Penn State University Latest revision: 30 March 2012 Name 1: Name 2: Name 3: [Name 4: ] Date: Section
Target Density Lab SCIENTIFIC. Density Inquiry Lab Activities. Introduction. Concepts. Materials. Safety Precautions. Preparation
 Target Density Lab Density Inquiry Lab Activities SCIENTIFIC Introduction The concept of density is reinforced as students measure the volume and mass of an unknown liquid in a graduated cylinder, graph
Vapor Pressure of Liquids
 Vapor Pressure of Liquids Calculator 10 In this experiment, you will investigate the relationship between the vapor pressure of a liquid and its temperature. When a liquid is added to the Erlenmeyer flask
Legendre et al Appendices and Supplements, p. 1
 Legendre et al. 2010 Appendices and Supplements, p. 1 Appendices and Supplement to: Legendre, P., M. De Cáceres, and D. Borcard. 2010. Community surveys through space and time: testing the space-time interaction
Notebooks or journals for drawing and taking notes
 Title: Have to Have a Habitat Grade Level: 5 th -8 th grade Topic: Trout Habitat Background: The following chart lists the ideal conditions for trout habitat. Dissolved Oxygen: > 7 mg/l ph: 5.5-7 Next
Applications of Culture in Mathematics NCCTM 2008
 Matthew Smith Wake Forest University TOPIC: Soccer, Currency, and a Global Market. NCTM STANDARDS: Numbers and Operations, Algebra, Measurements, Data Analysis & Probability, Problem Solving, Reasoning,
INSTRUMENT INSTRUMENTAL ERROR (of full scale) INSTRUMENTAL RESOLUTION. Tutorial simulation. Tutorial simulation
 INSTRUMENTAL RESOLUTION. Tutorial simulation. Tutorial simulation") Lab 1 Standing Waves on a String Learning Goals: To distinguish between traveling and standing waves To recognize how the wavelength of a standing wave is measured To recognize the necessary conditions
Lab 1 Standing Waves on a String Learning Goals: To distinguish between traveling and standing waves To recognize how the wavelength of a standing wave is measured To recognize the necessary conditions
INSTRUCTION FOR FILLING OUT THE JUDGES SPREADSHEET
 INSTRUCTION FOR FILLING OUT THE JUDGES SPREADSHEET One Judge Spreadsheet must be distributed to each Judge for each competitor. This document is the only one that the Judge completes. There are no additional
(Lab Interface BLM) Acceleration
 Acceleration") Purpose In this activity, you will study the concepts of acceleration and velocity. To carry out this investigation, you will use a motion sensor and a cart on a track (or a ball on a track, if a cart
Purpose In this activity, you will study the concepts of acceleration and velocity. To carry out this investigation, you will use a motion sensor and a cart on a track (or a ball on a track, if a cart
MATH IN ACTION TABLE OF CONTENTS. Lesson 1.1 On Your Mark, Get Set, Go! Page: 10 Usain Bolt: The fastest man on the planet
 MATH IN ACTION TABLE OF CONTENTS LESSON 1 WORLD RECORD SPEEDS LINEAR FUNCTIONS WITH PROPORTIONAL RELATIONSHIPS Focus on: SLOPE Lesson 1.1 On Your Mark, Get Set, Go! Page: 10 Usain Bolt: The fastest man
Ball Toss. Vernier Motion Detector
 Experiment 6 When a juggler tosses a ball straight upward, the ball slows down until it reaches the top of its path. The ball then speeds up on its way back down. A graph of its velocity vs. time would
SOTM LAB: B7 12/99. DEVELOPERS OF LAB H Johnson JD896, B Nostro JD531, R Norton JD829, V Dunham JD877, E Shirley JD535
 SOTM LAB: B7 12/99 I. TEACHER NOTES & GUIDELINES TITLE OF LAB: Investigating Breathing Volumes DEVELOPERS OF LAB H Johnson JD896, B Nostro JD531, R Norton JD829, V Dunham JD877, E Shirley JD535 OVERVIEW
The MACC Handicap System
 MACC Racing Technical Memo The MACC Handicap System Mike Sayers Overview of the MACC Handicap... 1 Racer Handicap Variability... 2 Racer Handicap Averages... 2 Expected Variations in Handicap... 2 MACC
EEC 686/785 Modeling & Performance Evaluation of Computer Systems. Lecture 6. Wenbing Zhao. Department of Electrical and Computer Engineering
 EEC 686/785 Modeling & Performance Evaluation of Computer Systems Lecture 6 Department of Electrical and Computer Engineering Cleveland State University wenbing@ieee.org Outline 2 Review of lecture 5 The
Objectives. Materials TI-73 CBL 2
 . Objectives Activity 18 To model the cooling rate of different sizes of animals To determine the effect of skin surface area on the cooling rate of animals Materials TI-73 Body Cooling Rate of Animals
Exploring the relationship between the pressure of the ball and coefficient of restitution.
 Exploring the relationship between the pressure of the ball and coefficient of restitution. When I started thinking about possible investigations I knew I wanted to create a lab that was related to sports.
Experimental Design Unit. Grade 10 Science Ms. Hayduk
 Experimental Design Unit Grade 10 Science Ms. Hayduk Safety Why is Safety Important? Why is safety important? Read the article. Discuss the following questions with the person next to you: What did the
Outline. Terminology. EEC 686/785 Modeling & Performance Evaluation of Computer Systems. Lecture 6. Steps in Capacity Planning and Management
 EEC 686/785 Modeling & Performance Evaluation of Computer Systems Lecture 6 Department of Electrical and Computer Engineering Cleveland State University wenbing@ieee.org Outline Review of lecture 5 The
Students measure the change in pressure by varying the volume of trapped air in a syringe while:
 How Does a Trapped Gas Behave? Teacher Information Objective Students investigate the effect of changes in the volume of a confined gas on pressure at constant temperature. Using the pressure sensor, students
User Help. Fabasoft Scrum
 User Help Fabasoft Scrum Copyright Fabasoft R&D GmbH, Linz, Austria, 2018. All rights reserved. All hardware and software names used are registered trade names and/or registered trademarks of the respective
3. Answer the following questions with your group. How high do you think he was at the top of the stairs? How did you estimate that elevation?
 Classwork Exploratory Challenge 1. Watch the first 1:08 minutes of the video below and describe in words the motion of the man. Elevation vs. Time #2 [http://www.mrmeyer.com/graphingstories1/graphingstories2.mov.
QUICK WARM UP: Thursday 3/9
 Name: pd: Unit 6, QUICK WARM UP: Thursday 3/9 1) The slope of a distance vs. time graph shows an object s. 2) The slope of a position vs. time graph shows an object s. 3) Can an object have a constant
An Investigation: Why Does West Coast Precipitation Vary from Year to Year?
 METR 104, Our Dynamic Weather w/lab Spring 2012 An Investigation: Why Does West Coast Precipitation Vary from Year to Year? I. Introduction The Possible Influence of El Niño and La Niña Your Name mm/dd/yy
What s UP in the. Pacific Ocean? Learning Objectives
 What s UP in the Learning Objectives Pacific Ocean? In this module, you will follow a bluefin tuna on a spectacular migratory journey up and down the West Coast of North America and back and forth across
Prosthetic Arm. Preliminary As determined by your local MESA Center Regional 1 for 6 th Grade; 1 for 7 th /8 th Grade per Center
 MESA DAY CONTEST RULES 2018 2019 (Version 8.1.18) Prosthetic Arm LEVEL: Grades 6 and 7/8 TYPE OF CONTEST: COMPOSITION OF TEAM: NUMBER OF STUDENTS: SPONSOR: Team 2-3 students per team Preliminary As determined
Activity P07: Acceleration of a Cart (Acceleration Sensor, Motion Sensor)
") Activity P07: Acceleration of a Cart (Acceleration Sensor, Motion Sensor) Equipment Needed Qty Equipment Needed Qty Acceleration Sensor (CI-6558) 1 Dynamics Cart (inc. w/ Track) 1 Motion Sensor (CI-6742)
Activity P07: Acceleration of a Cart (Acceleration Sensor, Motion Sensor) Equipment Needed Qty Equipment Needed Qty Acceleration Sensor (CI-6558) 1 Dynamics Cart (inc. w/ Track) 1 Motion Sensor (CI-6742)
 Name: Analyzing Graphs of Quadratic Functions 1. Use the graph at the right to fill in the blanks for each point. a) (, 24) represents Point. b) (12, ) represents Point. c) (, ) represents Point F. d)