CENTER PIVOT EVALUATION AND DESIGN
|
|
|
- Lorin Sanders
- 5 years ago
- Views:
Transcription
1 CENTER PIVOT EVALUATION AND DESIGN Dale F. Heermann Agricultural Engineer USDA-ARS 2150 Centre Avenue, Building D, Suite 320 Fort Collins, CO Voice Fax dale.heermann@ars.usda.gov INTRODUCTION The Center Pivot Evaluation and Design Program (CPED) is a simulation model. It is based on the first model presented by Heermann and Hein (1968) which was verified with field data. Their simulation model required input of the sprinkler location, discharge, pattern radius and an assumed stationary pattern shape of either triangular or elliptical. The application depth versus distance along a radial line from the pivot was determined and application rates at a specified distance from the pivot were determined. The hours per revolution were input and each tower was assumed to move at a constant speed for the complete circle. Kincaid, Heermann and Kruse (1969) used the model to calculate potential runoff for different system capacities and infiltration rates. Kincaid and Heermann (1970) added the calculation of the flow resistance and verified with measured pressure distribution along the center pivot lateral. Chu and Moe (1972) studied the hydraulics of a center pivot system and developed a quick approximation for determining the pressure loss from the pivot to the outer end of the lateral as a constant (0.543) times the loss that would occur if the entire discharge flowed the total length of the lateral. The model was adapted by Beccard and Heermann (1981) to include the effect of topographic differences in the resulting application depths along radii of the center pivot in non level fields. The model included the pump and well characteristics and calculated the hydraulic equilibrium point as the system moved to different positions on a rough terrain. The model was exercised to determine the uniformity changes when converting from high pressure to low pressure on rough terrain. Edling (1979), and James (1984) also used simulation models to study the performance of center pivot systems on variable topography and with different pressures. 137
2 The current simulation model has been expanded to include donut shaped stationary patterns that can be used to represent many of the low pressure spray heads. The start-stop of the electric motors and the speed variation in hydraulic drives can also effect the uniformity in the direction of travel (Heermann and Stahl, 1986). The input of the start-stop sequence for each tower replaces the assumption of a constant speed and the variability of application depths in the direction of travel has been simulated. EXAMPLES OF SIMULATION EVALUATION The uniformity of application depths can be calculated by inventorying the sprinkler head models, nozzles sizes and distance from the pivot. The pump curve and drawdown, or pivot pressure, or discharge is also needed. Figure 1 illustrates a simulation as designed and the distribution if the sprinkler heads were reversed between 2 towers made at the time of installation. The application rate and potential runoff are illustrated in Figure 2. Figure 1. Typical center pivot as designed (CU = 90.8) and with 10 sprinkler heads incorrectly installed shown as a dashed line (CU = 87.9). 138
3 Figure 2 Example application rate curve versus 0.5 and 1.0 SCS intake curve. EVALUATION OBJECTIVES The selection or development of an evaluation standard and procedures should focus on the need for the evaluation. The USDA, Environmental Quality Incentive Program (EQIP) administered by the Natural Resource Conservation Service (NRCS) currently can provide cost sharing on the installation and upgrading of irrigation systems for improving water quality or conservation under irrigation. Center pivots are frequently the system of choice. There is a need to assure that installed systems will provide the desired improvement in irrigation performance. A similar need exists for any user of center pivot systems to assure that an installed or modified system will perform as designed. It must be recognized that the scheduling of irrigations is most important for the beneficial use of water. Efficient scheduling of irrigation systems requires knowing the amount of water applied per irrigation. The CPED program has been streamlined and simplified for use in evaluating center pivot systems for cost sharing on new and upgraded systems. The CPEDLite program is similar to the one being used in this workshop. The primary difference is the simulations are for 1 foot intervals beginning and ending at fixed distances. This assures that any simulation will provide the same results. The uniformity is output in 5% bands. 139

4 CPED PROGRAM OPERATION The following pages will present the various windows that are presented to the user for controlling the input and operation of the program. The program illustrated is the full version of CPED. The CPEDLite program has the same look at the window level but requires less input with some of the options being fixed so that similar results will be obtained independent of the operator. The program is available on request but the user is cautioned that there is always the possibility of program errors when different systems present conditions that have not been experienced prior to this time. The program is therefore limited in its release to minimize the problems of users that are not familiar with center pivot operation and terminology. MAIN PROGRAM WINDOW The options available are to select or create a new system file, view output from previous simulations, and quit the program. Once a system file is selected or created, the options to run, edit, or delete the system file are enabled. In all cases throughout the program click means click the left mouse button. 140
5 A system file can be Selected by clicking one of the systems listed in the list box labeled System File List. The name of the selected system file will be displayed in the label box labeled Name of Selected System File. The New button allows the user to create a new system file. There are two ways to create a new system. The first way is to enter a name and click the OK button. You are then transferred into the Edit window that is discussed below. The second option is to create a system from an existing file. You then select the existing file; name the new system; click the OK button and you will be in the Edit window where only changes need to be entered. The Delete button will delete the selected system file from the user s hard drive. The user will be asked for confirmation before deleting a system file. The View button allows examining previous simulation results. The View previous output button will bring up the data files that have been saved from previous simulations. Selecting one of these files will plot to the screen the simulated depth versus distance data. The Analyze catch can data button allows you to enter catch can data for uniformity evaluation. A simulation output data set can be input to the catch can data file and allow the uniformity analysis for different distances along the lateral. The procedure to save simulation data is presented latter with running the program. The Edit button allows editing of the selected system file. More detail is below. The Run button moves to the screen for entering the parameters to run the simulation. More detail is given below. The Quit button exits the program. Pressing CTRL +Q anytime during the simulation will have the same effect. EDIT SYSTEM FILE WINDOW The different information groups of data can be entered or edited by moving the mouse pointer over the image of the sprinkler system. The labels Pump Information, Tower Information, Sprinkler Information, Span Information, and System Information can be selected by clicking on the text to open its edit window. The Add/Edit Sprinkler Model button opens a window for adding or editing sprinkler models. This is password protected and normally is not needed by the user. Those supporting the program will do this editing. The Previous Window button saves the changes and returns to the main program window. 141


6 SPRINKLER EDIT WINDOW 142
7 A new sprinkler can be added by clicking the Add Sprinkler button. If no sprinklers are present by pressing the Add Sprinkler button a sprinkler with zero distance will default and you can begin by entering the other information for the first sprinkler. The sprinkler model is selected by clicking on the model listed in the box labeled Sprinkler Model List. Sprinklers can be added in any order. If one sprinkler is missed you can merely add it at any time. By clicking the Reorder Sprinklers button the sprinklers will be ordered from the pivot to the outer end based on their individual distances from the pivot. You do not enter the sprinkler number as this is done automatically. If sprinklers are present the information from the previous record will be used and the distance will automatically be incremented. Edit the information for the newly added sprinkler. Many systems will have the same sprinkler models and these will need no editing. If the sprinkler spacing is uniform this will also require minimal editing. Even the nozzle sizes may be the same for several sprinklers minimizing the editing required. The nozzle size is the diameter in 1/64 inches. For example a nozzle diameter of 9.5 is equal to 9.5/64 or 19/128 inch. There are columns for a range and spread nozzle which was typical for high pressure heads. Enter the diameter for single nozzle sprinklers in the range column. The pressure control column is the outlet pressure of the pressure regulator if this is selected in the System file screen. When the constant orifice is the selected pressure control, the orifice size in 64 th inch is entered. When this column is left blank, it is an indication there is no flow control on that sprinkler even if the system has pressure regulation selected. The start and stop angles are viewed from the pivot toward a part circle sprinkler. Check if the sprinkler starts on the right or left. Then using the pipe as the zero reference point, measure the angle back toward the pivot. Use the same technique for the stop angle. All angles are positive and between 0 and 180 degrees (Figure 3). Figure 3. Part circle sprinklers angles. Angles are between degrees with an L or R prefix. 143

8 Alternatively you can move to the bottom row marked with an '*' and enter the new sprinkler information manually. A sprinkler can be deleted by selecting any column in the row for the sprinkler and click the Delete button. The Reorder button will sort and number the sprinklers by sprinkler distance from the pivot. The Previous Screen button returns to the Edit system file window. TOWER EDIT WINDOW Towers are added by clicking on the Add Tower button and editing the distance from the pivot and its elevation. It is often assumed that the pivot and all towers are at an elevation of 100 feet if no field information is available. For the linear system, the first cart is assumed to be the pivot with a distance of 0. As the Add Tower button is clicked, the towers are added with the spacing of the previous two towers and the same elevation as the previous tower. The Reorder Towers will sort the towers by distance from the pivot if there happen to be entered in the wrong sequence. Select a tower and click the Delete Tower button if a tower needs to be deleted. The Previous Screen returns to the Edit system file window. 144

9 SPAN INFORMATION WINDOW Clicking the Add Span button inserts a starting distance of 0 and the Pipe I.D. and the Darcy-Weisbach resistance coefficient must be entered. A typical value of the D-W coefficient is 0.xxx to 0.xxx for center pivots. Multiple pipe sizes can be added by clicking the Add Span button and entering the starting distance from the pivot and its resistance coefficient. The spans are assumed to go from the starting distance to the next span or end of the pivot for the last span. Spans can be deleted (Delete Span) and reordered (Reorder spans) by clicking the appropriate button. Never delete the span with starting distance of 0. The Previous Screen button returns to the Edit system file window. PUMP INFORMATION WINDOW The piping to the pivot, pump curve, and pivot elevation are entered in this window. If the pump curve information is not available, either a constant discharge or constant pressure can be selected. 145
10 Selecting the Normal option requires the quadratic equation for the pump curve. The curve of the total head vs discharge for the pump is needed to develop the regression equation that describes the pump. This relationship can be determined externally from this program or there is an option that will fit the pump curve equation with points from a pump curve or field measured data. At least 4 points that span the operating range are needed, however 8-10 will give a better fit. Problems have occurred where the operating point is beyond the pump curve data. Use caution. The form of the equation for the pump curve is: Q = B 0 + B 1 H + B 2 H 2 where: Q - discharge - gpm H - head/stage - psi B 0 - intercept B 1 - linear slope coefficient on head B 2 - quadratic slope coefficient on head The number of stages for the pump must be entered when the manufacturers pump curve is for a single stage. However, if the pump curve comes from field measurements, set the number of stages equal to one. The Calculate Pump Curve button can be selected for calculating the coefficients when data are available from 146
11 either the manufacturers pump curve or field measured data. The paired data of discharge in gpm and head in feet can be entered and the three coefficients calculated. The total dynamic lift in feet must also be entered. It is the elevation difference (feet) between the center pivot pad elevation and the depth to the water table including the drawdown while pumping. The pad elevation is the elevation for the center pivot at from an assumed or measured datum elevation. The sprinkler height is the distance above the pad height for the sprinklers as if they were on a level field. The inside diameter (I.D.) of the pipe size and length of pipe from the pump to the pivot and the I.D. of the riser pipe must be entered. Include the Darcy-Weisbach coefficient for both pipes. The Constant Head option is where the pivot pressure (psi) is specified. This is the most stable option where the pump curve is not known. Estimate the discharge in gpm and set the number of stages equal to one. The estimate discharge is only to shorten the calculation time and the actual value is not critical. The Constant Discharge in gpm can also be specified. The potential problem with constant discharge is when all sprinklers are regulated. If the discharge does not match the calculated discharge with the regulated pressure an error will occur when attempting to have the calculated discharge on the system match that specified. Again set the number of stages equal to one. The constant head and constant discharge does not require pump to riser pipe and riser pipe sizes or resistance coefficient since the pressure or discharge is assumed to be at the pivot and no head loss is calculated for these sections. The Previous Screen button returns to the Edit system file window. SYSTEM INFORMATION SCREEN Three options for the Type of Pressure Control can be select from the drop down box. They are none, pressure regulated, or constant orifice. Systems with booster pumps for the big gun at the end of a center pivot system are simply estimated with a pressure increase in psi just prior to the big gun or guns. The number of sprinklers beyond the booster pump is specified. The actual pressure is dependent on the center pivot system and the inlet pressure, discharge or pump curve. The Previous Screen button returns the Edit system file window. 147

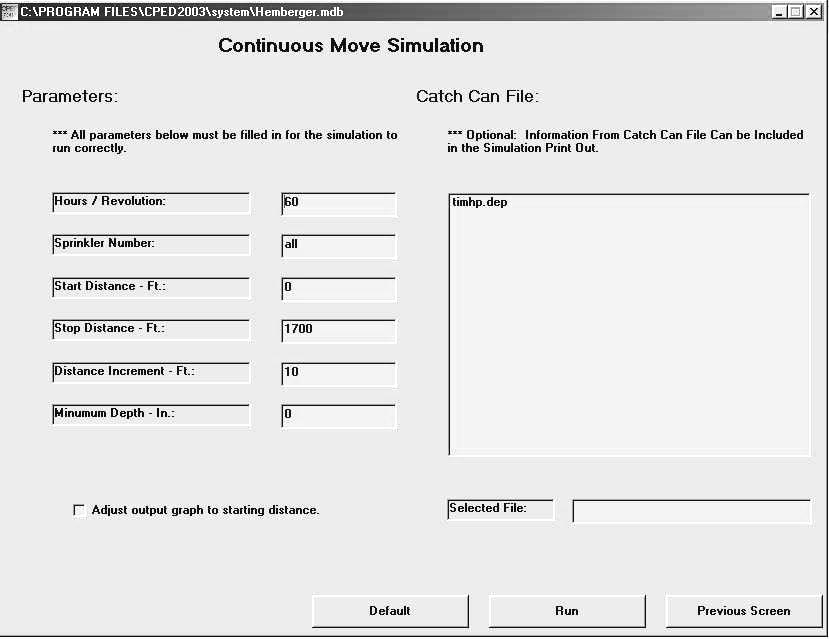
12 RUN WINDOW 148
13 This is the screen that you will enter when you click RUN and all of the system files with the necessary data have been entered. Minimal input is required on this screen before the simulation is run. The Default button will restore the default values that were used on the previous simulation run for this system. The hours/revolution are entered to obtain the depth for this condition. Normally the sprinkler number is set to all for including all the sprinklers to be simulated. However, you can select one sprinkler by entering its number to see the contribution to the depths from the specified sprinkler. The start, stop distances and distance increment specifies the location for simulation depths. For example you can start at 10 feet and go to 500 feet with 5 foot increments. The minimum depth specifies that only locations with depths greater than that will be included in the uniformity calculations. This is often desirable when not including the small depths at the outer boundary where there is not sufficient overlap with other sprinklers. The CPEDLite program fixes these four parameters and only the speed in hours/revolution can be changed. Clicking the RUN button will start the simulation. You will automatically be moved to another window that will plot the simulated depth versus distance data on the monitor. Prior to pressing RUN you can select a catch can data set or data saved from a previous run to be displayed on the monitor after the simulation is completed. This provides a visual comparison of the current simulation with other data. The data for comparison can be selected from the files listed in the Catch Can File Window. The Previous Screen button will return to the Main Window. You will note a possible selection to Adjust output graph to starting distance. This is normally not needed when simulating the entire system. Clicking this selection is beneficial if you are not simulating from near the pivot and want the plot to begin at the starting distance instead of 0. SIMULATION OUTPUT WINDOW The output window plots the simulated depth versus distance from the pivot for the parameters set in the run window. The Coefficient of Uniformity, the Distribution Uniformity, and mean application depth are printed. The Q-Depths, gpm, is the discharge calculated from all simulated depths while the Effective Q-Depths, gpm, is calculated from the depths that are above the specified minimum depth used in the Uniformity and mean depth calculations. The effective area is the simulated area for those areas receiving more than the minimum depth between the starting and stop distances. The window below is an example of plotting catch can data from a previous simulation run. Additional data can be printed either to the printer or to a file. The Return to Main Menu button will return to the main menu screen. The Print to File button will ask for the file name for storing the information. You will then be prompted for saving the individual 149

14 sprinkler and tower data followed for a prompt to save the simulated depth data and the name for its file. The saved simulated depth data are then available for comparison with future simulations for the same center pivot system. The following information can be printed to the printer after the simulation run. 1. The head per stage of the pump - gpm 2. The pivot pressure - psi 3. The system discharge based on the pump curve - gpm 4. The system discharge based on all the integrated depths - gpm 5. The system discharge based on all depths above the minimum depth - gpm 6. The effective irrigated area, which is the area receiving water above the minimum depth - acres 7. The mean depth - in. (of all depths above the minimum) 8. Christiansen's uniformity coefficient (of all depths above the minimum) 9. Mean low quarter uniformity (of all depths above the minimum) 10. Plot of depth vs distance The information that is available for each sprinkler is the line pressure - psi, the nozzle pressure - psi, the discharge - gpm, and the pattern radius - ft. 150
15 The application depths are the final piece of information provided. They are listed by distance. The Previous Window button saves the changes to the system file and returns to the main program window.the Previous Window button saves the changes to the system file and returns to the main program window. REFERENCES Beccard, R. W. and D. F. Heermann Performance of pumping plant--center pivot sprinkler irrigation systems. ASAE Paper , Chicago, IL. Chu, T.S. and D.L. Moe Hydraulics of a center pivot system. Trans. of the ASAE 15(5):894,896. Edling, R.J Variation of center pivot operation with field slope. Trans. of ASAE 15(5): Heermann, D. F. and P. R. Hein Performance characteristics of the self-propelled center pivot sprinkler irrigation system. Trans. ASAE 11(1): Heermann, D.F. and K.M. Stahl. l986. Center pivot uniformity for chemigation. ASAE Paper , Chicago, IL. James, L.G Effects of pump selection and terrain of center pivot performance. Trans. of ASAE 27(1):64-68,72. Kincaid, D. C., D. F. Heermann and E. G. Kruse Application rates and runoff in center pivot sprinkler irrigation. Trans. ASAE 12: , 797. Kincaid, D. C. and D. F. Heermann Pressure distribution on a center pivot sprinkler irrigation system. Trans. ASAE 13:
Effect of Limited Water Supplies on Center Pivot Performance
 Abstract Effect of Limited Water Supplies on Center Pivot Performance by Derrel Martin Professor Irrigation and Water Resources Engineering University of Nebraska Lincoln Lincoln, NE Performance of a center
This portion of the piping tutorial covers control valve sizing, control valves, and the use of nodes.
 Piping Tutorial A piping network represents the flow of fluids through several pieces of equipment. If sufficient variables (flow rate and pressure) are specified on the piping network, CHEMCAD calculates
International Journal of Technical Research and Applications e-issn: , Volume 4, Issue 3 (May-June, 2016), PP.
, PP.") DESIGN AND ANALYSIS OF FEED CHECK VALVE AS CONTROL VALVE USING CFD SOFTWARE R.Nikhil M.Tech Student Industrial & Production Engineering National Institute of Engineering Mysuru, Karnataka, India -570008
DESIGN AND ANALYSIS OF FEED CHECK VALVE AS CONTROL VALVE USING CFD SOFTWARE R.Nikhil M.Tech Student Industrial & Production Engineering National Institute of Engineering Mysuru, Karnataka, India -570008
Wave Load Pattern Definition
 COMPUTERS AND STRUCTURES, INC., AUGUST 2010 AUTOMATIC WAVE LOADS TECHNICAL NOTE DEFINING WAVE LOADS This section describes how to define automatic wave loads. The automatic wave load is a special type
FOR WASTEWATER APPLICATIONS
 Calibration of CENTER PIVOT IRRIGATION SYSTEMS FOR WASTEWATER APPLICATIONS Gary L. Hawkins...Department of Crop and Soil Sciences Wesley Porter...Department of Crop and Soil Sciences Melony Wilson...Department
WMS 8.4 Tutorial Hydraulics and Floodplain Modeling HY-8 Modeling Wizard Learn how to model a culvert using HY-8 and WMS
 v. 8.4 WMS 8.4 Tutorial Hydraulics and Floodplain Modeling HY-8 Modeling Wizard Learn how to model a culvert using HY-8 and WMS Objectives Define a conceptual schematic of the roadway, invert, and downstream
Section 5: Pond Outlets
 Section : Pond Outlets Defining and calculating pond outlet devices 8 Minutes Press Space, PageDown, or Click to advance. Press PageUp to reverse. Esc to exit. Right-Click for other options. Outlets Introduction
EVALUATING AND INTERPRETING APPLICATION UNIFORMITY OF CENTER PIVOT IRRIGATION SYSTEMS
 Page Break EVALUATING AND INTERPRETING APPLICATION UNIFORMITY OF CENTER PIVOT IRRIGATION SYSTEMS With rising fuel prices it is increasingly important that irrigation systems apply water uniformly in order
σ = force / surface area force act upon In the image above, the surface area would be (Face height) * (Face width).
 * (Face width).") Aortic Root Inflation Introduction You have already learned about the mechanical properties of materials in the cantilever beam experiment. In that experiment you used bending forces to determine the Young
Aortic Root Inflation Introduction You have already learned about the mechanical properties of materials in the cantilever beam experiment. In that experiment you used bending forces to determine the Young
Boyle s Law: Pressure-Volume Relationship in Gases
 Boyle s Law: Pressure-Volume Relationship in Gases The primary objective of this experiment is to determine the relationship between the pressure and volume of a confined gas. The gas we will use is air,
Valves. Controllers. Valves Two Types
 Hydraulics Taking the Irritation out of Irrigation My plants are getting irrigated, so I m all set, right? Marcus Duck Academic Advisor, Instructor & Program Coordinator MSU s 2-year Horticulture Programs
Cover Page for Lab Report Group Portion. Head Losses in Pipes
 Cover Page for Lab Report Group Portion Head Losses in Pipes Prepared by Professor J. M. Cimbala, Penn State University Latest revision: 02 February 2012 Name 1: Name 2: Name 3: [Name 4: ] Date: Section
OFFICE OF STRUCTURES MANUAL FOR HYDROLOGIC AND HYDRAULIC DESIGN CHAPTER 11 APPENDIX B TIDEROUT 2 USERS MANUAL
 OFFICE OF STRUCTURES MANUAL FOR HYDROLOGIC AND HYDRAULIC DESIGN CHAPTER 11 APPENDIX B TIDEROUT 2 USERS MANUAL APRIL 2011 APRIL 2011 Page 1 Preface TIDEROUT 2, Build 1.22 dated June 29, 2006 is the current
Experiment (13): Flow channel
: Flow channel") Experiment (13): Flow channel Introduction: An open channel is a duct in which the liquid flows with a free surface exposed to atmospheric pressure. Along the length of the duct, the pressure at the surface
Experiment (13): Flow channel Introduction: An open channel is a duct in which the liquid flows with a free surface exposed to atmospheric pressure. Along the length of the duct, the pressure at the surface
LABORATORY EXERCISE 1 CONTROL VALVE CHARACTERISTICS
 Date: Name: LABORATORY EXERCISE 1 CONTROL VALVE CHARACTERISTICS OBJECTIVE: To demonstrate the relation between valve stem position and the fluid flow through a control valve, for both linear and equal
Agricultural Water: Part 2
 Agricultural Water: Part 2 Introduction: Ag water definitions Distribution Uniformity Drip irrigation: Design Key concepts Thanks to Michael Cahn UC Cooperative Extension Monterey County ( (831) 759-7377
STATIONARY SPRINKLER IRRIGATION SYSTEM
 STATIONARY SPRINKLER North Carolina Cooperative Extension Service North Carolina State University STATIONARY SPRINKLER General Guidelines Operating an irrigation system differently than assumed in the
The Discussion of this exercise covers the following points: Pumps Basic operation of a liquid pump Types of liquid pumps The centrifugal pump.
 Exercise 2-3 Centrifugal Pumps EXERCISE OBJECTIVE In this exercise, you will become familiar with the operation of a centrifugal pump and read its performance chart. You will also observe the effect that
Section 10 - Hydraulic Analysis
 Section 10 - Hydraulic Analysis Methodology Documentation Functionality Summary Sizing Methodology Fixed/Resize Combined Flow Storm: Sizing as per d/d Structures.dat Storm vs. Sanitary Methodology HGL/EGL
Process Simulator Evaluates Blower and Valve Control Strategies for WWTP Aeration
 Process Simulator Evaluates Blower and Valve Control Strategies for WWTP Aeration inshare By Steve Kestel and Tilo Stahl (BioChem Technology) and Matthew Gray (Keystone Engineering Group) Introduction
GMS 10.0 Tutorial SEAWAT Viscosity and Pressure Effects Examine the Effects of Pressure on Fluid Density with SEAWAT
 v. 10.0 GMS 10.0 Tutorial SEAWAT Viscosity and Pressure Effects Examine the Effects of Pressure on Fluid Density with SEAWAT Objectives Learn how to simulate the effects of viscosity and how pressure impacts
Dive Sheets & Running Events Meet Management Software Tutorial for EZMeet Version 3.1 revised 2/4/2006
 Dive Sheets & Running Events Meet Management Software Tutorial for EZMeet Version 3.1 revised 2/4/2006 Once you have events created in your meet you are ready to enter dive sheets and run your event. INCLUDED
In addition to reading this assignment, also read Appendices A and B.
 1 Kinematics I Introduction In addition to reading this assignment, also read Appendices A and B. We will be using a motion detector to track the positions of objects with time in several lab exercises
Calculations of hydraulic resistance of simple pipelines for liquid viscous and non-newtonian products.
 VISIMIX PL. PIPELINE FOR DISCHARGING OF A SHAMPOO Calculations of hydraulic resistance of simple pipelines for liquid viscous and non-newtonian products. The task: to build a temporary pipeline in order
MoLE Gas Laws Activities
 MoLE Gas Laws Activities To begin this assignment you must be able to log on to the Internet using Internet Explorer (Microsoft) 4.5 or higher. If you do not have the current version of the browser, go
New Zealand Piped Irrigation System Performance Assessment Code of Practice
 New Zealand Piped Irrigation System Performance Assessment Code of Practice PART H: Pivot Note: This is Part H of a series of nine (Parts A I). Part H: Contents Date of Issue: February 2015 Irrigation
1 PIPESYS Application
 PIPESYS Application 1-1 1 PIPESYS Application 1.1 Gas Condensate Gathering System In this PIPESYS Application, the performance of a small gascondensate gathering system is modelled. Figure 1.1 shows the
Lab 4: Transpiration
 Lab 4: Transpiration Water is transported in plants, from the roots to the leaves, following a decreasing water potential gradient. Transpiration, or loss of water from the leaves, helps to create a lower
"How To Make Amateur Rockets" Software Manual
 USERS MANUAL For How to Make Amateur Rockets Software The software programs are designed to run on Windows 95, 98, ME or XP (Home Edition). Follow the installation instructions supplied with the CD and
Lab 13: Hydrostatic Force Dam It
 Activity Overview: Students will use pressure probes to model the hydrostatic force on a dam and calculate the total force exerted on it. Materials TI-Nspire CAS handheld Vernier Gas Pressure Sensor 1.5
UNIQUE ADVANTAGES OF PIPENET
 UNIQUE ADVANTAGES OF PIPENET TRANSIENT MODULE Sunrise Systems Limited Section 1: Unique Advantages of the leading hydraulic analysis software engineers prefer to use: PIPENET s schematic design is unique.
WaterSense Specification for Spray Sprinkler Bodies. Version 1.0
 Version 1.0 September 21, 2017 WaterSense Specification for Spray Sprinkler Bodies 1.0 Scope and Objective This specification establishes the criteria for labeling bodies of spray sprinklers 1 under the
AX5000 Operational Manual
 MIYACHI AMERICA CORPORATION The World Leader in Hermetic Sealing Systems AX5000 Operational Manual 0 Document #107-00092-001 Dec, 2013 AX5000 Operational Manual Miyachi America Corporation 1820 S. Myrtle
APPLYING VARIABLE SPEED PRESSURE LIMITING CONTROL DRIVER FIRE PUMPS. SEC Project No
 APPLYING VARIABLE SPEED PRESSURE LIMITING CONTROL DRIVER FIRE PUMPS SEC Project No. 1803007-000 November 20, 2006 TABLE OF CONTENTS I. ABSTRACT...1 II. INTRODUCTION...1 III. HISTORY...2 IV. VARIABLE SPEED
The Use of a Process Simulator to Model Aeration Control Valve Position and System Pressure
 The Use of a Process Simulator to Model Aeration Control Valve Position and System Pressure Matthew Gray 1 * and Steve Kestel 1 1 BioChem Technology, King of Prussia, PA *Email: mgray@biochemtech.com ABSTRACT
Micro Motion Pressure Drop Testing
 12/2018 Micro Motion Pressure Drop Testing www.emerson.com/micromotion Introduction Micro Motion has traditionally taken a very conservative approach to pressure drop, with single pressure measurements
Exercise 3. Power Versus Wind Speed EXERCISE OBJECTIVE DISCUSSION OUTLINE. Air density DISCUSSION
 Exercise 3 Power Versus Wind Speed EXERCISE OBJECTIVE When you have completed this exercise, you will know how to calculate the power contained in the wind, and how wind power varies with wind speed. You
Lab # 03: Visualization of Shock Waves by using Schlieren Technique
 AerE545 Lab # 03: Visualization of Shock Waves by using Schlieren Technique Objectives: 1. To get hands-on experiences about Schlieren technique for flow visualization. 2. To learn how to do the optics
Name Student Activity
 Open the TI-Nspire document Boyles_Law.tns. In this activity, you will use a Gas Pressure Sensor to measure the pressure of an air sample inside a syringe. Using graphs, you will apply your results to
MR/MRDC/MDC TECHNICAL APPLICATION GUIDE TABLE OF CONTENTS FOR MINI-REGULATOR WITH AND WITHOUT DRAIN CHECK OPTIONS
 MRDC-AP 11/14 /MDC TECHNICAL APPLICATION GUIDE FOR MINI-REGULATOR WITH AND WITHOUT DRAIN CHECK OPTIONS R2000 ROTATOR WITH MINI REGULATOR TABLE OF CONTENTS 1.0 REGULATING WATER PRESSURE & DRAIN CHECK 2.0
The ICC Duckworth-Lewis-Stern calculator. DLS Edition 2016
 The ICC Duckworth-Lewis-Stern calculator DLS Edition 2016 (DLS2-2016) Installation and operating instructions Queries about program operation should be sent to: Steven.Stern@qut.edu.au 2016 International
Lesson 14: Modeling Relationships with a Line
 Exploratory Activity: Line of Best Fit Revisited 1. Use the link http://illuminations.nctm.org/activity.aspx?id=4186 to explore how the line of best fit changes depending on your data set. A. Enter any
Experiment P18: Buoyant Force (Force Sensor)
") PASCO scientific Physics Lab Manual: P18-1 Experiment P18: (Force Sensor) Concept Time SW Interface Macintosh file Windows file Newton's Laws 45 m 300/500/700 P18 P18_BUOY.SWS EQUIPMENT NEEDED CONSUMABLES
PASCO scientific Physics Lab Manual: P18-1 Experiment P18: (Force Sensor) Concept Time SW Interface Macintosh file Windows file Newton's Laws 45 m 300/500/700 P18 P18_BUOY.SWS EQUIPMENT NEEDED CONSUMABLES
Workshop 302-compressor-anti-surge
 Workshop Objectives Workshop 302-compressor-anti-surge Illustrate how to create a simple anti-surge control on a compressor Workshop Description Flowsheeet: A feed stream at 1 bar with methane, ethane
16. Studio ScaleChem Calculations
 16. Studio ScaleChem Calculations Calculations Overview Calculations: Adding a new brine sample Studio ScaleChem can be used to calculate scaling at one or more user specified temperatures and pressures.
UNITY 2 TM. Air Server Series 2 Operators Manual. Version 1.0. February 2008
 UNITY 2 TM Air Server Series 2 Operators Manual Version 1.0 February 2008 1. Introduction to the Air Server Accessory for UNITY 2...2 1.1. Summary of Operation...2 2. Developing a UNITY 2-Air Server method
Hydrus 1D Tutorial. Example: Infiltration and drainage in a large caisson. 1) Basic model setup. Sebastian Bauer Geohydromodellierung
 Basic model setup. Sebastian Bauer Geohydromodellierung") Sebastian Bauer Geohydromodellierung Modellieren in der Angewandten Geologie Sommersemester 2008 Hydrus 1D Tutorial Example: Infiltration and drainage in a large caisson 1) Basic model setup Start Hydrus
Sebastian Bauer Geohydromodellierung Modellieren in der Angewandten Geologie Sommersemester 2008 Hydrus 1D Tutorial Example: Infiltration and drainage in a large caisson 1) Basic model setup Start Hydrus
SEAWAT Viscosity and Pressure Effects. Objectives Learn how to simulate the effects of viscosity and how pressure impacts the fluid density in SEAWAT.
 v. 10.4 GMS 10.4 Tutorial Examine the Effects of Pressure on Fluid Density with SEAWAT Objectives Learn how to simulate the effects of viscosity and how pressure impacts the fluid density in SEAWAT. Prerequisite
Vapor Pressure of Liquids
 Vapor Pressure of Liquids In this experiment, you will investigate the relationship between the vapor pressure of a liquid and its temperature. When a liquid is added to the Erlenmeyer flask shown in Figure
Chapter 9 System Design Procedures
 Chapter 9 CHAPTER 9 SYSTEM DESIGN PROCEDURES TABLE OF CONTENTS PART 9.1 GENERAL 9-1 PART 9.2 EXAMPLE 1, LOW PRESSURE GRAVITY SYSTEM 9-1 PART 9.3 EXAMPLE 2, PUMPED AUTOMATIC PRESSURE PIPELINE 9-4 9.3.1
Viva TPS. TS11/15 Total Stations Check and Adjust Procedure. October Summary
 Viva TPS October 2010 TS11/15 Total Stations Summary Leica builds total stations to the highest quality and calibrates each instrument before it leaves the Factory. After the instrument is shipped or used
To Logon On to your tee sheet, start by opening your browser. (NOTE: Internet Explorer V. 6.0 or greater is required.)
") 1. Log-On To Logon On to your tee sheet, start by opening your browser. (NOTE: Internet Explorer V. 6.0 or greater is required.) (NOTE: Logon ID s must be 7 characters or more and passwords are case sensitive.)
1. Log-On To Logon On to your tee sheet, start by opening your browser. (NOTE: Internet Explorer V. 6.0 or greater is required.) (NOTE: Logon ID s must be 7 characters or more and passwords are case sensitive.)
Smart Water Application Technologies (SWAT)
") Smart Water Application Technologies (SWAT) Turf and Landscape Irrigation Equipment PRESSURE REGULATING SPRAY HEAD SPRINKLERS Equipment Functionality Test Testing Protocol Version 3.0 (May 2012) Developed
Smart Water Application Technologies (SWAT) Turf and Landscape Irrigation Equipment PRESSURE REGULATING SPRAY HEAD SPRINKLERS Equipment Functionality Test Testing Protocol Version 3.0 (May 2012) Developed
Transpiration. DataQuest OBJECTIVES MATERIALS
 Transpiration DataQuest 13 Water is transported in plants, from the roots to the leaves, following a decreasing water potential gradient. Transpiration, or loss of water from the leaves, helps to create
Tutorial 2 Time-Dependent Consolidation. Staging Groundwater Time-dependent consolidation Point query Line query Graph Query
 Tutorial 2 Time-Dependent Consolidation Staging Groundwater Time-dependent consolidation Point query Line query Graph Query Model Set-up For this tutorial we will start with the model from Tutorial 1 Quick
Gerald D. Anderson. Education Technical Specialist
 Gerald D. Anderson Education Technical Specialist The factors which influence selection of equipment for a liquid level control loop interact significantly. Analyses of these factors and their interactions
Applying Hooke s Law to Multiple Bungee Cords. Introduction
 Applying Hooke s Law to Multiple Bungee Cords Introduction Hooke s Law declares that the force exerted on a spring is proportional to the amount of stretch or compression on the spring, is always directed
Boyle s Law: Pressure-Volume Relationship in Gases. PRELAB QUESTIONS (Answer on your own notebook paper)
") Boyle s Law: Pressure-Volume Relationship in Gases Experiment 18 GRADE LEVEL INDICATORS Construct, interpret and apply physical and conceptual models that represent or explain systems, objects, events
Boyle s Law: Pressure-Volume Relationship in Gases Experiment 18 GRADE LEVEL INDICATORS Construct, interpret and apply physical and conceptual models that represent or explain systems, objects, events
Boyle s Law. Pressure-Volume Relationship in Gases. Figure 1
 Boyle s Law Pressure-Volume Relationship in Gases The primary objective of this experiment is to determine the relationship between the pressure and volume of a confined gas. The gas we use will be air,
ADVANCED. CATIA V5 Workbook. Knowledgeware and Workbenches. Release 16. Knowledgeware. Workbenches. Richard Cozzens. Southern Utah University
 ADVANCED CATIA V5 Workbook Knowledgeware and Workbenches Release 16 Knowledgeware Tutorial Exercises Workbenches Kinematics Stress Analysis Sheetmetal Design Prismatic Machining Richard Cozzens Southern
Pump-Fan-Compressor Sizing
 Pump-Fan-Compressor Sizing Introduction This program determines the fluid transportation characteristics of dominant pipeline process systems containing no loops. In addition, it determines the yearly
Digital Level Control One and Two Loops Proportional and Integral Control Single-Loop and Cascade Control
 Digital Level Control One and Two Loops Proportional and Integral Control Single-Loop and Cascade Control Introduction This experiment offers a look into the broad field of process control. This area of
Irrigation System Winterization and Pressurization Procedures
 Irrigation System Winterization and Pressurization Procedures Introduction Any time that an irrigation system is filled and pressurized, or when the system is drained and water flushed from the system,
MONITORING AND CONTROLS. BENEFITS OF VARIABLE FREQUENCY CONVERTERS (VFDs)
") MONITORING AND CONTROLS BENEFITS OF VARIABLE FREQUENCY CONVERTERS (VFDs) Need for performance regulation Irrigation conditions will change from one year to another, from one season to another season, or
MONITORING AND CONTROLS BENEFITS OF VARIABLE FREQUENCY CONVERTERS (VFDs) Need for performance regulation Irrigation conditions will change from one year to another, from one season to another season, or
Tension Cracks. Topics Covered. Tension crack boundaries Tension crack depth Query slice data Thrust line Sensitivity analysis.
 Tension Cracks 16-1 Tension Cracks In slope stability analyses with cohesive soils, tension forces may be observed in the upper part of the slope. In general, soils cannot support tension so the results
Automatically or individually calculated.
 GASCalc 5.0 GASCalc 5.0 is a Windows based suite of calculation tools for the natural gas professional. Routines are provided for calculating numerous parameters associated with the design and operation
Figure 1 Example feature overview.
 1. Introduction This case focuses on the northeastern region of Onslow Bay, NC, and includes an initial shoreline, regional contour, wave gauges, inlets, dredging, and beach fills. Most of the features
O-Calc Pro Sag Tension Calculations Explained
 O-Calc Pro Sag Tension Calculations Explained This document is a primer that explains how O-Calc Pro software system handles the tension and sags on cables that are attached to a pole. The document is
MoLE Gas Laws Activities
 MoLE Gas Laws Activities To begin this assignment you must be able to log on to the Internet using Internet Explorer (Microsoft) 4.5 or higher. If you do not have the current version of the browser, go
Briggs linear 4-wheel chassis irrigation booms. Models R50/2 R57/2 R60/2 R64/2 R76 lane spacing from 50 to 96 metres
 Briggs linear 4-wheel chassis irrigation booms Models R50/2 R57/2 R60/2 R64/2 R76 lane spacing from 50 to 96 metres Briggs boom irrigators are an established feature of the farming landscape. Efficient,
Tying Knots. Approximate time: 1-2 days depending on time spent on calculator instructions.
 Tying Knots Objective: Students will find a linear model to fit data. Students will compare and interpret different slopes and intercepts in a context. Students will discuss domain and range: as discrete
Exercise 2-2. Second-Order Interacting Processes EXERCISE OBJECTIVE DISCUSSION OUTLINE. The actual setup DISCUSSION
 Exercise 2-2 Second-Order Interacting Processes EXERCISE OBJECTIVE Familiarize yourself with second-order interacting processes and experiment with the finer points of controller tuning to gain a deeper
1.2 Example 1: A simple hydraulic system
 Note: It is possible to use more than one fluid in the Hydraulic library. This is important because you can model combined cooling and lubrication systems of a library. The hydraulic library assumes a
Acoustical Modeling of Reciprocating Compressors With Stepless Valve Unloaders
 Acoustical Modeling of Reciprocating Compressors With Stepless Valve Unloaders Kelly Eberle, P.Eng. Principal Engineer keberle@betamachinery.com Brian C. Howes, M.Sc., P.Eng. Chief Engineer bhowes@betamachinery.com
Gas Pressure and Volume Relationships *
 Gas Pressure and Volume Relationships * MoLE Activities To begin this assignment you must be able to log on to the Internet (the software requires OSX for mac users). Type the following address into the
Thermal Profiling the Reflow Process
 Thermal Profiling the Reflow Process The Nomadics TCProfile system is a cost-effective instrument to measure the temperature characteristics of any process where the thermal profile is important to the
SWIM MEET MANAGER 5.0 NEW FEATURES
 SWIM MEET MANAGER 5.0 NEW FEATURES Updated January 24, 2014 1 ABOUT SWIMMING MEET MANAGER 5.0 MEET MANAGER 5.0 for ming (SWMM) is HY-TEK's 6th generation of Meet Management software. Provides the very
NORDCALC Introduction... 2 Registration... 2 Flow Calculations tab Torque Calculation & Actuator Mounting Data tab... 21
 NORDCALC User Guide Table of Contents NORDCALC Introduction... 2 Registration... 2 Flow Calculations tab... 5 Calculating the gas flow rate for gaseous medium... 6 Calculating the pressure drop for gaseous
How to Optimize the Disposal System With Staggered Analysis Using BLOWDOWN Technology. Jump Start Guide
 How to Optimize the Disposal System With Staggered Analysis Using BLOWDOWN Technology Jump Start Guide Problem Statement In this guide, you will be introduced to the tools in BLOWDOWN that can be used
HOW TO SETUP ROUND ROBIN IN DARTS FOR WINDOWS
 Edition: 1p2 06-Aug-2008 Previous editions: 05-Aug-2008 Author : RB Appr. : RB All pages in this document shall have the same edition number 3AQ 20080805 AAAD Ed. 1p2 Page 1 of 7 TABLE OF CONTENTS 1.SCOPE...3
Modeling a Pressure Safety Valve
 Modeling a Pressure Safety Valve Pressure Safety Valves (PSV), Pressure Relief Valves (PRV), and other pressure relieving devices offer protection against overpressure in many types of hydraulic systems.
Xactix XeF2 OPERATION MANUAL
 General Information The Xactix e-1 is a xenon difluoride (XeF 2) isotropic silicon etcher. XeF 2 is a vapor phase etch, which exhibits very high selectivity of silicon to photo-resist, silicon dioxide,
FRDS GEN II SIMULATOR WORKBOOK
 FRDS GEN II SIMULATOR WORKBOOK Trotter Control Inc 2015 Document# Revision Revised 9001-0038 FRDS GEN II Simulator Workbook E 02/15/2015 by DC FRDS GEN II Simulator Workbook This workbook is a follow-on
Software for electronic scorekeeping of volleyball matches, developed and distributed by:
 Software for electronic scorekeeping of volleyball matches, developed and distributed by: Developed for the rules of USports 2017-18 As adopted by Ontario University Athletics for Men s & Women s Volleyball
Lab 1. Adiabatic and reversible compression of a gas
 Lab 1. Adiabatic and reversible compression of a gas Introduction The initial and final states of an adiabatic and reversible volume change of an ideal gas can be determined by the First Law of Thermodynamics
Design of Experiments Example: A Two-Way Split-Plot Experiment
 Design of Experiments Example: A Two-Way Split-Plot Experiment A two-way split-plot (also known as strip-plot or split-block) design consists of two split-plot components. In industry, these designs arise
Swing Labs Training Guide
 Swing Labs Training Guide How to perform a fitting using FlightScope and Swing Labs Upload Manager 3 v0 20080116 ii Swing labs Table of Contents 1 Installing & Set-up of Upload Manager 3 (UM3) 1 Installation.................................
[CROSS COUNTRY SCORING]
![[CROSS COUNTRY SCORING]](/thumbs/84/89721527.jpg "[CROSS COUNTRY SCORING]") 2015 The Race Director Guide [CROSS COUNTRY SCORING] This document describes the setup and scoring processes employed when scoring a cross country race with Race Director. Contents Intro... 3 Division
2015 The Race Director Guide [CROSS COUNTRY SCORING] This document describes the setup and scoring processes employed when scoring a cross country race with Race Director. Contents Intro... 3 Division
Saphir Guided Session #8
 Ecrin v4.30 - Doc v4.30.05 - KAPPA 1988-2013 Saphir Guided Session #8 SapGS08-1/11 Saphir Guided Session #8 A01 Introduction This Guided Session illustrates the minifrac option available for analysis of
Spiral Transitions. Location of Spiral Drafting Tools GEOPAK>ROAD>Geometry>Layout Alignments Horizontal (COGO opens with these tools)
") Spiral Transitions Current guidance states that the use of spiral transitions reduce crash probability and are beneficial for operational and aesthetic performance. Since this guidance will result in increased
Spiral Transitions Current guidance states that the use of spiral transitions reduce crash probability and are beneficial for operational and aesthetic performance. Since this guidance will result in increased
Exercise 4-2. Centrifugal Pumps EXERCISE OBJECTIVE DISCUSSION OUTLINE DISCUSSION. Pumps
 Exercise 4-2 Centrifugal Pumps EXERCISE OBJECTIVE Familiarize yourself with the basics of liquid pumps, specifically with the basics of centrifugal pumps. DISCUSSION OUTLINE The Discussion of this exercise
Standard Operating Procedure
 07/02/20 DLI-SOP-2 Calibration, linearity testing and converter efficiency of 8 Prepared by: Date: Reviewed by: Date: Approved by: Date: The colored ink stamp indicates this is a controlled document. Absence
Deer Population Student Guide
 Deer Population Student Guide In many places, deer have become nuisance animals because they are so numerous. In some areas, a hunting season has been introduced or lengthened to reduce the number of deer.
Vapor Pressure of Liquids
 Experiment 10 In this experiment, you will investigate the relationship between the vapor pressure of a liquid and its temperature. When a liquid is added to the Erlenmeyer flask shown in Figure 1, it
Lab #1 Pressure: Bubblers and Water Balloons CEE 331 Fall 2003
 CEE 331 Lab 1 Page 1 of 9 SAFETY Lab #1 Pressure: Bubblers and Water Balloons CEE 331 Fall 2003 Laboratory exercise based on an exercise developed by Dr. Monroe Weber-Shirk The major safety hazard in this
The Gas Laws: Boyle's Law and Charles Law
 Exercise 6 Page 1 Illinois Central College CHEMISTRY 130 Name The Gas Laws: Boyle's Law and Charles Law Objective The simple laws governing the properties of gases can be readily demonstrated experimentally.
Soft Systems. Log Flume - 1. Enter Specification. Activity One ACTIVITIES. Help. for Logicator
 Log Flume - 1 ACTIVITIES These sheets present a series of activities for building your own programs to control the Log Flume Soft System. Together, they build into a complete control system for the log
Fun with Gas Laws. Prepared by Vance O. Kennedy and Ross S. Nord, Eastern Michigan University PURPOSE
 Experiment 2 Fun with Gas Laws Prepared by Vance O. Kennedy and Ross S. Nord, Eastern Michigan University PURPOSE The purpose of this laboratory experience is to explore the gas law relationships between
#LZ400 LEAKALYZER. Water Loss Sensor INSTRUCTION MANUAL Country Dr. #190 St. Paul, MN
 #LZ400 LEAKALYZER Water Loss Sensor INSTRUCTION MANUAL 2885 Country Dr. #190 St. Paul, MN 55117 800-348-1316 www.leaktools.com Your Partner in Swimming Pool Water Conservation Product Purpose: 2 The Leakalyzer
MASSACHUSETTS STATE POLICE CRIME LABORATORY. Certificate of Calibration Procedure for the Alcotest 9510
 MASSACHUSETTS STATE POLICE CRIME LABORATORY Certificate of Calibration Procedure for the Alcotest 9510 Effective Date: May 10, 2017 Page 1 of 23 TABLE OF CONTENTS 1 INTRODUCTION... 3 2 ABBREVIATIONS...