Bubble production by breaking waves
|
|
|
- Julius Gray
- 5 years ago
- Views:
Transcription

1 Calhoun: The NPS Insttutonal Archve Theses and Dssertatons Thess Collecton Bubble producton by breakng waves Danel, Albert C., Jr. Monterey, Calforna. Naval Postgraduate School
2

3
4
5


6 NAVAL POSTGRADUATE SCHOOL Monterey, Calforna THESIS BUBBLE PRODUCTION BY BREAKING WAVES by Albert C. Danel Jr. December 989 Thess Advsor Herman Medwn Approved for publc release; dstrbuton s unlmted. T24792.
7

 7a Name of Montorng Organzaton Naval Postgraduate School 7b Address (cty, state, and")

8 Unclassfed secunt) classfcaton of hs page REPORT DOCUMENTATION PACE la Report Secuntv Classfcaton I nclasshed lb Restrctve Markn 2a Secuntv Classfcaton Authontv 2b Declassfcaton DownaradmE Schedule 3 Dstrbuton Avalablty of Report Approved for publc release; dstrbuton s unlmted. 4 Performns Organzaton Report Number(s) 5 Montorng Organzaton Report Number(s) 6a Name of Performng Organzaton Naval Postgraduate School 6c Address (dry, state, and ZIP code} Montcrev. CA Sa Name of Fundng Sponsorng Organzaton 6b Offce Symbol (f applcable 33 8b Offce Symbol (f applcable) 7a Name of Montorng Organzaton Naval Postgraduate School 7b Address (cty, state, and ZIP code) Monterey, CA Procurement Instrument Identfcaton Number Sc Address ( cty, state, and ZIP code) 0 Source of Fundms Numbers U Ttle (nclude secwtv classfcaton) 'ersonal Authon's) Albert C. Danel Jr. 3a Type of Report Master's Thess BUBBLE PRODUCTION BY BREAKING WAVES 3b Tme Covered From To 'rogram Element No Project No Task No Work L'nt Accesson No 4 Date of Report (year, month, day) December Pase Count 63 6 Supplementary Notaton The vews expressed n ths thess are those of the author and do not reflect the offcal polcy or poston of the Department of Defense or the U.S. Government. " Cosat Codes Feld Group Subgroup 8 Subject Terms (contnue on reverse f necessary and dentfy by block number) Bubble producton densty 9 Abstract (contnue on reverst f necessary and dentfy by block number) It has been shown (Medwn and Beaky, J. Acoust. Soc. Am., v. 86, (98*-))) that spllng breakers n the laboratory produce a sound close to the Knudsen sea surface nose spectrum from 400 Hz to 20 khz. The surface spectral producton densty of new \ -created near surface bubbles under these laboratory spllng breakers has now been acoustcally determned by usng an array of hydrophones. The surface spectral densty has been obtaned by dentfyng the ndvdual bubbles that create ths nose spectrum. The rad were calculated from the resonance frequences, he bubble postons on the surface of the water were determned from the dfference n tme o\' arrval of the bubble radaton to the elements of two vertcal arrays of hydrophones. The producton area and rale of producton of bubbles of rad to 7.40 mllmeters have been calculated and the total volume of ar encapsulated nto bubble foam per unt area of spllng breakers has been determned. 20 Dstrbuton Avalablty of Abstract lnj unclassfed unlmted D same as report DflC users 22a Name of Responsble Indvdual I lerman Medwn DD -ORM 473.S4 MAR 2 Abstract Securty Classfcaton Unclassfed 22b elephone (nclude Area code) ( S3 APR edton may be used untl exhausted All other edtons are obsolete 22c Offce Symbol 6MD securty classfcaton of ths page Unclassfed


9 Approved for publc release; dstrbuton s unlmted. Bubble Producton by Breakng Waves by Albert C. Danel Jr. Leutenant. Unted States Navy B.S.. Unversty of South Carolna. 9S4 Submtted n partal fulfllment of the requrements for the degree of MASTER OF SCIENCE IN ENGINEERING ACOUSTICS from the NAVAL POSTGRADUATE SCHOOL December 989
) that spllng breakers n the laboratory produce a sound close to the Knudscn sea surface nose spectrum from 400 Hz to 20 khz.")

10 ABSTRACT It has been shown (Medwn and Beaky, J. Acoust. Soc. Am., v (989)) that spllng breakers n the laboratory produce a sound close to the Knudscn sea surface nose spectrum from 400 Hz to 20 khz. The surface spectral producton densty of newly-created near surface bubbles under these laboratory spllng breakers has now been acoustcally determned by usng an array of hydrophones. The surface spectral densty has been obtaned by dentfyng the ndvdual bubbles that create ths nose spectrum. The rad were calculated from the resonance frequences. The bubble postons on the surface of the water were determned from the dfference n tme of arrval of the bubble radaton to the elements of two vertcal arrays of hydrophones. The producton area and rate of producton of bubbles of rad to 7.40 mllmeters have been calculated and the total volume of ar encapsulated nto bubble foam per unt area of spllng breakers has been determned. m


11 V I Cl TABLE OF CONTENTS I. INTRODUCTION II. BACKGROUND 2 III. FACILITIES AND APPARATUS 6 IV. EXPERIMENT 9 A. BREAKER SPECTRUM 9 B. BUBBLE IDENTIFICATION 4 C. BUBBLE LOCATION 9 D. RATE OF BUBBLE PRODUCTION 30 E. BUBBLE PRODUCTION DENSITY 36 V. COMPARISON WITH OTHER DETERMINATIONS 4 VI. CONCLUSIONS 44 APPENDIX A. EVIDENCE OF CAPILLARY WAVES 45 APPENDIX B. VOLTAGE AMPLIFIERS 50 LIST OF REFERENCES 53 INITIAL DISTRIBUTION LIST 55 IV


12 LIST OF TIGURES gure. Equpment setup 8 gure 2. Average cleepwater ambent nose spectra. (L'rck) gure 3. Anechoc tank background nose spectra 2 gure 4. Average nose spectrum from sx breakng waves 3 gure 5. Large trggerng bubble from breakng wave 6 gure 6. Addtonal smaller bubble dentfcaton 7 gure 7. Small bubble dentfcaton IS gure S. Bubble locaton geometry 24 gure 9. Bubble locaton technque 25 gure 0. Tmng error due to wave heght 26 gure. Dstrbuton of bubble locatons 27 gure 2. Bubble locaton plot 28 gure 3. Bubble locaton plot 29 gure 4. Average number of bubbles produced per laboratory breaker 32 gure 5. Average number oflarge bubbles per laboratory breaker 33 gure 6. Average number of md-sze bubbles per laboratory breaker 34 gure 7. A\erage number of small bubbles per laboratory breaker 35 gure 8. Average surface densty of bubbles produced 38 gure 9. Average surface densty of bubbles produced 39 gure 20. Volume of ar encapsulaton per surface area 40 gure 2. Rate of formaton of ar bubbles n wnd waves (Toba) 42 gure 22. Rate of formaton of ar bubbles n wnd waves (Toba) 43 gure 23. Possble capllary wave postons by bubble locaton 47 gure 24. Photograph of capllar}' waves 48 gure 25. Photograph of capllary waves 49 gure 26. Amplfer crcut dagram 5 gure 27. Operatonal characterstcs of the amplfer 52

13 ACKNOWLEDGEMENT would lke to express my great apprecaton to Professor Merman Medwn for hs patent gudance and for hs wllngness to share hs valuable knowledge. It has been a prvlege to work wth someone so respected n hs feld. Professor Jeffrey Nystuen was partcularly helpful wth hs ready suggestons and observatons. I would also lke to thank my wfe. Sherry, for her lovng support and confdence that ths thess really would be completed. VI


14 I. INTRODUCTION The purpose of ths thess s to develop a method for the determnaton of the bubble producton densty from breakng waves. The motvaton for ths study came from the observaton that the spectrum produced from the nose of the breakng waves n the laboratory tank at the Naval Postgraduate School closely resembled the Knudsen sea surface spectrum of the ambent nose at sea. Ths development suggested that the breakng waves expermentally produced wll exhbt the same bubble characterstcs as breakng waves at sea. It s hoped that the capablty of comparng the calculated bubble producton densty wth the area of foam coverage montored wth satellte magng and aeral photography wll ad n acoustcal and meteorologcal research of ar sea nteractons by predctng the number and sze of bubbles whch may be found n the jcgon beng studed. The method used n ths research s to utlze passve acoustcs to dentfy ndvdual bubbles created from breakng waves. The breakng of the wave, characterzed by the ntal formaton of a large ampltude, low frequency bubble, was used as a trggerng source for the sgnal processng equpment. The locaton of each subsequent bubble was calculated by usng the dfference n tme of arrval of the nose from the bubble to the dfferent elements of a hydrophone array. The bubble producton area can be measured by postonng all the bubble locatons on a grd. The rate of bubble producton was observed to behave as an exponentally decreasng functon of tme. hs was determned by notng the relatve tme of arrval of the pressure waves from the ndvdual oscllatng bubbles to a hydrophone array. The bubble producton densty and volume rate of gas entranment were calculated from the bubble populaton data and the measured area of bubble producton. Ths technque provded nformaton on bubble producton on the surface, a quantt} whch had not been drectly measured n any other prevous expermental work.


15 II. BACKGROUND Many processes of acoustcal, meterologcal, geochemcal, and bologcal nterest are assocated wth the presence of bubbles n the near surface of the oceans. Among these are ambent nose, aerosol formaton, surface coagulaton, fractonalzaton of organc or norganc materals, and gas exchange. The bubble populatons that nfluence these phenomena are composed of bubble patches produced by breakng waves supermposed on a background populaton of bubbles. The background populaton of bubbles orgnates from bubble patches due to prevous breakng waves, bologcal actvty, droplet mpacts, and sedment outgassng. Some of these bubbles wll rse and eventually burst on the surface affectng the processes already mentoned. Other bubbles undergo dffuson and wll completely dssohe. An expresson gven by Levch (962) for the rate at whch these bubbles wll dssolve s descrbed by the followng equaton: dn 2. ± ± C jl = -7.98/) 3 u 3 a 3 dl where n s the number of moles of the gas. D s the gas dffusvty n nrj sec. u s the bubble velocty n m sec, a s the bubble radus n meters, and C s the Pecct number whch descbcs dffusve mass transfer. The vertcal dstrbuton of the bubbles beneath the surface has been studed by Thorpe (986) and Farmer and Yagle (989). Clouds of subsurface bubbles caused by wnd waves breakng n deep water and creatng whtecaps have been observed usng a vertcally pontng narrow beam sonar and a dual beam sde scannng sonar. The vertcal dstrbuton of bubbles s nfluenced by several actons: the turbulent transport from a source at the surface, the rse of the bubbles due to buoyancy, the change n bubble radus due to the dffuson dscussed earler, and change of hydrostatc pressure. The turbulence ncludes the forces from the whtecaps. the shear from the breakng wave, nternal waves, and Langmur crculaton. Thorpe's equaton representng the process s dn v tf.x o.\ v Wh = A, >b a- d
 and Toba (96) utlzed a photographc method to accomplsh ths task.")

16 Where w b s the rsng velocty of the bubbles n msec, N s the number of bubbles per unt volume, K v s the turbulent dffuson coeffcent n m\ sec, and a s the bubble loss rate due to dfluson n number of bubbles per second. There have been many other technques developed to measure these background bubbles. Johnson and Cooke (979) and Toba (96) utlzed a photographc method to accomplsh ths task. Three mages correspondng to the specular reflectons of the lght provded by three strobes served to dentfy bubbles and as the bass for measurement. The depth of feld was establshed by the ntersecton of three dots and a hgh resoluton flm allowed a 3X magnfcaton. Ths method clamed dentfcaton of bubbles wth rad as small as 7 am. The procedure requres the water to be n a clean, clear chute and can dentfy bubble rad wth only poor resoluton. The abundance of debrs and other matter would nterfere wth accurate dentfcaton of bubbles wth a radus of less than 0. mm. Kolovayev (976) used a bubble trap n order to concentrate the bubbles to allow measurements by photographc means. Ikctz and Medwn (989) developed a floatng acoustcal resonator to determne the number and sze of bubbles produced from spllng breakers at sea. The Q of the resonator was changed by bubble presence. The system allowed measurement of bubble populatons of nne rad between 30 and 270 am. Though accurate, ths method measured bubbles at a depth of 25 cm below the surface and gettng denstes at a shallower depth may not be possble. Wth these successful results n measurng and understandng the background bubbles, the next major area for study s to examne the orgns of the bubbles and the relatonshps between these bubble producng actons. A large proporton of bubbles n the oceans orgnate from the whtecaps of breakng waves. Holthujsen and Ilerbers (9S6) conducted measurements of wave heght, perod, steepness, crest front steepness, horzontal crest asymmetry, and vertcal crest asymmetry, n an attempt to estmate from these parameters the lkelhood that a wave wll break. They concluded that breakng waves cannot be separated from non-breakng waves wth these factors. Thorpe and Hall (983) arrved at several conclusons from observatons of waves at sea: separate bubble clouds are created by ndvdual waxes; the breakng crests are seldom more than several meters long; waves generally contnue to break as they advance so the horzontal sze of the bubble clouds ncreases wth wnd speed. Another mechansm of bubble producton nvolves the small capllary waves that can be observed on that front face of long gravty waves even n the absence of wnd. These capllary waves can break and pnch off ar bubbles n the same manner as the breaknc eravtv waves.


17 The role of surface tenson n breakng waves s also mportant. Mller (972) performed a seres of experments on lowerng the surface tenson of the water wth chemcals. In these experments t was found that, as the surface tenson decreased, the waves got hgher before they broke. Gucnsk (9S6) found that the persstence of vsble bubbles at sea s longer than that n fresh water durng smlar wnd and sea condtons. A contrbutng factor s the presence of organc matter whch surrounds the bubble nterfaces. Laboratory experments show an ncreasng coalescence wth ncreasng onc strengths. Snce dstrbutons of wnd and wnd waves can be collected by satellte sensors, the development of expressons for related phenomena as functons of these wnds and waves should be useful. Many studes have been made and great quanttes of data have been taken of wnd stress and whtecap coverage measured from a level of 0 meters. Toba and Koga (96S) have shown that the percentage of breakng waves ( a ). percentage of whtecap coverage ( P ), and the concentraton of sea salt partcles ( ), are related by the followng term: 2 «= 4.3*0 3 -^ 2 -s K />=S.9.vlU 5 -^- 2 = 65-^ where u. s the surface frcton velocty of ar n m sec, v s the knematc vscosty of ar n m-\ sec, and a s the speclral peak frequency of the wnd waves. It s now also possble to measure the tropospherc aerosols over the oceans wth satelltes. The method relates the upwellng vsble radants measured by the satellte to the aerosol optcal thckness of the atmosphere. There s a relatonshp between the radance and the aerosol optcal thckness whch vares wth parameters such as aerosol sze, dstrbuton, and refractve ndex. The correlaton between the sources of the aerosols, such as breakng waves and burstng bubbles, and ther concentraton n the atmosphere s stll not understood. The use of passve acoustcs and modern sgnal processng allows ndvdual bubbles to be examned as they are created by the breakng wave. Medwn and Beaky (9S9) separated the characterstcs of these bubbles nto four dstnct categores. These


18 categores descrbe the bubble dampng, resonance frequency, and oscllaton patterns. Wth the method descrbed n ths thess, utlzng the same equpment as Medwn and Beaky, the locaton of these ndvdual bubbles can be determned from the geometry of the hydrophone array and the dfference n the tme of arrval of the pressure feld to the ndvdual elements. From ths data the exponentally decreasng temporal rate of bubble creaton from an ndvdual breakng wave can be calculated, as well as the producton densty n bubbles per unt area orgnatng from a sngle breakng wave. The volume of gas encapsulaton per unt surface area of a spllng breaker can be computed from the bubble densty. Ths could be useful n studes of gas exchange at the ocean surface. If all the nformaton and methods descrbed can be ntegrated and successfully utlzed t wll be possble to obtan a complete perspectve on the generaton of bubbles at sea. The background bubbles arc understood and can be measured; the man source of bubble creaton, partcularly whtecap coverage from breakng waves, can be estmated; the physcal and chemcal makeup of the water can be examned; ard now wth the use of the method descrbed n ths thess t s possble to predct the rate of bubble producton from the whteeaps. Ths nformaton, when combned, wll further ad n our understandng the effect of ar 'sea nteracton on our envronment.


19 III. FACILITIES AND APPARATUS The laboratory facltes nclude a 57\4x4 foot wave tunnel emptyng nto a 0x0x0 foot anechoc tank. A motor-drven recprocatng wedge generates the waves at the begnnng of the tunnel. The waves break approxmately three feet after enterng the tank. The exact poston of where the waves wll break was not controlled. The tank sdes and bottoms are lned wth Redwood plngs. After spllng, the waves are absorbed by a "beach" consstng of an alumnum shavngs wedge whch mnmzes the wave reflecton at the tank boundary. Medwn and Beaky ( 9 S 9 ) conducted tests n the tank whch demonstrated at least a 5 decbel dfference between a sgnal and the strongest reflecton from the tank walls at frequences under 5 khz. and at least 20 db at frequences above 5 khz. when the hydrophone s 24 cm from the bubble source. The sgnal to reverberant nose rato s better for shallower hydrophones. Two vertcal arrays of 2 omndrectonal hydrophones wth the shallow hydrophone at a depth of 5 cm and the deep hydrophone at a depth of 3 cm arc stuated n the approxmate area where the majorty of the waves break as depcted n fgure (). The output sgnals are nput nto an Ithaco 250 voltage amplfer/bandpass flter wth the bandpass frequences set between 300 Hz and 00 khz. The amplfer output splts nto a Hewlett-Packard 356 A sgnal analyzer and also nto an IBM XT personal computer wth an R. C. Electroncs "computcrscope" analog to dgtal converter. The sgnal analyzer and the "computcrscope" allow the operator to select trggerng level. The sgnal analyzer trggers at an nput level of Volts whch, for an amplfcaton of 5000, corresponds to an acoustc pressure of.4 Pascals. 'Ibs "computerscope" analog to dgal converson software package samples the data wth a samplng perod of mcrosecond wth one nput. 2 mcroseconds wth two nputs, and accordngly. 4 mcroseconds wth four nputs wth a 2 bt ampltude resoluton. The sampled sgnal s dsplayed both graphcally and numercally wth curser movement. The buffer s 64 mllseconds long wth the mnmum samplng perod of mcrosecond and can be lengthened by a correspondng ncrease n the samplng perod. Sectons of the buffer can be "expanded" or "compressed" n tme and the ampltude of

20 the sgnal dsplay can also be adjusted. Ths enables the user to manpulate the graphcal presentaton to obtan a sgnal that can be accurately analyzed and also to adjust the samplng rate to maxmze the sgnal resoluton.


21 Wave Generatng / Wedge 57 / Hydrophone Vertcal Arrays / Anechoc Tank fj 0' / 0' Preamplfers HP356A Spectrum Analyzer / / " ^\ \ Preamplfers Computerscope A/D Converter Fgure. Equpment setup.


22 A. BREAKER SPECTRUM IV. EXPERIMENT Durng World War II many observatons of the ambent nose of the oceans showed that "wnd nose" s the prmary source of the nose n the frequency range between 500 Hz and 20 khz. The famous Knudsen spectra broke down ths large collecton of data n a manner ntended to demonstrate the wnd speed dependence of the nose level. Ths spectrum s reproduced from Urck (9S3) as fgure (2). The possble processes, as gven by Urck, whch produced ths nose were hypotheszed to be "crash noses of breakng waves", "flow nose" produced by wnd movng over the water, "cavtaton nose", and "wave generatng actons" of the wnd. The paper by Medwn and Beaky (989) proves that the catastrophcally created, damped bubbles, by themselves, explan the Knudsen spectra. The slope of the nose spectrum n ths frequency band s approxmately -5 to -6 db per octave or -7 db per decade wth the level ncreasng wth wnd speed. The nose n the frequences outsde ths band was beleved by Urck to orgnate from sources not drectly dependant on wnd speed such as shppng below 500 Hz and thermal nose above 50 kl Iz. In order to determne the nose spectrum of the waves breakng n the tank t was frst necessary to ensure that the wave generatng equpment was not actng as an addtonal nose source. Fgure (3) shows the background ambent nose of the tank wth no equpment n operaton plotted wth a dashed lne. The ambent nose n the tank wth the plunger n operaton but no waves breakng s plotted wth a sold lne. Both plots were generated on the IIP 356 A spectrum analyzer usng a tme average of 300 nput sgnals, each of 500 mllseconds duraton. The sgnal level was computed for frequences between 500 Hz and 50 khz. The breaker spectrum was also obtaned usng the IIP 356 A wth the nput from an omndrectonal hydrophone at a depth of 24 cm. The sgnal was dvded nto 40 sequental records, each of 20 mllsecond duraton. Each 20 mllsecond band was Fourer transformed to provde the power for each 50 I Iz block of the buffer.'* The encrgv n these bands was summed only f the energy was 3 db above the noted ambent nose level of the tank wth no actvty. Ths was done to ensure that the energy orgnated only from breakng waves n the tank. The breakng of a wave can usually be dentfed by a relatvely hgh ampltude low frequency bubble whch served as the trggerng source
. The slope of the spectrum s smlar to the Knudsen spectra at approxmately -7 db per decade.")

23 for the sgnal analyzer. The frequences that were observed were restrcted by the spectrum analyzer to between 400 Hz and 20 khz. A total of sx breakng waves was measured and the levels averaged. The results are dsplayed n fgure (4). The slope of the spectrum s smlar to the Knudsen spectra at approxmately -7 db per decade. The nose level at a frequency of khz s approxmately 82 db re lfpa 2 IJIz whch s somewhat greater than that of the Knudsen spectra at that frequency at hgh wnd speeds. Ths s due to the laboratory measurements beng made only when and where bubbles are beng produced: a comparable stuaton at sea would requre breakng waves to exst everywhere at all tmes as dscussed by Medwn and Beaky (9S9). The low nose level of fgure (3) confrmed that the only sgnfcant sources that contrbute to the sound levels above the ambent room nose are breakers produced by wave actons and not mechancal equpment. It should be observed that ths phenomenon was observed under the condton of no wnd over the tank. Ths confrms the suspcon that the actual source of the ambent nose are the breakng waves and not the wnd. It was the fascnatng fact that the spectrum n the tank s very smlar to the expected spectrum n the oceans that convnced the author that the data produced by ths study may be of future use to actual operatons performed at sea. The method of usng wnd speed as a reference s useful, however, because the wnd speed can be more dependably measured than the sea state. An nterestng thng to note about the breaker spectrum s that below khz the level remans constant to the mnmum frequency measured at 400 Hz. M. S. Longuet-Hggns predcted that certan frequences would be predomnant from bubbles produced by breakng waves. These frequences orgnate from modal dstortons n the shape of the bubble durng ts creaton. The frequences were stated n a submtted paper. Longuet-Hggns (989), to be at.38,.69, 2.0, , 5.70, , and 6.S khz. These frequences are desgnated by trangles on fgure (4). The laboratory spectrum showed a peak only at two of these frequences..69 and 2.60 khz. Several of the other frequences correspond to the poston of a mnmum on the spectrum. Ths does not allow a determnaton of the sgnfcance of ths phenomenon. 0


24 \ ;! '! \!!!l n I 0J D 20 n eo C ~ 20 ^S^N^^ S nppng Y eovy f H N, J I _. II Lghr- *"^ k^ \,-^r- ^**"**^^^. ^^^ bvnd speed, knots / >^ x ^>N^\ C ,000, _P^ *3 Sea ^-v 5 \L store \ "S^\ ^><^ ^ C \ \ ^^^^ ^-^, l ;, Frequency, Hz : n s s 0,000 ^ * , ,000 Fgure 2. Average deepwater ambent nose spectra. (Urck)


25 77 N I Q CD re 3 CJ w re o w re Q Ȯ^. u E START BW Hz STOP Hz Fgure 3. Anechoc tank background nose spectra: Sold lne, plunger operatng but no breakers. Dashed lne, plunger off. 2
 Fgure 4.")
 3")
26 !/ ; '., ; ' MNI : j ; ( j :! ; :! ;! I! ^ j! '!!! : I I j j ' ; ; N!! :! j y. < a < MM 'M' \ ;!!! \! / r ; \ : MM!l! nj k/ulh y \ \!! \!. - II \ A ± ± 0* o 3 o 4 FREQUENCY (HZ) Fgure 4. Average nose spectrum from sx breakng waves: Trangles mark the frequency peaks predcted by Longuet-Hggns. (989) 3


27 B. BUBBLE IDENTIFICATION It s possble to postvely dentfy ndvdual bubbles wthn the sound orgnatng from the breakng of a wave. The equpment utlzed s a hydrophone, a preamplfer, and an IBM XT personal computer wth an R.C. Electroncs Computerscope analog to dgtal converter. The converter samples the sgnal and allows detaled vewng of the desred segments of the captured nose. When a wave breaks or "splls" ar s entraned, bubbles are formed, and the bubbles oscllate to become sources of nose. In even' wave observed wth the sgnal processng equpment, the moment when the wave breaks can be dentfed by a large ampltude, low frequency bubble, wth suffcent energy to be used as the trggerng source for the sgnal analyzng equpment. Ths equpment has already been used by Medwn and Beaky ( 9 S 9 ) to characterze the bubbles from breakng waves by dentfyng the dampng and modulaton aspects most commonly observed. Four dstnct bubble scenaros were classfed: sphercal bubbles wth ether a constant decay rate or wth two dfferent decay rates, a damped oscllaton bubble appearng to shed a much smaller bubble, a near surface bubble whch has an ncreasng ampltude as t moves away from the surface due to an ncrease n the dpole axs, and a bubble undergong ampltude modulaton possbly due to another bubble n close proxmty wth a slghtly dfferent frequency. The resonance frequency of the bubbles was converted to bubble radus usng the followng relatonshp from Clay and Medwn (977): where f s the resonance frequency of the bubble n Hz, a s the bubble radus n meters. y s the rato of specfc heats of the gas n the bubble. P s the hydrostatc pressure n Njm 2, and p s the densty of the water n kgjm 3. The large ampltude ntal bubble created by a breakng wave can be seen n fgure (5). Ths s the frst 20 mllseconds of a 500 mllsecond buffer. In ths prntout the upper and lower sgnals are from a hydrophone at 6 cm depth and a hydrophone at 3 cm depth respectvely. The output sgnals are 80 degrees out of phase because of the amplfer output phase dfference. The confrmaton that t s ndeed a bubble can be made from the dampng relatonshp from Medwn and Beaky (9S9) 4
 s 505 Hz and the measured /e decay tme s 30.9 mllseconds.")

28 nfd where t s the decay tme n seconds to e of ts ampltude, f s the resonance frequency n Hertz, and S s the dampng constant. The measured frequency of the bubble n fgure (5) s 505 Hz and the measured /e decay tme s 30.9 mllseconds. From the table on page 99 of Clay and Medwn (977) the dampng constant for ths frequency should be approxmately If placed n the above equaton ths dampng constant yelds a /e decay tme of 2S.6 mllseconds-, a dfference from the measured value of 7 percent. Ths s close enough to the theoretcal value to ascertan that the bubbles are behavng as expected. If the presentaton s expanded and vewed wth more detal as n fgure (6), addtonal later sgnals from hgher frequency, smaller ampltude bubbles can be seen supermposed on the low frequency bubble sgnal. Fnally, the presentaton can be expanded even further, fgure (7), to enable the accurate dentfcaton of a smaller bubble wth frequency 6.6 khz ( 96 mcron radus) and accurate measurement of the dfference n tme of arrval of the sgnal to the ndvdual hydrophones. It can be seen n the above fgures that the ndvdual bubbles can be dentfed wth enough resoluton to obtan accurate nformaton about bubble frequency, ampltude, and relatve tme of arrval at the hydrophones. The sgnal data was recorded only f a bubble could be confdently dentfed above any nose whch may have been receved. Wth ths equpment accurate dentfcaton could be ensured f the sgnal level was at least 3 decbels above the measured ambent nose level of 37 di3 re XuPa-jIIz at the hydrophones. The resultng bubble count s thereby a conservatve measure of the number of bubbles and would not nclude any bubbles wth receved sgnal less than the lmt of 37 db. 5


29 e us 24,0 n$/dv m,m us Fgure 5. Large trggerng bubble from breakng wave: Predomnantly large ampltude and low frequency bubble (505 Hz). Sgnal presentaton s 20 ms. Outputs from two hydrophones shown. One output s nverted by the amplfer. Samplng perod s 5 mcroseconds. 6

30 e,5m us 3.0 «S/Dv 25,598 us Fgure 6. Addtonal smaller bubble dentfcaton: Several bubbles wth hgher frequency can be seen supermposed on the ntal bubble sgnal. Ths s 5 ms of the 20 ms plotted n fgure 5. Samplng perod s 5 mcroseconds. 7

31 7,88 us 375 us/dv 8,975 us Fgure 7. Small bubble dentfcaton: Frequency s 6 6 khz. Ths s a.875 ms secton of the sgnal shown n fgure 5. Samplng perod s 5 mcroseconds. 8


32 P = ( C. BUBBLE LOCATION The locaton of the bubble can be determned usng the geometry of the hydrophone postons and the relatonshps developed from the dfference n tme of arrval of the sound pressure wave to the hydrophones. In ths procedure t was assumed that the bubbles were created and reman approxmately at the surface of the water. The argument for ths assumpton follows: the bubbles were produced from the acton of the breakng wave entranng pockets of ar. Ths catastrophc force was the drvng mechansm causng the oscllaton. It was observed that the bubble oscllatons only lasted for a short duraton, of the order of tens of mllseconds, after the bubble formaton. In ths short perod of acton the bubble could not physcally travel any sgnfcant dstance. A second assumpton s that the surface of the water remaned horzontal, gnorng the wave heght. The error due to ths assumpton wll be examned shortly. When two hydrophones are placed n a vertcal array the sound pressure wave from a bubble at the surface wll arrve at the hydrophones at dfferent tmes. Ths dfference n tme of arrval wll be a functon of the dstance the wave must travel through the water. Bubbles produced near the surface of the water act as dpole sources. The dpole conssts of the bubble and an magnary source the same dstance above the surface as the bubble s below, wth a dstance L separatng ths mage and the bubble. Wth the assumpton that kl <. the dpole radaton pattern wll be defned by the followng equaton from Morse and Ingard (96S): p = ~ r )pcd co "m] + k )e 'lw '~ kr) where k s the wave number n radans 'meter, R s the range n meters from the bubble to the hydrophone, pc s the acoustc mpedance of water n Pa sec m, D = VL where \'=4;ta : U s the volume per tme. U s the radal velocty ampltude. s the angle between the axs of the dpole and the lne adjonng the bubble and the hydrophone, and w s the angular frequency of the oscllatng bubble n radans second. The magntude of the pressure at hydrophone can be descrbed as } [k 2 pcd cos( ^- )][ + -4 ]t Usng the relatonshp 9
 ) or restated P X = \P X \ cosluv, - kr + ] tan '( ^ )).")
) A/\ 2 Comparng the phases for the tmes that the peaks occur, u-/, - kr +tan : '( 7^~ ) = \"'T and v7 2 kr 2 + tan ( ) = //tt A' /\ -) and subtractnc velds:")
33 cos(u7-, n JL a + b = {a" + b) 2 e so that the term kl k'r 2 and = tan '( ) = tan \ kr The real part of the pressure at hydrophone can now be descrbed by the equaton: l\ = \l\\rc(e l{wl - kr^ e) ) or restated P X = \P X \ cosluv, - kr + ] tan '( ^ )). Identcally, the real part of the pressure at hydrophone 2 can be wrtten: P, = I P 2 I - AA\ + tan! ( [7- )) A/\ 2 Comparng the phases for the tmes that the peaks occur, u-/, - kr +tan : '( 7^~ ) = "'T and v7 2 kr 2 + tan ( ) = //tt A' /\ -) and subtractnc velds: vt/(r 2 - r,) - k(r 2 - R ) + tan _ ( -77- ) - ] tan"'( -7- = 0. A A : A A' The equaton descrbng the dfference n tme of arrval can be wrtten as:

T R 2 = {h\ + x 2 ) 2 where /;, and h 2 arc the depths of the hydrophones n meters and x s the horzontal dstance on the surface of the water above the hydrophone array n meters.")
34 , 2 _, = (A 7 A) + ( L)tan-'( -)-( 7 ).a -'(- I L) where /?, and /? 2 arc the dstances from the bubble to the hydrophones n meters, k s the wave number n radans meter, c s the speed of sound n meters second, and f s the resonance frequency of the bubble n Hertz. The geometry of the hydrophones s depcted n fgure (8). The followng relatonshps should be noted: /?,=(/> v )T R 2 = {h\ + x 2 ) 2 where /;, and h 2 arc the depths of the hydrophones n meters and x s the horzontal dstance on the surface of the water above the hydrophone array n meters. If the poston on the surface above the hydrophones s treated as an orgn, x s n fact the radus of a crcle. If these equatons for /?, and R 2 arc placed n the prevous equaton for tme of arrval dfference, ths radus, x, wll reman the only unknown. Usng an teratve program, the computer wll easly determne the soluton. The poston of the bubble on the surface can be determned by usng two vertcal arrays of hydrophones. The bubble wll be located somewhere on the crcles surroundng the arrays. These crcles wll ntersect at two ponts, n a symmetrcal manner about the horzontal lne separatng the arrays as n fgure (9). The ambguty between the two ntersectons s unmportant to the objectves of the experment. The fact that the surface of the water s not constantly horzontal, but n realty conssts of varous wave heghts, causes a change n the tme of arrval dfference between the hydrophones of an array. If the bubble s located on a wave crest or trough the dstance the pressure wave wll have to travel can be descrbed by: R ] =((/2, + A/;) )~.v R 2 = ((h 2 + Ahf + x 2 )-T '" where Ah s the vertcal dfference n bubble poston from the horzontal surface of the water. Ths dfference n tme of arrval caused by the wave ampltude s shown n fgure (0); It wll be noted that the maxmum ampltude of the waves n the tank s 2


35 approxmately 3 cm. At ths wave heght the error n tme of arrval s only 5 mcroseconds. Because of the fact that the wave heght follows a Gaussan dstrbuton, the wave heght at the bubble locaton wll lkely be on the order of cm and the error n tme would be 2 mcroseconds wth a correspondng error n bubble locaton of an nsgnfcant 2 or 3 mllmeters. Two vertcal arrays, each ncludng a shallow hydrophone at 6 cm depth, and a deep hydrophone at 3 cm depth, were placed n the tank n the area where most waves break. The perpendcular lne between the hydrophone arrays was set at approxmately a 30 degree angle to the drecton of the wave propogaton n order to ensure geometrc effcency n the calculaton of bubble postons. The buffer length was set to 00 mllseconds wth a correspondng samplng perod of 6 mcroseconds (spatal resoluton, 9 mm). Ths small samplng perod was consdered necessary n order to measure the tme of arrval dfference as accurately as possble. The output went through the preamplfers set at a gan of 5000 and acted as the trgger to the computerscopc analog to dgtal converter. The dfference n tme of arrval to the two vertcal pars of hydrophones, the resonance frequency of the bubble, and the tme that the bubble began oscllatng relatve to the breakng of the wave, were recorded n the frst 00 mllseconds for each bubble created by a breakng wave. Ths nformaton was used wth the teratve computer program to plot the locatons of the ndvdual bubbles. Fgure () s the result of one breakng wave showng the symmetrcal dstrbuton of the bubbles created n the frst loo mllseconds after breakng. The symmetrcal locatons are caused by the two ntersectons of the bubble rad crcles about the axes of the hydrophones. As long as the wave docs not break close to the hydrophones t s not necessary to plot both sets of locaton postons because t s the relatve postons of the bubbles that s necessary for densty calculatons. Tgurcs (2) and (3) show the bubble locatons wth only the postve postons recorded. The poston plots demonstrate the bubble patches or "hot spots" often noted n acoustcal measurements at sea. The plots were dvded by a grd consstng of squares 5 cm on a sde. These blocks of 25 square centmeters were used to calculate the area over whch bubbles were produced. Ths large area assgned to any bubble counters and compensates for any error n the calculaton of bubble poston. Each square wth a bubble n resdence was counted. The average total area of bubble producton was 345 square centmeters per breakng wave wth a standard devaton of 42 square centmeters. It was assumed that all bubbles created bv a breaker orgnate n such a calculated 22

 and (3). The two methods compare wthn 0 percent for the average producton areas.")
36 area. It was not possble to expand the tme of observaton n order to confrm ths assumpton for later bubbles because the samplng perod would also have become longer and the resoluton of the tme of arrval dfference would not have been suffcent for accurate bubble locaton. Another method was to form a rectangle around the bubbles and compute the producton area. The average producton area calculated wth ths method was 320 square centmeters wth a standard devaton of 96 square centmeters. The rectangle s marked by a sold lne around the bubbles n fgures (2) and (3). The two methods compare wthn 0 percent for the average producton areas. Another result of the bubble poston plots was the ablty to label the order n whch the bubbles were created by the breakng wave. Fgures (2) and (3) also show these relatve postons of the bubbles from two waves each marked wth the order n whch they were produced. The order of the postons does not demonstrate that the locaton of the bubble depends on the relatve tme of ts creaton wth respect to the breakng of the wave. The frst bubble created was not necessarly the closest to the poston where the wave breaks. Also the last bubble created was not necessarly located the farthest along the drecton of wave propagaton from the poston where the wave began breakng. Ths fact suggests that the majorty of the bubbles created were located wthn the area calculated even though ths area was calculated from bubbles orgnatng n the frst <"> mllseconds of breakng. Bubbles observed wthn the bubble locaton plots were ocassonally postoned n roughly lnear patterns not necessarly perpendcular to the drecton of wave propogaton. The bubbles wthn these patterns all orgnate consecutvely n short wdows of tme. It s beleved that these bubbles are created by and along the small capllary waves whch sometmes are seen supermposed on the face of a man wave. Ths evdence of capllary waves s examned n Appendx A. 23

37 Surface Bubble Hydrophone h Hydrophone2 h2 Fgure 8. Bubble locaton geometry. 24


38 Possble Bubble Postons Vertcal Hydrophone Arrays Fgure 9. Bubble locaton technque: Intersecton of the two crcles of rad x and x, around the hydrophone axes marks the possble locaton of the bubbles. 25
 Fgure 0.")

39 5 u c K - > E - E t Horzontal surface dstance from bubble to array axs (m) Fgure 0. Tmng error due to wave heght: Error n tme of arrval caused by the addtonal dstance traveled by the nose of a bubble on the surface of the water due to local wave heght above mean surface. 26


40 n c c. CO 3 D ^~^ o c - c r c l ^"^- c, o ~^B E - c o / / J c c - 7 ċ c c _ a c. ej c c. r: \ c \ ; ^-"^' \ \ «o \ e e v^r x poston (cm; Fgure. Dstrbuton of bubble locatons: Dstrbuton s symmetrc about the lne jonng the two vertcal arrays. Bubbles are from the frst 00 ms after the breakng of the wave. 27

41 T* / r / " ^ % t o n V c o CM / V D \U3 5 a s % n z J- C \? t \ a / t \// H D / 5 / c e x poston (cm) Fgure 2. Bubble locaton plot: Bubble locatons marked wth the order of bubble creaton. Same breaker as fgure. Bubbles are from the frst 00 ms after the breakng of the wave. 28
t_ m c c c c -40.0 30.0-20.0-0.0 0.0 0.0 20.")

42 E C c - o J\\. v k r: \ o K c fj \ ^ * c c \ 2b c 3> w k* ov \. / V A \X c d o J r ^ \ V <2> A \ )t_ m c c c c x poston (cm; Fgure 3. Bubble locaton plot: Bubble locatons marked wth the order of bubble creaton. Bubbles are from the frst 00 ms after the breakng of the wave. 29
.")


43 D. RATE OF BUBBLE PRODUCTION It was observed from the use of the Hewlett-Packard 356A Spectrum Analyzer that nose s produced from a breakng wave for a perod of 2 to 3 seconds after the frst sound of a breakng wave s heard. The dgtal processng equpment used to dentfy, locate, and count bubbles has a relatvely small memory (64k btes). Ths does not permt the sound to be captured for a long enough perod of tme to record all bubbles produced and smultaneously have a samplng perod small enogh to be of use n the dentfcaton of bubble resonance frequences. Therefore t was thus necessary to determne the rate at whch bubbles are produced over tme n order to determne an expresson defnng the bubble producton rate relatve to the tme at whch the wave breaks. The measurements could then be made for shorter perods of tme and then extrapolated to determne the total number of bubbles produced. Two omndrectonal hydrophones were placed n a vertcal array n the tank at depths o~ 2 and 24 centmeters. The buffer length for two hydrophones was expanded to 500 mllseconds by usng a samplng perod of 5 mcroseconds. Through expermentaton and consderaton of the Nyqust relatonshp t was determned that ths was the maxmum samplng perod that would allow dependable dentfcaton of bubbles wth resonance frequences less than 33 khz. The trgger level was adjusted to a level suffcently hgh to ensure the samplng equpment would begn capture only when a wave was breakng almost drectly above the hydrophones. "I hs was done to guarantee the observaton of bubbles wth a small ampltude whch may not have been seen from a longer dstance and at a greater angle from the dpolc. The short range from the hydrophones can be confrmed usng the method prevously descrbed. The nput sgnal passed through the preamplfer wth the gan set on A total of 0 breakng waves were observed. The average number of bubbles of all rad produced per breaker, wthn tme ncrements of 0 mllseconds, s plotted aganst the tme after the breakng of the wave n fgure ( 4). Addtonally, the producton rates for bubbles wth bubble rad broken down nto bands of greater than 2.2 mm (resonance frequency less than 500 /), between 2.2 mm (5(H) Hz) and 0.6 mm (20 khz), and less than 0.6 mm (greater than 20 khz), are depcted n fgures (5), (6), and (7) respectvely. These bands are chosen to accentuate the bubble producton behavor n the Knudsen sea nose spectrum frequency regme generally taken to be between 500 Hz and 20 khz. The producton spectrum of the two rad bands, 0.6 to 2.2 mm and smaller than 0.6 mm as seen n fgures (6) and (7). suggests that bubbles n these bands are 30
 s: dx.. -,, -, -.")

44 produced wth an exponental rate of decrease. The equatons whch approxmate the decay rates for these two bands are: r/ -V = ' dt and dx = A 0.27c dt,->-, : respectvely. Ths s probably also true for the largest bubbles but not enough data s avalable to show t. The curve whch best approxmates the exponentally declnng total producton rate of fgure (4) s: dx.. -,, -, / ; = 0.:> I3e d where dn dt s the number of bubbles produced per mllsecond and t s tme after the breakng of the wave n mllseconds. The expresson stated above can be ntegrated to descrbe the bubble producton rate out to specfed tmes. When the ntegraton was performed to nfnty t was found that less than 0. percent of the bubbles would orgnate after the frst second. About 97 percent of the bubbles were formed n the frst 500 mllseconds after the wave breaks. 3
 Fgure 4.")
.")
45 T3 -C > < Tme after breakng of wave (mllseconds) Fgure 4. Average number of bubbles produced per laboratory breaker: (all szes). The bubbles are counted wthn 0 ms ncrements. 32
.")
46 O o x. X) a E 3 C <L> Wj r3 u > < Tme after breakng of wave (mllseconds) Fgure 5. Average number of large bubbles per laboratory breaker: (radus > 2.2 mm). The bubbles are counted wthn 0 ms ncrements. 33
.")
47 -T3 U c - u -C E 3 C O re u < 500 Tme after breakng of wave (mllseconds) Fgure 6. Average number of md-sze bubbles per laboratory breaker: (0.6 mm< radus< 2.2 mm). The bubbles are counted wthn 0 ms ncrements. 34
.")
48 y. U x X) X - X: c o r3 > < Tme after breakng of wave (mllseconds) Fgure 7. Average number of small bubbles per labors' breaker: (radus < 0.6 mm). The bubbles are counted wthn 0 n crements. 35

 - (7) wth equal rad were summed and the average number of bubbles per breaker wth that radus was computed by dvdng by the number of waves observed.")
49 E. BUBBLE PRODUCTION DENSITY The rate at whch bubbles wll be produced s related to the foam coverage. Wth ths knowledge researchers wll be better able to understand the phenomena whch affect acoustcs, weather, aerosol producton, and any other sea surface nteractons. The two major requrements for densty calculatons have already been covered: the bubble creaton rate relatve to the start of the breakng of the wave, and the area over whch these bubbles are beng produced. All bubbles n fgures (5) - (7) wth equal rad were summed and the average number of bubbles per breaker wth that radus was computed by dvdng by the number of waves observed. In an earler experment t was found that only 3 percent more bubbles orgnated n the second 500 mllseconds after the breakng of the wave. Because the measurements were agan taken over a perod of 500 mllseconds the number of bubbles observed was thus ncreased by 3 percent to gve tre number of bubbles n the frst second. Ths number s now defned as the "total" number of bubbles. In an addtonal earler experment t was found that the average area of bubble producton spanned 345 square centmeters or cquvalently square meters. The "total" number of bubbles was dvded by to gve the resultng average bubble producton densty n bubbles per square meter for each bubble radus observed. Thus the bubble producton wll be expressed n bubbles per square meter and assumes neglgble number^ of bubbles are formed beyond the frst second after the wave breaks. Bubbles were observed wth fnte numbers of dfferent sze rad. If an nfnte number of waves were measured, eventually bubbles would be observed havng every possble radus up to the maxmum gas volume that can physcally be encapsulated. To account for ths lmtaton n the data recorded, the span n bubble radus n mcrons was calculated to nclude half the bubble radus sze between each of the subsequent smaller and larger bubble observatons. The number of bubbles per square meter was dvded by ths radus span to gve the bubble densty n bubbles per square meter per mcron of bubble radus ncrement. The bubble producton densty s plotted on semlog paper wth the radus on a logarthmc scale n fgure (8). and both bubble radus and densty on a logarthmc scale n fgure (9). It can be seen that the most commonly produced bubble was 0.5 mm n radus produced at the approxmate densty of 5.9 bubbles per square meter per mcron radus ncrement. The smallest bubble radus measured was 0.04S mm whch has a correspondng resonance frequency of 66 khz. The largest bubble was of radus

 and (9) that the majorty of bubbles produced were less than 0.5 mm n radus, the contrbuton to total gas entranment from these small bubbles s mnmal.")
50 mm wth a correspondng resonance frequency of 440 Hz. It wll be assumed that stll larger bubbles would not have been found even f more breakers had been observed. Once the producton densty of bubbles for each radus has been calculated the volume of gas encapsulated from each known bubble radus can be computed. Fgure (20) s a summary of cubc centmeters of gas volume encapsulated per square meter of breakng wave for bubbles of varous rad. Although t was seen n fgures (8) and (9) that the majorty of bubbles produced were less than 0.5 mm n radus, the contrbuton to total gas entranment from these small bubbles s mnmal. Assumng that there are no bubbles larger than the largest measured n 0 breakers whch had a radus of 7.4 mm. the ndvdual contrbutons from each bubble radus can be summed to gve a volume rate of gas encapsulaton whch averages 23 cubc centmeters of gas encapsulated per square meter of breakng wave n the laboratory. More than half of ths total volume came from bubbles wth radus greater than 3 mllmeters. 37
 * Ufc ^")

51 < B A O \ f c c { c / \ \ t 0 ^ 0 0" 0" BUBBLE RADIUS (MM) * Ufc ^ 3-, * s~ Wg ' 0' * Fgure 8. Average surface densty of bubbles produced. 38

 nr * 0 Fgure 9.")
52 ., -+!! Jlr! /^*s '!!!! j.j III ll Iflf-! ;!, H \ -! ;! '!!!!!! t ' h ~* o mmk as-«.. E 4-- /' /I /! \ \ TT d-! k_ ~T^ \ II \ t-y^ IV..., 4= 4-H M. "-"> t*! : u? I! - Illf -r : ( =±= «j l H ^ I! c? f D k a ce ' - -4 _^ L t? = -U- r T ; '! _y_r \ jnm_ 5 T 0"' 0 0 BUBBLE RADIUS (MM) nr * 0 Fgure 9. Average surface densty of bubbles produced. 39
 ; j!")
 0' Fgure 20.")
53 ' II 4- j I!! I j ' '! ' Ml ' _: '! I ' "^ ' ' ' j \ ',,' j j I I.., j!! III!! l!!! j! j!! J,. J, I! : j I, I I I! [ I ] ; T=> ^^ '. J [ -! l rr l 3 D to -B- S?o Qf~- - < y^ : = t - M \ : 2 u ; : -) ; j! T J r^ ft! D»-e : - E r U : w D O t- : _ h TO To - I - l l-s = rs! f) cr! rln tp rh J * ' III l. ; ; ; ll! SPI= : o > ; : _. " = rt 3! 4*0" 0" 0 BUBBLE RADIUS (MM) 0' Fgure 20. Volume of ar encapsulaton per surface area. 40


54 V. COMPARISON WITH OTHER DETERMINATIONS We know of only one other attempt to measure the bubble producton n a spllng breaker, that was by Toba (96). Contrary to our breakers beng produced by an oscllatng wedge wth no wnd. Toba used wnd of dfferent speeds and fetch n a flume. Toba's method consdered that an equlbrum exsted between the bubbles enterng from perodc breakng at the water surface and those rsng to the surface. Hs photographs were made of the volume densty of bubbles, not the surface producton densty of the bubbles whch s our goal. le used the tme between breakers to nfer the bubble encapsulaton rate usng the relatonshp p = ( _ _ ) l x h too ' I where /? s the bubble encapsulaton rate n bubbles square cm second, s the per- ' 00 centage of crests actually entranng bubbles. s the total number of bubbles of a partcular sze n a water column of unt ba^e area, and T s the perod of the man surface wave. The shape of Toba's encapsulaton spectrum, fgures (2 ) and (22). was very smlar to that n ths experment wth a sharp peak at a sngle bubble radus. However the peak of Toba's bubble producton was at approxmately 0.38 mm n radus at a rate of approxmately 0.2 bubbles per square centmeter per second for a wnd speed 2. m sec. Hs photographc measurements ncluded 6 dfferent szes of bubbles wth rad from 0.5 mm to 6.0 mm. Our method observed 53 bubble rad from 0.04S mm to 7.4 mm. Hs smallest radus bubble was our most common bubble. The producton rate nferred by Toba for 2. m sec wnd was of the same order as the rate measured drectly acoustcally. ' here have been extensve measurements of the foam coverage at sea usng aeral photography and satellte magng. The foam coverage s a measurement of resdual bubbles ncludng those convected upward from below and lackng those that have been convected from the surface to lower depths or that have burst at the surface. Thus the area of coverage can not be used drectly wth the denstes measured n ths experment to calculate the bubble populatons beneath the ocean surface. Further expermentaton s requred n order to understand exactly what s beng measured from the foam of breakng waves. 4
 40 Fetch l.9 n *<.")

55 240r I'och Kt ( n J HOr 2 a o a Bubble dameter (mm) 40 Fetch l.9 n *<..vr^^ Fetch m 40 l(!2 U Fgure 2. Rate of formaton of ar bubbles n wnd waves (Toba). 42
: plotted per")
56 300 Bubble dameter (mm) Fgure 22. Rate of formaton of ar bubbles n wnd waves (Toba): plotted per equal log (bubble sze) nterval. 43


57 VI. CONCLL'SIONS The method descrbed throughout ths thess acheved ts goal of obtanng the bubble producton densty from plunger generated spllng breakers. The technque used was to passvely observe the ampltude and frequency of the randomly pulsed sound emtted by the breakers. The results gve more detals of the characterstcs of bubble producton than prevous expermental technques used for obtanng surface bubble denstes. Bubbles were postvely dentfed throughout a radus range of to 7.4 mllmeters. Most of the bubbles orgnate n the frst 500 mllseconds after the breakng of the wave though sound from bubbles has been recorded for a perod of 2 to 3 seconds after breakng. The bubbles were produced wth an exponentally decreasng rate followng a decay constant of t wth tme measured n mllseconds after the breakng of the wave. The average area of bubble producton from breakng waves n the tank was 345 square centmeters. The most commonly produced bubble had a radus of 0.5 mllmeters and was entraned at a densty of 5.9 bubbles per square meter per mcron of bubble radus ncrement. Ths bubble radus s smaller than the mnmum bubble radus measured n other experments usng photographc technques to obtan bubble volume densty. The greater resoluton usng acoustcs nstead of photography has allowed 0 tmes the resoluton n bubble rad dentfcaton for bubbles wth rad between 0.25 and 2.0 mllmeters. The average encapsulaton of gas was 23 cubc centmeters per square meter of breakng wave. Usng the Knudsen sound radated from the breakng waves as our sole crteron. whtecaps from spllng ocean waves have lttle physcal dfference from the breakng waves produced n the laboratory. If ths s the case, the measurements reported here are useable for the ocean. The use of ths passve acoustcal technque n actual sea measurements may also be possble. If these laboratory data are confrmed by actual measurements of surface bubble producton densty at sea. and after further studes of bubble dsspaton n a turbulent ocean, satellte measurements of the foam coverage from whtecaps could yeld an estmate of the rate of bubble producton n the ocean. 44


58 APPENDIX A. EVIDENCE OF CAPILLARY WAVES Upon examnaton of the bubble locaton plots t was dscovered that n some of the plots the bubbles appeared to be located along lnes perpedcular to the wave propagaton drecton (fg 2) and n other cases the lnes are not perpendcular to the drecton of wave propagaton. These lnes appeared wth varyng angles rangng from 30 to 90 degrees away from the propagaton drecton. It was hypotheszed that these may have been capllar}' waves formng on the face of the man wave. A purely arbtrary reference tme of 0 mllseconds was chosen as the tme wthn whch all of the bubbles on the lne must have orgnated. Tgure (23) s an example of a capllary lne dentfcaton. The bubbles were captured wth a samplng perod of 6 mcroseconds durng the frst 00 mllseconds after the wave broke. The order of bubble formaton s marked on the fgure and the followng are the tmes of the begnnng of the ndvdual bubble oscllatons after the breakne of the wave: ubble number Orgn tme (ms) S K)
 are dentfed by bubbles 6 through 8 and by bubbles 7 through 9.")
59 The capllar}' lnes on fgure (23) are dentfed by bubbles 6 through 8 and by bubbles 7 through 9. Fgures (24) and (25) are photographs of breakng waves n whch the capllar}' waves may be clearly observed. 46


 Fgure 23.")
60 .., o C -J «l ' cc o ID.. _4 *r%^»?%> "-4$ \ (j - u o CM 3 n *. fr r, - ur, 'o c,",. " ^,, ' o o ' / c,a \ \ C o c IS x poston (cm) Fgure 23. Possble capllary wave postons by bubble locaton: Lnes are from bubbles 6-8 and
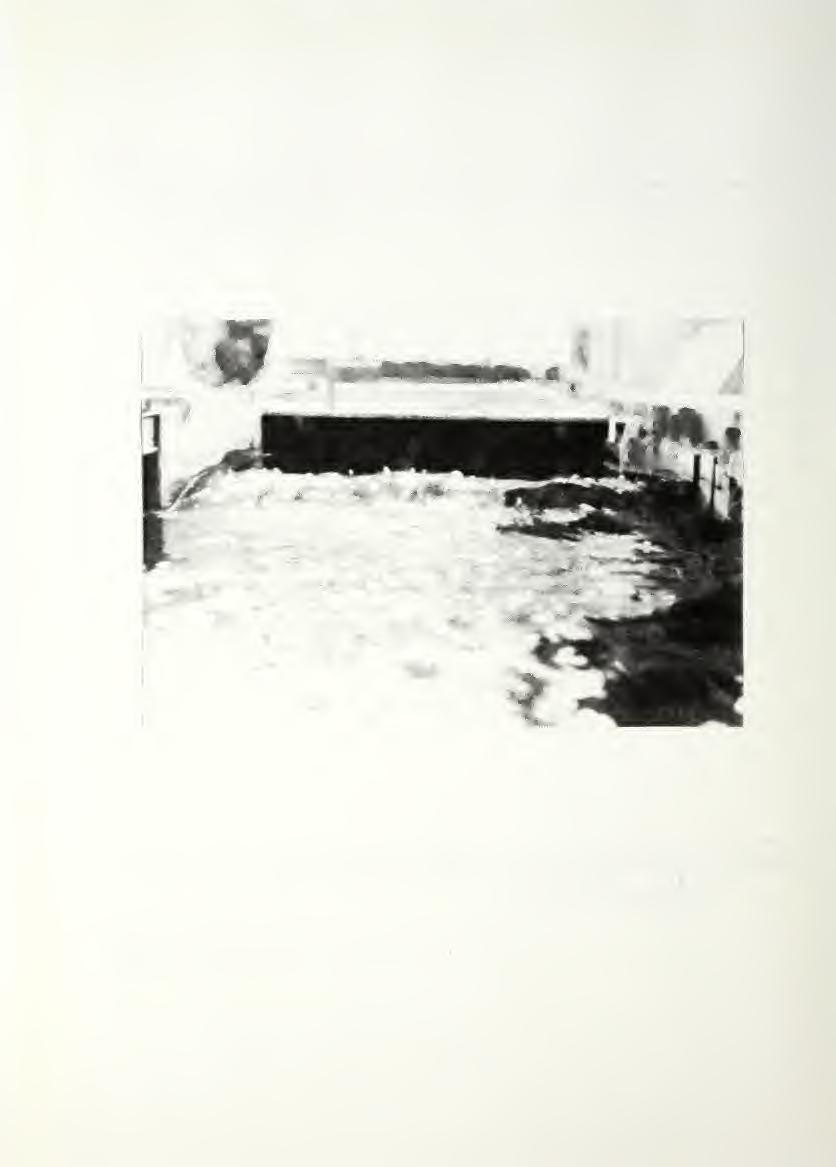
61 Fgure 24. Photograph of capllary waves. 48
62 Fgure 25. Photograph of capllary waves. 49


63 APPENDIX B. VOLTAGE AMPLIFIERS When recevng sgnals from many hydrophones smultaneously, t was necessary to develop a substtute for the lmted number of Ithacc 20 Preamplfers. A seres of preamplfers was bult usng two 356 operatonal amplfers n seres wth the necessary feedback elements. Fgure (26) s the dagram of the amplfer crcut. Fgure (27) shows the operatonal characterstcs of the amplfer. 50


64 0.22U o-ju 470U.5 r. 5MEG -^5 UOLTS.5 MEG r-vw-.. IK 22U 75 K 75K -VW- -d - -=T22U. IK Fgure 26. Amplfer crcut dagram. 5
 50.0 60.0 70.0 Fgure 27.")
65 r^ o to o CO C3 Z < o C - CO c <c o o ;o.o FREQUENCY (KHZ) Fgure 27. Operatonal characterstcs of the amplfer. 52


66 LIST OF REFERENCES Brctz, N., and Medwn, II., "Instrumentaton for n stu v\coustcal Measurements of Bubble Spectra under Breakng Waves," J. Acoust. Soc. Am., v. S6 pp , 9S9. Clay, C.S., and Medwn. II., Acoustcal Oceanography: Prncples and Applcatons, John Wley and Sons. New York. p. 96, 977. Farmer. D. M.. and Vagle, S., "Wavegude propagaton of ambent sound n the oceansurface bubble layer." J. Acoust. Soc. Am., v. 86 pp S, 9S9. Guchnsk, II., 'Bubble Coalescence n Sea and Freshwater: Requstes for an Explanaton," F.C. Monahan and G. Mac Xocall (Eds.), Ocean Whecaps, p D. Redel Publshng Company Holthujsen, L. II.. and Hcrbcrs, T. II. C, "Statstcs of Breakng Waves Observed as Whtecaps n the Open Sea," J. Phys. Ocean., v. 6 pp , 986. Johnson. B. D.. and Cooke. R. C. "Bubble Populatons n Coastal Waters: A Photographc Approach." J. Geophys. Res., v. 84 pp Kolovaycv. D. A., "Investgaton of the Concentraton and Statstcal S/e Dstrbuton of Wnd-Prodfced Bubbles n the Near-Surface Ocean," Oceanology, v. 5 pp , 976. Levch. V. G., Physochemcal Hydrodynamcs, Prentce Hall Longuet-Hggns, VI. S., "Bubble Nose Spectra," J. Acoust. Soc. Am., (submtted), 989. Medwn.., and Beaky. M. M.. "Bubble Sources of the Knudsen Sea Nose Spectra."./. Acoust. Soc. Am., v. 86 pp ,
. Ocean Whtecaps, pp. 37-47, D.")
.")
67 Mller. R. L., Unversty of Chcago. Flud Dynamcs and Sedments Transport Laboratory. Dept. of Geophyscal Scences. Techncal Report No. 3, 972. Morse. P. M., and Ingard, K. U.. Theoretcal Acoustcs, McGraw-Hll, New York, 968. Toba, Y., and Koga. K.. "A Parameter Descrbng Overall Condtons of Wave Breakng, Whtecappng, Sea-Spray Producton, and Wnd Stress." E. C. Monahan and G. Mac Nocall (Eds.). Ocean Whtecaps, pp , D. Redell Publshng Company, 986. Toba. Y.. "Drop Producton by Burstng of Ar Bubbles on the Sea Surface () Study by Use of a Wnd Flume," Memors of the College of Scence, Unversty of Kyoto, Seres A. v. XXIX. No. 3. Art. 4. pp Thorpe. S. A.. "Bubble Clouds: A Revew of Ther Detecton by Sonar, of Related Models, and of Mow A', may be Determned." E. C. Monahan and G. Mac Nocall (Eds.). Ocean Whtecaps, pp , D. Redell Publshng Company. 9S6. Thorpe. S. A., and Hall, A. J.. "The Characterstcs of Breakng Waves. Bubble Clouds, and Near-Surface Currents Observed Usng Sde-Scan Sonar," Contnental Shelf Research, v. pp , 983. Urck, R. J.. Prncples of Underwater Sound, 3rd Edton, McGraw-Hll Book Company, 9S3. 54
 6 Department of Physcs Naval Postgraduate School Monterey. CA 93943-5004 4. Prof J. A. Nvstuen 2 Department of Oceanography Naval Postgraduate School Monterey. CA 93943-5004 5.")

68 INITIAL DISTRIBUTION LIST No. Copes. Defense Techncal Informaton Center 2 Cameron Staton Alexandra, VA Lbrary. Code Naval Postgraduate School Monterey. CA Prof H. Medwn (Code 6 Md) 6 Department of Physcs Naval Postgraduate School Monterey. CA Prof J. A. Nvstuen 2 Department of Oceanography Naval Postgraduate School Monterey. CA Commandnc Offcer 3 Attn: LTA. C. Danel L'SS Devo (DD-989) FPO Mam. FL Offce of Naval Research Attn: Dr. Marshall Orr 8()<) N. Quncy Arlngton, VA Prof A. A. Atchlcy Department of Physcs Naval Postgraduate School Monterey. CA Davd M. Parmer Insttute of Ocean Scences P. O. Box 6oou Sdney. Brtsh Columba, VSL4B2 Canada 9. M. S. Longuet-Hggns Center for Studes of Nonlnear Dynamcs La Jolla Insttute 7S55 Lav Avenue. Sute 320 La Jolla'. CA ' c 55

69 0. S. A. Thorpe nsttute of Oceanographc Scences Wormley. Godalmng, Surrey GU85UB Unted Kngdom. E. C. Monohan Marne Scences Insttute Unversty of Connectcut Avery Pont Groton, CT <r < 5?v 56
70
71

72
73


74 . Thess D47742 c.l Danel Bubble producton by breakng waves. Thess D47742 r. Danel Bubble producton b' T breakng waves

75
Reduced drift, high accuracy stable carbon isotope ratio measurements using a reference gas with the Picarro 13 CO 2 G2101-i gas analyzer
 Reduced drft, hgh accuracy stable carbon sotope rato measurements usng a reference gas wth the Pcarro 13 CO 2 G2101- gas analyzer Chrs Rella, Ph.D. Drector of Research & Development Pcarro, Inc., Sunnyvale,
Evaluation of a Center Pivot Variable Rate Irrigation System
 Evaluaton of a Center Pvot Varable Rate Irrgaton System Ruxu Su Danel K. Fsher USDA-ARS Crop Producton Systems Research Unt, Stonevlle, Msssspp Abstrat: Unformty of water dstrbuton of a varable rate center
GAS-LIQUID INTERFACIAL AREA IN OXYGEN ABSORPTION INTO OIL-IN-WATER EMULSIONS
 AS-LIQUID INTERFACIAL AREA IN OXYEN ABSORPTION INTO OIL-IN-WATER EMULSIONS ómez-díaz, D. a, omes, N. b, Texera, J.A. b, Belo, I. b a Department of Chemcal Engneerng, Unversty of Santago de Compostela,
ADDITIONAL INSTRUCTIONS FOR ISU SYNCHRONIZED SKATING TECHNICAL CONTROLLERS AND TECHNICAL SPECIALISTS
 A ADDITIONAL INSTRUCTIONS FOR ISU SYNCHRONIZED SKATING TECHNICAL CONTROLLERS AND TECHNICAL SPECIALISTS DIFFICULTY GROUPS OF FEATURES 1 DEFINITIONS: Change of Rotaton: Refers to TURNS or LINKING STEPS rotatng
A Prediction of Reliability of Suction Valve in Reciprocating Compressor
 Purdue Unversty Purdue e-pubs nternatonal Compressor Engneerng Conference School of Mechancal Engneerng 1996 A Predcton of Relablty of Sucton Valve n Recprocatng Compressor W. H. You Samsung Electroncs
Wave Breaking Energy in Coastal Region
 ave Breang Energy n Coastal Regon Ray-Qng Ln and Lwa Ln Dept. of Seaeepng Davd Taylor Model Basn NSCCD U.S. Army Engneer Researc and Development Center. INTERODUCTION Huang 006 suggested tat wave breang
Engineering Analysis of Implementing Pedestrian Scramble Crossing at Traffic Junctions in Singapore
 Engneerng Analyss of Implementng Pedestran Scramble Crossng at Traffc Junctons n Sngapore Dr. Lm Wee Chuan Eldn Department of Chemcal & Bomolecular Engneerng, Natonal Unversty of Sngapore, 4 Engneerng
PREDICTIONS OF CIRCULATING CURRENT FIELD AROUND A SUBMERGED BREAKWATER INDUCED BY BREAKING WAVES AND SURFACE ROLLERS. Yoshimitsu Tajima 1
 PREDICTIONS O CIRCULATING CURRENT IELD AROUND A SUBMERGED BREAKWATER INDUCED BY BREAKING WAVES AND SURACE ROLLERS Yoshmtsu Tama 1 Ths paper develops a quas-three-dmensonal nearshore current model whch
Development of Accident Modification Factors for Rural Frontage Road Segments in Texas
 Development of Accdent Modfcaton Factors for Rural Frontage Road Segments n Texas Domnque Lord* Zachry Department of Cvl Engneerng & Center for Transportaton Safety Texas Transportaton Insttute Texas A&M
A Study on Parametric Wave Estimation Based on Measured Ship Motions
 1 A Study on Parametrc Wave Estmaton Based on Measured Shp Motons Ulrk Dam NIELSEN * and Tosho ISEKI ** Abstract The paper studes parametrc wave estmaton based on the wave buoy analogy, and data and results
Risk analysis of natural gas pipeline
 Rsk analyss of natural gas ppelne Y.-D. Jo 1, K.-S. Park 1, J. W. Ko, & B. J. Ahn 3 1 Insttute of Gas Safety Technology, Korea Gas Safety Corporaton, South Korea Department of Chemcal Engneerng, Kwangwoon
SECOND-ORDER CREST STATISTICS OF REALISTIC SEA STATES
 SECOND-ORDER CREST STATISTICS OF REALISTIC SEA STATES MARIOS CHRISTOU Shell Internatonal Exploraton and Producton, 2288 GS Rjswjk, The Netherlands. E-mal: maros.chrstou@shell.com PETER TROMANS Ocean Wave
High Speed 128-bit BCD Adder Architecture Using CLA
 Hgh Speed 128-bt BCD Archtecture Usng CLA J.S.V.Sa Prasanth 1, Y.Yamn Dev 2 PG Student [VLSI&ES], Dept. of ECE, Swamy Vvekananda Engneerng College, Kalavara, Andhrapradesh, Inda 1 Assstant Professor, Dept.
First digit of chosen number Frequency (f i ) Total 100
 Total 100") 1 4. ANALYSING FREQUENCY TABLES Categorcal (nomnal) data are usually summarzed n requency tables. Contnuous numercal data may also be grouped nto ntervals and the requency o observatons n each nterval
1 4. ANALYSING FREQUENCY TABLES Categorcal (nomnal) data are usually summarzed n requency tables. Contnuous numercal data may also be grouped nto ntervals and the requency o observatons n each nterval
Coastal Engineering Technical Note
 Coastal Engneerng Techncal Note CETN V-10 Even-Odd Functon Analyss of Shorelne Poston and Volume Change by Jule Dean RoSllt and Nchollls C. Kraus Purpose: To present the background and methodology for
Applications on openpdc platform at Washington State University
 Applcatons on openpdc platform at Washngton State Unversty Chuanln Zhao Ebrahm Rezae Man V. Venkatasubramanan Washngton State Unversty Pullman WA WSU projects OMS - Oscllaton Montorng System Stand-alone
Bubble Column Reactor Fluid-dynamic Evaluation at Pilot-plant for Residue and Extra-heavy Crude Oil Upgrading Technology
 J. Chem. Chem. Eng. 9 (15) 176-19 do: 1.1765/1934-7375/15.3.3 D DAVID PUBISHING Bubble Column Reactor Flud-dynamc Evaluaton at Plot-plant for Resdue and Extra-heavy Crude Ol Upgradng Technology Rcardo
ALASKA DEPARTMENT OF FISH AND GAME DIVISION OF COMMERCIAL FISHERIES NEWS RELEASE
 ALASKA DEPARTMENT OF FISH AND GAME DIVISION OF COMMERCIAL FISHERIES NEWS RELEASE Cora Campbell, Commssoner Jeff Regnart, Drector Contact: Cordova ADF&G Steve Mofftt, PWS Fnfsh Research Bologst 401 Ralroad
Product Information. Universal gripper PZN-plus
 Product Informaton Unversal grpper PZN-plus PZN-plus Unversal grpper Relable. Robust. Flexble. PZN-plus unversal grpper Unversal 3-Fnger Centrc Grpper wth hgh grppng force and maxmum moments due to mult-tooth
Study on coastal bridge under the action of extreme wave
 Study on coastal brdge under the acton of extreme wave Bo Huang Bng Zhu Jawe Zhang School of Cvl Engneerng, Southwest Jaotong Unversty, Chengdu 610031, Chna Abstract In order to research the catastrophc
Predicting Wave Transformation during Extreme Weather Conditions
 Predctng Wave Transformaton durng Extreme Weather Condtons Josephus LOPEZ 1, Karlo Marko NARIO 1, Patrck Joshua ROMARES 1, Maro DE LEON, Ryuchro NISHI 3, Hosotan KAZUNORI 4 1 Bachelor of Scence n Cvl Engneerng
This document is downloaded from DR-NTU, Nanyang Technological University Library, Singapore.
 Ths document s downloaded from DR-NTU, Nanyang Technologcal Unversty Lbrary, Sngapore. Ttle capacty analyss usng smulaton Author(s) Ctaton Huang, Shell Yng; Hsu, Wen Jng; He, Yuxong; Song, Tancheng; De
Experimental And Numerical Investigation Of The Flow Analysis Of The Water-Saving Safety Valve
 Expermental And Numercal Investgaton Of The Flow Analyss Of The Water-Savng Safety Valve Muhammed Safa KAMER s PhD Student n Department of Mechancal Engneerng n Kahramanmaras Sutcu Imam Unversty, Turkey.
Product Information. Gripper for small components MPG-plus
 Product Informaton Grpper for small components MPG-plus MPG-plus Grpper for small components More powerful. Faster. Longer fngers. MPG-plus grpper for small components 2-fnger parallel grpper wth smooth
Evaluation of Wettability of Solid Surface with Oil/ Refrigerant Mixture
 Purdue Unversty Purdue e-pubs Internatonal Compressor Engneerng Conference School of Mechancal Engneerng 16 Evaluaton of Wettablty of Sold Surface wth Ol/ Refrgerant Mxture Mtsuhro Fukuta Shzuoka Unversty,
Lake Clarity Model: Development of Updated Algorithms to Define Particle Aggregation and Settling in Lake Tahoe
 Lake Clarty Model: Development of Updated Algorthms to Defne Partcle Aggregaton and Settlng n Lake Tahoe Goloka B. Sahoo S. Geoffrey Schladow John E. Reuter Danel Nover Davd Jassby Lake Clarty Model Weather
Planning of production and utility systems under unit performance degradation and alternative resource-constrained cleaning policies
 1 2 3 4 5 6 7 8 9 10 11 12 13 14 15 16 17 18 19 20 21 22 23 24 25 26 27 28 29 30 31 32 33 34 35 36 37 38 39 40 41 42 43 44 45 46 Plannng of producton and utlty systems under unt performance degradaton
Mechanical Engineering Journal
 56789 Bulletn of the JSME Mechancal Engneerng Journal Vol., o., 6 Measurement of three-dmensonal orentaton of golf club head wth one camera Wataru KIMIZUKA* and Masahde OUKI* * DULOP SPORTS CO. LTD. Waknohama-cho
Dynamic Analysis of the Discharge Valve of the Rotary Compressor
 Purdue Unversty Purdue e-pubs Internatonal Compressor Engneerng Conference School of Mechancal Engneerng 8 Dynamc Analyss of the Dscharge Valve of the Rotary Compressor Bo Huang Shangha Htach Electrcal
Internal Wave Maker for Navier-Stokes Equations in a Three-Dimensional Numerical Model
 Journal of Coastal Research SI 64 511-515 ICS2011 (Proceedngs) Poland ISSN 0749-0208 Internal Wave Maker for Naver-Stokes Equatons n a Three-Dmensonal Numercal Model T. Ha, J.W. Lee and Y.-S. Cho Dept.
Product Information. Radial gripper PRG 52
 Product Informaton PRG More flexble More powerful. Slm. PRG unversal grpper 180 radal grpper wth powerful 1-shft slotted lnk gear and oval pston. Feld of applcaton For areas of applcaton whch, n addton
Terminating Head
 Termnatng Head 58246-1 Instructon Sheet for MTA- 100 Receptacle Connectors 408-6929 Usng Dscrete Wre 07 APR 11 Locatng Pawl Feed Slde Tool Base Wre Inserter Adjuster (Inserton Rod) Mass Termnaton Assembly
Peak Field Approximation of Shock Wave Overpressure Based on Sparse Data
 Peak Feld Approxmaton of Shock Wave Overpressure Based on Sparse Data Yongl Zhang, Taln Han, Yuqun Chen, Enku Zhang, and Xuan Lu Abstract To obtan the shock wave feld dstrbuton, two knds of calber weapons
M.H.Ahn, K.J.Lee Korea Advance Institute of Science and Technology 335 Gwahak-ro, Yuseong-gu, Daejeon , Republic of Korea
 The Methodology on Exposure Dose Evaluaton Modelng Related to Arbtrary Accdent n the Temporary Storage Faclty for Low and Intermedate Level Waste - 9133 M.H.Ahn, K.J.Lee Korea Advance Insttute of Scence
Degassing of deep groundwater in fractured rock
 WATER RESOURCES RESEARCH, VOL. 36, NO. 9, PAGES 2477-2492, SEPTEMBER 2000 Degassng of deep groundwater n fractured rock around boreholes and drfts Jerker Jarsj6 and Georga Destoun Dvson of Water Resources
JIMAR ANNUAL REPORT FOR FY 2001 (Project ) Project Title: Analyzing the Technical and Economic Structure of Hawaii s Pelagic Fishery
 Project Title: Analyzing the Technical and Economic Structure of Hawaii s Pelagic Fishery") 1 JIMAR ANNUAL REPORT FOR FY 2001 (Project 653540) P.I. Name: PngSun Leung, Khem Sharma and Sam Pooley Project Research Assstant: Naresh Pradhan Project Ttle: Analyzng the Techncal and Economc Structure
1 JIMAR ANNUAL REPORT FOR FY 2001 (Project 653540) P.I. Name: PngSun Leung, Khem Sharma and Sam Pooley Project Research Assstant: Naresh Pradhan Project Ttle: Analyzng the Techncal and Economc Structure
Product Information. Long-stroke gripper PSH 42
 Product Informaton PSH 42 PSH Compact. Flexble. Fully encapsulated. PSH long-stroke grpper 2-fnger parallel grpper wth long jaw stroke and drt-resstant round gudance Feld of applcaton n contamnated work
Canadian Journal of Fisheries and Aquatic Sciences. Seasonal and Spatial Patterns of Growth of Rainbow Trout in the Colorado River in Grand Canyon, AZ
 Seasonal and Spatal Patterns of Growth of Ranbow Trout n the Colorado Rver n Grand Canyon, AZ Journal: Manuscrpt ID cjfas-15-2.r1 Manuscrpt Type: Artcle Date Submtted by the Author: 23-Jun-15 Complete
Seabed type clustering using single-beam echo sounder time series data
 SELECTED TOPICS n POWER SYSTEMS and REMOTE SENSING Seabed type clusterng usng sngle-beam echo sounder tme seres data PETER HUNG, SEÁN MCLOONE Department of Electronc Engneerng, StratAG Natonal Unversty
Product Information. Long-stroke gripper PFH-mini
 Product Informaton PFH-mn PFH-mn Loadable. Flexble. Relable. PFH-klen long-stroke grpper 2-fnger parallel grpper wth large jaw stroke for large parts and / or a broad range of parts Feld of applcaton clean
Aerator Performance in Reducing Phenomenon of Cavitation in Supercritical Flow in Steep Channel Bed
 Engneerng Internatonal Conference UNNES Conservaton 13 Proceedng Aerator Performance n Reducng Phenomenon of Cavtaton n Supercrtcal Flow n Steep Channel Bed Yer Sutopo 1, Bud Wgnyosukarto, Istarto, dan
BETHANY TAX INCREMENT FINANCING DISTRICT NO. 1 NOTICE OF TWO PUBLIC HEARINGS
 BETHANY TAX NCREMENT FNANCNG DSTRCT NO. 1 NOTCE OF TWO PUBLC HEARNGS On December 12, 2017 at 7:00 P.M., at Bethany Cty Hall, 6700 N.W. 36th Street, Bethany, Oklahoma, the Cty Councl of the Cty of Bethany
Report No. FHWA/LA.13/508. University of Louisiana at Lafayette. Department of Civil and Environmental Engineering
 TECHNICAL REPORT STANDARD PAGE Report No. FHWA/LA.13/508 4. Ttle and Subttle A Comprehensve Study on Pavement Edge Lne Implementaton 7. Author(s) Xaoduan Sun, Ph.D., P.E. Subassh Das 9. Performng Organzaton
The impact of foreign players on international football performance
 MPRA Munch Personal RePEc Archve The mpact of foregn players on nternatonal football performance Orhan Karaca Ekonomst Magazne, Research Department October 008 Onlne at http://mpra.ub.un-muenchen.de/11064/
A Climbing Robot based on Under Pressure Adhesion for the Inspection of Concrete Walls
 A Clmbng Robot based on Under Pressure Adheson for the Inspecton of Concrete Walls K. Berns, C. Hllenbrand, Robotcs Research Lab, Department of Computer Scence, Techncal Unversty of Kaserslautern P.O.
Journal of Chemical and Pharmaceutical Research, 2014, 6(5): Research Article
: Research Article") Avalable onlne www.jocpr.com Journal of Chemcal and Pharmaceutcal Research, 204, 6(5): 520-526 Research Artcle ISS : 0975-7384 CODE(USA) : JCPRC5 Dgtal Electrcal Resstance Tomography System and ts Expermental
Avalable onlne www.jocpr.com Journal of Chemcal and Pharmaceutcal Research, 204, 6(5): 520-526 Research Artcle ISS : 0975-7384 CODE(USA) : JCPRC5 Dgtal Electrcal Resstance Tomography System and ts Expermental
Aalborg Universitet. Published in: 9th ewtec Publication date: Document Version Publisher's PDF, also known as Version of record
 Aalborg Unverstet Predctablty of the Power Output of Three Wave Energy Technologes n the Dansh orth Sea Chozas, Jula Fernandez; Jensen,. E. Helstrup; Sørensen, H. C.; Kofoed, Jens Peter; Kabuth, Alna Krstn
Availability assessment of a raw gas re-injection plant for the production of oil and gas. Carlo Michelassi, Giacomo Monaci
 16 th IMEKO TC4 Symposum Explorng New Fronters of Instrumentaton and Methods for Electrcal and Electronc Measurements Avalablty assessment of a raw gas re-njecton plant for the producton of ol and gas
Proceedings of the ASME nd International Conference on Ocean, Offshore and Arctic Engineering OMAE2013 June 9-14, 2013, Nantes, France
 Proceedngs of the ASME nd Internatonal Conference on Ocean, Offshore and Arctc Engneerng OMAE June 9-,, Nantes, France OMAE-6 ROLL DAMPING COEFFICIENTS ASSESSMENT AND COMPARISON FOR ROUND BILGE AND HARD
1.1 Noise maps: initial situations. Rating environmental noise on the basis of noise maps. Written by Henk M.E. Miedema TNO Hieronymus C.
 TIP4-CT-2005-516420 Page 1 of 34 DELIVERABLE D 1.5 CONTRACT N PROJECT N ACRONYM TITLE TIP4-CT-2005-516420 FP6-516420 QCITY Quet Cty Transport Subproject 1 Nose mappng & modellng Work Package 1.1 Nose maps:
PERFORMANCE AND COMPENSATION ON THE EUROPEAN PGA TOUR: A STATISTICAL ANALYSIS
 PERFORMANCE AND COMPENSATION ON THE EUROPEAN PGA TOUR: A STATISTICAL ANALYSIS C. Barry Pftzner and Chrs Spence, Department of Economcs/Busness, Randolph-Macon College, Ashland, VA, bpftzne@rmc.edu, cspence@rmc.edu
Cross-shore Structure of Longshore Currents during Duck94
 CHAPTER 283 Cross-shore Structure of Longshore Currents durng Duck94 Falk Feddersen 1, R.T. Guza 2, Steve Elgar 3, and T.H.C Herbers 4 Abstract The cross-shore structure of the mean longshore current on
Modeling the Performance of a Baseball Player's Offensive Production
 Brgham Young Unversty BYU ScholarsArchve All Theses and Dssertatons 006-03-09 Modelng the Performance of a Baseball Player's Offensve Producton Mchael Ross Smth Brgham Young Unversty - Provo Follow ths
DRAFT FOR PUBLIC CONSULTATION INTERCONNECTION AGREEMENT v.2.0 FOR IP KULATA/SIDIROKASTRO DEFINITIONS, BUSINESS RULES, EXCEPTIONAL EVENT
 RAFT FOR PUBLIC CONSULTATION INTERCONNECTION AGREEMENT v.2.0 FOR IP KULATA/SIIROKASTRO EFINITIONS, BUSINESS RULES, EXCEPTIONAL EVENT ARTICLE 1: EFINITIONS All terms of the INTERCONNECTION AGREEMENT shall
Instantaneous Current Prediction for Naval Operations
 Instantaneous Current Predcton for Naval Operatons Peter C. Chu Naval Ocean Analyss and Predcton Laboratory, Department of Oceanography Naval Postgraduate School, Monterey, CA 93943 Albert E. Armstrong
Product Information. Gripper for small components MPG 32
 Product Informaton MPG 32 MPG Precse. Compact. Relable. MPG grpper for small components 2-fnger parallel grpper wth smooth roller gudes of the base jaws Feld of applcaton Grppng and movng of small to medum-szed
English Premier League (EPL) Soccer Matches Prediction using An Adaptive Neuro-Fuzzy Inference System (ANFIS) for
 Soccer Matches Prediction using An Adaptive Neuro-Fuzzy Inference System (ANFIS) for") Englsh Premer League (EPL) Soccer Matches Predcton usng An Adaptve Neuro-Fuzzy Inference System (ANFIS) for Amadn, F. I 1 and Ob, J.C. 2 Department of Computer Scence, Unversty of Benn, Benn Cty. Ngera.
Englsh Premer League (EPL) Soccer Matches Predcton usng An Adaptve Neuro-Fuzzy Inference System (ANFIS) for Amadn, F. I 1 and Ob, J.C. 2 Department of Computer Scence, Unversty of Benn, Benn Cty. Ngera.
Over Steep Topography
 JOURNAL OF GEOPHYSCAL RESEARCH, VOL. 88, NO. C1, PAGES 743-750, JANUARY 20, 1983 On the Formaton of Surface to Bottom Fronts Over Steep Topography Y. HSUEH AND BENOT CUSHMAN-ROSN! Department of Oceanography,
Effect of gas properties on the characteristics of a bubble column equipped with fine porous sparger.
 ICFM-16-9 th Internatonal Conference on Multphase Flow May nd -7 th, 16, Frenze, Italy Effect of gas propertes on the characterstcs of a bubble column equpped wth fne porous sparger. Aradn P. Chatzdafn,
Product Information. Gripper for small components MPG 50
 Product Informaton MPG 50 MPG Precse. Compact. Relable. MPG grpper for small components 2-fnger parallel grpper wth smooth roller gudes of the base jaws Feld of applcaton Grppng and movng of small to medum-szed
Product Information. Universal gripper PGN-plus 80
 Product Informaton PGN-plus 80 PGN-plus Relable. Robust. Flexble. PGN-plus unversal grpper Unversal 2-Fnger Parallel Grpper wth large grppng force and hgh maxmum moments due to mult-tooth gudance. Feld
Decomposition guide Technical report on decomposition
 June 2013 Decomposton gude Techncal report on decomposton Erasmus MC Start date of project: 20 Aprl 2012 Duraton: 36 months 1 Table of contents Abstract... 4 Acknowledgements... 5 Introducton... 6 Part
Aalborg Universitet. Published in: 9th ewtec Publication date: Document Version Accepted author manuscript, peer reviewed version
 Aalborg Unverstet Predctablty of the Power Output of Three Wave Energy Technologes n the Dansh orth Sea Chozas, Jula Fernandez; Jensen,. E. Helstrup; Sørensen, H. C.; Kofoed, Jens Peter; Kabuth, Alna Krstn
Evaluating Rent Dissipation in the Spanish Football Industry *
 Evaluatng Rent Dsspaton n the Spansh Football Industry * Gudo Ascar Dp. d Economa Poltca e Metod Quanttatv Va S. Felce 5 27100 Pava, Italy Tel: (+39) 0382 506211 Fax: (+39) 0382 304226 gascar@eco.unpv.t
An intro to PCA: Edge Orientation Estimation. Lecture #09 February 15 th, 2013
 An ntro to PCA: Edge Orentaton Estmaton Lecture #09 February 15 th, 2013 Revew: Edges Convoluton wth an edge mask estmates the partal dervatves of the mage surface. The Sobel edge masks are: " #!1 0 1!2
Driver s Decision Model at an Onset of Amber Period at Signalised Intersections
 Probablty to stop 1.00 0.90 0.80 0.70 0.60 0.40 0.30 0-10 10-15 15-20 20-25 25-30 30-35 35-40 40-45 45-50 50-55 55-60 60-65 65-70 70-75 75-80 80-85 85-90 90-95 95-100 1st veh n platoon 2nd veh n platoon
Response based sea state estimation for onboard DSS Safe and Efficient Marine Operations
 Response based sea state estmaton for onboard DSS Safe and Effcent Marne Operatons Ulrk Dam Nelsen AMOS Workshop, NTNU, Trondhem, 13 th and 14 th November, 2014 Contents Introducton: Context Montorng and
Sensitivity of multiangle imaging to aerosol optical depth and to pure-particle size distribution and composition over ocean
 JOURNAL OF GEOPHYSCAL RESEARCH, VOL. 103, NO. D24, PAGES 32,195-32,213, DECEMBER 27, 1998 Senstvty of multangle magng to aerosol optcal depth and to pure-partcle sze dstrbuton and composton over ocean
VOLUME TRENDS NOVEMBER 1988 TRAVEL ON ALL ROADS AND STREETS IS FOR NOVEMBER 1988 AS COMPARED UP BY 3.4 PERCENT TO NOVEMBER 1987.
 VOLUME U.S. Department of Transportation Federal Highway TRENDS NOVEMBER 1988 TRAVEL ON ALL ROADS AND STREETS S FOR NOVEMBER 1988 AS COMPARED UP BY 3.4 PERCENT TO NOVEMBER 1987. rr ALL DATA FOR THS MONTH
The fish community of Rat Cove, Otsego Lake, sumn,er 1997
 74 The fsh communty of Rat Cove, Otsego Lake, sumn,er 1997 Mcah ngalls ABSTRACT n Rat cove thrteen speces of fsh were documented durng the summer of 1997: alewfe (Alosa pseudoharengus), yellow perch (Percaflavenscens),
Crash Frequency and Severity Modeling Using Clustered Data from Washington State
 Proceedngs of the IEEE ITSC 2006 2006 IEEE Intellgent Transportaton Systems Conference Toronto, Canada, September 17-20, 2006 WB7.1 Crash Frequency and Severty Modelng Usng Clustered Data from Washngton
RCBC Newsletter. September Richmond County Baseball Club. Inside this issue: Johnny Ray Memorial Classic. RCBC on You Tube
 September 2016 Rchmond County Baseball Club 1400 Travs Ave. Staten Island, NY 10314 RCBC Newsletter If you have any nterestng nfo or news you would lke ncluded n a future newsletter, please emal to jm@rcbclub.com.
Underground Natural Gas Storage
 CHAPTER 8 Underground Natural Gas Storage 8.1 Introducton In the Unted States and a few other countres, the underground storage of natural gas has become ncreasngly mportant after World War II. The obvous
Equilibrium or Simple Rule at Wimbledon? An Empirical Study
 Equlbrum or Smple Rule at Wmbledon? An Emprcal Study Shh-Hsun Hsu, Chen-Yng Huang and Cheng-Tao Tang Revson: March 2004 Abstract We follow Walker and Wooders (200) emprcal analyss to collect and study
CS 2750 Machine Learning. Lecture 4. Density estimation. CS 2750 Machine Learning. Announcements
 CS 75 Machne Learnng Lecture 4 ensty estmaton Mlos Hauskrecht mlos@cs.ptt.edu 539 Sennott Square CS 75 Machne Learnng Announcements Homework ue on Wednesday before the class Reports: hand n before the
A NEW METHOD FOR IMPROVING SCATTEROMETER WIND QUALITY CONTROL
 A NEW METHOD FOR IMPROVING SCATTEROMETER WIND QUALITY CONTROL M. Portabella (, A. Stoffelen (, A. Verhoef (, J. Verspeek ( ( Undad de Tecnología Marna CSIC, Pg. Marítm Barceloneta 37-9, 3 Barcelona, Span
Analysis of Hold Time Models for Total Flooding Clean Extinguishing Agents
 Analyss of old Tme Models for Total Floodng Clean Extngushng Agents Todd M. etrck, Al S. Rangwala Department of Fre Protecton Engneerng Worcester Polytechnc Insttute Worcester, MA 69-8 Abstract Ths study
Methodology for ACT WorkKeys as a Predictor of Worker Productivity
 Methodology for ACT WorkKeys as a Predctor of Worker Productvty The analyss examned the predctve potental of ACT WorkKeys wth regard to two elements. The frst s tme to employment. People takng WorkKeys
RADIAL STIFFNESS OF A BICYCLE WHEEL AN ANALYTICAL STUDY
 ADIAL TIFFE OF A BICYCLE WHEEL - A AALYTICAL TUDY José aría ínguez Dpto. de Físca Aplcada II Facultad de Cenca y Tecnología Unversdad del País Vasco Aptdo. 644 488 Blbao PAI Emal: osemara.mnguez@ehu.es
The woman in Figure 10 is taking a deep breath. This action helps
 3.2 The Gas Laws Secton 3.2 1 FOCUS Key Concepts What causes gas pressure n a closed contaner? What factors affect gas pressure? How are the temperature, volume, and pressure of a gas related? Vocabulary
Numerical Study of Occupants Evacuation from a Room for Requirements in Codes
 Numercal Study of Occupants Evacuaton from a Room for Requrements n Codes HL MU JH SUN Unversty of Scence and Technology of Chna State Key Laboratory of Fre Scence Hefe 2300326, CHINA muhl@mal.ustc.edu.cn
ITRS 2013 Silicon Platforms + Virtual Platforms = An explosion in SoC design by Gary Smith
 ITRS 2013 Slcon Platforms + Vrtual Platforms = An exploson n SoC desgn by Gary Smth 2013 2013 Gary Gary Smth Smth EDA, EDA, Inc. Inc. All All Rghts Rghts Reserved. Reserved. 1 The Fve Desgn Constrants
Geophysical validation of NSCAT winds using atmospheric data and analyses
 JOURNAL OF GEOPHYSCAL RESEARCH, VOL. 104, NO. C5, PAGES 11,405-11,424, MAY 15, 1999 Geophyscal valdaton of NSCAT wnds usng atmospherc data and analyses R. Atlas, 1 S.C. Bloom, 2 R. N. Hoffman, 3 E. Brn,
Product Information. Universal gripper PZN-plus 40
 Product Informaton PZN-plus 40 PZN-plus Relable. Robust. Flexble. PZN-plus unversal grpper Unversal 3-Fnger Centrc Grpper wth hgh grppng force and maxmum moments due to mult-tooth gudance Feld of applcaton
CENTRAL BLOOD PRESSURE AND HEART OUTPUT IN SURFACED AND SUBMERGED FROGS
 J. Exp. Btol. (965), 42, 339-357 339 Wth text-fgura Prnted n Great Brtan CENTRAL BLOOD PRESSURE AND HEART OUTPUT IN SURFACED AND SUBMERGED FROGS BY G. SHELTON* AND D. R. JONES* Department of Zoology, The
Investigating sailing styles and boat set-up on the performance of a hydrofoiling Moth dinghy
 Investgatng salng styles and boat set-up on the performance of a hydrofolng Moth dnghy Abstract M W Fndlay, S R Turnock Flud-Structure Interactons Research Group, School of Engneerng Scences, Unversty
WORKING PAPER SERIES Long-term Competitive Balance under UEFA Financial Fair Play Regulations Markus Sass Working Paper No. 5/2012
 WORKING PAPER SERIES Impressum ( 5 TMG) Herausgeber: Otto-von-Guercke-Unverstät Magdeburg Fakultät für Wrtschaftswssenschaft Der Dekan Verantwortlch für dese Ausgabe: Otto-von-Guercke-Unverstät Magdeburg
Product Information. Universal gripper PGN-plus 160
 Product Informaton PGN-plus 160 PGN-plus Relable. Robust. Flexble. PGN-plus unversal grpper Unversal 2-Fnger Parallel Grpper wth large grppng force and hgh maxmum moments due to mult-tooth gudance. Feld
ω, would be a JONSWAP
 NUMERICAL PSEUDO RANDOM SIMULATION OF SAR SEA AND WIND RESPONSE Eugeno Puglese Carratell (1,), Fabo Dentale (1), and Ferdnando Reale () (1) Unversty of Salerno, Va Ponte Don Melllo, 8484 Fscano, Italy
Pedestrian Facilities Planning on Tianjin New Area program
 Avalable onlne at www.scencedrect.com ScenceDrect Proceda - Socal and Behavoral Scenc es 96 ( 2013 ) 683 692 13th COTA Internatonal Conference of Transportaton Professonals (CICTP 2013) Pedestran Facltes
Product Information. Long-stroke gripper PHL
 Product Informaton PHL PHL Flexble. Precse. Powerful. PHL long-stroke grpper 2-fnger parallel grpper wth large jaw stroke for large parts and / or a broad range of parts Feld of applcaton Optmum standard
Spherical solutions of an underwater explosion bubble
 89 Sphercal solutons of an underwater exploson bubble Andrew B. Wardlaw, Jr. Naval Surface Warfare Center, Code 423, Indan Head Dvson, Indan Head, MD 20640-5035, USA E-mal: 423@uwtech.h.navy.ml Hans U.
For models: 660 EF/EFO
 Installaton Instructons Gas converson kts For models: 660 EF/EFO Part no. 660NGKIT/660LPKIT Warnng: Ths kt must be nstalled by a qualfed nstaller n accordance wth these nstructons and all applcable codes
A comparison study on the deck house shape of high speed planing crafts for air resistance reduction
 csnak, 2014 Int. J. Nav. Archt. Ocean Eng. (2014) 6:867~875 http://dx.do.org/10.2478/ijnaoe-2013-0218 pissn: 2092-6782, eissn: 2092-6790 A comparson study on the deck house shape of hgh speed planng crafts
Product Information. Gripper for small components MPG-plus 40
 Product Informaton MPG-plus 40 MPG-plus More powerful. Faster. Longer fngers. MPG-plus grpper for small components 2-fnger parallel grpper wth smooth roller gudes of the base jaws Feld of applcaton Grppng
SOME OBSERVATIONS ON THE CO-ORDINATION DIAPHRAGMATIC AND RIB MOVEMENT IN RESPIRATION
 Thorax (199),, 65. SOME OBSERVATONS ON THE CO-ORDNATON DAPHRAGMATC AND RB MOVEMENT N RESPRATON BY HERBERT HERXHEMER Surgcal Unt, Unversty College Hosptal, London Daphragm and ntercostal muscles together
Product Information. Gripper for small components MPG 80
 Product Informaton MPG 80 MPG Precse. Compact. Relable. MPG grpper for small components 2-fnger parallel grpper wth smooth roller gudes of the base jaws Feld of applcaton Grppng and movng of small to medum-szed
Stability Analysis for the Design of 5000-Tonnes Offshore Work Barge
 Internatonal Journal of Engneerng and echnology Volume No. 9, September, Stablty Analyss for the Desgn of 5-onnes Offshore Work arge Ntonye Samson a, Ezenwa Ogbonnaya b, uve Ejabefo a a Department of arne
Comparative Deterministic and Probabilistic Analysis of Two Unsaturated Soil Slope Models after Rainfall Infiltration
 Jordan Journal of Cvl Engneerng, Volume 11, No. 1, 2017 Comparatve Determnstc and Probablstc Analyss of Two Unsaturated Sol Slope Models after Ranfall Infltraton Manoj Kr. Sahs 1) and Partha Pratm Bswas
Mass Transfer of CO 2 into Water and Surfactant Solutions
 Mass Transfer of CO 2 nto Water and Surfactant Solutons Rouhollah Farajzadeh, Al Barat, Harm A. Dell, Johannes Brunng, Pacell L.J. Ztha Delft Unversty of Technology, Department of Geotechnology, Mjnbouwstraat