Modeling, Simulation, and Testing of Constant Tension System on Winch
|
|
|
- Jeffry James
- 6 years ago
- Views:
Transcription
1 Modeling, Simulation, and Testing of Constant Tension System on Winch Henrik Engedal Per Magne Egelid Supervisor Morten Kjeld Ebbesen Øyvind Solli University of Agder, 2011 Faculty of Engineering and Science Department of Technology
2 2
3 Preface This master thesis has been an important experience not only working with the thesis, but also cooperating closely with the business life. The project can be divided into two sections consisting of a theoretical part and a practical part. Because of a very short deadline for the practical part the cooperation with MacGregor Hydramarine employees was very good and important. This really showed the importance of organization between the different departments in a company The possibility of working with a system, and later having the opportunity to test the system at a later stage in the master thesis, gave the possibility to verify the similarity between the theoretical and practical part. A list of symbols is found at page 88. A special thanks to the people that have participated in this project: Supervisors: Morten Kjeld Ebbesen, UIA Øyvind Solli, MacGregor Hydramarine Assisting supervisor: Michael Rygaard Hansen, UIA Assisting report writing: Anne Muller, UIA MacGregor Hydramarine: Øyvind Nodenes, production manager Service personnel, production May Paulsen, electro Eivind Engenes, software Geir Andre Iversen, hydraulic Henrik Engedal and Per Magne Egelid 3
4 Abstract Here we present a dynamical simulation of a hydraulic constant tension [CT] system in SimulationX. The purpose of the simulation is to check the similarity of the simulated system and the real system. The real system is a 10 ton winch with CT function where the results from this test are compared with the results of the simulated system. We have successfully tested the winch system with CT function. This was done using pressure transmitters and flow sensors placed on the hydraulic motor blocks in combination with a load cell and a winch encoder to measure its behavior. All data from these sensors were logged and saved to later be compared with the simulated system. Our method to simulate the model in SimulationX proved to be a successful approach to achieve a real simulation of the CT system; this is because of the variable throttle valve function in SimulationX. With this valve function we control the system behavior by adding equations to the stroke signal of the variable throttle valve. Our main result of the CT system is of great significance to all users working with hydraulic operated systems and dynamical modeling. Because of the variable throttle valve function in SimulationX it is possible to do complex dynamical models of advanced hydraulic systems such as CT systems. This approach also helps to understand CT systems in depth. Keywords: Constant tension [CT], simulation, force difference, CVG compensator, constant tension adjust valve [CT adjust]. 4
5 Contents 1 Introduction System information Pressure Relief valve RVIA-LCN Technical information RVIA-LCN Operation modes of RVIA-LCN Pilot operated valve in closed position Pilot operated valve in open position Constant Tension pressure relief valve Technical information BVI PM Control Valve Group Control Valve Group Technical data Control Valve Group main spool Control Valve Group compensator Operating principle of the Control Valve Group System behavior in constant tension Hydraulic flow diagram Normal Hoisting and Lowering operation Constant tension operation Case 1: Load falling in Constant Tension mode Case 2: Load hoisting in Constant Tension mode Hydraulic Winch Calculations Winch calculation parameters Mechanical winch calculations Constant Tension adjust valve setting Hose and pipe sizing Wire and load calculations Force analysis of the mechanical load situation Buoyancy and drag forces The input heave signal of the drum and wire force Servo valve dynamics, Control Valve Group Test preparations of the system Mechanical winch system Function of the mechanical system Hydraulic system design Test measurements
6 5.3 Electrical system and the Programmable Logic Controller Power supply to the programmable logic controller Programmable Logic Controller CPU Load cell in the center of the upper wire sheave Valve Controllers, PR-card Winch encoder, technical information Joystick for controlling the winch Operation procedure for the winch Purpose of the operation procedure Tools needed to operate the Constant Tension system Pre start-up checks Testing procedure of the system Operation of the hydraulic system and control system Function of the hydraulic power unit Control Valve Group information Technical information about the CVG spool Technical information about the CVG compensator SimulationX modeling Dynamical modeling of the system Model of the mechanical system Linear mechanics information Rotational mechanics information Model of the mechanical system Models of the Hydraulic system Working principle of the Control Valve Group Compensator Compensator analysis at a flow of Q=382 l/min Compensator analysis at a flow of Q=1000 l/min SimulationX model of the motor block Hose and pipe modeling Results from the tested system Results from the 3 ton test Results from the 5 ton test Results from the 7 ton test Test results discussion Making use of the test results in SimulationX Modifications of the simulation model Comparing Simulation and Test Results
7 8.1 Simulation results compared to physical results Model dynamics discussion Conclusion List of symbols Bibliography List of figures List of tables
8 8
9 MAS-500: Master Thesis. 1 Introduction Constant tension [CT] function on hydraulic winches is used in safe lifting operations in maritime environments. The mostt common use of CT is lifting a load from vessel to vessel, or raising and lowering a lifeboat from a seagoing vessel to the sea in rough weather ([1]). With CT function it is possible to maintain a constant tension in the wire wire independent of heave. This is a very useful function in a hydraulic system and is often referred to a wave compensation mode. The system changes from a normal hoisting mode to a constant tension mode by the operator of the CT system. This switching of mode is keeping tension in the wire to avoid any slack and is pre-set pre by a constant tension adjust valve [CT adjust] adjust ([2]). The main problem to solve is to develop a dynamical model in SimulationX and compare it with the real system. ystem. The real system is a practical test of the CT system to see its performance. Another problem that is supposed to be investigated in the CT system is the force difference. difference This is the difference in force between the actual wire force and the force required required to pay out or pull in wire to the winch. This master thesis is stated together with MacGregor Hydramarine. They want to know how good a dynamical model of the CT system in SimulationX can be, and compare it with a real system performed by a practical cal test. It is then possible to see how large the force difference in the CT system actually is. Solving these topics demands demand a good knowledge about the different components/ valves in the system. All valves have their systematic place in the hydraulic flow flow diagram and their special task to execute. Some of these valves are not standardized in the SimulationX library, and the challenge in this part is to model these valves to work as intended. The strategy is to achieve knowledge of all the different valves val by studying the datasheets from the factories that produce them. From this information sub models in SimulationX is simulated to show the valves behavior.. The results of these models are being compared with the datasheets from the factory to verify the similarity.. Then at a later stage a practical test of the CT system is executed and the results from this test are being compared with the results from the simulated model. To perform the practical test a pre-start start up procedure and a test procedure is written, tten, this is important to ensure that no step is missing when starting the winch. This master thesis provides a total understanding of how the theoretical part works together with a practical part. This work and the possibility to cooperate with a professional professional company were of importance when choosing a master thesis. 9
10 10
11 2 System information This chapter describes the most important valves in the system. The valve that is given the most attention is the RVIA-LCN valve in fig 2.1 shown as valve number 2 in the motor block. In section 2.1 a detailed description with figures are given that allows the reader to see how this valve works in normal position with valve number 8 closed, and in constant tension mode with valve number 8 in open position, fig 2.1. Further a brief description of the constant tension adjustment valve [CT adjust] is given since this one is controlling the pressure setting of the constant tension system, fig 2.3. The CVG main control valve is also described with its specifications. The CT on/off valve is the activation for the constant tension operation and is given an electrical signal when it is operated, but this is not described in detail in this report, fig 2.3. In this chapter several sources were used to obtain a better understanding of the system ([3]), ([4]), ([5]). 2.1 Pressure Relief valve RVIA-LCN The RVIA-LCN valve number 2 on fig 2.1 is an important valve together with the CT adjust valve when the winch is running in constant tension mode. Fig 2.1 shows the main symbol to the left with the placing inside the motor block to the right Fig 2.1 Main symbol of the RVIA-LCN and the placing in the motor block 11
12 The cross section of the RVIA-LCN shows that the valve has three ports; inlet port (1), outlet port (2) and a vent port (3), fig 2.2. When the pressure at the inlet port reaches the setting of the spring, the valve starts opening to outlet port. The vent port makes the valve suitable for remote control by other pilot or 2- way valves as valve number 8, fig 2.1. The spring force and the vent pressure are closing the RVIA-LCN valve. The cross-section of this valve with the different elements, flows and operating pressures helps understanding this valve a lot easier, fig 2.2. Port 1 - Inlet Port 2 - Outlet Port 3 - Vent Fig 2.2 Cross section of the RVIA-LCN valve with its connections and different elements Technical information RVIA-LCN Model number: RV I A - L C N RV I A L C Tab 2.1 Technical information the RVIA-LCN Spool leakage between port 1 and port 2 at 70 bar. Response time Port 3 pilot flow Valve type 480 l/min Vented relief port Standard screw adjustment Operating pressure bar l/min 10 ms l/min Tab 2.1 shows the information regarding this valve, with the most important values as operating pressure, flow and spool leakage. 12
13 2.1.2 Operation modes of RVIA-LCN The following section shows how the RVIA-LCN valve is working when the vent port 3 is remote controlled by a 2-way pilot-to-open valve in closed and in open position. RVIA-LCN is actually a 2- stage pressure valve and can be operated at two different pressure levels by controlling the pilot operated 2-way valve DKDS-XHN. With the 2-way valve closed the system has max operating pressure at 250 bar. With the 2-way valve open it is possible to relieve the setting of the valve below the original setting to a pressure controlled by CT adjust valve BVI PM22. The system is not operating in constant tension mode before CT on/off valve is activated, fig 2.3. (Appendix B) Load holding valve RVIA-LCN DKDS-XHN Fig 2.3 Hydraulic flow diagram showing the working principle of the RVIA-LCN 13
14 2.1.3 Pilot operated valve in closed position In normal hoisting and lowering mode the RVIA-LCN is in closed position and has the same operating pressure in port 1 and port 3, fig 2.4. In closed position no pressure is acting on the pilot port PIL2 to activate the 2-way valve DKDS-XHN since CT on/off is closed, fig 2.3. The 2- way pilot operated valve has following ports, tab 2.2: Tab 2.2 Overview of the ports in the 2-way valve Port 1 Port 2 Port 3 Port 4 Inlet Outlet Pilot port Drain port Fig 2.4 Cross section view with RVIA-LCN with the pilot operated valve in closed position When the system is at maximum pressure the valve does not open before the pressure at the inlet port 1 reaches the setting of the spring force (pilot spring), fig 2.2. The RVIA valve opens because of the differential pressure across the piston orifice. The spool back pressure and the vent pressure at port 3 causes the pilot stage to open leaving a throttling flow to tank port 2. When the spool starts opening, the oil flows from inlet port 1 to tank port 2. The area at inlet port means the valve opens at the set pressure of the main spring. The valve does not close before the pressure at port 1 is equal or below the back pressure and the valve has regained the balance again, fig 2.5. The pilot spring has a crack pressure of 320 bar, this opens if the pressure rises above its setting. The back pressure at the main spring is then relieved and oil flows through the throttle area to tank. The main spring (slack spring) is then opening, allowing oil to flow from inlet port 1 to tank port 2. When pressure in port 1 and back pressure is equal or below the crack pressure the pilot spring close, which leads to an increase in the back pressure. When this pressure plus the main spring setting exceeds the inlet port pressure, the main spool closes. The main spring is a slack spring with an assumed crack pressure between 5-12 bar. 14
15 3 2 1 Fig 2.5 Cross section view of the RVIA-LCN with the pilot-to-open valve in closed position Pilot operated valve in open position With the 2-way valve in open position it is possible to remote control the RVIA-LCN valve to a pressure below the original value, in this case the pressure set by the CT adjust valve, fig 2.3. With the 2-way valve in open position the area behind the piston is vented at port 3. In constant tension mode when the winch is pulling in wire the connection from port 1 to port 2 is closed. When winch is paying out wire the only direction the oil flows is through the RVIA from port 1 to port 2 in a loop through the motor. The load is actual pulling wire of the winch. With the pilot operated vented relief valve used in combination with a 2-way valve connected on the vent port, it is possible to unload the pump at a low pressure with the 2-way valve open, or to achieve full system pressure with the 2-way valve closed Fig 2.6 Cross section view of the RVIA-LCN with the pilot-to-open valve in open position 15
16 2.2 Constant Tension pressure relief valve This is the external pressure relief valve used for the constant tension system. The set pressure on the valve has no influence on the system before the 2-way pilot operated valve DKDS-XHN is activated, fig 2.3. When pressure at port P exceeds the spring force the volume flows off to tank port T, fig 2.7. The force of the proportional solenoid counteracts the spring force, and the operating pressure decreases with an increasing solenoid current (inverse function). Fig 2.7 Pressure relief valve used for constant tension system with inverse function Technical information BVI PM22 Tab 2.3 shows the information regarding the CT adjust valve Model number: BVI PM22 Tab 2.3 Technical information of the constant tension adjust valve B Pressure relief valve V I Pilot operated Proportional inverse PM22 Screw in cartridge M22 x1.5 Volume flow Peak pressure: P max l/min 400 bar 16
17 2.3 Control Valve Group Fig 2.8 In CT mode the right position of the spool valve number 4 is activated Control Valve Group Technical data Technical information of the CVG, tab 2.4: Tab 2.4 Technical information CVG Operating pressure: P, A, B, LS External pilot pressure: Pp Nominal flow (5 bar pressure drop over one control edge) Response time 350 bar 45 bar Q=500 l/min 300 ms Control Valve Group main spool Tab 2.5 shows the technical information of the main spool number 4, fig 2.8: Tab 2.5 Technical information main spool Spool stroke 8 mm Overlap 1.5 mm Flow area over one control edge A f =0-375 mm 2 Spool diameter D=40 mm 17
18 2.3.3 Control Valve Group compensator The compensator number 54, fig 2.8 maintains a constant pressure drop over the main spool. If the pressure drop over the main spool is too low the compensator adjust to give more oil flow to the system. If the pressure drop over the main spool is too low it is closing to reduce the flow. Pressure drop is kept constant over the main spool to keep flow constant and independent of the load. The compensator spring is adjustable from 3-12 bar. The load sensing signal (LS-signal) from shuttle valve 7 helps the compensator spring to keep the compensator spool in an open position, fig 2.8. The pressure before the main spool port P is the closing force of the compensator Operating principle of the Control Valve Group When the proportional pilot valve, number 50 is operated, the main spool changes to one of the operating positions: port A or port B. If pressure in port A or port B exceeds the setting of the pressure relief valve, number 6, the compensator starts to operate as a pressure reduction valve. The compensator is then operating to keep pressure drop over main spool constant and flow constant and independent of load, fig
19 3 System behavior in constant tension Constant tension operation is a wave motion compensation intended for safe load handling operations. This chapter deals with CT system and how the oil flows in the system. The oil flows in two different directions through the motor blocks when operated in CT. How much oil that flows into the system is regulated by the pressure compensator in the CVG. The hydraulic flow diagram consists of two parts: the winch system and the main control system, fig 3.1and fig Hydraulic flow diagram Fig 3.1 Hydraulic flow diagram of the winch, motors and the motor blocks 19
20 Fig 3.2 Hydraulic flow diagram of the main control valve system 20
21 3.1.1 Normal Hoisting and Lowering operation In normal operation mode the 2-way valve DKDS-XHN inside the motor block is in closed position, fig 3.1. This means that port PIL2 is not activated since the CT on/off valve is closed, fig 3.2. CT on/off is not given an electrical signal to be activated. The amount of oil flow to the system is regulated by the compensator in the CVG. When activating the main spool the oil flows through the motor blocks, over the motors and back through the main spool to tank. In a hoisting mode the same oil also flows through the small restriction valve, number 9, fig 2.8, on the LSW line to port MX2 on the motor block. This flow and the spring setting are the closing forces of the RVIA-LCN. Since the flow does not move in this area the pressure is the same as the pressure needed to hoist the load, fig 3.1 and fig 3.2. This means that RVIA-LCN never opens during normal operation Constant tension operation To operate this system the load, e.g. a container on another vessel, is in position on the deck of the other vessel. To maintain a specific force in the wire, the CT on/off valve, fig 3.2, is given an electrical signal and switch the valve position from closed to open state. The oil flows from PP-port on the main control valve with a pressure of 45 bar. This signal is relieving the gear brakes, fig 3.1, and activates the pilot port on valve DKDS-XHN so that the valve switches from closed to open position, fig 3.1. Both ships are affected by wave motions, but with different phase. From the crane s point of view the payload will appear to be moving. Since the system is trying to maintain constant wire force it appears three possible system states, tab 3.1: Tab 3.1 Three possible system states in CT 1 Wire force larger than CT force 2 Wire force less than CT force 3 Wire force equal to CT force To go from one state to another, the constant tension setting force is set by the CT adjust valve, fig 3.2. If the pressure is too high the valve starts opening relieving the flow to tank. The CT force is controlled by the crack pressure in the RVIA-LCN. This crack pressure is in turn set by adjusting the crack pressure of the CT adjust valve. To determine this crack pressure, the pressure drop over the motor is found from the desired wire force. These calculations are shown in section Case 1: Load falling in Constant Tension mode Fig 3.3 Direction of the flow when load is falling down 21
22 In fig 3.3 the compensator closes for the pump flow and is only working as a replenishment of oil leakage. When the load is moving downwards in a wave the direction of the oil is marked with arrows. It is the constant tension adjust valve (CTA) that sets the pressure in the system. Oil flows in a loop through the motor and the RVIA-LCN. The load drives the winch forcing the motors to work as pumps and suck oil from the RVIA-LCN valve when the load is falling downward. Some of the oil also flows of to tank, by following port B on the motor block. This means that the oil flows in a loop inside the motor block until the load reaches another condition when it moves upward. 3.3 Case 2: Load hoisting in Constant Tension mode Fig 3.4 Direction of the flow when winch is hoisting the load When the winch is hoisting the load, oil flows in the direction as marked with arrows. The motor then acts as a motor again, being driven by the pump. When the load is at the top of the wave the system enters case 1 again, tab 3.1. If the CT adjust valve, fig 3.2, is set too high it is possible to lift the load above the surface. On the other hand if the CTA relief valve is set too low, the wire may get slack, leading to a jerk that may snap the wire when the motor finally kicks in. Neither of these scenarios are desirable. That is why it is important to test the CTA adjustment to be sure it is set on the correct pressure. The pump is giving all the flow to the system in this case, and the flow is leaving directly to tank from the motor. The flow that enters port MX1 comes from the left motor block so that both motors operate in constant tension, fig
23 4 Hydraulic Winch Calculations In chapters 2 and 3 it is explained how the constant tension system operates with most of its features involved. This chapter contains the hydraulic and mechanical calculation of the system. Some parameters are important to know before starting this work. For example how big a hydraulic power unit [HPU] is supposed to be used and what the winch parameters are like drum diameter and drum width. Further on is a mechanical situation of the CT mode set up to better describe the motion of the winch. Some important calculations are the constant tension pressure settings (CTA settings) at different wire forces. Some factors are needed to know to perform calculations of the system, these factors are given in, tab Winch calculation parameters. The pump used in this system is a variable displacement pump PV270, with a pump pressure set at p = 250 bar. The rotational speed of the el-motor is approximately n = 1488 rpm notified from the sign of the motor. Tab 4.1 Calculation of parameters given this system Safety factor S 5 Unit Payload m kg Wire diameter d 24 mm Drum diameter d 622 mm Drum width d l 650 mm Number of gear 2 pcs Gear ratio i 56.8 Mechanical efficiency gear η 0.94 Motor Displacement D 107 cm 3 /rev Mechanical efficiency motor η 0.90 Hydraulic efficiency motor η 0.96 The parameters in tab 4.1 are constants for the specific type of winch used in the test system Slip factor of the el-motor: slip = 1488 rpm = (4.1) 1500 rpm The max flow the pump delivers at n = 1488 rpm is calculated from the pump displacement. The displacement is found the following way: D = = (4.2) Angular velocity of the pump: = = = (4.3) 23
24 This gives the actual pump flow which the pump delivers with a volumetric efficiency for the pump of 0.95: Q = η D ω = Q = = 382 = (4.4) (4.5) The power delivered by the pump is: P = η =.. = W = 187 kw (4.6) A pump with displacement D = 270 delivers a flow of Q = 382 spool in the CVG can handle, which is a flow of Q = 580. This is less than the main Two motors take 50% of the oil flow each: Q, = Q 2 = 382 l min 2 = 191 l min (4.7) The motor speed is calculated by the motor displacement: This gives the following motor speed: D = ω = = = = 180 (4.8) (4.9) n = = = 1719 rpm (4.10) Because the pump flow is smaller than the CVG capacity, the speed of the winch reduces since the oil flow is controlling the speed of the winch. 4.2 Mechanical winch calculations This section introduces the calculations of the different parameters on each layer of the winch. The total number of layers on the winch is 6. Further calculation of the winch parameters gives an overview of what kind of pressures and forces that acts on the winch and in the winch system. When the winch is running in constant tension mode, the crane is only pulling of wire from the sixth layer, and is not switching between fifth and sixth layer. Calculations are done for the first 6 layers of the winch. 24
25 The following parameters are used for calculation of the system, tab 4.2: Tab 4.2 Parameters used for calculation Payload m pl kg Wire mass m w 2.70 kg/m Gravity g 9.81 m/s 2 Wire diameter d w 24 mm Drum diameter d dr 622 mm Drum width d l 650 mm Drum thickness t dr 40 mm The increase in diameter on each layer on the winch is: 2 0.8d = mm = 38.4 mm (4.11) Number of turns for each layer: n = = = 27 turns on winch (4.12) The pitch circle diameter (PCD) of the winch: PCD = (d + d ) d (4.13) Tab 4.3 Calculation of the pitch circle diameter (PCD) Layers PCD on each layer PCD Unit 1 PCD = 622mm + 24mm mm 2 PCD = 646mm mm mm 3 PCD = 684.4mm mm mm 4 PCD = 722.8mm mm mm 5 PCD = 761.2mm mm mm 6 PCD = 799.6mm mm mm Equation (4.13) shows the PCD of the winch and is used in equation (4.14) to calculate the wire length on each layer of the winch, tab
26 Length of wire on each layer: L = n π (PCD) (4.14) Tab 4.4 Calculation of the wire length on each layer Layers Length of wire for each layer L Unit π 646 mm L = π mm L = π mm L = π mm L = π mm L = π mm L = m 58.1 m 61.3 m 64.6 m 67.8 m 71.1 m The total length of wire: L = L (4.15) Tab 4.5 Calculation of the total length of wire used on the winch Layers Length of wire for each layer L Unit 1 L = L 54.8 m 2 L = L + L m 3 L = L + L + L m 4 L = L + L + L + L m 5 L = L + L + L m 6 L = L + L + L m Equation (4.15) calculates the total length of wire on the winch, tab 4.5. The wire mass is given by 2.70 ([6]). The total length of wire outside the winch were calculated to L = 50m, during testing of the system. The wire mass can be calculated as: Minimum breaking load of wire: m = m L = m = 135kg (4.16) MBL = (m + m )g S = (10 kg + 135kg) = (4.17) 26
27 The diameter of the wire is chosen from the datasheet with respect to the Minimum Breaking Load. The selected wire diameter of the system is then d = 24 mm. The drum moment is given by: T = m + m g (4.18) The total mass the system is lifting is the payload mass plus the mass of wire. Tab 4.6 Calculation of the winch moment Layers Drum moment T Unit 1 T = (10 kg + 135kg) 9.81 m 646 mm Nm s T = (10 kg + 135kg) 9.81 m mm Nm s 2 10 T = (10 kg + 135kg) 9.81 m mm Nm s 2 10 T = (10 kg + 135kg) 9.81 m mm Nm s 2 10 T = (10 kg + 135kg) 9.81 m mm Nm s 2 10 T = (10 kg + 135kg) 9.81 m mm Nm s 2 10 The gear moment is given by the following equation and is shown in, tab 4.7: T = (4.19) Tab 4.7 Calculation of the gear moment with respect to the number of gears Layers Gear moment T Unit 1 T = T Nm Nm = 2 η T = T Nm Nm = 2 η T = T Nm Nm = 2 η T = T Nm Nm = 2 η T = T Nm Nm = 2 η T = T Nm Nm = 2 η
28 The motor moment is given by equation (4.20) with the results shown in tab 4.8: T = (4.20) Tab 4.8 Calculation of the motor moment for each motor Layers Motor moment T Unit 1 T = T Nm 334 Nm = i η , T Nm T = = i η ,9 T = T Nm = i η ,9 T = T = T = T Nm = i η ,9 T Nm = i η ,9 T Nm = i η ,9 354 Nm 374 Nm 393 Nm 414 Nm 433 Nm The winch moment of inertia is telling how slow the winch is to accelerate about its axis. The higher the winch radius is including the wire, the more difficult it is to accelerate the winch since the moments of inertia is increasing for every layer. The winch has been calculated to a total mass of 923 kg. The outer radius is the half of the PCD and the inner radius is the diameter of the winch minus the thickness of the drum, set to 40mm, tab 4.9. The drum inertia in tab 4.9 is calculated by the equation: I = (m + m ) (R + R ) (4.21) Tab 4.9 Calculation of the winch inertia Layers Drum inertia for each layer I Unit 1 I = 1 2 (1023kg + 923kg) ((0.323m) + (0.271m) 173 kgm ) 2 I = 1 2 (1023kg + 923kg) ((0.342m) + (0.271m) 185 kgm ) 3 I = 1 2 (1023kg + 923kg) ((0.361m) + (0.271m) 198 kgm ) 4 I = 1 2 (1023kg + 923kg) ((0.381m) + (0.271m) 212 kgm ) 5 I = 1 2 (1023kg + 923kg) ((0.400m) + (0.271m) 222 kgm ) 6 I = 1 2 (1023kg + 923kg) ((0.419m) + (0.271m) 242 kgm ) 28
29 4.3 Constant Tension adjust valve setting Constant tension pressure setting is given by: p = (4.22) Tab 4.10 Pressure in the system on different layers Layers Constant tension setting p Unit 1 T 355Nm 209 bar p = = η D m rad 10 pa 2 T 376Nm 221 bar p = = η D m rad 10 pa 3 T 397Nm 233 bar p = = η D m rad 10 pa 4 T 418Nm 246 bar p = = η D m rad 10 pa 5 T 440Nm 258 bar p = = η D m rad 10 pa 6 T 461Nm 270 bar p = = η D m rad 10 pa In equation (4.22) the constant tension pressure setting is calculated with the results in tab 4.10 for each layer. 4.4 Hose and pipe sizing The hoses in the system are dimensioned by these formulas: Q hose = v low A hose (4.23) d = 4 A π (4.24) Q : System flow [l/min] v : Velocity of the oil flow [m/s] A : Area of the hose [mm ] d : Hose diameter [mm] 29
30 4.5 Wire and load calculations Force analysis of the mechanical load situation The constant tension system is used in lifting and lowering operations from vessel to vessel. The wire is modeled as a spring with upper and lower mass force. If the load were in contact with the water, forces like buoyancy drag force is acting on the system otherwise these two forces are neglected. The system showed in this section deals with the problem lifting operations from vessel to vessel in rough seas, fig 4.1. The calculations in this section are based on the material given this project, tab 4.1. Fig 4.1 Force analysis of the mechanical load situation Upper wire force: Lower wire force: Payload force: F = m g = 135kg 9.81 = 1324 N (4.25) F = m g = 135kg 9.81 = 1324 N (4.26) F = (m + m )g = (135kg kg) 9.81 = N (4.27) Equation (4.25) and equation (4.26) shows the mass of the wire which needs to be included into the model. The mass of wire is based on a wire length of 50m. The upper wire force and lower wire force are the forces that comes from the wire, this mass is calculated the same way as equation (4.16): m, = kg 2.70 m 50m = 135 kg 2 (4.28) 30
31 This is the correct mass of wire due to the weight of the wire. Spring stiffness ([6]): k = =. = (4.29) The spring stiffness in equation (4.29) has these factors for calculation of a cable/wire, ([6]): E : This is the effective modulus of a steel cable with a factor of and is less than the modulus of the material which it is made of. A : This is the effective area or the metallic area with a factor of 335mm and is less than the area of a circle with the same diameter as used in equation (4.11). Damping of contact: b = (4.30) Initial displacement: x = =. = 0.354m (4.31). Damping of contact of the wire is set to a value of payload is set to be 235mm below the drum. and the initial displacement of the Buoyancy and drag forces The load case for this system is that the load is placed on a ship deck and not in the water, and from that the buoyancy force and the drag force is neglected. If the load case where supposed to be in the water this two forces had to be taken into account, and that is why they are shown in equation (4.32) and (4.33). Buoyancy force: F = (m + m )g 0.2 = (135kg kg) = 2227 N (4.32) The buoyancy force is calculated based on a factor 0.2 (20%), this is the factor when the load is floating in the water and shows how much uplift (buoyancy) there is. Drag force: F = ρ v C A = 10 payload. v m = 1350 payload. v [N] (4.33) 31
32 The drag force is calculated from different factors as shown in equation (3.30) with a drag coefficient of 1.8 and a projected area of 1.5 mm The input heave signal of the drum and wire force The input signal to the drum actuated from the heave travel motion is given in, equation (4.34). When testing the actual system, an external crane pulling out wire from the winch is used. A load cell mounted in the wire sheave is measuring the force. In equation (4.35) for period, the frequency is set to f = 0.1Hz just to have a load case to simulate. The heave travel / input signal is given with an amplitude of Z = 1.0m: y(t) = Z sin(wt) = 1.0 sin(2πf t) = 1.0 sin(2π 0.1 t) [m] (4.34) With a frequency of f = 0.1Hz this gives the following periodic time: The heave velocity is: T = = = 10s (4.35). v(t) = 1.0 2π 0.1 sin(0.628t) = sin(0.628t) [ ] (4.36) Wire elongation: Wire elongation rate: L = x = (y(t) + x ) x [m] (4.37) v = x = (v(t) + v ) v [ ] (4.38) From the heave travel the heave velocity can easily be calculated, equation (4.36). It is now possible to define the wire force in the system. The second order differential equation is calculated by taking the sum of the wire elongation times the spring stiffness and adds it to the sum of wire elongation rate multiplied with the contact of damping. The wire force F is then calculated from the second order differential equation; mass, damper and spring equation as: F = mx b x k x [N] (4.39) F = b v + k L [] (4.40) 32
33 4.6 Servo valve dynamics, Control Valve Group The frequency of the CVG main spool is: f = 1 T = 1 300ms = 1 = Hz 300ms (4.41) 1000 The closed loop second order transfer function of the CVG main spool is: G (s) = ω s + 2ζω + ω = 1 1 ω s + 1 ω 2ζs + 1 (4.42) G (s) = (2πf) s + 1 = 2πf 2ζs π f s + 1 πf ζs + 1 (4.43) 1 1 G (s) = = 1 1 4π s + π ζs e s ζs + 1 (4.44) G (s) = e s = 2.28e ζs + 1 s ζs e (4.45) It is assumed that the CVG is critical damped so the value of zeta is: ζ: Damping ratio ζ = 1 (4.46) Natural frequency: ω = (4.47) ω = = rad sec 2ζω = rad Ns = sec m G (s) = s s (4.48) (4.49) (4.50) 33
34 Fig 4.2 shows the step response for the CVG at different zeta values. In this system to model in SimulationX it is chosen a critical damped system with zeta equal to 1. The step response is the time it takes to reach 63%. In this system it takes a time of t=0.1s to reach the step response. This time could be used in the SimulationX model by adding dynamic to the system ([7]). 1.4 Step Response 0 Bode Diagram Zeta=0.5 M a g n itu d e ( d B ) System: TF Frequency (rad/sec): 13.5 Magnitude (db): Am plitude System: TF Time (sec): Amplitude: Zeta=1 Zeta=2 Phas e ( deg) Time (sec) Frequency (rad/sec) Fig 4.2 Step response and bode plot of the main spool valve The CVG valve has the following bandwidth frequency ([8]): ω = ω (1 2ζ ) + (4ζ 4ζ + 2) (4.51) ω = 20.94(1 2 1 ) + ( ) = rad sec (4.52) The bandwidth frequency is found at -3dB below the zero line in the bode magnitude plot, fig 4.2. ([8]) 34
35 0.8 Nyquist Diagram 15 Root Locus Im aginary Ax is Im a g in a r y A x is System: TF Gain: 0 Pole: i Damping: 1 Overshoot (%): 0 Frequency (rad/sec): 20.9 System: TF Gain: 0 Pole: i Damping: 1 Overshoot (%): 0 Frequency (rad/sec): Real Axis Real Axis Fig 4.3 Nyquist diagram and RootLocus plot of the main spool valve The system is stable since the poles are in the left half plane of the Nyquist and the RootLocus plot. The Nyquist diagram also shows that there are no encirclements of -1 in the left half plane and the system is stable fig 4.3 ([9]). Tab 4.11 shows the different parameter for the step respons, these values are found by using Matlab. ([7]) Tab 4.11 Parameters for the step response, found in matlab Rise time T Settling time T Settling min T, Settling max T, Over shoot %OS 0 Under shoot 0 Max peak Peak time T
36 36
37 5 Test preparations of the system To prepare for the upcoming test period it is important to have an idea about how this should be done and have it written down in detail, which is the objective of this chapter. The hydraulic flow diagrams, fig 3.1 and fig 3.2, have now been combined into one diagram which also shows the hydraulic power unit [HPU]. The following sections shows specifically where to put the different pressure transmitters and flow transmitters, and how this is connected to the programmable logical controller [PLC] together with the valves needed to test/simulate the CT operation. A detailed test procedure shows how the mechanical system/winch system is operated, and in what order this is done. At the end of this chapter the hydraulic system together with the electrical is explained in depth. 5.1 Mechanical winch system Fig 5.1 Mechanical system and its working principles Function of the mechanical system The wire from the winch goes to the top of the test jig over the upper wire sheave with a load cell placed in the centre, down to a lower wire sheave on the ground and back up to the crane. To avoid any contact between the wire from the winch and the wire from the crane, the crane needs to be out of centre to work properly, fig 5.1. The wire from the winch is connected to an anchor of the crane, this gives the actual distance to travel. This distance is variable since the crane is hoisting 15 seconds and lowering 15 seconds in a total of one minute. 37
38 5.2 Hydraulic system design In order to test the SimulationX model, a test of the physical system is required. To simulate the wave motion and payload, a crane is used to pull the wire with varying force. The test that is performed is suited to answer the following questions: What is the force difference between the actual and required wire force. How sensitive is the CTA-setting? What pressure levels are found in the system? What flows are found in the system? How well does the current SimulationX model compare to the physical system? When these questions have been answered, the task of adjusting the SimulationX model can begin Test measurements To be able to tune the SimulationX model, some key values need to be found. The values that are measured and the connection points are listed below: The wire force. Important to note how much it exceeds the winch force. The angular position of the winch drum, to see when it starts to rotate and change direction. The oil flow into the right motor block, FT1. The oil flow through the CT adjust valve FT2. The crack pressure of the CT adjust valve, measured at port PT1. The oil pressure on winch up line before the motor, measured at port PT2. Oil pressure on winch down line, measured at port PT3. The oil pressure inside the motor block, measured at port PT4. The oil pressure before the over-centre valve, measured at port PT5. The oil pressure on winch up line before the left side motor, measured at port PT6. The oil pressure at winch down line on the left side motor, measured at port PT7. The total system pressure, measured at the front plate at port PF, on the pump pressure compensator, fig 5.2. Or it can be measured at port MP on the main control valve. Fig 5.2 Pressure cut off valve and the pump pressure compensator The wire force is recorded by a load cell; this is placed in the middle of the upper wire sheave. The load cell in the mechanical system, fig 5.1, detects a load greater than the setting of the CT adjust valve since the wire pulls on both sides of the upper wire sheave. This force needs to be divided by a certain factor. This factor is found by measuring the wire force with a 25-ton load cell mounted 38

39 between the crane hook and the winch hook. The difference between the two load cells is then found. The angular position is acquired by using an angular encoder on the drum. The oil flow is found by mounting a flow sensor on the winch up line into the right motor block. There is also mounted a flow sensor before the CT adjust valve to measure the flow through this valve when it opens. The pressures are found by connecting pressure gauges to the existing ports of the right motor block. For the system to have full system pressure the ball valve MH12 on port PF on the pump pressure compensator needs to be open. The system pressure is notified on item MH11.1 and the possibility to adjust the max pressure on MH03, fig 5.2. The hydraulic flow diagram, fig 5.4, shows the complete system with the winch diagram and the main spool diagram drawn together. What is new in this flow diagram is the hydraulic power unit (HPU). Some of these parameters like pump displacement and the rotational speed of the el-motor are used in chapter 4, Hydraulic Winch Calculations. The hydraulic pump has a maximum pressure of 250 bar, meaning that if the pressure in the system rises above this setting the cut off valve is relieving flow to tank. The CT on/off valve in this system is changed to a 3-way ball valve located as MH13. This valve has the same function as the electrical activated CT on/off valve. The ball valve has a normal position where it is relieving the pressure from port PIL2 to tank, so that this port never has the possibility to be activated. The 2-way valve on port PIL2 is only activated by the pilot pressure Pp from the main control valve. To activate the 3-way ball valve (the new CT on/off) the handle need to be pulled in upward direction, letting the Pp pressure activate port PIL2 at a pressure of 45 bar. Fig 5.3 CT on/off valve The flow diagram also consists of pressure transmitters and flow sensors placed in the system at the desirable places. It is mainly the pressures and the flows on the motors right side that are supposed to be measured. Two pressure sensors have been mounted on the left side motor to measure the pressure drop over this motor to verify flow due to pressure on the HMG3000 flow sensor. The flows that are measured are placed on winch up line before the right motor block and before the CT adjust valve, fig
40 Fig 5.4 Updated flow diagram with winch system and main control system described earlier 40

41 The pressures and flows that need to be measured are giving the following information regarding the hydraulic flow system, fig 5.4: PT1: Measures the calculated crack pressure of the CTA valve. Fig 5.5 Placing of pressure transmitter PT1 PT2: PT3: Measures the pressure before the motor, placed on the motor hoisting line. Measures the pressure after the motor, placed on motor lowering line. This pressure is the pressure drop over the main control valve from port B to port T, calculated from the orifice equation([5]): p = ρ 2 c A p: Pressure drop from B-T through the main control valve, [bar] ρ: Density of the oil, [ ] Q : Pump flow, [ ] c : Discharge coefficient A : Discharge area Q (5.1) Compared with PT2 the pressure drop over the motor is to be found. PT4: PT5: PT6: Measures the pressure inside the motor block. This is the same pressure as the crack pressure of the CT adjust valve when the 2-way valve is open at port PIL2. Else it is the same as pressure at port M1 when hoisting. Measures the pressure before the over-centre valve. Compared with PT2 the pressure drop through the over-centre valve is to be found. Measures the pressure before the motor, placed on the motor hoisting line, left side motor. 41
42 PT7: Measures the pressure after the motor, placed on motor lowering line. This pressure is the pressure drop over the main control valve from port B to port T, calculated from the orifice equation, equation(5.1). Compared with PT6 the pressure drop through the motor is to be found on the left side motor. The right side motor has five pressure transmitters placed respectively, fig 5.6. The two pressure transmitters on the left side is not shown, but have been placed on ports M2 and M3 to measure the presssure drop over this motor. Fig 5.6 The placing of the pressure transmitter on the right motor block In tab 5.1, technical information about the pressure range and the current range of the pressure transmitters are given. Tab 5.1 Technical information of pressure transmitters Pressure range Current range bar 4-20 ma FT1: Flow sensor 1 measures the flow on hoisting line at the right side motor. The flow sensor is mounted on the winch up port A and is measuring half of the flow coming from the pump. Technical information about this flow sensor is given in, tab 5.2: Tab 5.2 Technical information of flow sensor FT1 Type Flow range Current range p EVS 3100-H l/min 4-20 ma 315 bar 42


43 Fig 5.7 Placing of flow sensor FT1 to port A on the right motor block On the hydraulic flow diagram the placing of the flow sensor is located as item MH25, with the placing of the flow sensor in, fig 5.7. FT2: Flow sensor 2 measures the flow through the CT adjust valve. The flow sensor is located in the hydraulic flow diagram as item MH26, with the placing of the flow sensor in fig 5.8. Fig 5.8 Placing of flow sensor FT2 43
 PR-card (valve controllers) Load cell")
44 Technical information about the flow sensor is given in, tab 5.3: Tab 5.3 Technical information of flow sensor FT2 Type Flow range Current range p max EVS 3100-H l/mi 4-20 ma 400 bar 5.3 Electrical system and the Programmable Logic Controller Important components in this system are: Power supply PLC CPU317 (analog input and analog output) PR-card (valve controllers) Load cell Pressure and flow transmitters Winch angular encoder Joystick Power supply to the programmable logic controller The power supply used for the system is a 24VDC connected to the PLC. Fig 5.9 Power supply 24VDC connected to the PLC Technical information of the power supply in tab 5.4: Tab 5.4 Technical information of the power supply. Output signal I 10A Output signal U out 24VDC Input signal U in VAC 44

45 5.3.2 Programmable Logic Controller CPU317 Pressure transmitters PT1-PT5 and the load cell from the wire sheave are connected to the analog input section on the PLC. PT6 and PT7 together with the flow sensor are connected to an external logging program HMG3000. PR-cards (valve controllers) are connected to the analog output section to activate the CVG valve spool and the CT adjust valve. For more information see appendix electrical flow diagram Load cell in the center of the upper wire sheave The load cell has a range from kN (170 ton). Since the wire goes in a loop over the upper wire sheave, down to the floor around the lower wire sheave and back up in the crane, the cell feels a load greater than the load actually present in the wire. This is because of the angle between the winch and the wire sheave, and needs to be taken into consideration, fig Fig 5.10 The load cell placed in centre of the wire sheave Technical information about the load cell in tab 5.5: Tab 5.5 Technical information of the load cell in the centre of the upper wire sheave Range Current: I kn 4-20 ma The complete analog input section with pressure transmitters and load cell connected, fig The analog input section has 8 input channels, but only 6 of them are in use. 45

46 Load cell connection PT1 PT2 PT3 PT4 PT5 Fig 5.11 Analog input connections from the load cell and the pressure transmitters PT1-PT Valve Controllers, PR-card The spool valve in the CVG30 and the CT adjust valve are connected to the analog output section on the PLS, through PR-cards, used as valve controllers. The two cards are used to control the spool in the CVG in both directions to the left and to the right, it is also controlling the CT adjust valve setting. The PR-card for the CT adjust valve can vary between 0 to 100%. Since the valve has an inverse function the zero means the valve is totally closed and 100 means the valve is fully open. This can be read from the screen on the PR-card when the card is active, Fig Fig 5.12 PR-card used as valve controllers for the CVG spool and the CTA valve 46


47 The cables for the pressure transmitters are standard cables with four wires, but only two of them needed to have signals from the pressure transmitters. fig 5.13 shows the PLC fully connected with analog input signals and analog output signals. Fig 5.13 The PLC fully connected with analog input and analog output signals The PLC is fully operational to operate the system, fig For more information about the connections and how the system is built, see appendix D, electrical loop diagram. Fig 5.14 Overview picture of electrical system 47
48 5.3.5 Winch encoder, technical information Tab 5.6 gives the model number of the encoder: AC6 1/1212 E Q.72 DP Z Tab 5.6 Technical information of the drum encoder AC61 Type Bit E DC 10-30V Q.72 Square flange, IP67, 10x19.5 mm DP Profibus cable Z Bus terminal box with 3x screwed cable gland Number of pulses (k): k = 2 = 4096 pulses rev (5.1) Degrees pr. pulse: 360 k = pulses = pulse (5.2) The position of the winch is given in degrees and is calculated from: Winch position in degrees = number of pulses degrees puls (5.3) Between the pulse encoder and the drum there are two cog wheels that provide the gear ratio between the encoder and the winch: Cog wheel 1 mounted on encoder has 25 teeth. Cog wheel 2 mounted on drum has 125 teeth. Gear ratio: n = = 0.2 = 1: 5 (5.4) This means when the encoder has been turning 5 rounds, the winch has turned one round: 5 n = = 1 turn (5.5) 48
 and 24VDC (red cable).")

49 Fig 5.15 shows the pulse encoder for measuring the angular position of the winch. The encoder is connected to ground (brown cable) and 24VDC (red cable). Profibus cable is connected directly to the PLC for counting the number of turns in degrees. Fig bit pulse encoder for measuring the angle of the winch Fig 5.16 shows the placing of the two cog wheels to the right of the winch and the encoder. These two gears have a gear ratio of 1:5. Fig 5.16 Cog wheels and encoder mounted on drum 49
50 5.3.6 Joystick for controlling the winch The joystick is used to operate the winch in both directions, upward and downward. A Profibus cable is connected between the joystick and the PLC to operate the CVG spool. The main task of the joystick is to fully operate the winch system by activating the different buttons. fig 5.17 shows the button for activating CT ON/OFF, set the CT adjust valve and reset the CT adjust valve. Fig 5.17 Working principles for the joystick Fig 5.18 displays the button for resetting the pulse encoder at the start of a new test. Fig 5.18 Button used for reset the encoder 50

51 The connection of the joystick with Profibus direct to the PLC cable and power supply is seen in fig Fig 5.19 Power supply and Profibus cable connected to PLC 5.4 Operation procedure for the winch Purpose of the operation procedure This procedure is intended to provide the necessary information to be able to carry out the test of the 10 ton winch and the CT-system. A test is to be carried out by adjusting the CTA-valve, and then use the crane to pull out wire from the winch. The crane is supposed to pull out wire so the wire force exceeds the setting of the CT adjust valve, which is going to force the winch to pay out wire. During the test of the system the different pressures, flows to the motor blocks and the force in the wire are logged Tools needed to operate the Constant Tension system Necessary tools to be able to fulfill this test are: 7psc: bars pressure transmitters 1psc: l/min flow transmitter 1psc: l/min flow transmitter 1psc: Load cell 1psc: Pulse encoder for winch 10 tons winch with CT-system CVG with compensator CTA-valve (electrical operated safety valve) CT on/off valve (3-way ball valve is used) PLC with analog input and analog output sections 2pcs: PR-card (Valve controllers) 24 volts power supply HMG3000 flow and pressure logging computer 51

52 5.4.3 Pre start-up checks Tab 5.7 Pre start-up checks for the winch system Item Description OK Checked by 1 Do a visual inspection of the equipment and look for any damage which can lead to any unwanted leak or hazard during start-up. x HE/PME 2 Check that wire from winch does not have any contact with the wire from the crane. x HE/PME 3 Make sure that all the measurement tools are working properly. x HE/PME 4 All hydraulic hoses and electrical cables must be checked and tightened. x HE/PME 5 Do a test run in normal operation to ensure no leakage or other irregularities. x HE/PME 6 Check if the encoder is counting clockwise or counter clockwise. x HE/PME 7 Make sure CVG spool is in closed position at start up and shut down. x HE/PME Testing procedure of the system Tab 5.8 Test procedure for the winch system Item Description Adjust the CTA-valve to 84 bar, which represent 70% on the PR-card. Adjust the CTA-valve to 137 bar, which represent 50% on the PR-card. Adjust the CTA-valve to 190 bar, which represent 31% on the PR-card. 1 3 ton: Actual setting on PR-card: 69.9%= 61 bar has been logged for PT1. 5 ton: Actual setting on PR-card: 49.9%= 128 bar has been logged for PT1. 7 ton: Actual setting on PR-card: 29.9%= 195 bar has been logged for PT1. Turn on pump and LS pressure (pump pressure). OK Checked by x HE/PME 2 x HE/PME Fig 5.20 LS pump pressure needs to be switched on to give system pressure 52

53 Reset pulse encoder. 3 x HE/PME Fig 5.21 Reset angular encoder on winch 4 Check that remote control for crane is activated. x HE/PME Open 3-way ball valve to activate the 2-way valve in motor block. 1. Ball valve in closed position, fig No pressure on port PIL2 since ball valve is open from P to A. 2. Ball valve in open position, pressure activates port PIL2 and system is operating in CT mode. Open from port B to port P on ball valve. 5 x HE/PME Fig 5.22 CT on/off valve (3-way valve) to activate PIL2 ports 53
54 Activate CT on/off on joystick. This activates the spool in CVG to be fully open in hoisting mode. 6 x HE/PME Fig 5.23 Joystick with operating buttons for CT-system 7 Start by pulling in wire on the winch which means lowering the crane. x HE/PME 8 Start logging in service lab, at the same time as 4.7. x HE/PME 9 Start logging on HMG3000, about a second after 4.8. x HE/PME How to drive the crane while testing: 10 Crane pulls in wire for 15 seconds and the reverse and let the winch pull in wire for 15 seconds and the reverse again. This is to be done in one minute and is simulating a wave motion. x HE/PME Slow speed: Crane is moving with the lowest speed. Upward speed in 15 seconds. Downward speed in 15 seconds. Upward speed in 15 seconds. Downward speed in 15 seconds. Total one minute. 11 Fast speed: The crane is moving with the fastest speed. x HE/PME Upward speed in 15 seconds. Downward speed in 15 seconds. Upward speed in 15 seconds. Downward speed in 15 seconds. Total one minute. This is to be repeated for every load case. 54

55 12 Switch off CVG valve on joystick. x HE/PME 13 Set CT on/off valve in closed position. x HE/PME 14 Switch off ball valve for LS pump pressure. x HE/PME 15 Turn off pump. x HE/PME 16 Save all results from service lab and HMG3000. x HE/PME 5.5 Operation of the hydraulic system and control system The winch is driven by a hydraulic power unit (HPU) consisting of an electric motor running at a speed of n = 1488 rpm, fig The pump pressure is set to 250 bar by the pressure cut off valve (safety valve). When the pump is starting the ball valve MH12 in fig 5.4 is normally closed and the pump cannot deliver more than 40 bar pressure to the system, set by the pressure compensator. By opening the ball valve the pressure rises to 250 bar, this is the maximum pressure in the system. The pressure that works on the pressure compensator of the pump is then: = = 290 (4.1) Fig 5.24 Hydraulic power unit (HPU) This means that the pump compensator in this operating mode is closed allowing the pump to operate at full displacement and flow. Another safety valve MH28 on fig 5.4 has a pressure setting on 270 bar and works as a safety valve for the system. The pressure relief valve inside the CVG is factory set to 350 bar. A datasheet for this type of load-sense compensator can be found in appendix C. The pump is controlled by the pump compensator and the pressure cut off valve. Pressure cut off valve need to be activated by the ball valve, fig
56 Fig 5.25 Pressure compensator and pressure cut off valve being controlled by the ball valve In normal hoisting and lowering operation the brakes are only unloaded the winch when lowering a load, meaning that lowering of the load is controlled by over-centre valves inside the motor blocks. In CT-operation the brakes on the winch is being unloaded in both hoisting and lowering mode. The pressure needed to unload the brakes is set to 45 bar, measured at item MH11.5, Fig Fig 5.26 CT on/off valve (3-way valve) After the pump has been started and the LS pressure regulator (ball valve) is activated, the pump pressure is pushing onto the centre position of the CVG spool with 250 bar pressure. By activating the CT system the three-way ball valve item MH13 in fig 5.4 needs to be in open position. This pressure is used to activate the two-way valve on port PIL2, letting oil flow through this valve to CT adjust valve. The CT on/off valve is in open position when handle is horizontally, fig The CT adjust valve item MH14, fig 5.4, is set at a desired crack pressure by the roller button on the joystick. When CT adjust valve is opening at the crack pressure the flow leaves directly to tank, fig To activate the two-way valve at port PIL 2 a pressure at 45 bar is needed from the Pp-line of the 56

57 CVG, measured by item MH11.3. Pp-line is factory set to 45 bar and is used to unload the brakes, activate the port PIL2 and the CVG spool. When port PIL2 has been activated the oil is flowing from a stationary condition to a moving condition. Fig 5.27 CT adjust valve This is creating a pressure drop through the restriction valve inside the CVG valve on the MLA-line, fig This pressure drop over the restriction causes the compensator in the CVG to close when the load is pulling out wire form the winch. Fig 5.28 Restriction with diameter 2mm and length close to zero mm 57
 is the same as the pressure at PT5, or PT2 minus the pressure drop over the check valve for the over-centre")

58 It is important to be wear of these two conditions in the system, fig 5.4: 1. If no pressure on the port PIL2 the two-way valve is closed and the oil has no motion in this section. Meaning that the pressure inside the motor block measured at pressure transmitter 4 (PT4) is the same as the pressure at PT5, or PT2 minus the pressure drop over the check valve for the over-centre valves. 2. If pressure on port PIL2 in CT mode the oil inside the motor block is having a motion causing a pressure drop at the restriction valve in CVG that leads to a closure of the compensator spool which only acts as a replenishment when the winch is paying out wire. The CT on/off button on the joystick is the one being used to activate the spool inside the CVG. When this one is pushed and if there is any slack in the wire the winch is pulling this slack onto the winch keeping tension in the wire. Now the winch is being totally controlled by the crane motion, if the crane is pulling upwards the winch pays out wire and if the crane lower the hook the winch pull in wire. In CT operation the flow is circling inside the motor block where the compensator acts as replenishment for the oil leak. After finishing the CT-mode the CT on/off button is switched off and the three-way valve is set in closed position. The joystick with operation buttons for CT in, fig Fig 5.29 Joystick with button operations 58
59 5.6 Function of the hydraulic power unit The basic understanding of how the HPU works is important for both the test operation and the further work of the SimulationX modeling ([5]). The hydraulic pump, fig 5.30, shows how the HPU is set up. Fig 5.30 Hydraulic pump with pressure compensator and pressure cut of valve (safety valve) The pump has two operating modes: 1. Pump is operating at a pressure of 40 bar with the ball valve MH12 closed. 2. Pump is operating at a pressure of 250 bar with the ball valve MH12 open. In case one the pump is forced to have a small displacement since the pump regulator is pressing the arrow of the pump in an almost horizontally direction. This is done because the pump pressure compensator is in open position letting the pump pressure go through this valve from A to B. This pressure counteracts the regulator since the area on the regulator at port A is larger than the area at P1. The pump pressure is only working against the spring setting of the pressure compensator. In case two the pump regulator is pulling the arrow in a vertical direction and allows the pump to have max displacement to give max flow to the system. The pressure cannot go above the cut off setting at 250 bar, meaning that that max system pressure is 250 bar. The pump pressure compensator is closed in this operation mode since the pump pressure on left side of the compensator is 250 bar and the pressure on the right side is max pressure of 250 bar plus the spring setting of 40 bar, equation(4.1). 59
60 5.7 Control Valve Group information Compensator adjust Fig 5.31 CVG valve with the compensator adjust screw and A/B port connections Technical information about the CVG spool Model number: S C1-P2-F0-AN2/580-A300B300 Tab 5.9 CVG technical information Code Description S30 Size 81 Spool type l/min C1 Electro-proportional P2 Pressure compensator adjustment F0 No feedback on the spool position AN2/580 Flow stting=580 l/min A300B300 Pressure settings 300 bar The spool has a nominal flow of 500, but has the capacity to handle a max flow of 750. This spool used in the test can handle a oil flow set to be 580. In the next section it is shown how the oil flow is set for approximately 580, tab Technical information about the CVG compensator The compensator was unscrewed and it was counted how many rounds it was set to be, fig The number of rounds of the compensator screw sets the amount of oil flow through the spool. The compensator is set 2.6 rounds and can handle an oil flow of 580. This gives a pressure drop over the compensator of p = 6.1 bar. 60
61 6 SimulationX modeling The SimulationX model consists of two main parts, a mechanical part which includes everything after the motors, for example all inertias, the wire stiffness, the gears and the drum radius, to name a few parts. The second part is the hydraulic part. This consists of all valves, hoses, pipes and the pump. To better explain the model, each part is presented separately. The winch system is used for safe lifting operations from vessel to vessel, but during the test a crane is working as a wave motion. Both of these two scenarios are illustrated in the following sections. 6.1 Dynamical modeling of the system This system is supposed to maintain a constant tension in a wire in rough seas. This means a wave motion have to be represented in the model, and act on the payload. This is achieved by using function blocks. The block used to illustrate the wave motion is HeaveTravel, and contains the formula: Z : Amplitude [m] f : Frequency [H] y(t) = Z sin(2πf time) [m] (6.1) This is then fed into another function block named WireElongation. This block contains the formula: L = (y(t) + UpperWireMass. x) LowerWireMass. x [m] (6.2) y(t) refers to the wave from HeaveTravel in equation (6.1). By adding this to the position of the upper wire mass, and subtracting the position of the lower wire mass, the total elongation of the wire is found. This value is also known as x in the formula: k : Wire stiffness [N/m]. F = k x [N] (6.3) The second part of the wave is the HeaveVelocity block. This block contains the derivative of the HeaveTravel block, the velocity of the wave. This value is used in the WireElongationRate block. This block finds the rate of elongation in the wire and the value is also known as x in the formula: The block calculates the elongation rate with this formula: F = b x [N] (6.4) v = (y(t) + UpperWireMass. v) LowerWireMass. v [ ] (6.5) () refers derivative of the wave motion, which is the wave velocity. The formula provides the total difference in velocity between the upper and lower wire mass, also known as the wire elongation rate. 61
62 The wireforce block is the block where it all comes together. It weighs down the upper wire mass and the winch, and pulls on the lower wire mass and the payload with a force that is governed by the wave motion. The wire force is calculated from: F = WireElongation. y Wirestiffness. y + WireElongationRate. y Wiredamping. y [N] (6.6) This formula is identical to the general mass-damper formula: F = mx + b x + k x [] (6.7) The constants here are the wire stiffness and the wire damping. The wire stiffness is calculated in equation (4.29) Wire damping on the other hand is assumed to be Model of the mechanical system The mechanical model is divided into two parts, the rotational parts and the linear parts, separated by the winch. This system shows the possibility to simulate the mechanical part of the constant tension system when operated from vessel to vessel in rough seas. The buoyancy force and the drag force are also added to the system to see how it acts is in direct contact with the wave motion. By lifting the payload from vessel to vessel these two forces are neglected Linear mechanics information Fig 6.1 shows the load and wire. The wire is split into two parts, to illustrate how the wire force pulls down on the drum, and pulls up on the load. The UpperWireMass block represents the mass of the top part of the wire. The LowerWireMass block represents the mass of the lower part of the wire. The Payload block represents the mass of the main payload. The WireForce block provides a force determined by the formula: F = b x + k x [N] (6.8) Where k is the wire stiffness, x is the wire elongation, is an assumed wire damping and is the wire elongation rate. The weight block illustrates the force from the gravity affecting the upper wire mass. The Weight block illustrates the force from the gravity affecting the lower wire mass and the payload. The Buoyancy block represents the force on the payload if the payload is resting on or submerged in the water. The Drag block illustrates how the payload movement is being hindered when submerged. 62
63 6.2.2 Rotational mechanics information The rotational mechanics part of the model is comprised of the inertia of the motors, the gears and their inertia, the loss as a result of the gears, the drum inertia and the transformer from rotational motion to linear motion, which represents the drum. Vital information is entered into each component, drum radius is entered into the Drum block, and the gear ratio is entered into the gear1 and gear2 blocks, fig 6.1. LMinertia and RMinertia represent the inertia of each motor. gear1 and gear2 includes the gear ratio for each gear, and tells SimulationX to include a transmission in the calculations. gearinertia1 and gearinertia represents the inertia for the gears, which is assumed to be kgm 2. gearloss_1 and gearloss_2 adds a loss of torque of about 5% of registered torque, as a result of the transmission. The 5% is an assumed number. druminertia represents the inertia of the drum. Drum marks the transition from rotational motion to linear motion, and represents the ratio of radians to meters. Cst_Torque_1 and Cst_Torque_1 represent the torque from the motors Model of the mechanical system Fig 6.1 Mechanical system in SimulationX The result of this system shows how the payload position is modeled due to a heave travel motion from vessel to vessel or in contact with the open sea. 63
64 In constant tension mode the load is following the heave motion. The winch is working parallell to the heave, by keeping tesion in the wire during the CT modus. The winch is pulling in wire if load is moving upwards and giving out wire if load is moving downward, fig 6.2. Payload position and Heave travel [m] Payload position Heave travel Payload position and Heave travel Time [sec] Fig 6.2 Payload and heave travel of the mechanical system Fig 6.3 shows the speed of the payload due to payload position. Max speed in of the payload in this case is ca 16m/min in hoisting modus. 1 Payload position and Payload velocity Payload position [m] Payload velocity [m/min] Time [sec] Fig 6.3 Payload and payload velocity of the mechanical system By comparing the wire force with the payload and heave travel, the wire force has a range between 44000N and 39000N. The wire force is increasing when winch is pulling in wire and is decreasing when the winch is giving out wire, fig 6.4. The wire force is calculated based on the equation (4.40). 64
65 4.5 x 10⁴ Wire force Wireforce [N] Time [sec] Fig 6.4 Wire force of the mechanical system 6.3 Models of the Hydraulic system The hydraulic system and the belonging components are discussed in chapter 2 and 3 together with the system function. This section describes how the different elements are built and set up in SimulationX Working principle of the Control Valve Group Compensator It is important to explain that this sub-section deals with how the compensator operates in the system. Fig 6.5 shows only the working principle of the compensator and that the behavior of it is as expected. Fig 6.5 Compensator function model 65
66 The compensator stroke signal is given by UC_ref: y = V9. P V8. P + 9e5 2e5 [Pa] (6.9) Equation (6.9) describes the compensator behavior by measuring the pressure drop over the MainEdge devided on the opening range of 2 bar Compensator analysis at a flow of Q=382 l/min By having an oil flow of Q=382 l/min the Compensator is trying to deliver all the flow to the system. The MainEdge has its setting of 9 bar at 580 l/min, this means that the Compensator is having a full stroke trying to give all the flow that is possible, but it cannot deliver more than the pump feeds it with. The UC limitation function is set to close the Compensator between 0 and 1, else the Compensator is fully open, trying to do its work to maintain a constant pressure drop at 9 bar over the CVG, fig Working principle of the CVG compensator 2.5 Stroke signal and Valve limit UC ref UC Time [sec] Fig 6.6 Working principle of the CVG compensator 10 9 Pressure drop over main edge (P-A) Presssure node v9 Presssure node v8 Presssure drop main edge (P-A) System pressure [bar] Time [sec] Fig 6.7 Pressure drop over the main edge (P-A) 66
67 The pump only delivers an oil flow of Q=382 l/min, this is not enough to let the Compensator maintain a constant pressure drop at 9 bar over the MainEdge. The pressure drop over the MainEdge is not more than 4 bar respectively, fig 6.7. Fig 6.8 shows the Compensator give all the pump flow to the system (compensator flow and pump flow are overlapping) and no oil flows through the MH03_Cut_off valve 400 Flow in the system at 382 l/min System flow [l/min] Compensator flow Pump flow Cut off flow Time [sec] Fig 6.8 System flow at Q=382 l/min Compensator analysis at a flow of Q=1000 l/min To make sure the compensator is working as intended it is done a test to see what happens if the pump delivers a flow of Q=1000 l/min. The Compensator valve should then close to maintain a constant pressure drop at 9 bar over the MainEdge. Working principle of the CVG compensator UC ref 0.25 UC Stroke signal and Valve limit Time [sec] Fig 6.9 Working principle of the CVG compensator 67
68 Fig 6.9 shows that the Compensator actual do close to maintain a constant pressure drop over the CVG. Here the UC limitation function closes since there is to much flow in the system to maintain a pressure drop at 9 bar over the MainEdge. The Compensator stroke signal UC_ref almost closes the compensator to only deliver an oil flow of Q=580 l/min as both the Compensator and MainEdge are set for. The pressure drop between V9 and V8 is 9 bar even how much flow the pump delivers since the Compensator is working as intended, fig Pressure drop over main egde (P-A) Presssure node v9 Presssure node v8 Presssure drop main edge (P-A) 20 Pressure [bar] Time [sec] Fig 6.10 Pressure drop over the main edge at Q=1000 l/min By having a pump flow of 1000 l/min the Compensator successively adjust the amount of flow to the system. The Compensator lets 580 l/min flow into the system as supposed to and the rest of the pump flow is leaving over MH03_Cut_off valve to tank, fig Flow in the system at 1000 l/min Compensator flow Pump flow Cut off flow System flow [l/min] Time [sec] Fig 6.11 System flow at Q=1000 l/min 68
69 6.3.4 SimulationX model of the motor block Both blocks are mechanically linked, forcing them to rotate at the same speed and require the same oil flow. Because both motor blocks are similar, only the right side is explained. Fig 6.12 Motor block right side, updated model for test Both pressure transmitters, PT2 and PT2 are placed at the same place as located on the physical motor block, this made it easier to compare results. SUN-CBIL is the over center valve, also known as a load holding valve. This valve is normally used only in normal operation to prevent load from falling when the winch is not lifting. In CT-mode, this valve is bypassed via a check-valve, fig Because this valve causes a slight pressure drop, it was included in the model. OCr1, fig 6.12, is the main stage, opening at a pressure difference of 100 bar between V5 and V7, going from port B to port A. This does not affect the system or the test, since no oil flows in that direction. In CT mode when the pressure in PT2 exceeds the setting in V6 with 12 bar (explained below), oil flows from port A totvi46_right, down through R4 and back up through the motor in a loop, fig OCr2 is the check-valve, operated via a function. It opens at 0.5 bar and is fully open at 1 bar pressure difference between V7 and V4. The SUN-RVIA valve was improved with the use of variable throttle valves, to better simulate the behavior of the valve. The pilot port is controlling the crack pressure of the SUN RVIA valve by changing the pressure difference before and after the valve, fig
70 Fig 6.13 SUN-RVIA valve modeled in SimulationX SUN- RVIA is remote controlled; the crack pressure is controlled by the pilot pressure, and the pilot pressure is controlled by the CTA valve pressure setting from port 3. The main stage of this valve is R4, and it is controlled by this equation: V4. p V6. p 12e5 2e5 (6.10) This equation uses the pressure difference between the two volumes V4 and V6, fig 6.12, to regulate the opening of the valve. If the difference is greater than 12 bar the valve opens, and it is fully open at 14 bar difference. Since V6 is controlled by the CT adjust [CTA] valve, it remains constant to the CTA setting. Only pressure changes in V4 is opening the valve. This happens only when the wire force rises above the setting on the CTA valve. The oil then flows down through the RVIA valve from port 1 through R4 to port 2, entering the motor from the other side. The pilot valve R5 is controlled by this equation and behaves like a regular pressure relief valve: V6. p V5. p 320e5 75e5 (6.11) It requires a 320 bar pressure difference before it opens, and since this test system has a cap of 250 bar, it will never open in this scenario. R6 is a static orifice, only letting a small flow of 10 l/min through with a pressure drop of 320 bar. R7_a and R7_b are leakage valves, letting through a small flow of 0.08 l/min with a 70 bar pressure drop. 70
71 Here is an overview of the CVG with the compensator, fig CTA port Port A Port B Tank Pump Fig 6.14 CVG with compensator Tank The safetyvalve is limited to 250 bar, effectively capping the system at that pressure. This is in accordance to the settings of the HPU used for the test. The main control valve is always positioned in -1 when CT mode is engaged, leading the flow from P to A and B to T. The compensator is controlled by equation (6.9). It attempts to maintain a constant pressure drop from V8 to V9 of 9 bar, fig The function of the compensator is explained further in chapter 2. The settings for the compensator and the main control valve are 580 l/min at full stroke. The reason for the pressure drop of 9 bar is that the main control valve has a pressure drop of 9 bar at a flow of 580 l/min according to the datasheet. The LSW orifice leads to the CTA valve, and because of that the pressure in V9 is the CTA pressure +/- 1 bar. The orifice itself is 2 mm in diameter and has a length of mm. When CT mode is engaged and a small flow is passing through the CTA valve, oil flows over the orifice as well. This causes the pressure drop between V8 and V9 to occur solely at the orifice. 71
72 6.3.5 Hose and pipe modeling The most important part of the motor block, at least according to the CT-system, is the sunrvia valve. Its setting is what decides where the oil flows, and therefore the direction of the motor rotation. The left side motor block does not include any sensors. Fig 6.15 shows the pipes and hoses required to simulate the dynamics of the lines of the system. In constant tension mode the CVG valve is set to a specific position. The oil flows from porta to Aleft and Aright, then into the motors and back out to portb via Bleft and Bright. PortA and portb are connected to the main control valve. Fig 6.15 Pipes and hoses connecting the CVG group with the motor blocks The reasoning behind including these is because of the elasticity in the hoses and the possibility of turbulent flow. The length of all pipes and hoses are assumed to be 2 meters, and the diameters are calculated for both inlet and outlet lines by use of the equations in section 4.4, hoses and pipes. 72
73 7 Results from the tested system The same test was carried out with multiple settings explained in the chapter 0. In this chapter the results of each load setting are presented, and in chapter 0 the results are being compared with the simulated model. The test scenario used is a crane pulling on the wire with the highest speed setting. This because the winch moved a lot more smoothly compared to when the crane moved with the slow speed. At The end of this chapter the results are discussed to get the complete overview of these test results. 7.1 Results from the 3 ton test The position of the winch, fig 7.1, has a positive rotation of the encoder counter-clockwise. This means that the winch has a negative rotation when pulling in wire, and positive rotation when paying out wire. When the winch starts to pull in wire it is running for 15 seconds, and then pays out wire until around 25 seconds, where the cycle restarts. As mentioned in chapter 0 test preparations the procedure was to lower the crane for 15 seconds, then reverse direction as fast as possible and hoist for 15 seconds. This was repeated for 60 seconds. In fig 7.1 this test has been executed for 10 seconds in a total time of 60 seconds. During the first interval from 0-15 seconds the winch almost has one full rotation before a new cycle is beginning Winch position Winch position -100 Winch position (deg) Time(s) Fig 7.1 Winch position, 3 ton test 73
74 Fig 7.2 displays the speed of the drum in RPM. The drum never had time to reach higher speeds due to speed limitations for the crane s hook. The max speed reached during this test was at 8 rpm, this speed was reached during the first interval from 0-15 seconds. In the cranes hoisting mode when the winch pays out wire the max speed reached was about 7 rpm after 20s Winch speed Winch speed 4 Winch speed (rpm) Time(s) Fig 7.2 Winch speed, 3 ton test The spiking areas in fig 7.2 symbolizes when the oil flow changes direction inside the motor blocks. 80 Pressures inside the motor block, 3 ton Pressure (bar) PT1 (CTA pressure) PT2 (Before motor) PT3 (After motor) Pressure drop over motor Time (s) Fig 7.3 System pressures, 3 ton The pressure drop over the motor helps to calculate the motor torque and the theoretical wire force the winch is pulling the wire with, fig 7.3. The pressure drop is measured between PT2 and PT3, PT3 is the pressure cause by the pressure drop over the main spool and emergency pay out block, fig 5.4. Since PT2 is higher than PT1 is because the maximum pressure in the motor blocks is CTA pressure plus 12 bar. 12 bar represent the main spring setting of the RVIA valve, fig 2.4. Fig 7.4 shows the oil flow though the motor blocks and though the CTA valve. When the crane is lowering the winch pull in wire with a max flow of 80 l/min. When the winch pays out wire the oil 74
75 flow is reduced to a minimum of 40 l/min after 20s. This means the compensator restricts the pump flow into the system. The compensator is restricting the flow at a minimum of 40 l/min during the whole cycle time. It clearly shows that the compensator do not close completely and allows replenishment oil into the system. This is because of the oil leakage in the system, but also that the compensator is trying to deliver all the possible pump flow into the system to maintain a constant pressure drop over the main spool. Since the pump flow is a lot less than the compensator has been dimensioned for the compensator does not close entirely, fig System flows Flow (l(min) Flow into the right motor block Flow over the CTA valve Time (s) Fig 7.4 System flows, 3 ton The data from the load cell located in the wire sheave and the theoretical wire force calculated from the pressure drop over the motors are compared in fig Comparison of wire forces 30 Force and angle Winch wire force [kn] Measured wire force [kn] Winch position [rad] Time (s) Fig 7.5 Wire forces, 3 ton Fig 7.5 shows the measured wire force from the load cell in the upper wire sheave compared with the winch wire force calculated from the pressure drop over the motors. In this load case the difference in 75
76 force when winch is pulling in wire is about 0.91 ton. When winch is paying out wire the difference in force is about 0.91 ton. The winch position curve is for illustration purpose. It displays when the winch changes direction due to the difference between measured force and the winch force. The standstill of the winch in this force difference is about 2 seconds. 7.2 Results from the 5 ton test The position and speed of the winch are presented in fig 7.6 and fig 7.7. The hoisting and lowering time for this is load case has been set to 15 seconds in a total of 60 seconds. The period time for this load case is about 30s, fig 7.6. In this case the winch rotates to a maximum of 1 ½ revolutions from 0-15s Winch position Winch position -200 Winch position (deg) Time(s) Fig 7.6 Winch position, 5 ton test Winch speed Winch speed 4 Winch speed (rpm) Time(s) Fig 7.7 Winch speed, 5 ton test 76
77 The speed of the winch, fig 7.7, is faster for the 5 ton test than the 3 ton test because the motors receive more oil flow in the 5 ton test, fig 7.9. The speed also varies more just after direction changes for 5 ton than it does for 3 ton. Fig 7.8 compared to the 3 ton test has higher pressures inside the motors, as expected since the CTA valve is set at a higher pressure in this load case. The pressure PT2 is approximately 12 bar higher than the PT1 pressure at the CTA valve because of the main spring in the RVIA valve. 150 Pressures inside the motor block Pressure (bar) PT1 (CTA pressure) PT2 (Before motor) PT3 (After motor) Pressure drop over motor Time (s) Fig 7.8 System pressures, 5 ton Fig 7.9 shows the oil flow in the motor blocks at 5 ton load case. The oil flow here has a maximum of about 85 l/min at about 12s and keeps that flow in 6s before the winch starts to pay out wire. As in the 3 ton test, fig 7.4, it clearly shows that the compensator does not close entirely. This has the same reason as in test 3. The pump flow is not high enough such that the compensator tries to give all the flow as possible to maintain a constant pressure over the main spool in CVG, the compensator also adjust the leakage flow in the system. 90 System flows Flow (l(min) Flow into the right motor block Flow over the CTA valve Time (s) Fig 7.9 System flows, 5 ton 77
78 Fig 7.10 shows the measured wire force from the load cell in the upper wire sheave compared with the winch wire force calculated from the pressure drop over the motors. In this load case the difference in force when winch is pulling in wire is about 0.81 ton. When winch is paying out wire the difference in force is about 1.93 ton. The winch position curve is for illustration purpose. It displays when the winch changes direction due to the difference between measured force and the winch force. The standstill of the winch in this force difference is about 2 seconds. 100 Comparison of wire forces 80 Force and angle Winch wire force [kn] Measured wire force [kn] Winch position [rad] Time (s) Fig 7.10 Wire forces, 5 ton test 7.3 Results from the 7 ton test The position and speed of the winch are presented in fig 7.11 and fig The hoisting and lowering time for this is load case has been set to 15 seconds in a total of 60 seconds as load case 3 ton and 5 ton. The period time for this load case is about 30s, fig In this case the winch rotates to a maximum of 1 ½ revolutions from 0-15s. 0 Winch position Winch position -100 Winch position (deg) Time(s) Fig 7.11 Winch position, 7 ton 78
79 The speed of the winch, fig 7.12, is faster for the 5 ton test than the 3 ton test because the motors receive more oil flow in the 5 ton test, fig 7.9. The speed also varies more just after direction changes compared to the 5 ton scenario. A possible reason for this might be that the compensator is opening and closing rapidly in the first few seconds after changing direction Winch speed Winch speed 4 Winch speed (rpm) Time(s) Fig 7.12 Winch speed, 7 ton Fig 7.13 shows that the pressures are higher than the 5 ton scenario because of the increase of the crack pressure of the CTA valve. The pressure setting of 190 bar is close to the calculated value, tab 5.8. The fluctuations in PT2 around 8, 25, 40 and 55 seconds correspond to the speed changes, fig 7.12, illustrating the compensator working to maintain a constant pressure. 250 Pressures inside the motor block 200 Pressure (bar) PT1 (CTA pressure) PT2 (Before motor) PT3 (After motor) Pressure drop over motor Time (s) Fig 7.13 System pressures, 7 ton 79
80 At the 7 ton scenario the flow into the motor block is not as high as for the 3 ton or 5 ton scenarios, but the flow through the CTA valve is about the same. Compared to the 5 ton scenario, fig 7.7, the speed of the 7 ton, fig 7.12, is about the same even though the pump flow is much lower. The max flow difference is about 30 l/min. This could mean that not all of the oil flows into the motor block at 5 and 3 ton, but some of it flows over the RVIA valve. Since the speed of the motors is about the same at all three scenarios, but the flow at the 7 ton scenario differ from 3 ton and 5 ton is because of the RVIA in the motor blocks. At 3 ton and 5 ton scenarios about 30 l/min of the oil flows through the RVIA valve to tank. 60 System flows Flow (l(min) Flow into the right motor block Flow over the CTA valve Time (s) Fig 7.14 System flows, 7 ton Fig 7.15 shows the measured wire force from the load cell in the upper wire sheave compared with the winch wire force calculated from the pressure drop over the motors. In this load case the difference in force when winch is pulling in wire is about 0.81 ton. When winch is paying out wire the difference in force is about 3 ton. 140 Comparison of wire forces Force and angle Winch wire force [kn] Measured wire force [kn] Winch position [rad] Time (s) Fig 7.15 Wire forces, 7 ton test 80
81 7.4 Test results discussion These measurements were limited by the speed of the hook hanging from the overhead travelling crane. The crane had two settings, very slow and a slightly less slow. In addition, whenever a direction change was done, for example from up to down, the crane had to go from fast up to the slow up to slow down to fast down. The implications of this are that the force difference was only measured at slow speeds, so it is unknown how big the difference is at faster direction changes. Some uncertainties remain, for example why all the load cases have the same winch speed but the 7 ton scenario has a different flow. The reason might be more leakage at higher pressures or more flow through the RVIA valve at 3 and 5 ton, since the flow sensor only registered flow into the motor block, not the exact flow through the motor. From the test results it is apparent that the 3 ton test offers the smoothest results, while the 7 ton test offers more unstable results. To get a good mix between smooth, stable results and force, the 5 ton test is used as the benchmark for the SimulationX model. The winch position and the CTA setting are used as inputs into the model, while the pressures and flows are used to gauge how well the model matches the test results. 7.5 Making use of the test results in SimulationX The data from the test is logged in ascii format, in a text file. In order to use the results, they need to be changed from lists of numbers to something useful, like a curve. SimulationX has a general Curve block that does this work. By editing this block it is possible to open text files and use them as arguments and function values. By doing this, the results are viewed in a better way, or used as inputs. This chapter covers the SimulationX part of the test and the improvements made to the model to suit the test. The results of the simulation are compared to the test results in section Modifications of the simulation model After conducting the test of the winch system the original model was modified to suit the test parameters. The encoder results were adjusted to represent the winch movement, and used as input for the SimulationX model, fig This way, the motor rotation and flow into the motor is known for the simulations, reducing the number of variables. In addition, five pressure transmitters were used to check certain pressures of interest. The mechanical system after the winch was removed and replaced with a preset rotation that used the modified encoder values to drive the winch. Fig 7.16 displays the new mechanical part. 81
82 Fig 7.16 Rotational mechanics with preset The preset is set to angle of rotation (deg) and the values used to drive it were taken from the test. Fig 7.17 is opposite the curves shown earlier since the curve is multiplid with Rotation of the winch drum Rotation (deg) Time (s) Fig 7.17 Input into the preset block 82
83 8 Comparing Simulation and Test Results This chapter is all about comparing the different results from the simulated model with inputs given from the practical test and the result from the practical test. The chosen scenario in this part is the 5 ton test. The important topic is to know what kind of parts in the hydraulic system that gives good similarities to one another. By comparing the flows through the motor and through the CTA valve gives good ideas how fast the motors run and how much oil that flows through the RVIA valve. 8.1 Simulation results compared to physical results The next part of the thesis compares the results from the test with the results from the simulated system and discusses the differences and similarities Flowsensor 1 Flow from simulated system Flowsensor from test Flow (l/min) Time (s) Fig 8.1 Comparison of flow between test and SimulationX Flow sensor FT1, fig 5.4, measures the flow into the right motor block. Since both motors are mechanically locked to each other, the flow into the left and right motor blocks should be identical. The two graphs have the same shape, but they do not have the same amplitude. Possible reasons for this are that the compensator does not allow enough flow in the SimulationX model. The physical system has some leakage, and this requires the compensator to open and let more flow through to maintain a constant pressure drop over the control valve. In the SimulationX model, only the motors have any leakage. There might be some leakage in the emergency pay out block, fig 5.4, but that is not possible to investigate at this time. Besides the difference in amplitude, both curves look very similar. The test curve is less stable in the ramp up phase; this is caused by the compensator. In SimulationX, it is infinitely fast, changing position to let more or less oil through. In reality, it is very fast, but not infinitely fast. When dynamics were added to the compensator, the SimulationX model could not handle it. Dynamics are discussed further in section
84 Now a look at the CTA-pressure, the CTA-valve was adjusted to a pressure of 128 bar in the test and in SimulationX. They should be about the same, within a 1 bar margin. 133 Pressure sensor Pressure sensor 1: Test Pressure sensor 1: SimX 130 Pressure (bar) Time (s) Fig 8.2 Results from PT 1 The curves in fig 8.2 are very close to each other, as expected. The PT1 pressure sensor is placed directly in front of the CTA valve both in the test and the simulation, fig 5.4. Fig 8.3 displays both the test pressure and the simulated pressure at PT2, in front of the motor. Pressure sensor Pressure (bar) Pressure sensor 2: Sim X Pressure sensor 2: Test Time (s) Fig 8.3 Pressure sensor 2, in front of the motor The SimulationX curve is pretty constant. The increase in pressure at 25 seconds indicates that the motor torque was overcome by the load torque, leading to the winch starting to pay out wire. At around 35 seconds, the winch started to pull in wire again. The difference between the highest and lowest points on the blue line is at most 5 bar. By comparing these two curves shows a similarity between them even if the differences are 5 bar, which is not much at all. 84
85 The PT3 pressure sensor measured the pressure just after the motor. Since the motor is where the majority of the pressure drop in the system occurs, the pressures from PT2 and PT3 can be used to calculate the motor torque and flow requirement. 6 Pressure sensor Pressure (bar) Pressure sensor 3: Test Pressure sensor 3: SimX Time (s) Fig 8.4 Pressure sensor 3, after motor The SimulationX curve is close to 0, because the motor block is connected to the control valve, and then directly to tank. In the physical system, the oil must pass through an emergency pay out block, fig 5.4. that contains a few valves with pressure drops. Because of this, the oil is in as enclosed space and more susceptible to pressure changes, a fact clearly seen after 20 seconds. The PT4 pressure transmitter measured the pilot pressure that controls the crack pressure of the SUN RVIA-LCN valve, fig 8.5. If this was incorrect in the simulation, the RVIA valve would not function properly, and the entire CT operation would be incorrect. Pressure sensor Pressure (bar) Pressure sensor 4: Sim X Pressure sensor 4: Test Time (s) Fig 8.5 Pressure sensor 4: SUN RIVA pilot pressure 85
86 The test curve, fig 8.5, contains oil within a small enclosed space which makes it very sensitive to pressure changes. Even though it changes often, it does not change much, and average value of the test curve is close to the value of the SimX curve. Without more in-depth simulation this is a good fit. Even though it seems like the test curve spikes a lot, notice the range of the y-axis. It does actually not spike much at all. 8.2 Model dynamics discussion System dynamics is the common term for adding additional properties that needs to be calculated for valves, pipes and hoses. Dynamics for hoses means elastic properties that are making them expand and contract according to oil flow and pressure. Dynamics for pipes include the inertia of the oil and elastic properties of the walls. Valve dynamics include undamped natural frequency and damping ratio. The system was modeled with little to no dynamics because of time limitations. The results would be closer to reality if every valve, hose and pipe had its own dynamic behavior, however this would also lead to a much longer simulation time because of lots of small calculations for every item with dynamic properties. This leads to a very long development time. The act of developing a working model is a challenge, since adding dynamic properties to different blocks in SimulationX needs much understanding of how this can be modeled. The hydraulic constant tension system is very complex, consisting of many valves that are not standardized in the hydraulics library in SimulationX. These valves like the RVIA and the CVG compensator has been modeled by variable throttle valves, and demands a lot of understanding of dynamical hydraulic systems. It would be an interesting project to get this model as close to reality as possible by adding proper dynamics to every valve, hose line and pipe. 86
87 9 Conclusion The main goal for this thesis is to compare the results between a practical test and a simulated system, and to check the force difference of the CT mode of the winch. The SimulationX model and the test came up with very similar results, with a few small exceptions. The pressures inside the motor block were spot on, but the flow into the motor block was a bit off. From fig 8.1 it is apparent that the simulated model s compensator allows through less flow than the real compensator did in the test. Because the flow is dictated by the speed of the motor multiplied with the displacement, the difference may be a result of leakage in the real system. In the SimulationX model, the motor block becomes a closed loop during lowering in CT mode, requiring no flow because there are too few leakages for the compensator to refill. This may change by adding dynamics to the model, for example more leakages. Simulating a system in SimulationX instead of testing it in the real world is a good alternative. The main reason is that setting up a real system takes a lot of time for a lot of people, which lead to expenses. Simulations won t occupy more than one person, but it requires a high level of understanding of the program itself and hydraulic systems, especially valve behavior. Using the variable throttle valve makes it possible to simulate almost any valve, as long as the datasheet is available. This is the reason why it is used to model the non-standard RVIA-LCN valve and the compensator. Suggestions to further work in for the modeling is to add more dynamics to the SimulationX model until all valves, pipes and hoses have their own dynamic behavior, then removing part by part to see what has an effect on the results and what does not. To find the force difference between when the winch is supposed to pay out wire and when it actually does pay out, the load cell values from the test are used. Those are compared to the wire forces calculated from the pressure drop over the motor. Fig 7.10 illustrates this in a good way. The force difference is calculated by subtracting the measured wire force from the force the winch applies to the wire twice; one time for hoisting and a second time for lowering. The exact values are listed in this table: Load case Force difference 3 ton hoisting 0,91 ton 3 ton lowering 0,91 ton 5 ton hoisting 0,81 ton 5 ton lowering 1,93 ton 7 ton hoisting 0,81 ton 7 ton lowering 3,05 ton As the load rises, so does the force difference. Future work might be to find ways to optimize and improve the system to decrease the force difference. 87
88 List of symbols A mm Cross section area A m Projected area of payload A mm Effective area of wire b Damping of contact C - Drag force coefficient D D,, Motor displacement Pump displacement d mm Hose diameter d mm Drum diameter d mm Drum length d mm Wire diameter E Effective modulus for a steel cable F Hz Response frequency F N Buoyancy force F N Drag force F N Lower wire force F N Payload force f Hz Wave frequency F N Upper wire force F N Wire force g Gravity I kgm Drum inertia (Mass moment of inertia) i - Gear ratio k Spring stiffness L m Total length of wire L m Length of wire on each layer on winch L m Total length of wire used when hoisting and lowering on test L m Wire elongation MBL N Minimum breaking load m kg Drum mass m kg Lower wire mass m kg Payload mass m kg Upper wire mass 88
89 m Wire mass m kg Wire load n rpm Motor speed n rpm Pump speed n - Number of turns on wire p bar Max pressure in system PCD mm Pitch circle diameter p bar Constant tension pressure setting P W Power delivered by the pump Q Q Q Q,, Max flow of the control valve group [CVG] Motor flow Pump flow Flow in hoses m Outer radius of the winch m Inner radius of the winch S - Safety factor Nm Motor moment T Nm Winch moment T Nm Gear moment T ms Step response time t s Simulation time t mm Winch thickness T s Period time v v v v v(t) v ω ω ω Speed of upper wire mass Speed of lower wire mass Speed of system flow Speed of payload Heave velocity Wire elongation rate Bandwidth frequency Angular velocity of motor Angular velocity of pump x m Position of lower wire mass 89
90 x m Position of upper wire mass x m Initial displacement of payload y(t) m Heave travel Z m Wave amplitude η - Mechanical hydraulic efficiency for gear η - Mechanical hydraulic efficiency for motor η - Volumetric efficiency for motor η - Volumetric efficiency for pump ρ Density of water Damping ratio 90
91 Bibliography [1], S. Grant Christison. Constant tension. Germany: Patent 4,624, September [2]. Marine brochure < [3]. Styreventiler, virkemåte og bruk. Brautaset, Knut. Innføring i oljehydraulikk. Oslo: Universitetsforlaget, [4]. Styre og regulerings komponenter. Kjølle, Arne. Oljehydraulikk. Trondheim: Tapir trykk, [5]. Notes MAS402. Hansen, Michael Rygaard and Torben Ole Andersen. Hydraulic components and Systems. Grimstad: UIA, [6]. Changes in lengths of axially loaded members. Gere, James M and Barry J Goodno. Mechanics of materials, seventh edition [7]. Section Nise, Norman S. Control System Engineering. California State Polytechnic University, Pomona: John Wiley & Sons, Inc, [8]. Response speed and closed-loop frequency response. Nise, Norman S. Control System Engineering, fith edition. California State Polytechic University, Pomona: John Wiley & Sons, Inc, pp [9], Nise, Norman S. Applying the Nyquist criterion to determine the stability. Nise, Norman S. Control System Engineering, fifth edition. California State Polytechnic University, Pomona: John Wiley & Sons, Inc, pp
92 List of figures Fig 2.1 Main symbol of the RVIA-LCN and the placing in the motor block Fig 2.2 Cross section of the RVIA-LCN valve with its connections and different elements Fig 2.3 Hydraulic flow diagram showing the working principle of the RVIA-LCN Fig 2.4 Cross section view with RVIA-LCN with the pilot operated valve in closed position Fig 2.5 Cross section view of the RVIA-LCN with the pilot-to-open valve in closed position Fig 2.6 Cross section view of the RVIA-LCN with the pilot-to-open valve in open position Fig 2.7 Pressure relief valve used for constant tension system with inverse function Fig 2.8 In CT mode the right position of the spool valve number 4 is activated Fig 3.1 Hydraulic flow diagram of the winch, motors and the motor blocks Fig 3.2 Hydraulic flow diagram of the main control valve system Fig 3.3 Direction of the flow when load is falling down Fig 3.4 Direction of the flow when winch is hoisting the load Fig 4.1 Force analysis of the mechanical load situation Fig 4.2 Step response and bode plot of the main spool valve Fig 4.3 Nyquist diagram and RootLocus plot of the main spool valve Fig 5.1 Mechanical system and its working principles Fig 5.2 Pressure cut off valve and the pump pressure compensator Fig 5.3 CT on/off valve Fig 5.4 Updated flow diagram with winch system and main control system described earlier Fig 5.5 Placing of pressure transmitter PT Fig 5.6 The placing of the pressure transmitter on the right motor block Fig 5.7 Placing of flow sensor FT1 to port A on the right motor block Fig 5.8 Placing of flow sensor FT Fig 5.9 Power supply 24VDC connected to the PLC Fig 5.10 The load cell placed in centre of the wire sheave Fig 5.11 Analog input connections from the load cell and the pressure transmitters PT1-PT Fig 5.12 PR-card used as valve controllers for the CVG spool and the CTA valve Fig 5.13 The PLC fully connected with analog input and analog output signals Fig 5.14 Overview picture of electrical system Fig bit pulse encoder for measuring the angle of the winch Fig 5.16 Cog wheels and encoder mounted on drum Fig 5.17 Working principles for the joystick Fig 5.18 Button used for reset the encoder Fig 5.19 Power supply and Profibus cable connected to PLC Fig 5.20 LS pump pressure needs to be switched on to give system pressure Fig 5.21 Reset angular encoder on winch Fig 5.22 CT on/off valve (3-way valve) to activate PIL2 ports Fig 5.23 Joystick with operating buttons for CT-system Fig 5.24 Hydraulic power unit (HPU) Fig 5.25 Pressure compensator and pressure cut off valve being controlled by the ball valve Fig 5.26 CT on/off valve (3-way valve) Fig 5.27 CT adjust valve Fig 5.28 Restriction with diameter 2mm and length close to zero mm Fig 5.29 Joystick with button operations Fig 5.30 Hydraulic pump with pressure compensator and pressure cut of valve (safety valve) Fig 5.31 CVG valve with the compensator adjust screw and A/B port connections Fig 6.1 Mechanical system in SimulationX
93 Fig 6.2 Payload and heave travel of the mechanical system Fig 6.3 Payload and payload velocity of the mechanical system Fig 6.4 Wire force of the mechanical system Fig 6.5 Compensator function model Fig 6.6 Working principle of the CVG compensator Fig 6.7 Pressure drop over the main edge (P-A) Fig 6.8 System flow at Q=382 l/min Fig 6.9 Working principle of the CVG compensator Fig 6.10 Pressure drop over the main edge at Q=1000 l/min Fig 6.11 System flow at Q=1000 l/min Fig 6.12 Motor block right side, updated model for test Fig 6.13 SUN-RVIA valve modeled in SimulationX Fig 6.14 CVG with compensator Fig 6.15 Pipes and hoses connecting the CVG group with the motor blocks Fig 7.1 Winch position, 3 ton test Fig 7.2 Winch speed, 3 ton test Fig 7.3 System pressures, 3 ton Fig 7.4 System flows, 3 ton Fig 7.5 Wire forces, 3 ton Fig 7.6 Winch position, 5 ton test Fig 7.7 Winch speed, 5 ton test Fig 7.8 System pressures, 5 ton Fig 7.9 System flows, 5 ton Fig 7.10 Wire forces, 5 ton test Fig 7.11 Winch position, 7 ton Fig 7.12 Winch speed, 7 ton Fig 7.13 System pressures, 7 ton Fig 7.14 System flows, 7 ton Fig 7.15 Wire forces, 7 ton test Fig 7.16 Rotational mechanics with preset Fig 7.17 Input into the preset block Fig 8.1 Comparison of flow between test and SimulationX Fig 8.2 Results from PT Fig 8.3 Pressure sensor 2, in front of the motor Fig 8.4 Pressure sensor 3, after motor Fig 8.5 Pressure sensor 4: SUN RIVA pilot pressure
94 List of tables Tab 2.1 Technical information the RVIA-LCN Tab 2.2 Overview of the ports in the 2-way valve Tab 2.3 Technical information of the constant tension adjust valve Tab 2.4 Technical information CVG Tab 2.5 Technical information main spool Tab 3.1 Three possible system states in CT Tab 4.1 Calculation of parameters given this system Tab 4.2 Parameters used for calculation Tab 4.3 Calculation of the pitch circle diameter (PCD) Tab 4.4 Calculation of the wire length on each layer Tab 4.5 Calculation of the total length of wire used on the winch Tab 4.6 Calculation of the winch moment Tab 4.7 Calculation of the gear moment with respect to the number of gears Tab 4.8 Calculation of the motor moment for each motor Tab 4.9 Calculation of the winch inertia Tab 4.10 Pressure in the system on different layers Tab 4.11 Parameters for the step response, found in matlab Tab 5.1 Technical information of pressure transmitters Tab 5.2 Technical information of flow sensor FT Tab 5.3 Technical information of flow sensor FT Tab 5.4 Technical information of the power supply Tab 5.5 Technical information of the load cell in the centre of the upper wire sheave Tab 5.6 Technical information of the drum encoder Tab 5.7 Pre start-up checks for the winch system Tab 5.8 Test procedure for the winch system Tab 5.9 CVG technical information
95 Appendix A The hydraulic flow diagram is listed on the following page.
96
97 Appendix B A diagram view of the Simulation X model is listed on the next page.
98 1/ SimulationX Diagram View hydsys10 Henrik
99 1/ SimulationX Diagram View System_mech Henrik
100 Appendix C The following pages contain datasheets for the most important valves and components for the system.
101 Technical Features RV*A Pilot Operated, Vented Relief Valve Port 1 - Inlet Port 2 - Outlet Port 3 - Vent 3 2 way - 2 position Solenoid Valve (closed) 2 1 Third port between main stage and pilot element used for remote control or unloading. Pressure at port 2 is directly additive to valve setting. Spool leakage at 1000 psi (70 bar) is 30 to 80 cc/min. depending on frame size. Full adjustment range is achieved in 5 complete turns. Valves may be ordered with specified pressure setting Sun Hydraulics Corporation Relief Locator Technical Features Model Code Technical Tips Circuit Demo
102 Basic Operation RV*A Pilot Operated, Vented Relief Valve Port 1 - Inlet Port 2 - Outlet Port 3 - Vent Click to de-energize 2 way - 2 position Solenoid Valve (closed) Normally closed position Solenoid valve is closed Legend: Relief Pressure Tank Pressure Operating Pressure Operating pressure at ports 1 and 3. Tank pressure at port 2. Slide 1 of Sun Hydraulics Corporation Relief Locator Technical Features Model Code Technical Tips Circuit Demo
103 Basic Operation RV*A Pilot Operated, Vented Relief Valve Port 1 - Inlet Port 2 - Outlet Port 3 - Vent 2 way - 2 position Solenoid Valve (closed) Pressure relief position Differential pressure across piston orifice causes valve to open. Relief flow from port 1 to port 2. Relief Pressure at port 1. Tank pressure at port Sun Hydraulics Corporation Relief Locator Technical Features Model Code Technical Tips Circuit Legend: Relief Pressure Tank Pressure Operating Pressure Demo Slide 2 of 4
104 Basic Operation RV*A Pilot Operated, Vented Relief Valve Port 1 - Inlet Port 2 - Outlet Port 3 - Vent Click to energize 2 way - 2 position Solenoid Valve (open) Vented position Solenoid valve is open. Legend: Relief Pressure Tank Pressure Operating Pressure Area behind piston is vented. Vent pressure at port 3. Tank pressure at port 1 and Sun Hydraulics Corporation Relief Locator Technical Features Model Code Technical Tips Circuit Demo Slide 3 of 4
105 Basic Operation RV*A Pilot Operated, Vented Relief Valve Port 1 - Inlet Port 2 - Outlet Port 3 - Vent Click to de-energize 2 way - 2 position Solenoid Valve (closed) Normally closed position Solenoid valve is closed Legend: Relief Pressure Tank Pressure Operating Pressure Operating pressure at ports 1 and 3. Tank pressure at port 2. Slide 4 of Sun Hydraulics Corporation Relief Locator Technical Features Model Code Technical Tips Circuit Demo

106
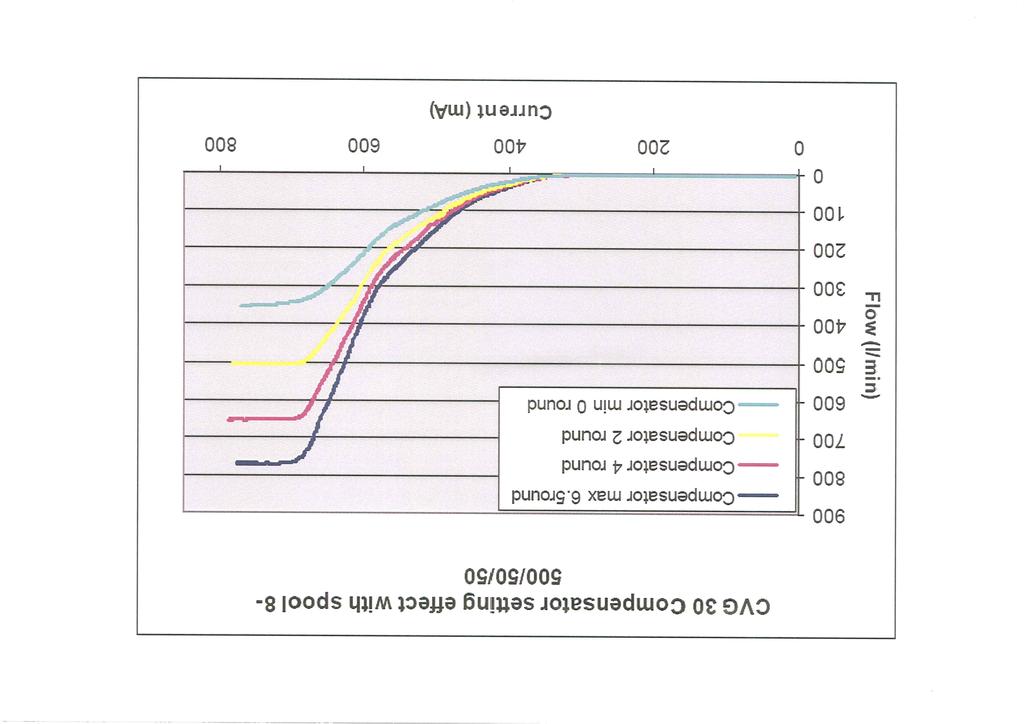
107
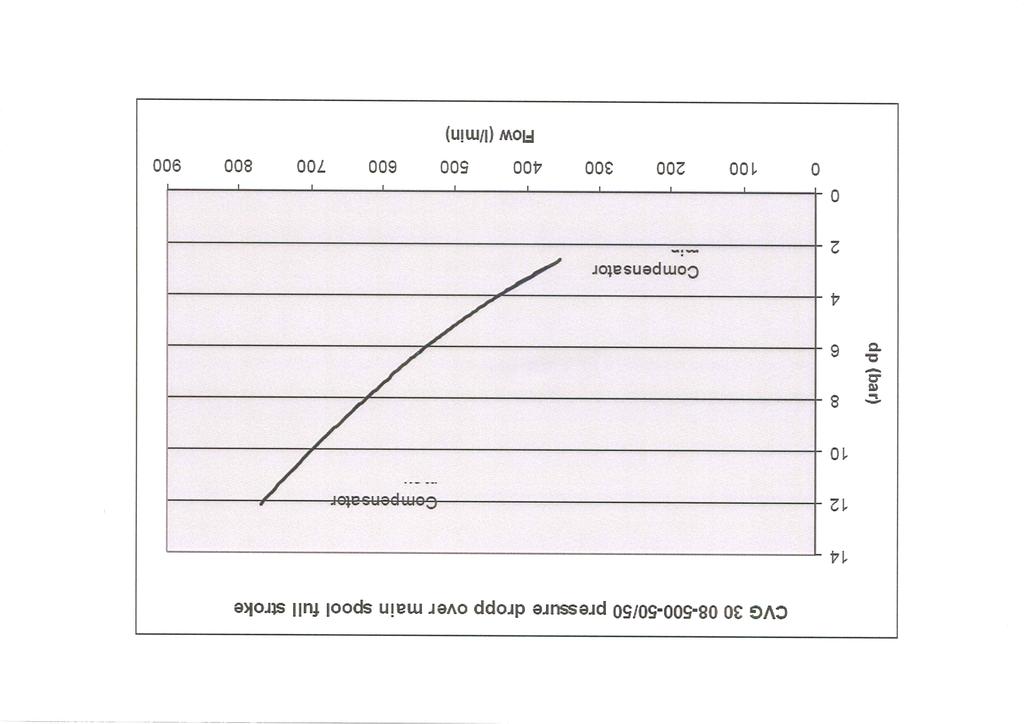
108
Priority (Swing) Motors Data and Specifications
 Motors Data and Specifications") s Data and Specifications Specifications HMF 55 HMF 75 HMF 105 cm 3/rev in 3/rev 55 3.36 75 4.57 105 6.40 Pressure Ratings Nominal 5000 PSIG Maximum 6090 PSIG Peak 7250 PSIG Operating Speed Maximum 4100
s Data and Specifications Specifications HMF 55 HMF 75 HMF 105 cm 3/rev in 3/rev 55 3.36 75 4.57 105 6.40 Pressure Ratings Nominal 5000 PSIG Maximum 6090 PSIG Peak 7250 PSIG Operating Speed Maximum 4100
Irrigation &Hydraulics Department lb / ft to kg/lit.
 CAIRO UNIVERSITY FLUID MECHANICS Faculty of Engineering nd Year CIVIL ENG. Irrigation &Hydraulics Department 010-011 1. FLUID PROPERTIES 1. Identify the dimensions and units for the following engineering
Fixed Displacement Motor A4FM
 Fixed Displacement Motor 4FM RE 91 12/4. replaces: 3.95 and RE 91 1 for open and closed circuits Sizes 22...5 Series 1, Series 3 Nominal pressure up to bar Peak pressure up to 45 bar Index Features 1 Ordering
Variable Displacement Double Pump A20VO. Series 1, for open circuits Axial piston - swashplate design, Back to back - design
 Brueninghaus Hydromatik Series 1, for open circuits Axial piston - swashplate design, Back to back - design RE 93100/02.97 Sizes 60...260 Nominal Pressure up to 350 bar Peak Pressure up to 400 bar Preliminary
INTERNATIONAL JOURNAL OF ENGINEERING SCIENCES & RESEARCH TECHNOLOGY Dynamic Model of Pressure Regulating Valve Ahmed Abed *
 IJESRT INTERNATIONAL JOURNAL OF ENGINEERING SCIENCES & RESEARCH TECHNOLOGY Dynamic Model of Pressure Regulating Valve Ahmed Abed * Automotive and Marine Engineering Department/ Collage of Technological
Dual displacement motor A10VM Plug-in dual displacement motor A10VE for open and closed circuit applications
 Replaces: 04.95 Dual displacement motor 10VM Plug-in dual displacement motor 10VE for open and closed circuit applications Size 28-60 Series 5 Nominal pressure 280 bar Peak pressure 350 bar 10VM Contents
Fixed Displacement Pump KFA for commercial vehicles in open circuits
 RE 91 501/05.98 Replaces: 11.96 Fixed Displacement Pump KFA for commercial vehicles in open circuits Sizes 23...107 Series 6 Nominal pressure 300 bar Peak pressure 350 bar KFA List of contents Features
Fixed Displacement Plug-In Motor A2FE
 www.phphyds.com Series 6, axial tapered piston, bent axis design for mounting in mechanical gearboxes Sizes 28...355 Nom. Pressure up to 400 bar Peak Pressure up to 450 bar he fixed displacement plug-in
Fixed Displacement Motor A4FM
 Industrial Hydraulics Electric Drives and Controls Linear Motion and ssembly echnologies Pneumatics Service utomation Mobile Hydraulics Fixed Displacement Motor 4FM RE 91 12/4. replaces: 3.95 and RE 91
Axial piston pumps type PVC
 www.atos.com Table TA16SK-1/E Axial piston pumps type PV variable displacement, by a full line of mechanical controls PV are variable displacement axial piston pumps for medium pressure operation, low
6000SLX HYDRAULIC CRAWLER CRANE
 HYDRAULIC CRAWLER CRANE HYDRAULIC CRAWLER CRANE Contents Specifications 3-4 Symbols 4 Outline Winch Assingment 5 Dimensions & Main Specifications : Liftcrane 6 Dimensions & Main Specifications : Luffing
PHYS 101 Previous Exam Problems
 PHYS 101 Previous Exam Problems CHAPTER 14 Fluids Fluids at rest pressure vs. depth Pascal s principle Archimedes s principle Buoynat forces Fluids in motion: Continuity & Bernoulli equations 1. How deep
VPPL VARIABLE DISPLACEMENT AXIAL-PISTON PUMPS FOR INTERMEDIATE PRESSURE SERIES 10
 / ED VPPL VARIABLE DISPLACEMENT AXIAL-PISTON PUMPS FOR INTERMEDIATE PRESSURE SERIES OPERATING PRINCIPLE The VPPL are variable displacement axial-piston pumps with variable swash plate, suitable for applications
Pressure on Demand. Air Pressure Amplifiers
 Pressure on Demand Air Pressure Amplifiers Introduction Haskel air pressure amplifiers offer the most comprehensive range in the industry combining simple principles of operation with rugged construction
09 - Choosing /sizing a cylinder and valve
 - Choosing /sizing a cylinder and valve - Pipe flow resistence - Valve sizing - Cylinder sizing LII PIPE FLOW RESISTENCE Flow rate Qn Flow rate is calculated as the volume at normal conditions ( atmospheric
To plot the following performance characteristics; A pump is a device, which lifts water from a lower level to a higher
 LABORATORY MANUAL ON RECIPROCATING PUMP TEST RIG Prepared By Prof. (Dr.) M. K. Roul Professor and Principal Department of Mechanical Engineering Gandhi Institute for Technological Advancement (GITA), Bhubaneswar-752054
6000SLX SL-N HYDRAULIC CRAWLER CRANE
 SL-N SL-N HYDRAULIC CRAWLER CRANE 1804 05H.EA292 SL-N Specifications Contents Specifications 3-4 Symbols 4 Outline Winch Assignment 5 Dimensions & Main Specifications : Liftcrane 6 Dimensions & Main Specifications
Displacement 12, , Maximum flow rate (at 1450 rpm) bar.
 bar.") 00/07 ED PVD VARIABLE DISPLACEMENT VANE PUMPS SERIES 0 OPERATING PRINCIPLE The PVD pumps are variable displacement vane pumps with a mechanical type of pressure compensator. They allow instantaneous adjustment
00/07 ED PVD VARIABLE DISPLACEMENT VANE PUMPS SERIES 0 OPERATING PRINCIPLE The PVD pumps are variable displacement vane pumps with a mechanical type of pressure compensator. They allow instantaneous adjustment
Gerald D. Anderson. Education Technical Specialist
 Gerald D. Anderson Education Technical Specialist The factors which influence selection of equipment for a liquid level control loop interact significantly. Analyses of these factors and their interactions
Experiment Instructions. Circulating Pumps Training Panel
 Experiment Instructions Circulating Pumps Training Panel Experiment Instructions This manual must be kept by the unit. Before operating the unit: - Read this manual. - All participants must be instructed
Unit 24: Applications of Pneumatics and Hydraulics
 Unit 24: Applications of Pneumatics and Hydraulics Unit code: J/601/1496 QCF level: 4 Credit value: 15 OUTCOME 2 TUTORIAL 9 ACCUMULATORS The material needed for outcome 2 is very extensive so there are
The Discussion of this exercise covers the following points:
 Exercise 3-2 Orifice Plates EXERCISE OBJECTIVE In this exercise, you will study how differential pressure flowmeters operate. You will describe the relationship between the flow rate and the pressure drop
OMS Technical Information. Versions OMS. Versions
 Versions Versions Mounting flange Shaft Port size European version US version Drain connection Check valve Main type designation Standard flange Cyl. 32 G 1/2 l Yes Yes Cyl. 1.25 in 7/8-14 UNF l Yes Yes
Axial piston pumps type PVC
 www.atos.com Table TA16-1/E Axial piston pumps type PV variable displacement, by a full line of mechanical controls PV are variable displacement axial piston pumps for medium pressure operation, low noise
Exercise 2-3. Flow Rate and Velocity EXERCISE OBJECTIVE C C C
 Exercise 2-3 EXERCISE OBJECTIVE C C C To describe the operation of a flow control valve; To establish the relationship between flow rate and velocity; To operate meter-in, meter-out, and bypass flow control
Lab 4: Root Locus Based Control Design
 Lab 4: Root Locus Based Control Design References: Franklin, Powell and Emami-Naeini. Feedback Control of Dynamic Systems, 3 rd ed. Addison-Wesley, Massachusetts: 1994. Ogata, Katsuhiko. Modern Control
Tutorial. BOSfluids. Relief valve
 Tutorial Relief valve The Relief valve tutorial describes the theory and modeling process of a pressure relief valve or safety valve. It covers the algorithm BOSfluids uses to model the valve and a worked
The Estimation Of Compressor Performance Using A Theoretical Analysis Of The Gas Flow Through the Muffler Combined With Valve Motion
 Purdue University Purdue e-pubs International Compressor Engineering Conference School of Mechanical Engineering The Estimation Of Compressor Performance Using A Theoretical Analysis Of The Gas Flow Through
LECTURE 20 FLOW CONTROL VAVLES SELF EVALUATION QUESTIONS AND ANSWERS
 LECTURE 20 FLOW CONTROL VAVLES SELF EVALUATION QUESTIONS AND ANSWERS 1: A cylinder has to exert a forward thrust of 150 kn and a reverse thrust of 15 kn. The effects of using various methods of regulating
Instruction Manual. Pipe Friction Training Panel
 Instruction Manual HL 102 Pipe Friction Training Panel 100 90 80 70 60 50 40 30 20 10 HL 102 Instruction Manual This manual must be kept by the unit. Before operating the unit: - Read this manual. - All
LINDGREN-PITMAN, INC. LS-3 / LS-4 Line Setter
 LINDGREN-PIAN, INC. LS-3 / LS-4 Line Setter MOUNTING The Lindgren-Pitman Line Setter should be mounted on or near the transom of the boat such that the line will fall overboard as it leaves the exit. The
FLUID POWER FLUID POWER EQUIPMENT TUTORIAL ACCUMULATORS. This work covers part of outcome 2 of the Edexcel standard module:
 FLUID POWER FLUID POWER EQUIPMENT TUTORIAL ACCUMULATORS This work covers part of outcome 2 of the Edexcel standard module: UNIT 21746P APPLIED PNEUMATICS AND HYDRAULICS The material needed for outcome
Basic Hydraulics. Module 4: Flow Control Valves & Pressure Relief Valves. Academic Services PREPARED BY. January 2012
 Basic Hydraulics Module 4: Flow Control Valves & Pressure Relief Valves PREPARED BY Academic Services January 2012 Applied Technology High Schools, 2011 ATM 1122 Basic Hydraulics Module 4: Flow control
Introduction. Part one: Identify the Hydraulic Trainer Components
 The University Of Jordan School of Engineering Mechatronics Engineering Department Fluid Power Engineering Lab Experiments No.4 Introduction to Hydraulic Trainer Objective: Students will be able to identify
Inverse Prop. Pressure-Relief Cart., Size 2 4
 Inverse Prop. Pressure-Relief Cart., Size Q max = l/min (6 gpm), p max = bar (58 psi) Direct acting, electrically operated Description inverse proportional pressure-relief valves are direct acting screw-in
1 LS unloading (control valve, orifice, none) 2 LS max pressure relief. 3 Spool type
 2 LS max pressure relief. 3 Spool type") Flow Control Valve Series LVM.. high flow rates (8 l/min) flow rates are unaffected by temperature change or when the higher load pressure alternates between the outlet ports proportional flow-sharing
Flow Control Valve Series LVM.. high flow rates (8 l/min) flow rates are unaffected by temperature change or when the higher load pressure alternates between the outlet ports proportional flow-sharing
The Discussion of this exercise covers the following points: Range with an elevated or suppressed zero Suppressed-zero range Elevated-zero range
 Exercise 4-3 Zero Suppression and Zero Elevation EXERCISE OBJECTIVE In this exercise, you will learn the effect that mounting a pressure transmitter above or below the reference level has on the hydrostatic
Leak free Pipe Rupture Valve for Excavators
 Leak free Pipe Rupture Valve for xcavators Series motion and progress Reference: 3 P 9575 1/11.6 Classification: 43.325.355...325.35 1/17 Contents Page 1 General description................................................................
6000SLX SL-T HYDRAULIC CRAWLER CRANE
 SL-T SL-T HYDRAULIC CRAWLER CRANE 1804 05H.EA293 SL-T Specifications Contents Specifications 3-4 Symbols 4 Outline Winch Assignment 5 Dimensions & Main Specifications : Liftcrane 6 Dimensions & Main Specifications
G.C.E (A/L) Examination March In collaboration with
 Examination March In collaboration with") ; G.C.E (A/L) Examination March - 2018 Conducted by Field Work Centre, Thondaimanaru In collaboration with FWC Provincial Department of Education Northern Province Grade:- 12 (2019) Physics Part - II Structured
; G.C.E (A/L) Examination March - 2018 Conducted by Field Work Centre, Thondaimanaru In collaboration with FWC Provincial Department of Education Northern Province Grade:- 12 (2019) Physics Part - II Structured
RATE CONTROL SYSTEM FOR SOUNDING ROCKETS
 RATE CONTROL SYSTEM FOR SOUNDING ROCKETS Josef Ettl, Johann Pfänder German Aerospace Center (DLR), D-834 Wessling, Germany e-mail: josef.ettl@dlr.de johann.pfaender@dlr.de, 1. ABSTRACT DLR/Moraba has a
Proportional Pressure-Relief Cartridge Valve, Size 2...4
 Proportional Pressure-Relief Cartridge Valve, Size... Q max = l/min (6 gpm), p max = bar (58 psi) Direct acting, electrically operated Description proportional pressure-relief valves are direct acting
International Journal of Technical Research and Applications e-issn: , Volume 4, Issue 3 (May-June, 2016), PP.
, PP.") DESIGN AND ANALYSIS OF FEED CHECK VALVE AS CONTROL VALVE USING CFD SOFTWARE R.Nikhil M.Tech Student Industrial & Production Engineering National Institute of Engineering Mysuru, Karnataka, India -570008
DESIGN AND ANALYSIS OF FEED CHECK VALVE AS CONTROL VALVE USING CFD SOFTWARE R.Nikhil M.Tech Student Industrial & Production Engineering National Institute of Engineering Mysuru, Karnataka, India -570008
Axial piston pumps type PVPY-C (-R, -L) variable displacement, with mechanical controls obsolete components - availability on request
 variable displacement, with mechanical controls obsolete components - availability on request") www.atos.com Table TA60obs/E Axial piston pumps type PVPY- (-R, -) variable displacement, with mechanical controls obsolete components - availability on request PVPY are variable displacement axial piston
www.atos.com Table TA60obs/E Axial piston pumps type PVPY- (-R, -) variable displacement, with mechanical controls obsolete components - availability on request PVPY are variable displacement axial piston
ALL TERRAIN CRANE AR-1200M-1
 ALL TERRAIN RANE AR-12M JAPANESE SPEIFIATIONS ARRIER MODEL FAUN RTF12-5 SPE. NO. AR-12M-1 AR ontrol No. JA-3-279 - Return to INDEX AR-12M RANE SPEIFIATIONS RANE APAITY 12.2m Boom 12,kg at 2.7m (17part-line)
DNVGL-CP-0187 Edition March 2016
 CLASS PROGRAMME Type approval DNVGL-CP-0187 Edition March 2016 The electronic pdf version of this document, available free of charge from http://www.dnvgl.com, is the officially binding version. FOREWORD
Inverse Proportional Pressure-Relief Cart., Size 2 4
 Inverse Proportional Pressure-Relief Cart., Size Q max = l/min, p max = 35 bar Direct acting, electrically operated Description Compact construction for cavity type AL 3/-6 UNF Operated by a proportional
Fail Operational Controls for an Independent Metering Valve
 Group 14 - System Intergration and Safety Paper 14-3 465 Fail Operational Controls for an Independent Metering Valve Michael Rannow Eaton Corporation, 7945 Wallace Rd., Eden Prairie, MN, 55347, email:
Experimental Investigation on Transient Response of Two Stage Pressure Relief Valve
 Experimental Investigation on Transient Response of Two Stage Pressure Relief Valve Prof. Basavaraj V.HUBBALLI 1, Dr. Vilas B.SONDUR 2 1 Jain College of Engineering, Belagavi Karnataka, India, bvhubliabhi@gmail.com
Impact of Passive Heave Compensator on Offshore Lifting
 Journal of Shipping and Ocean Engineering 5 (2015) 166-180 doi: 10.17265/2159-5879/2015.04.003 D DAVID PUBLISHING Impact of Passive Heave Compensator on Offshore Lifting Arvind Keprate Department of Mechanical
Brueninghaus Hydromatik Rexroth A11VLO pump and A11VO pump
 Brueninghaus Hydromatik Rexroth A11VLO pump and A11VO pump www.hydpump.com A11VLO40, A11VLO60, A11VLO75, A11VLO95, A11VLO130, A11VLO145, A11VLO190, A11VLO260. A11VO40, A11VO60, A11VO75, A11VO95, A11VO130,
Inverse Proportional Pressure-Relief Cartridge, Size 10
 Inverse Proportional Pressure-Relief Cartridge, Size 1 Q max = 12 l/min, p max = 3 bar Seated pilot, spool-type main stage, damped design 1 Description inverse-proportional pressure-relief valves are size
(Refer Slide Time: 0:26)
") Fundamentals of Industrial Oil Hydraulics and Pneumatics By Professor R. Maiti Department of Mechanical Engineering Indian Institute of Technology, Kharagpur Module03 Lecture08 Different Types of Valves-
Fundamentals of Industrial Oil Hydraulics and Pneumatics By Professor R. Maiti Department of Mechanical Engineering Indian Institute of Technology, Kharagpur Module03 Lecture08 Different Types of Valves-
Components for air preparation and pressure adjustment. OUT port position ( ) connected Rear side. of IN port. Air tank. directly.
 connected Rear side. of IN port. Air tank. directly.") Components preparation and pressure adjustment ABP Overview ABP is a component that enables boosting by s only up to twice primary pressure (.0MPa max.) in combination with using air tank but not using
Components preparation and pressure adjustment ABP Overview ABP is a component that enables boosting by s only up to twice primary pressure (.0MPa max.) in combination with using air tank but not using
1. A tendency to roll or heel when turning (a known and typically constant disturbance) 2. Motion induced by surface waves of certain frequencies.
 2. Motion induced by surface waves of certain frequencies.") Department of Mechanical Engineering Massachusetts Institute of Technology 2.14 Analysis and Design of Feedback Control Systems Fall 2004 October 21, 2004 Case Study on Ship Roll Control Problem Statement:
Department of Mechanical Engineering Massachusetts Institute of Technology 2.14 Analysis and Design of Feedback Control Systems Fall 2004 October 21, 2004 Case Study on Ship Roll Control Problem Statement:
FLUID POWER FLUID POWER EQUIPMENT TUTORIAL OTHER FLUID POWER VALVES. This work covers part of outcome 2 of the Edexcel standard module:
 FLUID POWER FLUID POWER EQUIPMENT TUTORIAL OTHER FLUID POWER VALVES This work covers part of outcome 2 of the Edexcel standard module: UNIT 21746P APPLIED PNEUMATICS AND HYDRAULICS The material needed
Chapter 9 Fluids and Buoyant Force
 Chapter 9 Fluids and Buoyant Force In Physics, liquids and gases are collectively called fluids. 3/0/018 8:56 AM 1 Fluids and Buoyant Force Formula for Mass Density density mass volume m V water 1000 kg
Proportional Pressure-Relief Cartridge Valve, Size 2...4
 Proportional Pressure-Relief Cartridge Valve, Size... Q max = l/min, p max = 3 bar Direct acting, electrically operated 1 Description proportional pressure-relief valves are direct acting screw-in cartridges
Load Controls Screw In Cartridge Valves Pressures to 350 bar (5000 psi) Flows to 190 l/min (50 USgpm)
 Flows to 190 l/min (50 USgpm)") Vickers Cartridge Valves Load Controls Screw In Cartridge Valves Pressures to 50 bar (5000 psi) Flows to 90 l/min (50 USgpm) Rev. 2/99 722 Contents MODEL DESCRIPTION TYP. APPLICATION PRESSURE bar (psi)
Vickers Cartridge Valves Load Controls Screw In Cartridge Valves Pressures to 50 bar (5000 psi) Flows to 90 l/min (50 USgpm) Rev. 2/99 722 Contents MODEL DESCRIPTION TYP. APPLICATION PRESSURE bar (psi)
BUBBLER CONTROL SYSTEM
 BUBBLER CONTROL SYSTEM Description: The HDBCS is a fully automatic bubbler system, which does liquid level measurements in water and wastewater applications. It is a dual air compressor system with, air
1. All fluids are: A. gases B. liquids C. gases or liquids D. non-metallic E. transparent ans: C
 Chapter 14: FLUIDS 1 All fluids are: A gases B liquids C gases or liquids D non-metallic E transparent 2 Gases may be distinguished from other forms of matter by their: A lack of color B small atomic weights
INSTRUMENT INSTRUMENTAL ERROR (of full scale) INSTRUMENTAL RESOLUTION. Tutorial simulation. Tutorial simulation
 INSTRUMENTAL RESOLUTION. Tutorial simulation. Tutorial simulation") Lab 1 Standing Waves on a String Learning Goals: To distinguish between traveling and standing waves To recognize how the wavelength of a standing wave is measured To recognize the necessary conditions
Lab 1 Standing Waves on a String Learning Goals: To distinguish between traveling and standing waves To recognize how the wavelength of a standing wave is measured To recognize the necessary conditions
ANTI SHOCK RELIEF VALVE
 ANTI SHOCK RELIEF VALVE Wheeler Road Coventry CV3 4LA England Brüsseler Allee 2 D-41812 Erkelenz Tel. +44(0)2476-217-400 Fax +44(0)2476-217-488 Tel. +49(0)24 31-80 91-0 Fax +49(0)24 31-80 91-19 www.sunhydraulics.com
Variable Displacement Pump A10VO
 Brueninghaus Hydromatik Variable Displacement Pump A1VO Series 5, open circuits, SAE-Version Axialpiston, swash plate design size 28 6 Nominal pressure 2 bar Peak pressure 315 bar RE 9273/4.96 replaces
. In an elevator accelerating upward (A) both the elevator accelerating upward (B) the first is equations are valid
 both the elevator accelerating upward (B) the first is equations are valid") IIT JEE Achiever 2014 Ist Year Physics-2: Worksheet-1 Date: 2014-06-26 Hydrostatics 1. A liquid can easily change its shape but a solid cannot because (A) the density of a liquid is smaller than that of
IIT JEE Achiever 2014 Ist Year Physics-2: Worksheet-1 Date: 2014-06-26 Hydrostatics 1. A liquid can easily change its shape but a solid cannot because (A) the density of a liquid is smaller than that of
Lecture 19 PRESSURE-CONTROL VALVES [CONTINUED]
![Lecture 19 PRESSURE-CONTROL VALVES [CONTINUED]](/thumbs/76/73283391.jpg "Lecture 19 PRESSURE-CONTROL VALVES [CONTINUED]") Lecture 19 PRESSURE-CONTROL VLVES [CONTINUED] 1.5 Counterbalance Valve Schematic diagram of counterbalance valve is shown in Fig. 1.14. These normally closed valves are primarily used to maintain a back
Lecture 19 PRESSURE-CONTROL VLVES [CONTINUED] 1.5 Counterbalance Valve Schematic diagram of counterbalance valve is shown in Fig. 1.14. These normally closed valves are primarily used to maintain a back
ITTC Recommended Procedures and Guidelines
 Page 1 of 6 Table of Contents 1. PURPOSE...2 2. PARAMETERS...2 2.1 General Considerations...2 3 DESCRIPTION OF PROCEDURE...2 3.1 Model Design and Construction...2 3.2 Measurements...3 3.5 Execution of
Product Guide. Crawler Crane
 Crawler Crane 220 US Tons (100 Metric Tons) @ 16 ft 5 in Radius 285 ft Max Tip (Main Boom) Main Boom, Fixed Jib and Luffing Jib Configurations Product Guide KEY FEATURES ULTRA CAB The Ultra Cab, designed
Tutorial 5 Relative equilibrium
 Tutorial 5 Relative equilibrium 1. n open rectangular tank 3m long and 2m wide is filled with water to a depth of 1.5m. Find the slope of the water surface when the tank moves with an acceleration of 5m/s
Inverse Proportional Pressure-Relief Cart., Size 2 4
 Inverse Proportional Pressure-Relief Cart., Size Q max = l/min, p max = 5 bar Direct acting, electrically operated 1 Description inverse proportional pressure-relief valves are direct acting screw-in cartridges
WATER HYDRAULIC SYSTEM FOR HIGH SPEED CYLINDER DRIVE
 OS3-3 Proceedings of the 7th JFPS International Symposium on Fluid Power, TOYAMA 2008 September 15-18, 2008 WATER HYDRAULIC SYSTEM FOR HIGH SPEED CYLINDER DRIVE Shigeru IKEO*, Hirotaka NAKASHIMA** and
The Discussion of this exercise covers the following points: Pumps Basic operation of a liquid pump Types of liquid pumps The centrifugal pump.
 Exercise 2-3 Centrifugal Pumps EXERCISE OBJECTIVE In this exercise, you will become familiar with the operation of a centrifugal pump and read its performance chart. You will also observe the effect that
Controllers DR, DP, FR and DFR
 Controllers DR, DP, FR and DFR RE 9060 Edition: 04.014 Replaces: 10.006 For variable pump A4VSO series 1 and 3 Open circuit Features Control of pressure and flow Remote controlled optional Pressure controller
SINGLE VALVE WITH LOW-FLOW BYPASS
 CONTROL VALVES Pressure Reducing Valve Sizing Guide Sizing pilot operated reducing valves is not a complicated process. It starts with determining requirements and following these guidelines in valve size
PRESSURE SURGES IN PIPELINES
 CHAPTER 4 PRESSURE SURGES IN PIPELINES 4.1 FEATURES OF PRESSURE SURGE In the past, water engineers were facing problems with repeated pipe bursts, failing seals etc. They termed the cause of failure as
WATER HYDRAULIC HIGH SPEED SOLENOID VALVE AND ITS APPLICATION
 WATER HYDRAULIC HIGH SPEED SOLENOID VALVE AND ITS APPLICATION Akihito MITSUHATA *, Canghai LIU *, Ato KITAGAWA * and Masato KAWASHIMA ** * Department of Mechanical and Control Engineering, Graduate school
Chapter 10: Bidirectional Flow Controls
 Chapter 10: Bidirectional Flow Controls Objectives Learn about the patented, bidirectional flow control valves. Understand how the flow force affects the performance of the ZL70-36. Learn why there is
5.0 Neutral Buoyancy Test
 5.0 Neutral Buoyancy Test Montgolfier balloons use solar energy to heat the air inside the balloon. The balloon used for this project is made out of a lightweight, black material that absorbs the solar
AIRMOUNT VIBRATION ISOLATION
 MOUNT VIBRATION ISOLATION SELECTION AND ISOLATION FORMULA Refer to the selection guide on page 33 for Airmount load and isolation capabilities. Follow this procedure: 1. LOAD CAPACITY Select one or two
Technical data Hydraulic lift crane. LR 1300 sx LR 1300
 Technical data Hydraulic lift crane LR 1300 sx LR 1300 Dimensions Basic machine with undercarriage R 9750 30 10350 6930 3000 LR 1300 2250 10 5000 1465 1700 8500 9650 42 1870 10 00 0 R 69 Optional: Flat
Simple Set. Pressure Independent Control Valves 2 Way 1/2-2
 The Bray Simple Set is a threaded pressure independent control (PIC) valve designed for a wide variety of hot water and chilled water control applications. The SS Series combines high rangeability control
Technical data Hydraulic lift crane LR 1300 SX
 Technical data Hydraulic lift crane LR 1300 SX Dimensions Basic machine with undercarriage R 9750 30 10350 6930 3000 2250 10 5000 1465 1700 8500 9650 42 1870 10 00 0 R 69 1485 00 365 85 1500 8300 0 Operating
Level MEASUREMENT 1/2016
 Level MEASUREMENT 1/2016 AGENDA 2 A. Introduction B. Float method C. Displacer method D. Hydrostatic pressure method E. Capacitance method G. Ultrasonic method H. Radar method I. Laser method J. Level
Lecture 26 HYDRAULIC CIRCUIT DESIGN AND ANALYSIS
 Lecture 6 HYDRAULIC CIRCUIT DESIGN AND ANALYSIS Example 1.14 Design a car crushing system. The crushing force required is such that a 15 cm diameter cylinder is required at a working pressure of 16.5 kg/cm.
Basic Pneumatics. Module 8: Pressure control valves. Academic Services PREPARED BY. April 2012
 Basic Pneumatics Module 8: Pressure control valves PREPARED BY Academic Services April 2012 Applied Technology High Schools, 2012 Module 8: Pressure control valves Module Objectives After the completion
CRITERIA OF BOW-DIVING PHENOMENA FOR PLANING CRAFT
 531 CRITERIA OF BOW-DIVING PHENOMENA FOR PLANING CRAFT Toru KATAYAMA, Graduate School of Engineering, Osaka Prefecture University (Japan) Kentarou TAMURA, Universal Shipbuilding Corporation (Japan) Yoshiho
BUBBLER CONTROL SYSTEM
 BUBBLER CONTROL SYSTEM Description: The LDBCS is a fully automatic bubbler system, which does liquid level measurements in water and wastewater applications. It is a dual air compressor system with, air
Chapter 13 Fluids. Copyright 2009 Pearson Education, Inc.
 Chapter 13 Fluids Phases of Matter Density and Specific Gravity Pressure in Fluids Atmospheric Pressure and Gauge Pressure Pascal s Principle Units of Chapter 13 Measurement of Pressure; Gauges and the
EXPERIMENT 1 AIR PRESSURE CONTROL SYSTEM
 EXPERIMENT 1 AIR PRESSURE CONTROL SYSTEM 1.0 OBJECTIVE To study the response of gas pressure control using PID controller. 2.0 INTRODUCTION TO THE APPARATUS a) The process plant consists of two air vessels
ISO INTERNATIONAL STANDARD
 INTERNATIONAL STANDARD ISO 10770-3 First edition 2007-10-15 Hydraulic fluid power Electrically modulated hydraulic control valves Part 3: Test methods for pressure control valves Transmissions hydrauliques
Rules for Classification and Construction Additional Rules and Guidelines 3 Machinery Installations
 VI Rules for Classification and Construction Additional Rules and Guidelines 3 Machinery Installations 6 Guidelines for the Construction, Equipment and Testing of Closed Fuel Oil Overflow Systems Edition
Logic Elements Screw-in Cartridge Valves Pressures to 290 bar (4200 psi) Flows to 303 l/min (80 USgpm)
 Flows to 303 l/min (80 USgpm)") Vickers artridge Valves Logic Elements Screw-in artridge Valves Pressures to 9 bar ( psi) Flows to l/min (8 USgpm) Revised 9/98 7 ontents MODEL DESRIPTION TYPIL PPLITION PRESSURE bar (psi) RTED FLOW l/min
Vickers artridge Valves Logic Elements Screw-in artridge Valves Pressures to 9 bar ( psi) Flows to l/min (8 USgpm) Revised 9/98 7 ontents MODEL DESRIPTION TYPIL PPLITION PRESSURE bar (psi) RTED FLOW l/min
View thousands of Crane Specifications on FreeCraneSpecs.com LR 1300 SX. Technical data Hydraulic lift crane LR 1300
 Technical data Hydraulic lift crane LR 1300 SX LR 1300 Dimensions Basic machine with undercarriage R 9750 30 10350 6930 3000 LR 1300 5000 2250 10 1465 1700 8500 9650 42 1870 10 00 0 R 69 Optional: Track
Old-Exam.Questions-Ch-14 T072 T071
 Old-Exam.Questions-Ch-14 T072 Q23. Water is pumped out of a swimming pool at a speed of 5.0 m/s through a uniform hose of radius 1.0 cm. Find the mass of water pumped out of the pool in one minute. (Density
Agood tennis player knows instinctively how hard to hit a ball and at what angle to get the ball over the. Ball Trajectories
 42 Ball Trajectories Factors Influencing the Flight of the Ball Nathalie Tauziat, France By Rod Cross Introduction Agood tennis player knows instinctively how hard to hit a ball and at what angle to get
1. Outline of the newly developed control technologies
 This paper describes a vertical lifting control and level luffing control design for newly developed, fully hydraulicdriven floating cranes. Unlike lattice boom crawler cranes for land use, the floating
AUTOMATIC DREDGING PROFILE AND CONTOUR CONTROL
 AUTOMATIC DREDGING PROFILE AND CONTOUR CONTROL Jay Wise 1 ABSTRACT Phillips and Jordan, a leading excavating and disaster recovery contractor, was faced with the challenge to manage a civil contract involving
Flow divider designs MTL
 H Y D R A U L I K Flow divider designs MTL Edition November 1999/2005 Jahns-Regulatoren GmbH D 63069 Offenbach Sprendlinger Landstraße 150 Telephon (069) 83 10 86 D 63009 Offenbach Postbox 10 09 52 Telefax
OIL SUPPLY SYSTEMS ABOVE 45kW OUTPUT 4.1 Oil Supply
 OIL SUPPLY SYSTEMS ABOVE 45kW OUTPUT 4.1 Oil Supply 4.1.1 General The primary function of a system for handling fuel oil is to transfer oil from the storage tank to the oil burner at specified conditions
Learning System for Automation and Communications. Hydraulics. Workbook Basic Level
 Learning System for Automation and Communications Hydraulics Workbook Basic Level 094468 Authorised applications and liability The Learning System for Automation and Communication has been developed and