Slope Stability Analysis Of Class I Landfills With Co Disposal Of Bios
|
|
|
- Whitney Maxwell
- 6 years ago
- Views:
Transcription

. Electronic Theses and Dissertations.")
1 University of Central Florida Electronic Theses and Dissertations Masters Thesis (Open Access) Slope Stability Analysis Of Class I Landfills With Co Disposal Of Bios 2004 Mrutyunjay Vajirkar University of Central Florida Find similar works at: University of Central Florida Libraries Part of the Civil Engineering Commons STARS Citation Vajirkar, Mrutyunjay, "Slope Stability Analysis Of Class I Landfills With Co Disposal Of Bios" (2004). Electronic Theses and Dissertations This Masters Thesis (Open Access) is brought to you for free and open access by STARS. It has been accepted for inclusion in Electronic Theses and Dissertations by an authorized administrator of STARS. For more information, please contact lee.dotson@ucf.edu.
2 SLOPE STABILITY ANALYSIS OF CLASS I LANDFILLS WITH CO DISPOSAL OF BIOSOLIDS USING FIELD TEST DATA by MRUTYUNJAY MOHAN VAJIRKAR B.E. Shivaji University, Kolhapur, Maharastra, 2000 A thesis submitted in partial fulfillment of the requirements for the degree of Master of Science in the Department of Civil and Environmental Engineering in the College of Engineering and Computer Science at the University of Central Florida Orlando, Florida Fall Term 2004
3 2004 Mrutyunjay Mohan Vajirkar ii
4 ABSTRACT Land filling provides a major, safe, and economical disposal route for biosolids and sludges. With an expanding world, the demand for larger and higher capacity landfills is rapidly increasing. Proper analysis and design on such fills have pushed the boundaries of geotechnical engineering practice, in terms of proper identification and assessment of strength and deformation characteristics of waste materials. The engineering properties of Municipal Solid Waste (MSW) with co-disposal of biosolids and sludges with regards to moisture characteristics and geotechnical stability are of utmost importance. Significant changes in the composition and characteristics of landfill may take place with the addition of sludges and biosolids. In particular, the stability of waste slopes needs to be investigated, which involves the evaluation of the strength properties of the mixture of the waste and biosolids. This thesis deals with impact of the addition of biosolids on the geotechnical properties of class I landfill as determined from field investigations. The geotechnical properties are evaluated using an in-situ deep exploration test, called the Cone Penetration Test (CPT). CPT provides a continuous log of subsurface material properties using two measuring mechanisms, namely, tip resistance and side friction. The areas receiving biosolids are compared with areas without, to evaluate the effect of landfilling of biosolids. The required geotechnical shear strength parameters (angle of internal friction and cohesion) of MSW and biosolids mixture are determined by correlation with CPT results similar to the procedure followed in evaluating soil properties. iii
5 The shear strength parameters obtained from the CPT data are then used to study the stability of different slope configurations of the landfill. The slope stability analysis is conducted on the various landfill models using the computer software SLOPE/W. This software was designed for soils but was found to be suitable for modeling landfills, as the waste is assumed to act similar to a cohesionless soil. Based on the field investigations, the angle of internal friction was found to be about 29 and the determination of any cohesion was not possible. It was concluded that the most suitable practical solution to adding biosolids into the landfill was in the form of trenches. From the slope stability study, it was found that the factor of safety reduces significantly with the introduction of biosolids due to a reduction in shear strength and increase in the overall moisture content. From a parametric study, the stability of a 1:2 side slope with an angle of friction lower than about 20 was found to be less than the safe limit of 1.5. In addition, the factors of safety for landfills with trenches extending close to the edges of the slopes were also found to be unsafe and this situation needs to be avoided in practice. iv
6 ACKNOWLEDGEMENTS First of all I would like to thank my advisor, Dr. Manoj Chopra for providing me with the opportunity to work on this project and accomplish this goal. Your moral support, guidance, flexibility, and genuine concern for me not only as my professor but as a friend, have been greatly appreciated. I couldn t have asked for a better person to work under. I would also like to express my gratitude to my co-adviser Dr. Debra Reinhart for all the encouragement and support. I also wish to thank Dr. Wa il Abu-El-Shar for surveying on my committee and taking time to review my work. I would also like to thanks Highlands County Landfill, Sebring, Florida for the support of this research, and in particular, I would like to recognize Mr. Jerry Leszkiewicz for the unlimited time which he dedicated to the completion of this study. I wish to thank my parents and sister for all the support. With out the support from my family I could not have realized my dreams. I am very grateful for my friends and colleagues, especially Anurag, Binoy, Piyush, Ravi and Raja, because of their help and knowledge contributed throughout the development of the thesis. v
7 TABLE OF CONTENTS LIST OF FIGURES ix LIST OF TABLES xiii LIST OF ABBREVIATIONS xv 1. INTRODUCTION Importance Identification of the Problem Objective LITERATURE REVIEW The Cone Penetrometer Test Historical Overview Definitions Components Penetrometer Penetrometer Tip Push Rods Pushing Equipment Porous Element Data Acquisition System Precision and Bias Statistical Analysis of Data Factors Affecting CPT Measurement Equipment Design Test Procedure Factors Affecting Data Interpretation Soil Conditions CPT Studies on Landfills Different Methods of Slope Stability Analysis Method of Slices Limit Equilibrium Factors Affecting Slope Stability Geometry Shear Strength of Material Loading Conditions Pore Water Pressure Settlement Operations General Modes of Failure in Landfill vi
8 Rotational Sub-Grade Failure Rotational Failure within the Waste Mass Translational Failure by Movement along the Liner System Slope Stability Analysis Software Factor of Safety from Slope Stability Data Summary of Literature Review SITE DESCRIPTION Site Description Site Preparation METHODOLOGY Why Use CPT? Running the CPT Landfill Areas Tested Statistical Analysis Soil Classification Shear Strength Parameters Slope Stability Analysis Slope Stability Theory Used In SLOPE/W General Limit Equilibrium Method Defining the Problem Summary RESULTS OF TESTING AND MODELING Results from Field Explorations Results from Slope Stability Analysis Slope Stability Analysis on Landfills Considering Circular Failure Slope Stability Analysis on Landfills Considering Block Failure Comparison of Field and Lab data Sensitivity Analysis Effects of Friction Angle Effects of Density of MSW Summary CONCLUSION AND RECOMMENDATIONS Conclusions Recommendations for Further Study APPENDIX A SITE LOCATION MAP APPENDIX B CONE PENETRATION TEST LOGS APPENDIX C BIOSOLIDS EVAPORATION CALCULATIONS vii
9 REFERENCES viii
10 LIST OF FIGURES Figure 2-1 Terminology for Cone Penetrometers... 8 Figure 2-2 Slip Surface Failure in Landfill Figure 2-3 Block Failure in Landfill Figure 3-1 CAT D-5 Bulldozer Scrapping the Intermediate Soil Cover Figure 3-2 The Berm Raised about 2.5 Feet Around the 40 by 60 Feet Test Area Figure 3-3 Biosolids Added within the Berm Figure 3-4 Pushing Waste Over the Biosolids Figure 3-5 Compacting the MSW Over Biosolids Layers Figure 3-6 Field Tests Cells and Boring Location Plan Figure 4-1 CPT Truck Used in Highlands County Landfill Figure 4-2 Cone Tip Close Up Figure 4-3 Typical Field Data for Tip Resistance Figure 4-4 Typical Field Data for Sleeve Resistance Figure 4-5 Typical Field Data for Pore Pressure Figure 4-6 Typical Field Data for Friction Ratio Figure 4-7 Typical Frequency of Chart for Tip Resistance to Eliminate Outliers Figure 4-8 Plot of Net Cone Resistance and Effective Vertical Stress to Estimate Cohesion Figure 4-9 Typical Landfill Profile with Side Slope 1: Figure 4-10 Landfill With Array of Radii and Grid for Center of Failure Plane Figure 4-11 Typical Slope Stability Analyses for Landfill With MSW Only Figure 4-12 Typical Results for Landfill With MSW Only With Block Failure Analysis Figure 4-13 Typical Landfill Profile with Biosolids Placed In Trenches ix
11 Figure 5-1 Landfill with MSW Only Side Slope 1: Figure 5-2 Landfill with MSW Only Side Slope 1: Figure 5-3 Landfill with MSW Only Side Slope 1: Figure 5-4 Landfill with MSW and Biosolids in Trenches Side Slope 1: Figure 5-5 Landfill with MSW and Biosolids in Trenches Side Slope 1: Figure 5-6 Landfill with MSW and Biosolids in Trenches Side Slope 1: Figure 5-7 Landfill with MSW and Biosolids in Trenches with Trenches Close to Edge of Sides Side Slope 1: Figure 5-8 Landfill with MSW and Biosolids in Trenches with Trenches Close to Edge of Sides Side Slope 1: Figure 5-9 Landfill with MSW and Biosolids in Trenches with Trenches Close to Edge of Sides Side Slope 1: Figure 5-10 Landfill with MSW Only Side Slope 1: Figure 5-11 Landfill with MSW Only Block Failure Side Slope 1: Figure 5-12 Landfill with MSW Only Side Slope 1: Figure 5-13 Landfill with Biosolids in Trenches Side Slope 1: Figure 5-14 Landfill with Biosolids in Trenches Side Slope 1: Figure 5-15 Landfill with Biosolids in Trenches Side Slope 1: Figure 5-16 Landfill with Biosolids in Trenches with Trenches Close to Edge of Sides Side Slope 1: Figure 5-17 Landfill with Biosolids in Trenches with Trenches Close to Edge of Sides Side Slope 1: Figure 5-18 Landfill with Biosolids in Trenches with Trenches Close to Edge of Sides Side Slope 1: Figure 5-19 Sensitivity Analysis Result for Landfills with MSW Only (Side Slope 1:2, Slip Failure) Figure 5-20 Sensitivity Analysis Result for Landfill with MSW Only (Side Slope 1:3, Slip Failure) x
12 Figure 5-21 Sensitivity Analysis Result for Landfill with MSW Only (Side Slope 1:4, Slip Failure) Figure 5-22 Sensitivity Analysis Result for Landfill with MSW Only (Side Slope 1:2, Block Failure) Figure 5-23 Sensitivity Analysis Result for Landfill with MSW Only (Side Slope 1:3, Block Failure) Figure 5-24 Sensitivity Analysis Result for Landfill with MSW Only (Side Slope 1:4, Block Failure) Figure 5-25 Sensitivity Analysis Result Landfill with MSW and Biosolids (Side Slope 1:2, Slip Failure) Figure 5-26 Sensitivity Analysis Result Landfill with MSW and Biosolids (Side Slope 1:3, Slip Failure) Figure 5-27 Sensitivity Analysis Result Landfill with MSW and Biosolids (Side Slope 1:4, Slip Failure) Figure 5-28 Sensitivity Analysis Result Landfill with MSW and Biosolids (Side Slope 1:2, Block Failure) Figure 5-29 Sensitivity Analysis Result Landfill with MSW and Biosolids (Side Slope 1:3, Block Failure) Figure 5-30 Sensitivity Analysis Result Landfill with MSW and Biosolids (Side Slope 1:4, Block Failure) Figure 5-31 Sensitivity Analysis Result of Landfill with MSW Only (Side Slope 1:2, Slip Surface) Figure 5-32 Sensitivity Analysis Result of Landfill with MSW Only (Side Slope 1:3, Slip Surface) Figure 5-33 Sensitivity Analysis Result of Landfill with MSW Only (Side Slope 1:4, Slip Surface) Figure 5-34 Sensitivity Analysis Result of Landfill with MSW Only (Side Slope 1:2, Block Surface) Figure 5-35 Sensitivity Analysis Result of Landfill with MSW Only (Side Slope 1:3, Block Surface) xi
13 Figure 5-36 Sensitivity Analysis Result of Landfill with MSW Only (Side Slope 1:4, Block Surface) Figure 5-37 Sensitivity Analysis Result Landfill with MSW and Biosolids (Side Slope 1:2, Slip Surface) Figure 5-38 Sensitivity Analysis Result Landfill with MSW and Biosolids (Side Slope 1:3, Slip Surface) Figure 5-39 Sensitivity Analysis Result Landfill with MSW and Biosolids (Side Slope 1:4, Slip Surface) Figure 5-40 Sensitivity Analysis Result Landfill with MSW and Biosolids (Side Slope 1:2, Block Failure) Figure 5-41 Sensitivity Analysis Result Landfill with MSW and Biosolids (Side Slope 1:3, Block Failure) Figure 5-42 Sensitivity Analysis Result Landfill with MSW and Biosolids (Side Slope 1:4, Block Failure) xii
14 LIST OF TABLES Table 4-1 Summary of CPT Testing Table 4-2 Landfill Material Properties Used In Modeling Table 5-1 Average Tip Resistance, Sleeve Resistance, Friction Ratio and Pore Pressure for Pilot Area for Statistical Analysis Table 5-2 Average Tip Resistance, Sleeve Resistance, Friction Ratio and Pore Pressure for Control Area before Statistical Analysis Table 5-3 Average Cone Tip Resistance, Sleeve Resistance, Friction Ratio and Pore Pressure For Bioreactor Area before Statistical Analysis Table 5-4 Average Tip Resistance, Sleeve Resistance, Friction Ratio and Pore Pressure in the PA, CA and BA Table 5-5 Average Estimated Friction Angle for the Different Areas in Lanfill Tested Table 5-6 Factor Safety for Landfill with MSW Only with Different Side Slopes Table 5-7 Factor of Safety for Landfill with MSW and Biosolids with Different Side Slopes Table 5-8 Factor of Safety for Landfill with MSW and Biosolids with Trenches Close to Side Slope Table 5-9 Factor of Safety for Landfill with MSW Only with Different Side Slopes Table 5-10 Factor of Safety for Landfill with MSW and Biosolids with Different Side Slopes -83 Table 5-11 Factor of Safety for Landfill with Biosolids with Trenches Close to the Edge of Slope Table 5-12 Variation of Factor of Safety with Friction Angle for Different Side Slope for Slip Surface Failure Table 5-13 Variation of Factor of Safety with Friction Angle for Different Side Slope for Block Failure Table 5-14 Variation of Factor of Safety oith Friction Angle for Different Side Slope for Slip Surface Failure Landfill with Biosolids Table 5-15 Variation of Factor of Safety with Friction Angle for Different Side Slope for Block Failure Landfill with Biosolids xiii
15 Table 5-16 Variation of Factor of Safety with Density for Different Side Slope Slip Surface Failure Landfill with MSW Only Table 5-17 Variation of Factor of Safety with Density for Different Side Slope Block Failure Landfill with MSW Only Table 5-18 Variation of Factor of Safety with Density for Different Side Slope Landfill with MSW and Biosolids Table 5-19 Variation of Factor of Safety with Density for Different Side Slope Landfill Accepting Biosolids Block Failure xiv
16 LIST OF ABBREVIATIONS ASTM BA CA CPT CPTU DMT PA PMT MSW SPT American Standard for Testing of Materials Bioreactor Area Control Area Cone Penetration Test Cone Penetration Test with Pore Pressure Measurement (Piezocone Test) Dilatometer Test Pilot Area Pressurementer Test Municipal Solid Waste Standard Penetration Test xv
17 1. INTRODUCTION 1.1 Importance Landfills are used for disposal of solid waste. Originally, the materials in landfills reflected the generation of refuse but now they are used for disposal of reduced Municipal Solid Waste (MSW) after the removal of recyclables. Landfills are well engineered facilities that are located, designed, monitored, operated and financed to ensure compliance with federal regulations. Disposal of water treatment facility sludge and wastewater treatment facility biosolids presents significant challenges to facility operators, as this practice often violates loading of metals and exceeds allowable levels of pathogens for land application. So landfilling biosolids looks most promising as this will result in minimal contact with humans and can provide moisture in a bioreactor landfill. Landfilling provides a major, safe, economical disposal route for biosolids and sludge. In order to study the engineering properties of MSW co-disposed with biosolids and sludges, the physical characteristics of biosolids and sludge with regards to moisture characteristics and geotechnical stability are of utmost importance. 1.2 Identification of the Problem The ability to predict the stability of the landfill is valuable. With the addition of sludge and biosolids significant changes in the composition and characteristics of landfill take place. The waste slopes are particularly important, which involve with evaluation of waste strength properties when co-disposed with biosolids. The geotechnical properties of the waste materials are not very well known and understood (Singh 1990). 1
18 The complexity of the problem is further increased because of the heterogeneous nature of waste, placement conditions and level of decay of various constituents of the landfills. With the expanding world, the demand for larger and higher capacity landfills is rapidly increasing. Proper analysis and design of landfills have pushed the boundaries of geotechnical engineering practice, in terms of proper identification and assessment of strength and deformation characteristics of waste materials (Sharma 1990; Sadek 2001). A key element in MSW landfill management is the ability to measure the various geotechnical parameters of the waste such as the density, moisture content, cohesion, and shear strength. Typical laboratory approaches have limitations due the heterogonous nature of the MSW. The scarcity of data is due to the difficulties in sampling and testing the refuse. This difficulty is further compounded by the fact that refuse composition and properties are likely to change erratically within a landfill and the waste is likely to decompose with time. An ideal method for estimating landfill geotechnical properties would consist of an in-situ testing device that would provide high accuracy with minimal efforts and costs. The device must also be capable of characterizing a large area in a short time period. In the field of geotechnical engineering, a device that meets these criteria for soil testing is the cone penetrometer. The unit weight, moisture content, friction angle and cohesion influence the stability of landfill side slopes and interfaces among landfill components. True cohesion between particles is unlikely in landfills. However, there may be significant cohesion that results from interlocking and overlapping of the landfilled constituents (Singh 1990). 2
19 1.3 Objective The main objective of this thesis is to evaluate the performance of slopes in landfills, using standard slope stability analyses. These landfills may be operated with and without sludge and biosolids. Slope stability analysis is conducted on landfill models using the computer software SLOPE/W (Geo-Slope 2001). This software was designed for soils but was found suitable for modeling landfills slopes as the waste is assumed to act like a sandy soil. SLOPE/W uses the theory of limit equilibrium of forces and moments to compute the factor of safety against failure. In Chapter 2, a thorough literature review is conducted on the topic covered by this thesis such as CPT and slope stability analysis techniques. This is followed by Chapter 3 which provides a description of the field site at the Highlands County Landfill in Sebring, Florida. Chapter 4 discusses the methodology of conducting the field investigation using the CPT. It also describes the statistical analyses used for reducing the CPT data. The results of the field exploration and all slope stability analyses are presented in Chapter 5. Lastly, Chapter 6 presents the conclusions from this research and recommendations for future work. 3
20 2. LITERATURE REVIEW This chapter provides a review of important literature pertaining to the history and theory of the cone penetrometer test. This chapter includes a description of the CPT probe, factors affecting measurement, and factors affecting data interpretation. A review of known cone penetration testing on landfills is provided. The chapter also includes a review of factors affecting the slope stability and the general modes of failure in landfills. 2.1 The Cone Penetrometer Test Historical Overview The Cone Penetrometer Test (CPT) was first introduced in 1934 in Netherlands in the version that is used today. The apparatus was initially designed only to measure the penetration resistance of the soil to a cone (Meigh 1987). The first electrical cone (Rotterdam Cone) was developed and patented in 1948 in Dutch, by the municipal engineer Bakker. The signals were transmitted to the ground through cables inside the hollow penetrometer rods. This device measured the point resistance with an electrically operated cell that contained the strain gauges arranged to measure the axial stress. Delft Soil Mechanics Laboratory (DSML) in 1957 produced the first electrical cone penetrometer where the local side friction could also be measured separately. In 1971 De Ruiter used an electrical inclinometer which enabled deviations from vertical during test to be monitored (Lunne 1997). Almost simultaneously in Sweden and USA in 1975, probes were developed for measuring the pore pressure at the tip of the electrical penetrometer which significantly 4
21 improved the use and interpretation of the data. In the same year, American Standard Testing of Materials (ASTM) standards were published for the friction cone penetration tests of soil (ASTM D T). Currently, revised equipment and procedure standards are given in ASTM D and European standards International Society for Soil Mechanics and Foundation Engineering (ISSMFE) Definitions Cone Resistance The resistance to penetration developed by the cone is called cone resistance, the total force acting on the cone (Q c ) divided by the projected area of the cone (A c ) and is defined by the equation: Q c q c = 2.1 Ac Corrected Cone Resistance The cone resistance (q c ) corrected for pore water pressure effects is called corrected cone resistance Sleeve Friction The resistance to penetration developed due to side friction is called sleeve friction. The total frictional force acting on the friction sleeve (F s ) divided by its surface area (A s ) is defined as the sleeve friction. F s f s = 2.2 As 5
22 Corrected Sleeve Friction friction sleeve. This is the sleeve friction corrected for pore water pressure effects on the ends of the Friction Ratio The ratio expressed as a percentage, of sleeve friction (f s ) to cone resistance (q c ), both measured at the same depth is called friction ratio. f s R f = q c Normalized Cone Resistance The cone resistance expressed in a non-dimensional form and taking account of in-situ stress changes is given by the following equation: ( q σ ) c vo Qc = 2.4 σ ' vo σ vo =vertical stress σ ' vo =effective vertical stress Net Cone Resistance Net cone resistance is defined as the corrected cone resistance (q t ) minus the vertical total stress (σ vo ). q = σ 2.5 n q t vo 6
23 2.2 Components Penetrometer The standard penetrometer is a device consisting of a series of push rods screwed together with a terminal body called the penetrometer tip (Figure 2-1). There are two types of penetrometers, an electric penetrometer and a mechanical penetrometer Penetrometer Tip The tip is comprised of an active element that senses the soil resistance (the cone, the friction sleeve and the porous element). The cone has an angle of 60 (± 5 ) point angle and an area of 10 cm 2 (ASTM-D ) Push Rods The push rods are used for advancing the penetrometer tip through the test medium. The standard rods are one meter long with tapered threads so that they form a rigid-jointed sting of rods. The rods must have a section adequate to sustain the axial forces required to advance the penetrometer tip without buckling. The rods must have an outside diameter not greater than the diameter of the base of the cone length. Each push rod must have the same constant inside diameter. To reduce the total friction on the push rods, a friction reducer is placed in line between the push rods and the penetrometer tip. 7
24 Figure 2-1 Terminology for Cone Penetrometers Pushing Equipment The rigs used for pushing the penetrometer consist basically of a hydraulic jacking system. The thrust capacity needed for cone testing commonly varies between 10 and 20 tons (100 and 200 KN). Twenty ton is the maximum allowable thrust on the 35.7 mm diameter high tensile steel push rods. 8
25 The rigs are often mounted on heavy-duty trucks that are ballasted to a total deadweight of around 15 tons. Screw anchors are used to develop the extra reaction required for the thrust of 20 tons. The power for the hydraulic rigs is usually supplied from the truck engine Porous Element In order to measure the pore water pressure the penetrometer tip can be equipped with a porous filter which is either made of porous plastic, sintered stainless steel, ceramic, or other porous material. The position of the filter element is not standardized, but is limited to the face or the tip of the cone (u 1 ), directly behind the cylindrical location extension of the base of the cone (u 2 ), or behind the sleeve (u 3 ) as shown in Figure 2-1. In the research project the porous element was located at u 1. Pore pressure measurements obtained at the u 2 location are more effective for compressibility and layer detection but the locations more subject to wear. Its main function is to allow rapid movement of extremely small volumes of water needed to activate the pressure sensor while preventing soil ingress or blockage. Typical pore size is 200 µm or smaller. Saturation of the pore pressure element is especially important. The filter element must be boiled under water in a vacuum chamber for approximately 3 hrs until no air bubbles are seen. The voids in the cone should be de-aired by flushing with a suitable fluid from a hypodermic needle. 2.3 Data Acquisition System The electric penetrometers are equipped with data acquisition systems which allows the output to be measured during the test. As the test progress, the strain gauges and other sensors in the penetrometer tip send electric analog signals continuously to an amplifier. The data are 9
26 converted to digital form for data logging. Amplification of the data in the cone significantly improves the quality of the data by reducing the signal to noise ratio (Lunne 1997). The digital signals are then interpreted by a computer which gives the measured values with depth as a profile of soil properties. 2.4 Precision and Bias The accuracy of the electric CPT method is 5% standard deviation for q c and 20 % for f s. The accuracy is influenced by the zero load error which should not exceed 0.5% to 1% of the full scale output and the calibration error (Robertson 1984). 2.5 Statistical Analysis of Data Landfill properties are highly heterogeneous. Most of these variables cannot be precisely quantified and therefore it becomes very important that the maximum amount of information be derived from an available set of data to reach any conclusions (Campanella 1988). Statistical methods belong to either the traditional or geostatistical approach. Geostatistical approaches are useful after a careful review of the data in terms of quality and geologic evidence (Lunne 1997). Traditional statistics are an important component of reliability analysis used to evaluate the parameters. The estimates quantify a mean value and the uncertainty in the data. The normal and log normal probability distributions can be used for the cone tip resistance. The cone tip resistance is plotted with the frequency distribution (occurrence) to delineate the outliers in the measured tip resistance. In some cases pore pressure reading were unrealistically high leading to a situation of zero or negative effective vertical stress, so these outliers have to be eliminated. 10
27 2.6 Factors Affecting CPT Measurement Equipment Design The cone design factors that influence the measured parameters are: 1. Unequal area effects, 2. Piezometer location, size and saturation, 3. Accuracy of measurement, 4. Temperature effects and 5. Calibration. The errors associated with equipment design are only significant for penetration in soft, normally consolidated, fine-grained soils. Test results in sand are not significantly influenced by the above factors Unequal Area Effects If the electric cone is subjected to an all around water pressure, the tip stress will not record the correct water pressure and the friction sleeve will record a load. The water pressure will act not only on the outer surfaces but also on the horizontal surfaces in the groves. The friction measurement is due to unequal end areas of the friction sleeve and is often negative or opposite to the soil friction but can be positive (Meigh 1987) Accuracy of Measurement Electric cones provide significantly better accuracy and repeatability than the mechanical cones. However, there are some aspects concerning electric cone design that influence the 11
28 accuracy of the measurement. The two main errors related to the design of the load cells are calibration error and zero load error Temperature Effects A change in temperature causes a shift in the load cell output at zero loads. Piezocones have load cells that are, to a large degree temperature compensated. In addition to careful temperature compensation of the load cells, there are two ways that the temperature zero shifts may be avoided or corrected for: 1. Zero reading should be taken at the beginning and end of test at the same temperature as in the ground, and 2. Mount a temperature sensor in the cone and correct the measured results based on laboratory results Calibration All calibrations should be done using reference type load cells and a dead load weight tester or pressure reference transducer. The calibration should evaluate repeatability, nonlinearity and hysteresis effects to determine the best straight line fit for the data. For completeness, the effect of temperature on zero load output and on calibration factors should be determined by performing calibration over a range of temperature which might correspond to field conditions Test Procedure The standard test procedures for CPT are: 1. Saturation of Piezometer Element 12
29 2. Rate of Penetration 3. Inclination 4. Friction-Bearing offset Rate of Penetration The standard rate of penetration for Cone Penetration Test with Piezocone (CPTU) is 20 ± 5 mm/sec (2 to 4 ft/min) (ASTM-D ). The electric cone is typically advanced in one meter increments at a relatively constant rate of two centimeters per second using the hydraulic press of specialized cone truck. This constant rate of penetration records about five readings per second Inclination Piezocones have slope sensors incorporated in the design to enable measure of the nonverticality of the sounding. Once a cone tip is deflected, it continues along a path with a relatively consistent radius of curvature. A sudden deflection in excess of one or two degree may cause damage to the cone and rods from bending, and penetration should cease Friction-Bearing Offsets The center of the friction sleeve is approximately 10 cm behind the cone tip. To calculate the Friction Ratio (FR), the average friction resistance (f c ) and bearing resistance (q c ) are compared at the same depth. The friction ratio usually involves an offset of the friction resistance by the physical distance of 10 cm. In general, however, the standard 10-cm friction-bearing offset usually provides adequate friction ratio plots (Lunne 1997). 13
30 2.7 Factors Affecting Data Interpretation Soil Conditions In Situ Stresses The in situ horizontal effective stress, σ h0, has a significant effect on the cone resistance. Applied surface loads from the surface of the landfill or the CPT truck also increases the effective stress. The interpretation of CPT data should, at least qualitatively, account for these affects Stratigraphy One of the major applications of CPT is for stratigraphic profiling of soils. The cone resistance is influenced by the material ahead and behind the penetrating cone. The tip resistance, q c, will go through a smooth transition at layer interfaces. In soft materials, the diameter of the sphere of influence is two to three cone diameters and in stiff material it is up to 20 to 30 cone diameters. The cone resistance will reach its full value in soft thin layers better than in thin stiff layers (Schmertmann 1978). 2.8 CPT Studies on Landfills CPT investigations were used on landfills for various purposes as reported in literature. Hinkle conducted CPT on an abandoned 38-acre (153,777 m 2 ) sanitary landfill to obtain permeability values and to predict settlement. Approximately 40% of the CPT attempts penetrated the MSW material to the desired depth without encountering an obstruction. The data 14
31 showed the MSW material to be relatively consistent with a tip resistance of approximately 50 tsf (5 MPa) and a skin friction of approximately 0.5 to 1 tsf ( MPa) (Hinkle 1990). Oakley (1990) used the CPT to calculate the settlement of a chemically stabilized landfill. Siegel in 1990 utilized the CPT, along with many other geotechnical instruments, to help delineate stratigraphy and saturated zones within a landfill. CPTs were conducted at nine locations with depths ranging from 16 to 123 feet. Planned depths were 150 feet. Each test ended whenever the angular deflection of the probe or the penetration resistance was excessive. In 18 attempts, only half of the runs penetrated more than 22 feet. Two cones broke off in the landfill. The tip resistance with depth increased about 0.8 kg/cm 2 /m (0.25 tsf/ft) (Siegel 1990). Duplancic (1990) used 10 CPTs and various other geotechnical equipment for monitoring the landfill. Based on this study, the calculated angle of friction was found to be 33 degrees. Belfiore and Manassero (1990) conducted dissipation tests during piezocone penetration and confirmed the waste as partially saturated. They measured the shear strength parameters cohesion (c ) as zero and friction angle (φ) as 37 (Francesco Belfiore 1990). The equivalent friction angle was determined to be 28-35º (Sanchez-Alciturri 1993). Sillan in 1995 performed CPT to analyze the environmental properties of MSW and stabilization of the waste. The reported values of mean tip resistance as 5.36 MPa to 8.23 MPa and mean friction ratio as 1.37% to 2.89%. Slopes of the regression lines ranged from 0.04 MPa/ft to 0.17 MPa/ft (Sillan 1995). Singh and Murphy (1990) compiled data from laboratory tests, back calculations and field tests done by other researchers on shear strength parameter of MSW. They concluded that due to the complex and heterogeneous structure of the refuse material and lack of test data, very little is known about its geotechnical properties. Kavazanjian estimated the drained strength as 0-15
32 500 psf cohesion and 0-33 as internal friction angle (Kavazanjian 1995). A vane shear test was conducted and the shear strength ranged from 50 to 100 KPa and the angle of friction to be (Balmer 1989). 2.9 Different Methods of Slope Stability Analysis There are two approaches for slope stability analysis of landfills, (1) The Limit Equilibrium and (2) The Elastic Methods. In the limit equilibrium method the strain consideration is of little consequence whereas in elastic method stress-strain relationships are of great importance. Elastic models are very complicated and are generally too complex for practical analysis and hence are not used to conduct stability analysis. The reliability of the stability analysis is highly dependant on the accuracy of the strength properties and the defined geometry. The type of analysis or stability calculations can also introduce variability in the results because of the inherent assumptions made in developing the analysis method Method of Slices The method of slices can readily accommodate complex geometry, heterogeneous waste material properties and external loads. The software SLOPE/W employed in this research uses this method. The method of slices divides a slice of mass into n smaller slices. There are various methods under this broad category (Geo-Slope 2001): 1. Ordinary Method of Slices (OMS), 2. Simplified Bishop Method, 3. Simplified Janbu Method, 16
33 4. Spencer s Method, 5. Morgenstern-Price Method, and 6. Generalized Limit Equilibrium Ordinary Method of Slices (OMS) OMS neglects all interslice forces and fails to satisfy equilibrium for the slide mass as well as for individual slices. However, this is one of the simplest procedures based on the method of slices (Abramson 1995) Simplified Bishop s Method This method assumes that all interslice shear forces are zero. This method only satisfies moment equilibrium (Das 2000) Simplified Janbu s Method Janbu assumes zero interslice shear forces and is similar to Bishop s method, except it satisfies only horizontal force equilibrium (Das 2000) Spencer s Method Spencer rigorously satisfies static equilibrium by assuming that the resultant interslice force has constant, but unknown, inclination. This method considers both force and moment equilibrium. 17
34 Morgenstern-Price Method Morgenstern and Price proposed a method that is similar to Spencer s method except that the inclination of the interslice resultant force is assumed to vary according to a portion of an arbitrary function. This method allows one to specify different types of interslice force function General Limit Equilibrium This method can be used to satisfy either force and moment equilibrium, or if required, just the force equilibrium conditions. It encompasses most of the assumptions used by various methods and may be used to analyze circular and noncircular failure surfaces (Abramson 1995) Limit Equilibrium The basic assumption on the limit equilibrium approach is that Coulomb s failure criterion is satisfied along the assumed failure surface, which may be a straight line, circular arc, logarithmic spiral, or other irregular surface. A free body is taken from the slope and starting from known or assumed values of the forces acting upon the free body, the shear resistance for equilibrium is calculated. This calculated shear resistance is then compared to the estimated or available shear strength of the material to give an indication of the factor of safety (Fang 1997). The preferred slope stability analysis method should satisfy both moment and force equilibrium (Shafer 2000). Generally, Janbu s or Spencer s method of analysis is recommended. This preference is the result of the satisfaction of overall moment and force equilibrium requirements. Janbu s simplified method satisfies overall moment equilibrium and vertical and horizontal force equilibrium, but does not satisfy individual slice moment equilibrium. Spencer s 18
35 method satisfies all states of equilibrium including individual slice moment equilibrium (Abramson 1995). One key difference between the various methods is the assumption regarding interslice normal and shear forces. The relationship between these interslice forces is represented by the parameter λ. For example, a λ value of 0 means there is no shear force between the slices. A λ value that is nonzero means there is shear between the slices. A plot of factor of safety versus λ has two curves. One represents the factor of safety with respect to moment equilibrium, and the other one represents the factor of safety with respect to force equilibrium. Bishop's Simplified method uses normal forces but no shear forces between the slices (λ =0) and satisfies only moment equilibrium. So the factor of safety by Bishop s method is on the left vertical axis of the plot. Janbu's Simplified method also uses normal forces but no shear forces between the slices and satisfies only force equilibrium. The Janbu factor of safety is therefore also on the left vertical axis. The Morgenstern-Price and GLE methods use both normal and shear forces between the slices and satisfy both force and moment equilibrium; the resulting factor of safety is equal to the value at the intersection of the two factor of safety curves. The general formulation of SLOPE/W makes it possible to readily compute the factor of safety for a variety of methods (Geo-Slope 2001). The limit equilibrium method has the ability to model heterogeneous types of material, complex stratigraphic and slip surface geometry, and variable pore water pressure conditions. In addition, stresses that are computed using finite element stress analysis are used in the limit equilibrium computations for a more complete slope stability analysis. The elastic models are very complicated and are generally too complex for practical use in basic engineering problems. 19
36 2.11 Factors Affecting Slope Stability According the Shafer (2000) and Qian (2000) the factors affecting slope stability include geometry, shear strength of materials, loading conditions, pore water pressure, settlement and operations Geometry The exterior slopes, bottom grades, height of landfill and surcharge are the driving forces in slope stability analysis. Berms at the toe of slopes contribute as resisting forces. The bottom liner grades, final waste grades and liner side slope grades should be maintained or designed as flat as practical. Shafer (2000) suggested that the critical cross sections for stability analyses are selected by superimposing the final or intermediate waste grades over the top of liner grades. Sections are to be selected where both the liner and waste grades are sloping downward at the steepest combination of grades Shear Strength of Material Shear strength of the foundation material resists the bearing failure of the landfill. The shear strength of the liner soils, interface between various geosynthetic materials and soil, and MSW affect the stability of landfills (Shafer 2000). The strength parameters of the waste material also play an important role in the slope stability analysis. With varying percentages of biosolids, the shear strength parameters of the waste (mixed with biosolids) are critical for codisposal due to significant quantities of moisture and decomposed organic wastes added to the waste. 20
37 Loading Conditions The unit weight of waste and any applied external loads, such stockpiling of soils on the waste fill are the major loading condition factors that affect the stability of landfill. Construction vehicles traffic (movement) may affect the stability. Vertical expansions and stockpiles on the fills increase normal loads on existing waste, liner and base material Pore Water Pressure As the pore pressure increases, the effective stress reduces and the available shear strength of the material is reduced. This adversely impacts the stability of the landfill (Shafer 2000). On the other hand a decrease in pore water pressure (negative pore water pressure or suction pressure) can stabilize the landfill by increasing the effective vertical stress. With codisposal of biosolids, surface infiltration and lechate recirculation, the waste has a higher liquid content which may result in increased pore pressures. This in turn may have a destabilizing effect if not controlled properly (Abramson 1995) Settlement Settlement can affect the stability in two ways. According to Shafer (2000), uniform settlement increases the unit weight of the MSW due to densification and thus increases the stability. On the other hand, localized differential settlement encourages surface water to infiltrate in the mass, potentially increasing pore water pressure and piezometric head in the waste mass. Biosolids have high compressibility and consolidation properties. If the landfills are occupied with pockets of biosolids, the highly compressible zone tends to create local settlement which has a negative effect on the stability of the landfill (Shafer 2000). 21
38 Operations Landfill operations have an impact on landfill stability. It is advisable to mix biosolids and MSW before landfilling or place biosolids in layers so that they can occupy the voids in the waste when compacted. The degree of saturation of the waste, the liquid injection system, air injection system, gas extraction system, and piezometers head in the landfill should be monitored regularly (Shafer 2000) General Modes of Failure in Landfill Potential failure modes are summarized schematically in Figure 2-2 and a brief description of each situation is as follows. A brief description of each failure mode follows Rotational Sub-Grade Failure A rotational failure can be initiated in a soft sub-grade that can propagate up through the waste mass. When significant loads are placed in areas with low sub-grade shear strength, the potential for bearing capacity failure can influence design consideration. If a liner system is present, it offers only negligible resistance and should be discounted in the analysis as shown in Figure 2-2. A circular arc failure surface is typically considered for a potential failure (Qian 2002) Rotational Failure within the Waste Mass According to Qian (2000) for failure within the waste mass, circular arc (slip) and block failure surfaces are considered. Slip failure occurs within the waste mass, completely independent of the liner system Figure 2-2. This type of failure is prompted by steep waste 22
39 slopes, high liquid content, and lack of placement controls. Block failure surfaces would generally be considered if a weak failure plane exists within the waste mass (Figure 2-3). Block failure analysis is used to estimate the factor of safety against sliding in situation where the shear strength of the landfill material is greater than that of the foundation soils. Figure 2-2 Slip Surface Failure in Landfill Figure 2-3 Block Failure in Landfill 23
40 Translational Failure by Movement along the Liner System A lateral translational failure can occur with the solid waste sliding above, within or beneath the liner system at the base of the waste mass. The extension of the failure plane back from the toe can propagate up through waste, or continue in the liner system along the back slope. For this type of analysis a block failure surface is assumed. With this analysis, the active and passive wedges of the block failure surface propagate through the waste mass or along the side slopes of the critical liner system (Qian 2002) Slope Stability Analysis Software SLOPE/W is a graphical software product that operates under Microsoft Windows environment. SLOPE/W uses the method of slices for slope stability analysis. Increasing the number of slices from say 5 to the default of 30 has a profound effect on the factor of safety. Whereas increasing the number of slices over 30 has a very little effect (Geo-Slope 2001). The program uses limit equilibrium theory to compute the factor of safety of slopes. Some degree of uncertainty is always associated with the input parameters of slope stability analysis. To accommodate these parameters in analysis, the software has the ability to perform a Monte Carlo probabilistic analysis. A probabilistic analysis makes it possible to compute a factor of safety probability distribution, a reliability index, and the probability of failure. The variability of the input parameters is assumed to be a normal distribution with user defined mean values and standard deviations. It is concluded that SLOPE/W satisfies all slope stability analysis requirements and was found suitable for the present research analysis (Koodhathinkal 2003). 24
41 2.14 Factor of Safety from Slope Stability Data Laboratory testing on MSW was conducted by Koodhathinkal (2003). He found MSW had average value of cohesion of 4.25 psi and friction angle of 28.1º. Varying the percentage of biosolids from 15% to 50% by weight mixed in with MSW caused the cohesion to vary between 4.6 to 6.3 psi and friction angle in the range of 11.2 to 12.2º respectively. Similarly with lime sludge, as the lime sludge percentage was varied from 15 to 50% by weight, the cohesion was determined to be in the range of 2.5 to 3.6 psi and friction angle in the range of 23.1 to 29.4º respectively. The landfill was modeled for various scenarios such as MSW only, MSW along with biosolids or sludge deposited directly and MSW and biosolids or sludge mixed in different percentages by weight and deposited. The factor of safety for landfill with MSW only was For landfill accepting MSW and sludge disposed as discrete layers the factor of safety was 1.15 and with lime sludge the factor of safety was The lime sludge had more inherent shear strength than biosolids. Landfill accepting lime sludge had higher factor of safety than the ones accepting biosolids. The stability of a landfill decreases strongly if the sludge is present as continuous horizontal layers. Modeling of landfills accepting MSW mixed with varying percentage by weight of biosolids and lime sludge was also conducted by Koodhathinkal (2003). With 15 and 50% by weight of biosolids, the factor of safety was 1.53 and 1.48 respectively and that with lime sludge was 2.45 and With an increase in percentage of biosolids and lime sludge, the factor of safety decreased. Next, the landfill was modeled by placing the biosolids and lime sludge in pockets. For this case, the factor of safety for biosolids was found to be 2.28 and for lime sludge 25
42 was With varying the percentage of biosolids from 15 to 50% the factor of safety varied in the narrow range of 2.36 to 2.37 respectively. Similarly with lime sludge, as the percentage was varied from 15 to 50%, the factor of safety was obtained in the range of 2.62 to Landfill models with 15% mixture are determined to be more stable than 50%. Mixing the sludges with MSW helps in increasing the slope stability of the landfill as compared to direct landfilling, although it is still significantly governed by the placement of the mixture (Koodhathinkal 2003). The stability of the landfill slope is also improved by applying a cover layer (De Bekker 1989). Qian (2002) suggests a minimum factor of safety of 1.5 for stability analysis. Shafer (2000) suggests for failure within the waste or subgrade, a minimum acceptable final condition factor of safety was considered to be 1.5. For interim conditions, peak interface strengths are typically used. Acceptable factor of safety for interim conditions typically range from 1.2 to 1.3 (Shafer 2000) Summary of Literature Review From the literature review in this chapter, it can be concluded that the CPT gives continuous log data of the material in the field along with measurement of pore pressures. It can further be concluded that slope stability analysis must be carried out using a method that satisfies both moment and force equilibrium. SLOPE/W software not only satisfies this requirement but also performs probabilistic analyses. It also allows defining different layers of waste with different properties according to the amount of sludges co-disposed. Hence it is concluded the SLOPE/W will attend to all stability needs and is suitable for the research. 26
43 3. SITE DESCRIPTION The field study was conducted to investigate the best practices for application of biosolids and study the impact of biosolids on geotechnical properties using CPT. So field study was conducted at the Highlands County Landfill, located in Highlands County, Sebring, Florida. The site is located at Arbuckle Creek Road, in Sebring, Florida (see location map in Appendix A: Site Location Map). It was selected since as the Highlands County Landfill management was interested in testing biosolids. 3.1 Site Description The site consists of 987-acres of land. It was sited in by the Highland County Commission. The master plan shows the areas now in use consist of eight cells, encompassing a total of 160 acres in all. There is a quarter mile wide buffer of 1,000 pine trees, now 30 feet tall, which were planted in The 987-acre site includes a small construction and demolition landfill, opened in July 1999 and currently being expanded. There is room for an additional 26- acre of construction and demolition landfill. The facility includes both a lined Class I landfill cell as well as an unlined Class III landfill cell. The Class I landfill is currently being operated as a bioreactor. Leachate from the Class I cell is recirculated, treated and land applied on site. The test site for this research was selected on top of the first lift of solid waste placed in Subsection A of Cell 3. Two test pads named Pilot Area (PA) and Control Area (CA) were constructed at this location. Each test pad was about 120 by 100 feet in plan dimensions at it base and 40 by 60 feet at the top (Figure 3-6). The height of each test pad was about 10 feet. The 27
44 waste below test pads was placed and compacted in late August The average thickness of compacted MSW was about 13.2 feet below the test pads. 3.2 Site Preparation Initially the Pilot Area (PA) was constructed. Liquid biosolids from the City of Sebring Wastewater Treatment Plant were placed in PA. Beginning on May 3, 2004 prior to placing the biosolids a CAT D-5 bulldozer (6-way blade) removed the intermediate cover layer over a 60 by 100 feet area (Figure 3-1). The objective of this process was to over excavate the 40 by 60 feet footprint of the top of the test pad about 10 feet. The area surrounding the 40 by 60 feet test area could then be backfilled with MSW. This allowed vertical and horizontal migration of the biosolids. MSW was spread around the 40 by 60 feet test area in 12 to 24-inch thick loose lifts with a CAT D-7 bulldozer and compacted with a CAT 826 G landfill compactor weighing approximately 83,000 pounds. The compactor made a total of four to six passes over each layer of MSW. 28

45 Figure 3-1 CAT D-5 Bulldozer Scrapping the Intermediate Soil Cover. On May 04, 2004, the perimeter of the 40 by 60 ft open area, the berm was raised about 2.5 feet (Figure 3-2). Two tanker loads of unstabilized biosolids was obtained and transported from the City of Sebring Wastewater Treatment Plant to the site. The liquid sludge had a solids content of 23 g/l or about 3%. The unit weight was about lb/gallon. The total quantity of sludge placed in the 40 by 60 feet impoundment was about 92,160 pounds. The sludge volume was about 1,202 cubic feet which occupied about six inches of depth on an average. 29
.")
46 Figure 3-2 The Berm Raised about 2.5 Feet Around the 40 by 60 Feet Test Area. The liquid sludge was impounded via gravity flow through a 6-inch diameter hose. The liquid sludge had no discernable odor upon being discharged into the impoundments. The elevation of the surface of the sludge across the impoundment was about feet (Figure 3-3). The liquid sludge was allowed to remain undisturbed for 48 hours. No rainfall occurred during this period of the time and the sludge had no discernible odor after 48 hours. The measured decrease in the surface elevation of the impounded sludge due to infiltration of sludge moisture into the underlying and surrounding MSW over 48 hours was about 0.8 inches on an average. Based on the rate of evaporation for the site area for the month of May, approximately

47 inches of the measured decrease in sludge level over 48 hours could be attributed to evaporation losses from the surface (Appendix C for evaporation calculations). The resulting average thickness of the remaining sludge in the 40 by 60 feet impoundment was about 4.75 inches. Figure 3-3 Biosolids Added within the Berm Over a two-day period, MSW was stockpiled around the four sides of the impoundment. On May 6, 2004, a CAT D-7 bulldozer was used to push the 6 to 8 feet high piles progressively over the 40 by 60 feet sludge impoundment area starting from the east side and working around from the north, west and south sides. The initial effort to push waste into the east side of the impoundment was done deliberately in an attempt to displace some the sludge with MSW and to 31
48 cause the sludge to flow back to the west to make the sludge layer more uniform in thickness. No mud wave was detected as MSW displaced the sludge, but it was observed that the sludge level rose uniformly about 1.5 inches. The bulldozer operator had no problem operating the machine over the top of the sludge. The bearing capacity for the wide track, low ground pressure bulldozer (36-inch wide tracks) was excellent with no machine tilting or soft spots encountered. The CAT 826 G landfill compactor made four to six passes over the track rolled MSW and had no difficulty compacting the material (Figures 3-4 and 3-5). The three-foot thick layer of MSW was compacted into a layer about 1.5 feet thick, without any observed extrusion of sludge to the surface. No soft spots were encountered and no pumping action was observed as the compactor moved back and forth. 32

49 Figure 3-4 Pushing Waste Over the Biosolids Additional MSW was placed, spread, and compacted on the pad between May 6, 2004 and May 12, The top surface of the compacted MSW was raised to an approximate elevation of 93.5 feet in the center of the 40 by 60 feet area and all four sideslopes were constructed at a final grade of about 1:3. The entire surface of the test pad was covered with 24 inches of loosely spread intermediate cover soil. The Control Area (CA) was prepared similarly without the addition of sludge. Both test pads were completed on June 7, CPT was conducted from June 7, 2004 to June 9, 2004, a total of 28 CPT s were conducted. Figure 3-6 also shows the planned CPT boring locations. 33

50 Figure 3-5 Compacting the MSW Over Biosolids Layers The CPT boring locations were placed such that the area under research was tested to the maximum extents. The CPT locations were taken as close to edge of the slope as the truck could be placed. The CPT borings were placed about 12 to 18 feet apart in the PA and about 30 feet apart in the CA. 34


51 Figure 3-6 Field Tests Cells and Boring Location Plan 35
52 4. METHODOLOGY This chapter discusses the methodology followed in conducting the field tests to determine the geotechnical properties of MSW in a landfill. The geotechnical properties thus obtained were then used to model a typical landfill for slope stability analysis. 4.1 Why Use CPT? One of the major drawbacks of laboratory tests is that representative samples cannot always be tested in the laboratory apparatus. Field test methods are often preferred because these tests measure actual properties over a large area rather than the properties of a discrete sample and it is difficult to duplicate field conditions in the laboratory. Since MSW is heterogeneous, anisotropic and particles are large, field tests are considered to be the most appropriate methods for measuring the geotechnical properties of MSW landfills. The options for in-situ field test procedures for determining the geotechnical parameters are (1) Vane Shear Test, (2) Standard Penetration Test (SPT), and (3) Cone Penetration Test (CPT). The shear strength data obtained from Vane Shear and Standard Penetration Tests are not representative of the actual conditions because the test sampler is small compared to the material that make up the landfill (Singh 1990). The CPT provides a continuous or near continuous log of soil properties using two measuring mechanisms, tip resistance and side friction. The results are used to estimate the shear strength parameters of the MSW. It avoids significant disturbance of the ground associated with boring and sampling, particularly that which occurs with the Standard Penetration Test (SPT). 36
53 4.2 Running the CPT A general outline of the CPT test procedure is listed below: 1. The CPT truck is spotted at the sounding location. 2. It is then prepared to run the CPT sounding (leveling). 3. The cone is assembled for sounding (assembly). 4. The sounding is run until the desired depth. 5. The cone is checked for damage and cleanliness. 6. The sounding borehole is then sealed with bentonite slurry. The sounding locations were marked with stakes in the test areas. Truck preparation included stabilizing by leveling with a hydraulic jack system, and raising the roof hood to allow for full vertical motion of the hydraulic ram (Figures 4-1 and 4-2). 37

54 Figure 4-1 CPT Truck Used in Highlands County Landfill 38

55 Figure 4-2 Cone Tip Close Up The penetrometer tip (cone) was prepared for a sounding by checking the O rings and saturating the pore pressure element. To prevent the system from desaturating before the sounding began the system was kept in clean water. Before and after it ended, a baseline reading 39
56 of the cone output was recorded while the cone was freely suspended from the hydraulic ram. The baseline shift was used to determine the zero load error. The CPT utilizes electrical transducers rather than analog gauges to obtain a nearly continuous profile of point (tip) resistance, sleeve friction and pore pressure with depth. During the penetration, semiconductor strain gauge-type load transducers located within the device housing are monitored at the surface. Electrical signals from the point and sleeve load cells are transmitted to the surface through a cable housed within the cone rod string. Specialized data acquisition hardware and software developed by Ardaman and Associates, Inc, the subcontractor used for the CPT field research were used to record readings from the transducers at a frequency of approximately five readings per second. Electrical signals reading were then converted to engineering units of stress using device-specific calibration factors. Immediately after a sounding was completed, the truck was moved to permit access to the sounding borehole. The borehole was filled with bentonite clay up to ground elevation to prevent water and gas transport to the landfill surface. 4.3 Landfill Areas Tested A total of twenty eight CPT soundings were performed over a three-day period from June 7 th, 2004 to June 9 th, 2004 at the Highlands County Landfill site. Three areas were chosen in the landfill for the soundings. The first area represented the native waste material (Control Area CA), the second contained waste with added sludge (Pilot Area PA) and the third was the (Bioreactor Area BA) with leachate recirculation. Figure 3-6 showed the CPT locations at each 40
57 of these areas. The number of CPT soundings and the associated sounding numbers are tabulated below in Table 4-1. Table 4-1 Summary of CPT Testing Area Number of Soundings Performed Sounding Numbers Pilot or Test Area (PA) 19 PA01-PA19 Control Area (CA) 5 CA01-CA05 Bioreactor Area (BA) 4 BA01-BA04 The CPT soundings were conducted using an electrical-type piezocone and hydraulic ram mounted on a ballasted truck. Both the tip and the shaft loads were recorded with depth for the cone soundings. Typical plots of tip resistance, sleeve resistance, pore pressure and friction ratio versus depth are shown Figures 4-3 to
58 Tip Resistance Vs Depth PA 01 Tip Resistance (tsf) Depth (ft) Actual Average 25 Figure 4-3 Typical Field Data for Tip Resistance Sleeve Resistance Vs Depth PA 01 Sleeve Resistance (tsf) Depth (ft) Average Actual data 25 Figure 4-4 Typical Field Data for Sleeve Resistance 42
59 Pore Pressure Vs Depth PA 01 Pore Pressure (tsf) Depth (ft) Average Acutal 25 Figure 4-5 Typical Field Data for Pore Pressure Friction Ratio Vs Depth PA 01 Friction Ratio Depth (ft) Average Actual 25 Figure 4-6 Typical Field Data for Friction Ratio 43
60 The desired depth of soundings in pilot area and control area was 20 feet from the existing grade and 30 feet in the bioreactor area. Ten soundings had to be terminated at depths shallower than intended due to buried obstructions encountered in the path of the cone in the test areas. The CPT soundings were conducted by Ardaman & Associates, Inc. The data were stored in a spreadsheet format for use in subsequent statistical data reduction analysis to determine the geotechnical properties for use in slope stability modeling. 4.3 Statistical Analysis The data obtained from the CPT testing were analyzed to determine the mean, variance, standard deviation for sample statistics and slope, intercept and R 2 values based on a Linear Regression of parameters such as tip resistance, sleeve friction, friction ratio and pore pressure using Microsoft Excel. A frequency distribution for tip resistance was done for each sounding. Figure 4-7 presents a typical frequency of occurrence to tip resistance. In order to eliminate unrealistic tip resistance values, the cut off frequency values were selected as 20. Unrealistic tip resistance values are due to encounters with heterogeneous material and possible obstructions. Pore pressure data were arranged in ascending order, and then the outliers were eliminated. Pore pressure measured in the field not only measures the pore water pressure but also the gas pressure in the landfill. The percentage of the gas pressure measured in the landfill is not clearly known and needs to be investigated. 44
61 Histogram of cone penetration tip resistance data Frequency of Occurrence Tip resistance (tsf) Figure 4-7 Typical Frequency of Chart for Tip Resistance to Eliminate Outliers Based on the remaining data points, an attempt was made to estimate the location and potential effect of the biosolids layers within the MSW mass. However, this layer could not be identified explicitly. As the biosolids added had only about 3% solids content, it is likely that the wet material got very well mixed up with the MSW. Sounding data trends and statistical tools were used qualitatively and quantitatively to compare the sounding data between tests. Chapter 5 presents the results of this exercise. The regression has positive slope which indicates that as the depth increases the vertical effective pressure increases and consequently the tip resistance increases. 4.4 Soil Classification Since we assume the MSW is behaving as soil, soil-based CPT classification charts are used to estimate the geotechnical parameters. The CPT soil classification charts are guides to soil 45
62 behavior type. The CPT data provide a repeatable index of the aggregate behavior of the in situ soil in the immediate area of the probe (Robertson 1990). The guides takes into account the importance of cone design and the effect that water pressures have on the measured cone resistance and sleeve friction due to unequal end areas. Chart developed by Senneset and Janbu in 1985 uses the pore pressure parameter ratio B q which is defined as: B q u 2 0 = 4.1 q t u σ v0 where u 2 = pore pressure between the cone and friction sleeve u 0 = equilibrium pore pressure σ v0 = total overburden stress q t = cone resistance corrected for unequal end area effects. More reliable soil classification can be made using cone resistance values corrected for unequal end area effects (q t ), sleeve friction (f s ) and pore pressure (u). The corrected tip resistance (q t ), is plotted against pore pressure parameter ratio (B q ) and friction ratio (R f ) (Lunne 1997). To account for the influence of overburden stress, normalized data are used as proposed by Wroth in The normalized values of CPT data are: Normalized cone resistance Q t q σ σ t vo = 4.2 v0 where: 46
63 σ v0 = effective vertical stress, σ vo u 0, u o = insitu pore pressure. Normalized friction ratio, F r s = 4.3 q t f σ v0 Pore pressure ratio, B q u = 4.4 q σ t v0 where u = u 2 -u 0 Soil profiles of landfill were estimated using the output interpreted soil behavior type and CPT data. For the present study, based on average values of the MSW parameters and from the soil classification charts developed by Campanella (1983), the landfill material behaves like Coarse grained Sandy-Silty soil. This classification takes into account the tip resistance, pore pressure, sleeve resistance and friction ratio. 4.4 Shear Strength Parameters Since the material is classified as sand, the chart proposed by Robertson and Campanella (1983) may be used to estimate the friction angle for the MSW and a theoretical method proposed by Sennsesset and Janbu (1985) to estimate the cohesion of the landfill material. The chart takes into account the vertical effective stress, where the tip resistance increases linearly with vertical effective stress for constant friction angle. The chart was digitized to develop a generalized equation for friction angle using Microsoft excel. The input parameters 47
64 needed for the equation needed was the ratio of tip resistance and vertical effective stress. The vertical effective stress is calculated using the pore pressure and density of material. The ratio is calculated at each depth interval and the friction angle is determined at each depth interval for the CPT sounding. Since these charts were developed for sandy soils and density of sands is approximately 100 lb/ft 3, the resulting friction angle values were adjusted proportionally for variation in density. This is a conservative approach and the actual friction angle (φ) may be somewhat higher. From the generalized equation for friction angle, the average value of friction angle is found to be 29º more details are provided in Chapter 5. Theoretically derived method by Sennsesset and Janbu (1985) method was used to estimate the effective shear strength parameters of the material. In this method, effective stress shear strength is expressed in the form: τ = ( σ ' a) tanφ' 4.5 f + where τ f = shear stress at failure, σ =effective stress, a=attraction, negative intercept on the plot of net cone resistance against effective overburden pressure, and φ = effective angle of internal friction. Comparing the above equation with the general effective shear stress equation and equating together, we can estimate the cohesion as: τ f = c + σ ' tanφ'
65 where, τ f =effective shear stress at failure, c=cohesion, σ =effective vertical stress, and φ = effective angle of internal friction. c ' = a tanφ' 4.7 Typical plot to estimate the cohesion Net cone resistance (tsf) y = x R 2 = Effective vertical stress Figure 4-8 Plot of Net Cone Resistance and Effective Vertical Stress to Estimate Cohesion Figure 4-8 shows a typical plot of net cone resistance and effective vertical stress to estimate the cohesion from the CPT data. The intercept on the plot should be negative intercept on the effective vertical stress axis. As there is no negative intercept on the effective vertical 49
66 stress axis, the value of a could not be determined. So cohesion could not be determined using the CPT data. True cohesion or bonding between the particles is unlikely in landfills. However, there may be a significant cohesion intercept that results from interlocking and overlapping of the landfill constituents. Since the material is similar to Silty Sandy soils the value of traditional cohesion can be neglected, and this leads to a conservative approach in determining the shear strength. 4.5 Slope Stability Analysis As the MSW is assumed to behave as soil and has characteristics similar to soil such as multi grained, partially saturated, variable soil size structured. The behavior of MSW is assumed to be frictional in nature and is governed by Mohr-Coulomb criteria. Slope stability analysis is conducted using the software SLOPE/W. Models are generated using a typical landfill profile as seen in Figure Daily or intermediate cover was not taken into account in the slope stability analysis. The biosolids were placed in trenches. The geotechnical properties needed for modeling the slope stability were determined in the field using CPT testing as discussed previously. The landfills were modeled for the cases of circular failure and block failure, and the factor of safety against these modes of failure is evaluated Slope Stability Theory Used In SLOPE/W SLOPE/W uses the theory of limit equilibrium of forces and moments to compute the factor of safety. A factor of safety is defined as that factor by which the shear strength of the soil must be reduced in order to bring the mass of soil into a state of limiting equilibrium along a selected slip surface (Abramson 1995). 50
67 For an effective stress analysis, the shear strength is defined as: S = c' + ( σ u) tanφ' 4.8 n where, S=shear strength c =effective cohesion φ =effective angle of internal friction σ n =total normal stress u=pore-water pressure The stability analysis involves passing a slip surface through the landfill mass and dividing the inscribed portion into vertical slices. The slip surface may be circular, composite (i.e., combination of circular and linear portions) or consist of any shape defined by a series of straight lines (i.e., fully specified slip surface). The limit equilibrium formulation assumes that: 1. The factor of safety of the cohesive component of strength and the frictional component of strength is equal for all soils involved. 2. The factor of safety is the same for all slices General Limit Equilibrium Method The general limit equilibrium method uses the following basis from statics in solving for the factor of safety (Geo-Slope 2001): 1. The summation of forces in a vertical direction for each slice is done and equation is obtained for vertical equilibrium. The equation is solved for the normal force at the base of the slice. 51
68 2. The summation of forces in a horizontal direction for each slice is used to compute the interslice normal force. This equation is applied in an integration manner across the sliding mass (i.e., from left to right). 3. The summation of moments about a common point for all slices to solve for the moment equilibrium and moment equilibrium equation is obtained. The equation can be rearranged and solved for the moment equilibrium factor of safety. 4. The summation of forces in a horizontal direction for all slices, giving rise to a force equilibrium factor of safety. The analysis is still indeterminate, and an additional assumption needs to be made regarding the direction of the resultant interslice forces. The direction is assumed to be described by an interslice force function. The factor of safety can now be computed based on moment equilibrium (F m ) and force equilibrium (F f ). These factors of safety may vary depending on the percentage (λ) of the force function used in the computation. The factor of safety satisfying both moment and force equilibrium is considered to be the converged factor of safety of the general limit equilibrium. A factor of safety is really an index indicating the relative stability of a slope. It does not imply the actual risk level of the slope due the variability of input parameters. With probabilistic analysis, two useful indices are available to quantify the stability or the risk level of a slope. These two indices are known as the probability of failure and the reliability index. The probability of failure is the probability of obtaining a factor of safety less than 1.0. It is computed by integrating the area under the probability density function for factor of safety less than
69 The reliability index describes the stability of a slope by the number of standard deviations separating the mean factor of safety from its defined failure value of 1.0. It can also be considered as a way of normalizing the factor of safety with respect to its uncertainty. The reliability index (β) is defined in terms of the mean (µ) and the standard deviation (σ) of the trial factors of safety. The reliability index is included in each of the slope stability results in Chapter 5 and may be expressed as: ( µ 1.0) β = 4.9 σ 4.6 Defining the Problem The software SLOPE/W is used for 2-D modeling of slope stability. Daily or intermediate soils cover effects are not taken into account in the modeling. Within the program the problem outline is set for scale, page size, units and grid. Next, the material properties are defined. The analysis type is then selected and it is determined that failure will follow a right to left path. The profile of the landfill is drawn, based on a typical Florida landfill cross-section. The profile shown in Figure 4-9 shows a typical Class I landfill with a side slope of 1:3. 53

70 Figure 4-9 Typical Landfill Profile with Side Slope 1:3 The properties of the landfill waste and the sludge were determined in the field using insitu CPT investigations. All the layers were modeled using a Mohr-Coulomb soil model. In the probabilistic analysis, all the landfill material models were evaluated. According to the Mohr-Coulomb theory, a material fails because of a critical combination of normal stress and shearing stress. The failure envelope may be defined by equation 4.10 τ f = c + σ tanφ 4.10 where, τ f =shear stress on a failure plane, c=cohesion, σ=normal stress on a failure plane, and φ=internal friction angle. 54
71 The input parameters required for the Mohr-Coulomb are unit weight, angle of internal friction and cohesion with standard deviations values for each parameter. Table 4-2 shows the properties of each material used as input along with the standard deviation. Bedrock is assumed to exist below the base soil for all landfill models. MSW+BS1, MSW+BS2 and MSW+BS3 are different layers which indicate the gradual migration of moisture into the MSW. This is reflected in the gradation of shear strength parameters with addition of biosolids to the MSW. The shear strength parameters were extrapolated from the field data obtained using the CPT. Table 4-2 Landfill Material Properties Used In Modeling Material Description Unit Weight (pcf) Cohession (psf) Friction Angle (phi) (degrees) Reference Clay Liner 105 (SD=5) 720 (SD=72) 8 (SD=0.5) (Tchobanoglous 2002) MSW 70 (SD=5) 0 29 (SD=5) Field Testing BS 35 (SD=5) 0 0 (Koodhathinkal 2003) MSW + BS1 70 (SD=5) 0 7 (SD=5) Extrapolated Results MSW + BS2 70 (SD=5) 0 15 (SD=5) Extrapolated Results MSW + BS3 70 (SD=5) 0 22 (SD=5) Extrapolated Results Sand Liner 30 (SD=3) 0 40 (SD=5 (Das 2000) 55
72 After all waste layer types were defined; the program requires the selection of the failure type for each landfill model. Two types of failure models were considered for each landfill model, namely the circular failure model and the block failure model. For landfills modeled using the circular failure model, the radius of failure plane and the center of the circular failure plane are required to be defined. The software allows defining the radius of failure as a grid of increasing radii and the center of the circular failure plane as a grid. The radius of the failure plane was specified such that it covers a large range of radii, while the grid for the center of the circular failure plane was chosen so that the minimum factor of safety lies within the grid. Figure 4-10 shows a typical selection of radii and grid for landfill. 56

73 Figure 4-10 Landfill With Array of Radii and Grid for Center of Failure Plane Once the landfill model is developed and the grid and radii for the failure plane are specified, slope stability analysis is carried out. A typical result from the program is shown in Figure 4-11 indicating the failure plane and the minimum factor of safety for the chosen grid. Similar results for all other landfill model values presented in Chapter 5. 57

74 Figure 4-11 Typical Slope Stability Analyses for Landfill With MSW Only For landfills modeled using the block failure approach, the grid for the left and the right block of the slip surface and the center of the block failure plane needs to be defined. The software allows specifying the left and right blocks as a grid and the center of the block failure plane was chosen. The location of the center of the block failure does not have a great influence on the factor of safety and hence it was safe to choose any point above the landfill profile. The 58

75 grid for the left and right block was selected such that it covered most of the landfill. Figure 4-12 shows a typical selection of left and right grid for block failure, the center of the slip and the result of the slope stability analysis for landfill models with MSW only. The corresponding factor of safety against block failure is also shown on the Figure Figure 4-12 Typical Results for Landfill With MSW Only With Block Failure Analysis Lastly, a landfill model was generated incorporating the placement of biosolids in trenches as shown in Figure The width of the trench was about feet and spacing 59
76 between the trenches was about fifteen feet. The depth of the trenches was about six feet. Biosolids were added in the trenches. The trenches were then filled with regular MSW and compacted with regular effort. The compaction effort needed to compact the waste layer was less based on discussions with the landfill operators. This was done to understand the influence of addition of biosolids to the landfill with emphasis on their placement. Slope stability analysis was then conducted on landfill models with side slope varying from 1:2 to 1:4. Although side slope 1:2 is not permitted in Florida state regulation, here it is studied as extreme condition. 4.7 Summary This chapter described the methodology for the field test, statistical analysis of the field data and the interpretation of the reduced field data. The disposable of biosolids in trenches in landfill was discussed. This chapter also discussed the methodology followed for slope stability analysis using the computer software SLOPE/W. 60

77 Figure 4-13 Typical Landfill Profile with Biosolids Placed In Trenches 61
78 5. RESULTS OF TESTING AND MODELING The results are reported in two sections. The first section presents the results from the field explorations and the second from the subsequent slope stability analysis conducted using landfill models to determine the effects of various material and geometric parameters on the stability of the landfill. Lastly, a sensitivity analysis is conducted for the effects of the critical parameters. 5.1 Results from Field Explorations Field tests conducted consisted of Cone Penetration Test on areas receiving biosolids, areas without biosolids and in the landfill bioreactor area with leachate recirculation. The raw CPT data are presented in Appendix B: Cone Logs. The average values of the tip resistance, sleeve resistance, friction ratio and pore pressure for the three areas tested are presented in Tables 5-1 to 5-3. CPT data were used to estimate the material properties in the areas tested. The regression curve of tip resistance and depth had a positive slope which indicates as the depth increases the vertical effective pressure increases and consequently the tip resistance increases. Table 5-1 summarizes the averages for the four parameters measured in the pilot area. The average tip resistances are in the range of 60 to 100 tsf, average sleeve resistance in the range of 0.7 to 2.4 tsf, which is similar to the range of tip resistance and sleeve resistance from literature review done on CPT used in landfills. 62
79 Table 5-1 Average Tip Resistance, Sleeve Resistance, Friction Ratio and Pore Pressure for Pilot Area for Statistical Analysis. Sounding Tip Resistance (tsf) Sleeve Resistance Friction Ratio Pore Pressure Average Std. Dev. Average Std. Dev Average Std. Dev Average Std. Dev PA PA PA PA PA PA PA PA PA PA PA PA PA PA PA PA PA PA PA Similarly Table 5-2 summarizes the average tip resistance, sleeve resistance, friction ratio and pore pressure measured in the control area. The average tip resistances are in the range of 60 to 90 tsf and average sleeve resistance in the range of 1.2 to 1.9 tsf. The boring CA-01 had to be terminated earlier than the desired depth of 20 feet due to refusal hit, so the averages are not reported in the Table
80 Table 5-2 Average Tip Resistance, Sleeve Resistance, Friction Ratio and Pore Pressure for Control Area before Statistical Analysis. Sounding Sleeve Resistance Tip Resistance (tsf) Friction Ratio Pore Pressure (tsf) (tsf) Std. Std. Std. Std. Average Average Average Average Dev. Dev. Dev. Dev. CA -01 NA NA NA NA NA NA NA NA CA CA CA CA Note NA: The boring had to be terminated due to refusal. Table 5-3 summarizes the averages for tip resistance, sleeve resistance, friction ratio and pore pressure in the bioreactor area. The boring depth in the BA was 30 feet deep as compared to the 20 feet from the PA and CA. The average tip resistances measured are in the range of 60 to 95 tsf and average sleeve resistance measured in the range of 1.6 to 2.0 tsf. Table 5-3 Average Cone Tip Resistance, Sleeve Resistance, Friction Ratio and Pore Pressure For Bioreactor Area before Statistical Analysis. Sounding Tip Resistance (tsf) Sleeve Resistance (tsf) Friction Ratio Pore Pressure (tsf) Std. Std. Std. Average Std. Dev Average Dev Average Dev Average Dev BA BA BA BA Table 5-4 Average Tip Resistance, Sleeve Resistance, Friction Ratio and Pore Pressure in the PA, CA and BA Area Tip Resistance (tsf) Sleeve Resistance (tsf) Friction Ratio Pore Pressure (tsf) PA CA BA
81 In table 5-4 the averages for tip resistance, sleeve resistance, friction ratio and pore pressure for all the areas studied are summarized. The averages in each areas for all the parameters measured are almost in the same range. The region of solid waste was identified as a very heterogeneous medium which is consistent with previous field exploration studies (Shank 1993). Thus, the region of solid waste is characterized by a highly variable set of test results. The CPT results indicated that the cone frequently encountered stiff objects, which produced sharp peaks in the tip resistance measurements. This resulted in highly variable readings. However, a trend of increasing lower bound tip resistance with depth, was apparent in most the tests. It is important, therefore, to reduce these data by eliminating unrealistic outliers based on cone tip resistance and pore pressure values. This procedure improves the confidence level in the actual results used for further modeling studies. Because of the relatively erratic readings from the CPT probes, daily or interim cover soil could not be distinguished from the refuse. After the statistical analysis on the CPT data an attempt was made to estimate the location and effects of the biosolids layer within the MSW mass. However, this layer could not be identified explicitly in the landfill with CPT data. As the biosolids added had only about 3% solids content, it is likely that the biosolids got very well mixed up with the MSW. Based on average values of the MSW parameters and from the soil classification charts developed by Robertson and Campanella (1983), the landfill material is similar to Coarse grained Sandy-Silty soil. By using the method proposed by Lunne (1997) and friction angle chart developed by Robertson and Campanella (1983), it is possible to derive the profile of friction angle as a 65
82 function of depth from the piezocone penetration data for the landfill. The average values of the friction angle for the areas tested in landfill are shown in Table 5-5. The average value of friction angle is 29º. This value of friction angle (φ) is used for subsequent slope stability analyses. The negative intercept on the effective vertical stress axis could not be determined in the field, so the value of a could not be estimated from the CPT profiles. Thus, cohesion could not be determined for the landfill material from the CPT data. Table 5-5 Average Estimated Friction Angle for the Different Areas in Lanfill Tested Area Tested Friction Angle Bioreactor Area (BA) 28.7º Control Area (CA) 29.2º Pilot Area (PA) 29.0º 5.2 Results from Slope Stability Analysis Slope stability analysis was conducted using commercially available software SLOPE/W on model landfills with and without biosolids. Biosolids were placed in trenches as this was determined to be the most suitable practice from field study at the Highland County Landfill. Different values of side slope such as 1:2, 1:3 and 1:4 were modeled. The landfill was modeled with shear strength parameter obtained from the field test as discussed before. Two potential failure mechanisms, circular and block failure were considered Slope Stability Analysis on Landfills Considering Circular Failure. The landfill profiles described in Figures 4-9 and 4-13 were analyzed using SLOPE/W. Two options were considered in modeling. 1. Landfill with MSW only. 66
83 2. Landfill with MSW and biosolids which were placed in trenches Landfill with MSW only Landfill side slopes are considered to be stable when a factor of safety greater than 1.5, is determined the minimum required factor of safety for a stable landfill (Shafer 2000). The profile of a landfill model with MSW only was shown in Figure 4-9. The results of the slope stability analysis are shown in Figures 5-1 to 5-3 for side slope 1:2, 1:3 and 1:4 respectively. Table 5-6 summarizes the factor of safety for each value of side slope along with the related reliability index (see equation 4.9 for more details about reliability index). Table 5-6 Factor Safety for Landfill with MSW Only with Different Side Slopes. Side Slope Factor of Safety Reliability Index 1: : : Flattening the slope not only reduces the sum of the driving forces, but also tends to force the failure surface deeper into the ground. The change in length of the failure surface increases in the resisting forces because the shear strength is distributed over a wider area, thereby enhancing stability. This is due to the fact that the shearing resistance is proportional to the length of the failure surface. The reduction in slope increases the length of the failure surface to create more sliding resistance. From the model, it is seen that as the slope is increased the factor of safety decreases. 67

84 Figure 5-1 Landfill with MSW Only Side Slope 1:2 68
85 Figure 5-2 Landfill with MSW Only Side Slope 1:3 69

86 Figure 5-3 Landfill with MSW Only Side Slope 1: Landfill with MSW and biosolids Slope stability analyses were also conducted for landfill models with both MSW and biosolids. The biosolids were placed in the landfill in trenches. Figure 4-13 showed a typical cross section of a landfill with biosolids disposed of in trenches. The analysis results are shown 70
87 in Figures 5-4 to 5-6 and then summarized in Table 5-7 for the three values of side slopes under consideration. Table 5-7 Factor of Safety for Landfill with MSW and Biosolids with Different Side Slopes. Side Slope Factor of Safety Reliability Index 1: : : When compared with the values in Table 5-6 the factor of safety produced suggests that the stability of the landfill slope has been reduced with the addition of biosolids. Slope stability analysis was also carried out when the trenches were allowed to extend all the way to the edge of the side slope. The results of the slope stability runs are shown in Figures 5-6 to 5-9. Table 5-8 provides a summary of the factor of safety and clearly indicates a reduction in the stability if the biosolids trenches are close to the edges. This scenario allows a weak plane to develop close to the side slope and encourages the failure plane to pass through this weak layer. This situation is considered unstable and needs to be avoided. Table 5-8 Factor of Safety for Landfill with MSW and Biosolids with Trenches Close to Side Slope. Side Slope Factor of Safety Reliability Index 1: : :
88 The results indicate that the factor of safety decreases and the slope are unstable. These results are similar to the previous work by Koodhathinkal (2003) who found that the factor of safety for continuous layer of biosolids (15%) in MSW was about 1.15 for 1:3 slope and 1.41 for 1:4 slopes. The lower values may be attributed to a lower friction angle for biosolids that are placed as discrete layers and may not be completely mixed in with the MSW. 72

89 Figure 5-4 Landfill with MSW and Biosolids in Trenches Side Slope 1:2 73

90 Figure 5-5 Landfill with MSW and Biosolids in Trenches Side Slope 1:3 74

91 Figure 5-6 Landfill with MSW and Biosolids in Trenches Side Slope 1:4 75

92 Figure 5-7 Landfill with MSW and Biosolids in Trenches with Trenches Close to Edge of Sides Side Slope 1:2 76

93 Figure 5-8 Landfill with MSW and Biosolids in Trenches with Trenches Close to Edge of Sides Side Slope 1:3 77

94 Figure 5-9 Landfill with MSW and Biosolids in Trenches with Trenches Close to Edge of Sides Side Slope 1:4 78
95 5.2.2 Slope Stability Analysis on Landfills Considering Block Failure Slope stability analyses were conducted on landfill models considering block failure mode. Once again, two types of models were considered in modeling, landfills with MSW only, and landfills with MSW and biosolids placed in trenches Landfill with MSW only Slope stability analysis results on landfill models with MSW only are shown in Figures 5-10 to 5-12 for the three side slopes. Table 5-9 shows the factor of safety for various slopes analyzed along with corresponding reliability indices. Table 5-9 Factor of Safety for Landfill with MSW Only with Different Side Slopes. Side Slope Factor of Safety Reliability Index 1: : : Block failure analysis is used to estimate the factor of safety against sliding in conditions where the shearing strength of the MSW is greater than that of the foundation soils. In all cases, it is evident that analysis using block failure as the basis yields significantly higher factor of safety in comparison to slip surface failure. The factor of safety for all slopes can be considered very stable for this mode of failure. 79

96 Figure 5-10 Landfill with MSW Only Side Slope 1:2 80

97 Figure 5-11 Landfill with MSW Only Block Failure Side Slope 1:3 81

98 Figure 5-12 Landfill with MSW Only Side Slope 1: Landfill with MSW and Biosolids Slope stability analyses were also conducted on landfill models with MSW and biosolids which were disposed in trenches. In Figure 4-13 a typical cross section of landfill with biosolids in trenches was presented. The analysis results are shown in Figures 5-13 to 5-15 as the graphical 82
99 output of the modeling analysis. Table 5-10 summarizes the results and indicates, once again, that there is a considerable reduction in the factor of safety (compared with values in Table 5-9) due to the addition of biosolids. Table 5-10 Factor of Safety for Landfill with MSW and Biosolids with Different Side Slopes Side Slope Factor of Safety Reliability Index 1: : : Similarly, modeling studies were conducted when the trenches were extended close to the sides of the landfill. The results are plotted in Figures 5-13 to 5-15 and summarized in Table Similar to the case of slip surfaces, the factor of safety is much lower when trenches approach the side slopes and this situation needs to be avoided. Table 5-11 Factor of Safety for Landfill with Biosolids with Trenches Close to the Edge of Slope. Side Slope Factor of Safety Reliability Index 1: : :

100 Figure 5-13 Landfill with Biosolids in Trenches Side Slope 1:2 84
101 Figure 5-14 Landfill with Biosolids in Trenches Side Slope 1:3 85

102 Figure 5-15 Landfill with Biosolids in Trenches Side Slope 1:4 86
103 Figure 5-16 Landfill with Biosolids in Trenches with Trenches Close to Edge of Sides Side Slope 1:2 87

104 Figure 5-17 Landfill with Biosolids in Trenches with Trenches Close to Edge of Sides Side Slope 1:3 88

105 Figure 5-18 Landfill with Biosolids in Trenches with Trenches Close to Edge of Sides Side Slope 1:4 89
106 5.3 Comparison of Field and Lab data In a previous laboratory tests were conducted on MSW and with varying percentages of biosolids and lime sludge added to the MSW. The shear strength parameter obtained for only the MSW are cohesion of 4.25 psi and friction angle of 28.1º. With the addition of biosolids and lime sludge, the shear strength parameters changed significantly for the material. Biosolids were added by weight to percentages in the range of 15 to 50%. The cohesion obtained was in the range of 4.68 to 6.33 psi and friction angle in the range of to 12.29º respectively. Similarly with lime sludge addition in the weight ratio of 15 to 50% the cohesion determined was in the range of 2.52 to 3.56 psi and friction angle in the range of to 29.40º respectively (Koodhathinkal 2003). From the field test conducted on the landfill the estimated friction angle for the mixture of MSW and biosolids was found to be 29º. Cohesion could not be determined from the field studies. Modeling analysis was conducted using the laboratory data for shear strength parameters. The factor of safety for landfill with only MSW was 2.67 for slope 1:3 and from the field data the factor of safety is for the same slope. Thus, the factor of safety for both the models is almost equal. Landfill modeled with biosolids varying in weight percentage and the factor of safety was in the range of 1.48 to 1.53, when biosolids disposed as discrete layers in the landfill. Similarly when the biosolids were disposed as pockets the factor was determined to be 2.36 (Koodhathinkal 2003). By comparison, from the field data the landfill models with biosolids disposed in trenches produced factor of safety of which is quite similar as well. 90
107 5.4 Sensitivity Analysis A sensitivity analysis was carried out for the parameters used in slope stability modeling landfill. This analysis was conducted to study the sensitivity of the model to change in its input parameters the friction angle and density Effects of Friction Angle Tables 5-12 and 5-13 show the results of the sensitivity analysis for friction angle. An increase in friction angle provides more strength to the material which in turn translates to a higher factor of safety against slope failure. Figures 5-19 and 5-24 show a linear relationship between friction angle and factor of safety. Table 5-12 Variation of Factor of Safety with Friction Angle for Different Side Slope for Slip Surface Failure Side Slope/Phi : : : Table 5-13 Variation of Factor of Safety with Friction Angle for Different Side Slope for Block Failure Side Slope/Phi : : :
108 Sensitivity Analysis with varying Friction Angle (Side Slope 1:2, Slip Surface) Factor of Safety y = x R 2 = Friction Angle (phi) Figure 5-19 Sensitivity Analysis Result for Landfills with MSW Only (Side Slope 1:2, Slip Failure) Sensitivity Analysis with varying Friction Angle (Side Slope 1:3, Slip Surface) Factor of Safety y = x R 2 = Friction Angle (phi) Figure 5-20 Sensitivity Analysis Result for Landfill with MSW Only (Side Slope 1:3, Slip Failure) 92
109 Senstivity Analysis with varying Friction Angle (Side Slope 1:4, Slip Surface) Factor of Safety y = x R 2 = Friction Angle (phi) Figure 5-21 Sensitivity Analysis Result for Landfill with MSW Only (Side Slope 1:4, Slip Failure) Sensitivity Analysis with varying Friction Angle (Side Slope 1:2, Block Failure) 10 Factor of Safety y = x R 2 = Friction Angle (phi) 50 Figure 5-22 Sensitivity Analysis Result for Landfill with MSW Only (Side Slope 1:2, Block Failure) 93
110 Sensitivity Analysis with varying Friction Angle (Side Slope 1:3, Block Failure) Factor of Safety y = x R 2 = Friction Angle (phi) 50 Figure 5-23 Sensitivity Analysis Result for Landfill with MSW Only (Side Slope 1:3, Block Failure) Sensitvity Analysis with varying Friction Angle (Side Slope 1:4, Block Failure) 10 Factor of Safety y = x R 2 = Friction Angle (phi) 50 Figure 5-24 Sensitivity Analysis Result for Landfill with MSW Only (Side Slope 1:4, Block Failure) 94
111 The shear strength increases with increase in friction angle (Figures 5-25 and 5-30). Tables 5-14 and 5-15 summarize the results for the parametric study of landfills with biosolids with varying friction angle. The results are similar to landfill accepting MSW only. Table 5-14 Variation of Factor of Safety oith Friction Angle for Different Side Slope for Slip Surface Failure Landfill with Biosolids Side Slope/Phi : : : Table 5-15 Variation of Factor of Safety with Friction Angle for Different Side Slope for Block Failure Landfill with Biosolids Side Slope/Phi : : :
112 Sensitivity Analysis with varying friction angle landfill with MSW and biosolids (Side Slope 1:2, Slip Failure) Factor of Safety y = 0.066x R 2 = Friction Angle (phi) Figure 5-25 Sensitivity Analysis Result Landfill with MSW and Biosolids (Side Slope 1:2, Slip Failure) Sensitivity Analysis with varying friction angle landfill with MSW and biosolids (Side Slope 1:3, Slip Failure) 50 Factor of Safety y = x R 2 = Friction Angle (phi) Figure 5-26 Sensitivity Analysis Result Landfill with MSW and Biosolids (Side Slope 1:3, Slip Failure) 96
113 Sensitivity Analysis with varying friction angle landfill with MSW and biosolids (Side Slope 1:4, Slip Failure) Factor of Safety y = x R 2 = Friction Angle (phi) Figure 5-27 Sensitivity Analysis Result Landfill with MSW and Biosolids (Side Slope 1:4, Slip Failure) Sensitivity Analysis with varying friction angle landfill with MSW and biosolids (Side Slope 1:2, Block Failure) 5 Factor of Safety y = x R 2 = Friction Angle (phi) 50 Figure 5-28 Sensitivity Analysis Result Landfill with MSW and Biosolids (Side Slope 1:2, Block Failure) 97
114 Sensitivity Analysis with varying friction angle landfill with MSW and biosolids (Side Slope 1:3, Block Failure) Factor of Safety y = x R 2 = Friction Angle Figure 5-29 Sensitivity Analysis Result Landfill with MSW and Biosolids (Side Slope 1:3, Block Failure) Sensitivity Analysis with varying friction angle landfill with MSW and biosolids (Side Slope 1:4, Block Failure) 4 Factor of Safety y = x R 2 = Friction Angle (phi) 50 Figure 5-30 Sensitivity Analysis Result Landfill with MSW and Biosolids (Side Slope 1:4, Block Failure) 98
115 5.4.2 Effects of Density of MSW The factor of safety remains constant with density changes (Figures 5-31 to 5-42) which indicates that in the range studied, i.e lb/ft 3, the density of MSW does not have a significant impact on the factor of safety. Tables 5-16 to 5-17 present results of the variation of density for side slope 1:2 to 1:4 with slip surface failure and block failure conditions. Table 5-16 Variation of Factor of Safety with Density for Different Side Slope Slip Surface Failure Landfill with MSW Only Side Slope/Density : : : Table 5-17 Variation of Factor of Safety with Density for Different Side Slope Block Failure Landfill with MSW Only Side Slope/Density : : :
116 Sensitivity Analysis with varying density Landfill with MSW only (Side Slope 1:2, Slip Surface) Factor of Safety y = x R 2 = Density (pcf) Figure 5-31 Sensitivity Analysis Result of Landfill with MSW Only (Side Slope 1:2, Slip Surface) Sensitivity Analysis with varying Density Landfill with MSW only (Side Slope 1:3, Slip Surface) 3 Factor of Safety y = x R 2 = Density (pcf) Figure 5-32 Sensitivity Analysis Result of Landfill with MSW Only (Side Slope 1:3, Slip Surface) 100
117 Sensitivity Analysis with varying density Landfill with MSW only (Side Slope 1:4, Slip Surface) 3.5 Factor of Safety y = x R 2 = Density (pcf) Figure 5-33 Sensitivity Analysis Result of Landfill with MSW Only (Side Slope 1:4, Slip Surface) Sensitivity Analysis with varying density Landfill with MSW only (Side Slope 1:2, Block Failure) 6 Factor of Safety y = x R 2 = Density (pcf) Figure 5-34 Sensitivity Analysis Result of Landfill with MSW Only (Side Slope 1:2, Block Surface) 101
118 Sensitivity Analysis with varying density Landfill with MSW only (Side Slope 1:3, Block Failure) Factor of Safety y = x R 2 = Density (pcf) Figure 5-35 Sensitivity Analysis Result of Landfill with MSW Only (Side Slope 1:3, Block Surface) Sensitivity Analysis with varying density Landfill with MSW only (Side Slope 1:4, Block Failure) 6 Factor of Safety y = x R 2 = Density (pcf) Figure 5-36 Sensitivity Analysis Result of Landfill with MSW Only (Side Slope 1:4, Block Surface) 102
119 Table 5-18 Variation of Factor of Safety with Density for Different Side Slope Landfill with MSW and Biosolids Side Slope/Density : : : Table 5-19 Variation of Factor of Safety with Density for Different Side Slope Landfill Accepting Biosolids Block Failure Side Slope/Density : : : Sensitivity Analysis with varying density Landfill with MSW and Biosolids (Side Slope 1:2, Slip Surface) 2 Factor of Safety y = x R 2 = Density (pcf) Figure 5-37 Sensitivity Analysis Result Landfill with MSW and Biosolids (Side Slope 1:2, Slip Surface) 103
120 3 Sensitivity Analysis with varying density Landfill with MSW and Biosolids (Side Slope 1:3, Slip Surface) Factor of Safety y = x R 2 = Density (pcf) Figure 5-38 Sensitivity Analysis Result Landfill with MSW and Biosolids (Side Slope 1:3, Slip Surface) Sensitivity Analysis with varying density Landfill with MSW and Biosolids (Side Slope 1:4, Slip Surface) 3 Factor of Safety y = x R 2 = Density (pcf) Figure 5-39 Sensitivity Analysis Result Landfill with MSW and Biosolids (Side Slope 1:4, Slip Surface) 104
121 Sensitivity Analysis with varying density Landfill with MSW and Biosolids (Side Slope 1:2, Block Surface) 3 Factor of Safety y = x R 2 = Density (pcf) Figure 5-40 Sensitivity Analysis Result Landfill with MSW and Biosolids (Side Slope 1:2, Block Failure) Sensitivity Analysis with varying density Landfill with MSW and biosolids (Side Slope 1:3, Block Failure) 3 Factor of Safety y = -1E-04x R 2 = Density (pcf) Figure 5-41 Sensitivity Analysis Result Landfill with MSW and Biosolids (Side Slope 1:3, Block Failure) 105
122 Sensitivity Analysis with varying density Landfill with MSW and Biosolids (Side Slope 1:4, Block Surface) Factor of Safety 3 y = x R 2 = Density (pcf) Figure 5-42 Sensitivity Analysis Result Landfill with MSW and Biosolids (Side Slope 1:4, Block Failure) 5.5 Summary This chapter discussed the results of the field tests. The internal friction angle determined to be 29º. Cohesion could not be estimated in the field. The biosolids layer and daily or intermediate soil cover could not be identified in the field. It then described the slope stability analysis on various landfill configurations and with addition of biosolids in trenches. The slope stability analyses results using slip and block failure models were discussed. As the slope decrease the factor of safety increases. The trenches should not in be carried close to the edge of the slope. The factor of safety increases with increases in internal friction angle and remains constant over the range of density studied. The next chapter discusses the conclusions arrived after conducting field tests and slope stability analyses. It also gives recommendations for further research. 106
123 6. CONCLUSION AND RECOMMENDATIONS 6.1 Conclusions The following conclusion can be drawn from the extensive field testing on the Highlands County Landfill and slope stability analysis conducted during the course of this research. 1. Laboratory testing needs to be supplemented with full-scale field tests. CPT is the one the best choices for in-situ testing to estimate the shear strength. 2. Based on the analysis of CPT data, it is found that the tip resistance increases with increase in depth. This indicates a net increase in effective stress with depth. 3. The average value of the friction angle for the landfill material from the CPT data is found to be 29º. Based on the present CPT data, cohesion could not be determined in the field. This is due to extreme scatter in the data from material non-homogeneity. 4. With an increase in friction angle the shear strength of material increases and consequently the factor of safety for landfill increases. 5. The factor of safety remains constant with density changes over the range studied in the parametric study, i.e lb/ft 3. Thus the density of MSW does not have a significant impact on the factor of safety. 6. A reduction in side slope increases the length of the failure surface to create more sliding resistance. Therefore, as the slope increases the factor of safety decreases. 7. Disposing of biosolids in trenches is a feasible solution from both slope stability point of consideration and ease of field application practice. Trenches should not be close to the edge side of the landfill as the factor of safety reduces significantly. 107
124 8. Berms at the toe of slopes contribute to resisting forces and as a result there is an increase in the factor of safety when considering local failures. 9. The added biosolids layer could not be clearly distinguished in the landfill as the solids content of the biosolids was about 3% and the wet material was mixed well with MSW. 10. Due to relatively erratic readings from the CPT probes, daily or interim cover soil could not be distinguished from the refuse. 6.2 Recommendations for Further Study Following are the recommendations for the further study: 1. An extensive CPT program should be conducted for different landfills to obtain more data and compare. 2. CPT should be carried out again at the same locations to see the changes in properties with time. 3. More study is needed on the measurement of pore pressure, it is important to distinguish between actual pore water pressure and any gas pressure. The percentage of gas pressure within the total is unknown and needs to be investigated. 4. Correlation of CPT data with other available field testing method such a Standard Penetration Test (SPT), Pressurement Test (PMT), Dilatometer Test (DMT) needs to be carried out to gain more confidence in data. 108
125 APPENDIX A SITE LOCATION MAP 109
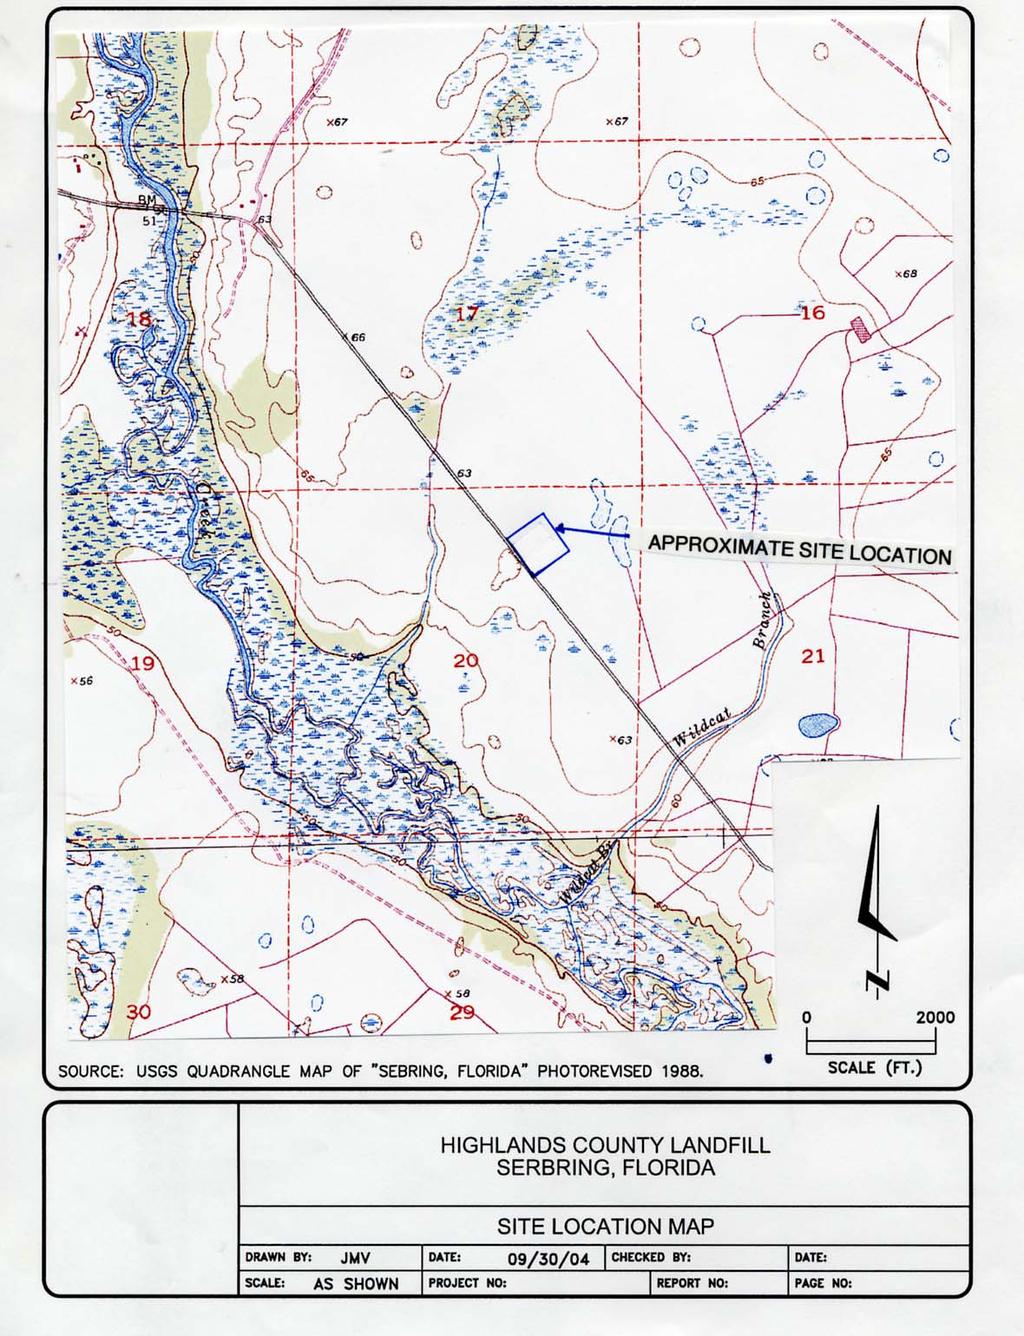
126 110
127 APPENDIX B CONE PENETRATION TEST LOGS 111
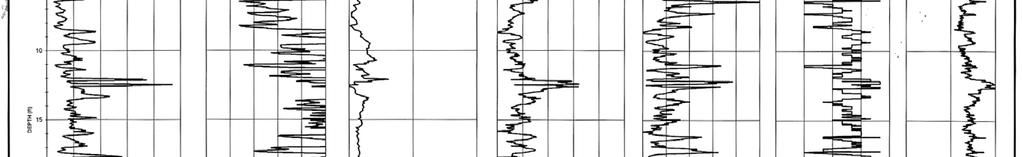
128 112
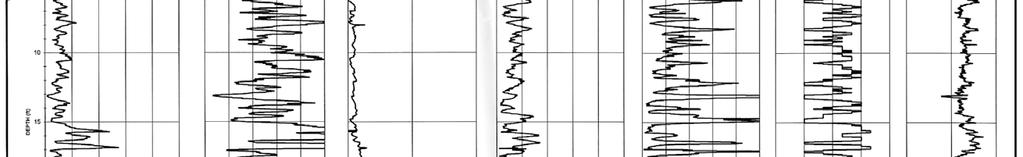
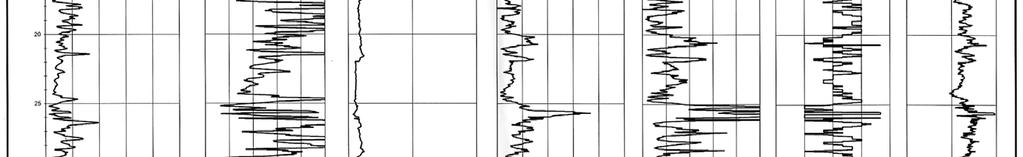
129 113
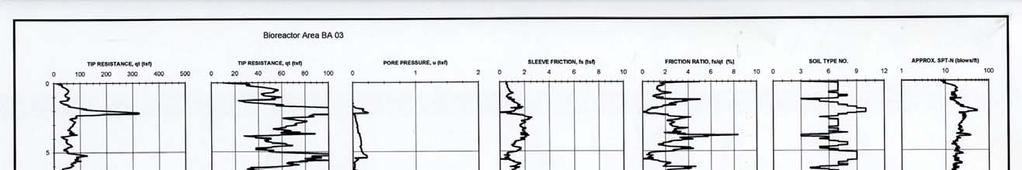
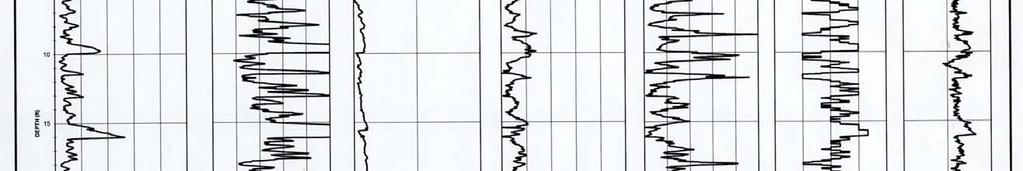
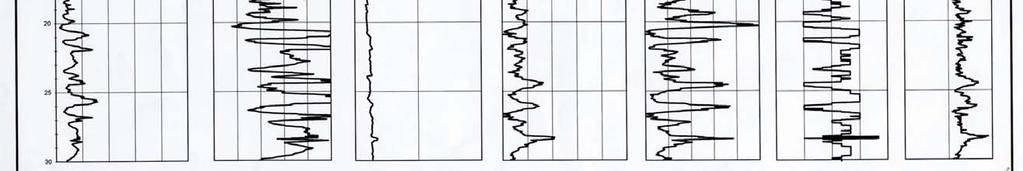
130 114
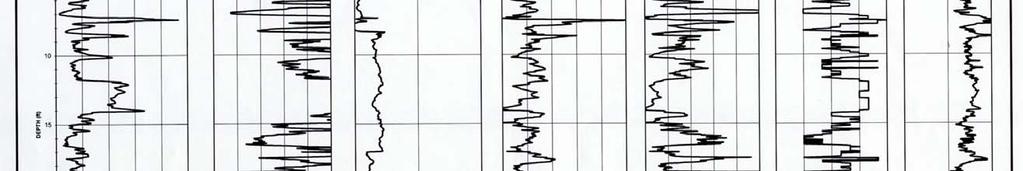
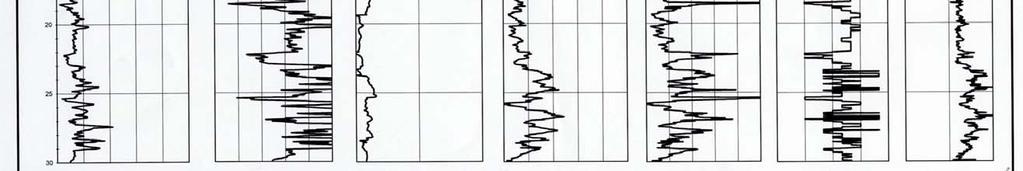
131 115
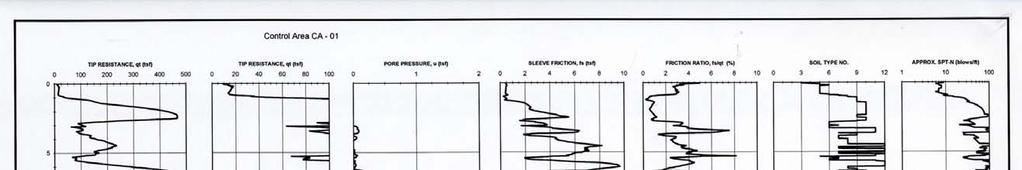
132 116
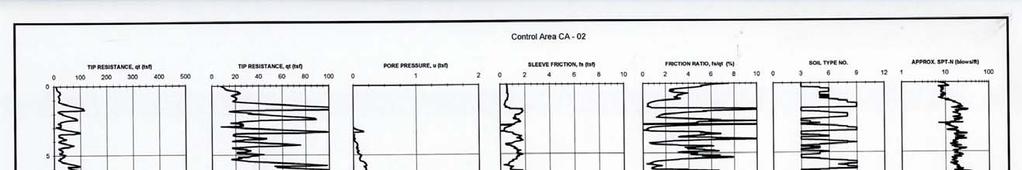
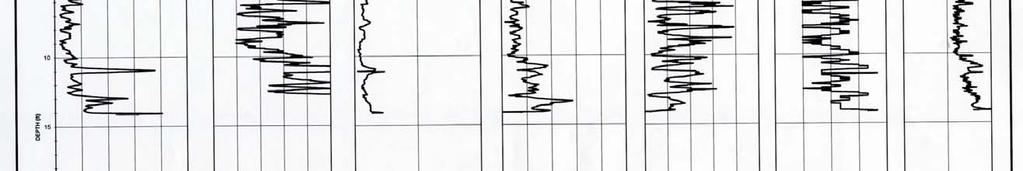
133 117
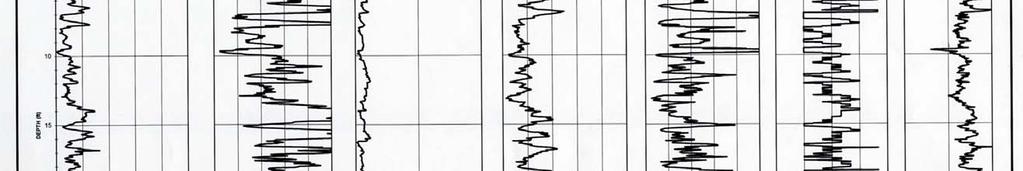
134 118
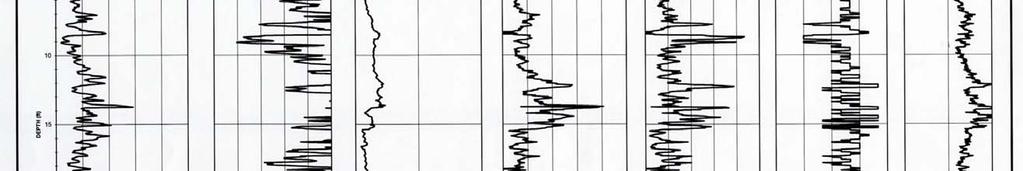
135 119
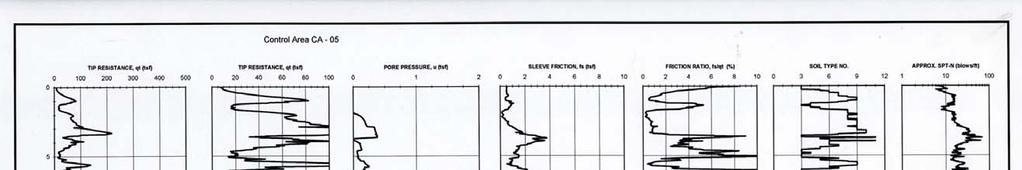
136 120
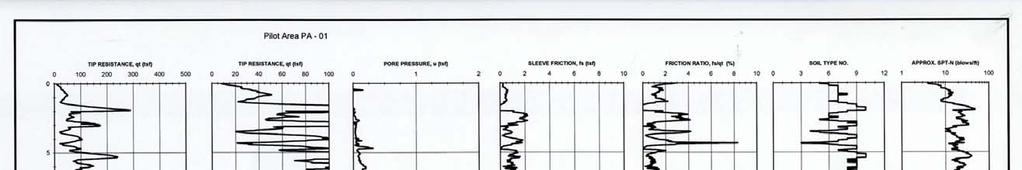
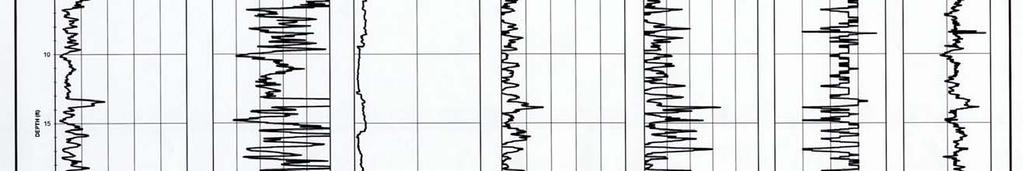
137 121
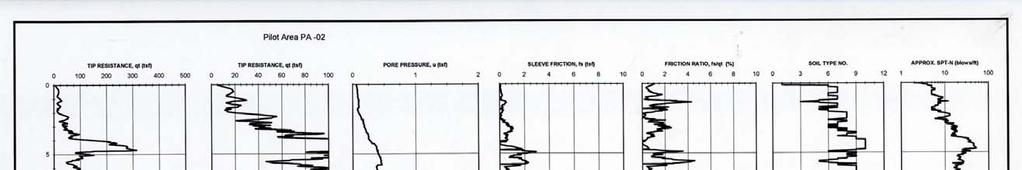
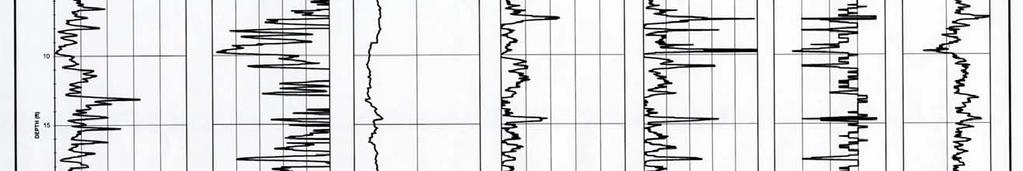
138 122
139 123
140 124
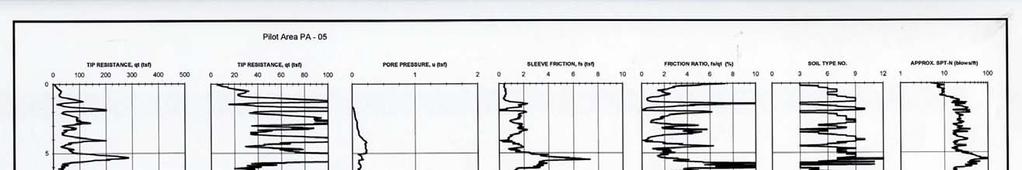
141 125
142 126
143 127
144 128
145 129
146 130
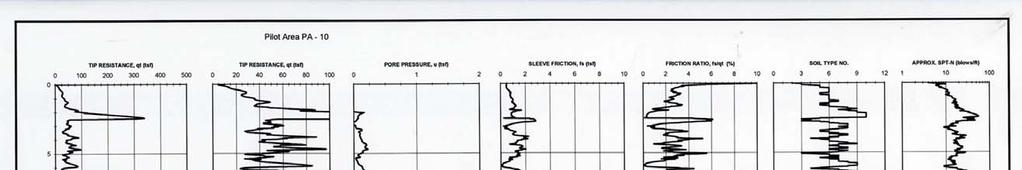
147 131

148 132
149 133
150 134
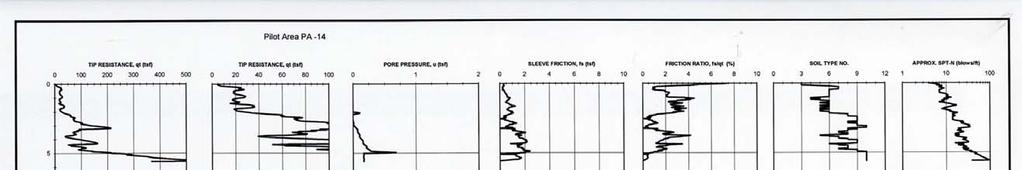
151 135
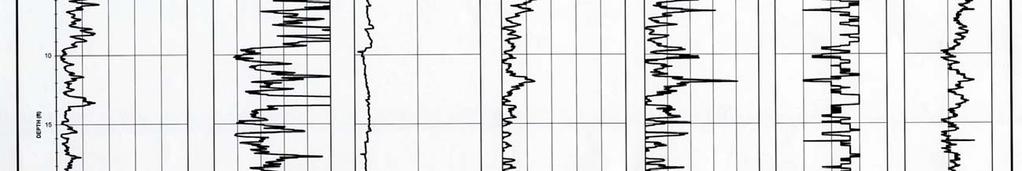
152 136
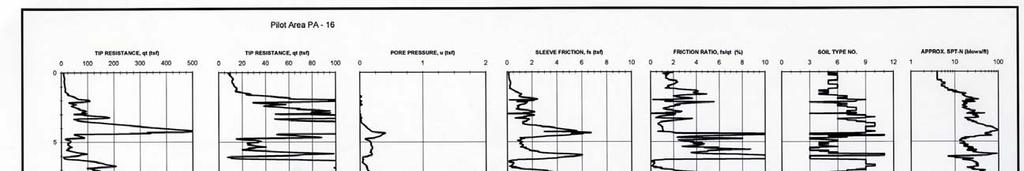
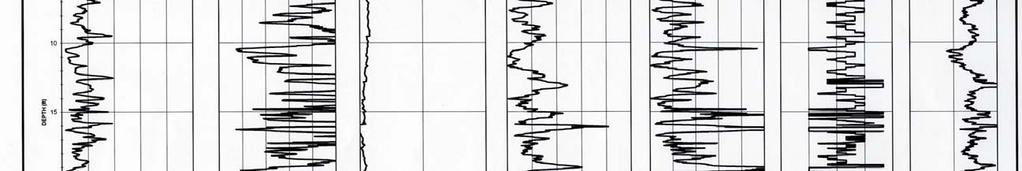
153 137
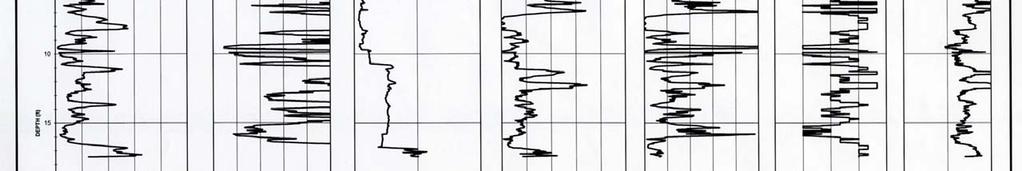
154 138
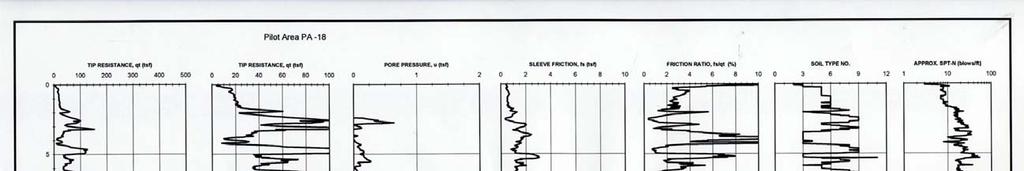
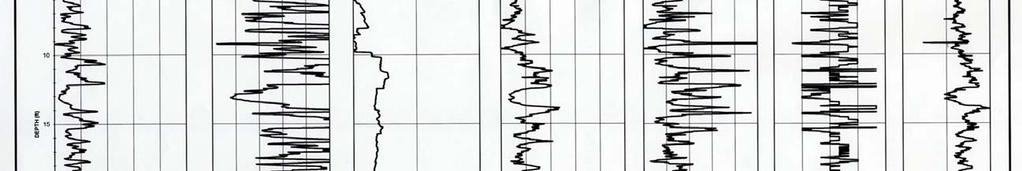
155 139
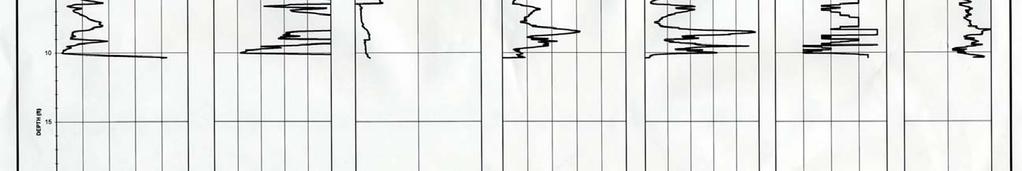
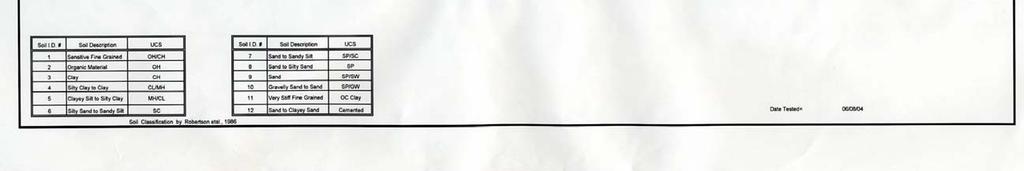
156 140
Stability of slopes of municipal solid waste landfills with co-disposal of biosolids
 Geo-Environment and Landscape Evolution II 215 Stability of slopes of municipal solid waste landfills with co-disposal of biosolids M. Chopra, D. Reinhart, M. Vajirkar & B. Koodhathinkal University of
CONE PENETRATION TESTS
 February 25, 2015 John Doe, P.E. Acme Engineering and Testing 1234 Test Avenue, Suite 204 Lake Wales, FL 33853 Re: Sample CPT Soundings Dear Mr. Doe, Direct Push Services, LLC (DPS) was retained by Acme
Tension Cracks. Topics Covered. Tension crack boundaries Tension crack depth Query slice data Thrust line Sensitivity analysis.
 Tension Cracks 16-1 Tension Cracks In slope stability analyses with cohesive soils, tension forces may be observed in the upper part of the slope. In general, soils cannot support tension so the results
Hardware Triaxial and Consolidation Testing Systems Pressure Measurement and Control
 25 GDS Helpsheet Hardware Triaxial and Consolidation Testing Systems Pressure Measurement and Control World Leaders in Computer Controlled Testing Systems for Geotechnical Engineers and Geologists 1. Digital
DEVELOPMENT OF A ROBUST PUSH-IN PRESSUREMETER
 DEVELOPMENT OF A ROBUST PUSH-IN PRESSUREMETER Roger Failmezger, P.E. In-Situ Soil Testing, L.C., Lancaster, Virginia, USA ABSTRACT A push-in pressuremeter was developed using slotted steel casing with
For a cantilever pile wall shown in Figure 1, assess the performance of the system and answer the following questions.
 Question 1 For a cantilever pile wall shown in Figure 1, assess the performance of the system and answer the following questions. Figure 1 - Cantilever Pile Wall i. Estimate the net resulting horizontal
APPENDIX G SCA BASIN CALCULATIONS
 ONONDAGA LAKE SEDIMENT MANAGEMENT FINAL DESIGN APPENDIX G SCA BASIN CALCULATIONS p:\honeywell -syr\444853 - lake detail design\09 reports\9.22 sediment management final design\110930 submittal\110906 onon
Analysis of dilatometer test in calibration chamber
 Analysis of dilatometer test in calibration chamber Lech Bałachowski Gdańsk University of Technology, Poland Keywords: calibration chamber, DMT, quartz sand, FEM ABSTRACT: Because DMT in calibration test
Prof. B V S Viswanadham, Department of Civil Engineering, IIT Bombay
 43 Module 3: Lecture - 5 on Compressibility and Consolidation Contents Stresses in soil from surface loads; Terzaghi s 1-D consolidation theory; Application in different boundary conditions; Ramp loading;
UNIT-I SOIL EXPLORATION
 SIDDHARTH GROUP OF INSTITUTIONS :: PUTTUR Siddharth Nagar, Narayanavanam Road 517583 QUESTION BANK (DESCRIPTIVE) Subject with Code : Geotechnical Engineering - II (16CE127) Year & Sem: III-B.Tech & II-Sem
Pressuremeters in Geotechnical Design
 Pressuremeters in Geotechnical Design B.G. CLARKE Department of Civil Engineering University of Newcastle upon Tyne BLACK1E ACADEMIC & PROFESSIONAL An Imprint of Chapman & Hall London Glasgow Weinheim
BIOREACTOR LANDFILLS: GEOTECHNICAL ASPECTS OF STABILITY EVALUATION
 BIOREACTOR LANDFILLS: GEOTECHNICAL ASPECTS OF STABILITY EVALUATION Presented by James Law SCS Engineers Master Class ISWA Congress 2009 Lisbon 10 October 2009 PRESENTATION OVERVIEW Landfill Slope Stability
Cubzac-les-Ponts Experimental Embankments on Soft Clay
 Cubzac-les-Ponts Experimental Embankments on Soft Clay GEO-SLOPE International Ltd. www.geo-slope.com 1, 7 - th Ave SW, Calgary, AB, Canada TP T Main: +1 3 9 Fax: +1 3 39 Introduction In the 197 s, a series
INSTITUTE OF AERONAUTICAL ENGINEERING (Autonomous) Dundigal, Hyderabad
 Dundigal, Hyderabad") INSTITUTE OF AERONAUTICAL ENGINEERING (Autonomous) Dundigal, Hyderabad - 500 043 CIVIL ENGINEERING Tutorial Question Bank Name : FOUNDATION ENGINEERING Code : A60126 Class : III B. Tech II Semester Branch
INSTITUTE OF AERONAUTICAL ENGINEERING (Autonomous) Dundigal, Hyderabad - 500 043 CIVIL ENGINEERING Tutorial Question Bank Name : FOUNDATION ENGINEERING Code : A60126 Class : III B. Tech II Semester Branch
CENGRS GEOTECHNICA PVT. LTD. Job No Sheet No. 1
 CENGRS GEOTECHNICA PVT. LTD. Job No. 214030 Sheet No. 1 INTERIM REPORT ON GEOTECHNICAL INVESTIGATION FOR PROPOSED 66 KV GRID PLOT AT G-7, DWARKA, NEW DELHI. 1.0 INTRODUCTION 1.1 Project Description M/s.
computed using Equation 3-18 by setting the 2nd term equal to 0 and K A equal to K o and using the pressure distribution as shown in Figure 3-23.
 computed using Equation 3-18 by setting the 2nd term equal to 0 and K A equal to K o and using the pressure distribution as shown in Figure 3-23. (2) For the resisting side, passive pressure theory indicates
CHAPTER 5: VACUUM TEST WITH VERTICAL DRAINS
 CHAPTER 5: VACUUM TEST WITH VERTICAL DRAINS 5.1 Introduction Using surcharging as the sole soil consolidation mean can take a long time to reach the desired soil settlement. Soil consolidation using prefabricated
OP CHECKLIST FOR 1D CONSOLIDATION LABORATORY TEST
 Page 1 of 5 WORK INSTRUCTIONS FOR ENGINEERS NHB Compiled by : LSS Checked by : GSS Approved by : OP-3-31. CHECKLIST FOR 1D CONSOLIDATION LABORATORY TEST Page 2 of 5 31.0 CHECKLIST ITEMS *(refer to respective
Drilling Efficiency Utilizing Coriolis Flow Technology
 Session 12: Drilling Efficiency Utilizing Coriolis Flow Technology Clement Cabanayan Emerson Process Management Abstract Continuous, accurate and reliable measurement of drilling fluid volumes and densities
INSTITUTE OF AERONAUTICAL ENGINEERING (Autonomous) Dundigal, Hyderabad CIVIL ENGINEERING TUTORIAL QUESTION BANK
 Dundigal, Hyderabad CIVIL ENGINEERING TUTORIAL QUESTION BANK") INSTITUTE OF AERONAUTICAL ENGINEERING (Autonomous) Dundigal, Hyderabad - 00 04 CIVIL ENGINEERING TUTORIAL QUESTION BANK Course Name Course Code Regulation Course Structure Course Coordinator Course Faculty
INSTITUTE OF AERONAUTICAL ENGINEERING (Autonomous) Dundigal, Hyderabad - 00 04 CIVIL ENGINEERING TUTORIAL QUESTION BANK Course Name Course Code Regulation Course Structure Course Coordinator Course Faculty
m v = 1.04 x 10⁻⁴ m 2 /kn, C v = 1.29 x 10⁻² cm 2 /min
 2.10 Problems Example 2.1: Design of Shallow Foundation in Saturated Clay Design a square footing to support a column load of 667 kn. The base of the footing will be located 1 m below the ground level
Copyright ASTM International, 100 Barr Harbor Drive, PO Box C700, West Conshohocken, PA , United States.
 LastD 4429 93 standard and is intended only to provide the user of an ASTM standard an indication of what changes have been made to the previous version. Because it may not be technically possible to adequately
Quantitative Risk of Linear Infrastructure on Permafrost Heather Brooks, PE. Arquluk Committee Meeting November 2015
 Slide 1 Quantitative Risk of Linear Infrastructure on Permafrost Heather Brooks, PE Arquluk Committee Meeting November 2015 Welcome to the meeting of the committee for Arquluk s Quantitative Risk of Linear
REPORT GEO-TECHNICAL INVESTIGATION FOR THE PROPOSED BLOCK-1 SUB-STATION SY NO-44, NEAR KYATAGANACHERLU VILLAGE
 REPORT ON GEO-TECHNICAL INVESTIGATION FOR THE PROPOSED BLOCK-1 SUB-STATION SY NO-44, NEAR KYATAGANACHERLU VILLAGE CLIENT: KARNATAKA SOLAR POWER DEVELOPMENT CORPORATION BANGALORE 0 GEO-TECHNICAL INVESTIGATION
Study to Establish Relations for the Relative Strength of API 650 Cone Roof Roof-to-Shell and Shell-to- Bottom Joints
 Thunderhead Engineering Consultants I N C O R P O R A T E D 1006 Poyntz Ave. Manhattan, KS 66502-5459 785-770-8511 www. thunderheadeng.com Study to Establish Relations for the Relative Strength of API
REPORT GEO-TECHNICAL INVESTIGATION FOR THE PROPOSED BLOCK-7 SUB-STATION SY NO-225, NEAR RAYACHERLU VILLAGE
 REPORT ON GEO-TECHNICAL INVESTIGATION FOR THE PROPOSED BLOCK-7 SUB-STATION SY NO-225, NEAR RAYACHERLU VILLAGE CLIENT: KARNATAKA SOLAR POWER DEVELOPMENT CORPORATION BANGALORE 0 GEO-TECHNICAL INVESTIGATION
An Introduction to Deep Foundations
 An Introduction to Deep Foundations J. Paul Guyer, P.E., R.A. Paul Guyer is a registered mechanical engineer, civil engineer, fire protection engineer and architect with over 35 years experience in the
Deformation parameters of soils determined by the cone penetration test
 MATEC Web of Conferences 117, 0002 (2017) DOI: 10.101/ matecconf/20171170002 Deformation parameters of soils determined by the cone penetration test Roman Bulko 1*, Filip Gago 2 1 University of Žilina,
Standard Test Method for Electronic Friction Cone and Piezocone Penetration Testing of Soils 1
 Designation: D5778 12 Standard Test Method for Electronic Friction Cone and Piezocone Penetration Testing of Soils 1 This standard is issued under the fixed designation D5778; the number immediately following
Analysis of Shear Lag in Steel Angle Connectors
 University of New Hampshire University of New Hampshire Scholars' Repository Honors Theses and Capstones Student Scholarship Spring 2013 Analysis of Shear Lag in Steel Angle Connectors Benjamin Sawyer
A VALID APPROACH TO CORRECT CAPILLARY PRESSURE CURVES- A CASE STUDY OF BEREA AND TIGHT GAS SANDS
 SCA2009-4 /6 A VALID APPROACH TO CORRECT CAPILLARY PRESSURE CURVES- A CASE STUDY OF BEREA AND TIGHT GAS SANDS Gbenga M. Funmilayo, Shameem Siddiqui: Texas Tech University, Lubbock USA This paper was prepared
Lab 1: Pressure and surface tension. Bubblers, gravity and the mighty paper clip.
 Lab 1: Pressure and surface tension. Bubblers, gravity and the mighty paper clip. CEE 3310 - Summer 2012 SAFETY The major safety hazard in this laboratory is a shock hazard. Given that you will be working
The tensile capacity of suction caissons in sand under rapid loading
 Frontiers in Offshore Geotechnics: ISFOG 25 Gourvenec & Cassidy (eds) 25 Taylor & Francis Group, London, ISBN 415 3963 X The tensile capacity of suction caissons in sand under rapid loading Guy T. Houlsby,
Wind Flow Validation Summary
 IBHS Research Center Validation of Wind Capabilities The Insurance Institute for Business & Home Safety (IBHS) Research Center full-scale test facility provides opportunities to simulate natural wind conditions
Irrigation &Hydraulics Department lb / ft to kg/lit.
 CAIRO UNIVERSITY FLUID MECHANICS Faculty of Engineering nd Year CIVIL ENG. Irrigation &Hydraulics Department 010-011 1. FLUID PROPERTIES 1. Identify the dimensions and units for the following engineering
Reinforced Soil Retaining Walls-Design and Construction
 Lecture 32 Reinforced Soil Retaining Walls-Design and Construction Prof. G L Sivakumar Babu Department of Civil Engineering Indian Institute of Science Bangalore 560012 Example calculation An 8 m high
ENTUCKY RANSPORTATION C ENTER. College of Engineering
 Research Report KTC-05-34/SPR-297-05-1I T K ENTUCKY RANSPORTATION C ENTER College of Engineering USE OF ULTRA-LIGHTWEIGHT GEOFOAM TO REDUCE STRESSES IN HIGHWAY CULVERT EXTENSIONS Our Mission We provide
SPECIFICATION FOR REPEATED LOAD TRIAXIAL (RLT) TESTING FOR PAVEMENT MATERIALS
 TESTING FOR PAVEMENT MATERIALS") SPECIFICATION FOR REPEATED LOAD TRIAXIAL (RLT) TESTING FOR PAVEMENT MATERIALS 1. SCOPE This specification details the six (6) stage permanent strain Repeated Load Triaxial (RLT) test for unbound and modified
SPECIFICATION FOR REPEATED LOAD TRIAXIAL (RLT) TESTING FOR PAVEMENT MATERIALS 1. SCOPE This specification details the six (6) stage permanent strain Repeated Load Triaxial (RLT) test for unbound and modified
TEST FOR STABILOMETER VALUE OF BITUMINOUS MIXTURES
 Test Procedure for TEST FOR STABILOMETER VALUE OF BITUMINOUS MIXTURES TxDOT Designation: Tex-208-F Effective Date: February 2005 1. SCOPE 1.1 Use this test method to determine the Hveem stability value
THE USE OF SPIN FIN PILES IN MASSACHUSETTS
 THE USE OF SPIN FIN PILES IN MASSACHUSETTS Les R. Chernauskas, P.E., Geosciences Testing and Research, Inc., North Chelmsford, MA Leo J. Hart, Geosciences Testing and Research, Inc., North Chelmsford,
Lab #1 Pressure: Bubblers and Water Balloons CEE 331 Fall 2003
 CEE 331 Lab 1 Page 1 of 9 SAFETY Lab #1 Pressure: Bubblers and Water Balloons CEE 331 Fall 2003 Laboratory exercise based on an exercise developed by Dr. Monroe Weber-Shirk The major safety hazard in this
EXPERIMENTAL INVESTIGATION ON OPTIMUM INSTALLATION DEPTH OF PVD UNDER VACUUM CONSOLIDATION ABSTRACT
 EXPERIMENTAL INVESTIGATION ON OPTIMUM INSTALLATION DEPTH OF PVD UNDER VACUUM CONSOLIDATION EXPERIMENTAL INVESTIGATION ON OPTIMUM INSTALLATION DEPTH OF PVD UNDER VACUUM CONSOLIDATION J.-C CHAI i), N. MIURA
HCMTCB MATERIALS SAMPLING & TESTING PERFORMANCE CHECKLIST
 HCMTCB MATERIALS SAMPLING & TESTING PERFORMANCE CHECKLIST Release Date: January 7, 2014 Sampling Coarse Aggregate PERFORMANCE CHECKLIST AASHTO T-2 Sampling of Aggregates Sampling From A Stockpile 1 When
ITTC Recommended Procedures and Guidelines
 Page 1 of 6 Table of Contents 1. PURPOSE...2 2. PARAMETERS...2 2.1 General Considerations...2 3 DESCRIPTION OF PROCEDURE...2 3.1 Model Design and Construction...2 3.2 Measurements...3 3.5 Execution of
Certified Accuracy. Ring Force Gauge. Models and Capacities Available. Design and Principle of Operation
 Certified Accuracy Ring Force Gauge The accurate measurement of mechanical forces is required in hundreds of applications from a simple weighing procedure to the calibration of testing machines and load
Experimental Determination of Temperature and Pressure Profile of Oil Film of Elliptical Journal Bearing
 International Journal of Advanced Mechanical Engineering. ISSN 2250-3234 Volume 4, Number 5 (2014), pp. 469-474 Research India Publications http://www.ripublication.com Experimental Determination of Temperature
Pros and Cons of the Analysis of Slope Stability by Various Methods of Slices or Columns
 Pros and Cons of the Analysis of Slope Stability by Various Methods of Slices or Columns by Robert Pyke Ph.D., G.E. Partially Completed Draft April 22, 2017 General Background The history of slope stability
Typical factors of safety for bearing capacity calculation in different situations
 Typical factors of safety for bearing capacity calculation in different situations Density of soil: In geotechnical engineering, one deals with several densities such as dry density, bulk density, saturated
3 1 PRESSURE. This is illustrated in Fig. 3 3.
 P = 3 psi 66 FLUID MECHANICS 150 pounds A feet = 50 in P = 6 psi P = s W 150 lbf n = = 50 in = 3 psi A feet FIGURE 3 1 The normal stress (or pressure ) on the feet of a chubby person is much greater than
GROUND IMPROVEMENT USING RAPID IMPACT COMPACTION
 13 th World Conference on Earthquake Engineering Vancouver, B.C., Canada August 1-, Paper No. 9 GROUND IMPROVEMENT USING RAPID IMPACT COMPACTION Henrik KRISTIANSEN 1, Michael DAVIES SUMMARY Geotechnical
CPT and MiHpt Programs Bayou Corne 8 AUG 2013
 CPT and MiHpt Programs Bayou Corne 8 AUG 2013 Agenda Introduction and purpose of meeting Why CPT and MiHpt Charlie Faust, Tt CPT and MiHpt overview Charlie Faust, Tt Program progress Charlie Faust, Tt
Unsaturated Testing of Soil (UNSAT)
") Unsaturated Testing of Soil (UNSAT) Overview: GDS Unsaturated Triaxial Testing System (UNSAT) is an extension to traditional triaxial testing, in that soils from above the water table may be tested under
Unsaturated Testing of Soil (UNSAT) Overview: GDS Unsaturated Triaxial Testing System (UNSAT) is an extension to traditional triaxial testing, in that soils from above the water table may be tested under
INTRODUCTION TO COASTAL ENGINEERING AND MANAGEMENT
 Advanced Series on Ocean Engineering Volume 16 INTRODUCTION TO COASTAL ENGINEERING AND MANAGEMENT J. William Kamphuis Queen's University, Canada World Scientific Singapore New Jersey London Hong Kong Contents
Influence of Settlement on Bearing Capacity Analysis of Shallow Foundations on Sandy Clays in the Niger Delta, Nigeria
 Available online at www.scholarsresearchlibrary.com European Journal of Applied Engineering and Scientific Research, 201, 2 (4):20-27 (http://scholarsresearchlibrary.com/archive.html) ISSN: 22 0041 Influence
SEMATECH Provisional Test Method for Pressure Cycle Testing Filter Cartridges Used in UPW Distribution Systems
 Provisional Test Method for Pressure Cycle Testing Filter Cartridges Used in UPW Distribution Systems Technology Transfer 92010941B-STD and the logo are registered service marks of, Inc. 1996, Inc. Provisional
Operator s Manual S-492. Direct / Residual Shear Machine. Version 1.0. Durham Geo Slope Indicator 2175 West Park Court Stone Mountain, GA USA
 Direct / Residual Shear Machine S-492 ASTM D 3080 AASHTO T236 Operator s Manual Version 1.0 Durham Geo Slope Indicator 2175 West Park Court Stone Mountain, GA 30087 USA Phone: 800-837-0864 or +1.770.465.7557
Impact Test Equipment Ltd & User Guide. User Guide
 SL Impact Test Equipment Ltd www.impact-test.co.uk & www.impact-test.com User Guide User Guide Impact Test Equipment Ltd. Building 21 Stevenston Ind. Est. Stevenston Ayrshire KA20 3LR T: 01294 602626 F:
Application of Computational Fluid Dynamics to Compressor Efficiency Improvement
 Purdue University Purdue e-pubs International Compressor Engineering Conference School of Mechanical Engineering 1994 Application of Computational Fluid Dynamics to Compressor Efficiency Improvement J.
SUMMARY OF SUBSURFACE STRATIGRAPHY AND MATERIAL PROPERTIES
 Page 1 of 101 Written by: Ming Zhu Date: 08/20/2008 Reviewed by: R. Kulasingam/J. Beech Date: 08/20/2008 SUMMARY OF SUBSURFACE STRATIGRAPHY AND MATERIAL PROPERTIES 1. INTRODUCTION This Summary of Subsurface
ACCURACY, PERFORMANCE, AND HANDLING OF OIL-FILLED DIGIQUARTZ PRESSURE INSTRUMENTATION
 Application Note Doc. G8108-001 Rev. A - 23-Jul-02 ACCURACY, PERFORMANCE, AND HANDLING OF OIL-FILLED DIGIQUARTZ PRESSURE INSTRUMENTATION For more information regarding Digiquartz products contact: Paroscientific,
ZIN Technologies PHi Engineering Support. PHi-RPT CFD Analysis of Large Bubble Mixing. June 26, 2006
 ZIN Technologies PHi Engineering Support PHi-RPT-0002 CFD Analysis of Large Bubble Mixing Proprietary ZIN Technologies, Inc. For nearly five decades, ZIN Technologies has provided integrated products and
A review of best practices for Selection, Installation, Operation and Maintenance of Gas meters for Flare Applications used for Managing facility
 A review of best practices for Selection, Installation, Operation and Maintenance of Gas meters for Flare Applications used for Managing facility mass balance and compliance 1. What, When and Why? 2. Flare
Autodesk Moldflow Communicator Process settings
 Autodesk Moldflow Communicator 212 Process settings Revision 1, 3 March 211. Contents Chapter 1 Process settings....................................... 1 Profiles.................................................
METHOD 2E - DETERMINATION OF LANDFILL GAS PRODUCTION FLOW RATE. NOTE: This method does not include all of the
 287 METHOD 2E - DETERMINATION OF LANDFILL GAS PRODUCTION FLOW RATE NOTE: This method does not include all of the specifications (e.g., equipment and supplies) and procedures (e.g., sampling and analytical)
DESIGN AND DEVELOPMENT OF A RIG FOR THE PRESSURE TESTING OF WEAK VESSELS AND SUBSEQUENT WORK RELATING TO THE STRENGTH OF FLAT PLATES
 DESIGN AND DEVELOPMENT OF A RIG FOR THE PRESSURE TESTING OF WEAK VESSELS AND SUBSEQUENT WORK RELATING TO THE STRENGTH OF FLAT PLATES D.F. Pilkington Ph.D. B.Sc(Eng)*, G Piatt B.Sc.*, G. Norton B.Sc.**
COURSE NUMBER: ME 321 Fluid Mechanics I Fluid statics. Course teacher Dr. M. Mahbubur Razzaque Professor Department of Mechanical Engineering BUET
 COURSE NUMBER: ME 321 Fluid Mechanics I Fluid statics Course teacher Dr. M. Mahbubur Razzaque Professor Department of Mechanical Engineering BUET 1 Fluid statics Fluid statics is the study of fluids in
SUBPART C - STRUCTURE
 SUBPART C - STRUCTURE GENERAL CS 23.301 Loads (a) Strength requirements are specified in terms of limit loads (the maximum loads to be expected in service) and ultimate loads (limit loads multiplied by
Vertical Uplift Capacity of a Group of Equally Spaced Helical Screw Anchors in Sand
 SECM/15/080 Vertical Uplift Capacity of a Group of Equally Spaced Helical Screw Anchors in Sand S. Mukherjee 1* and Dr. S. Mittal 2 1 Amity University, Noida, India 2 Indian Institute of Technology, Roorkee,
The 9th International Symposium on Automation and Robotic in Construction June 3-5,1992 Tokyo, Japan
 The 9th International Symposium on Automation and Robotic in Construction June 3-5,1992 Tokyo, Japan Forces Prediction of Underwater Soil Cutting by Excavating Robots Igor Nedorezov Department of Building
TECHNICAL BENEFITS OF CJS / RAISE HSP. Technical Advantages
 TECHNICAL BENEFITS OF CJS / RAISE HSP Technical Advantages The HSP is designed for low- to mid- volume applications at flow rates of 1 cubic meter to 30 c. m per day. The benefits are in the details. The
INTRODUCTION Porosity, permeability, and pore size distribution are three closely related concepts important to filter design and filter performance.
 Measurement of Filter Porosity using a Custom-Made Pycnometer George Chase The University of Akron INTRODUCTION Porosity, permeability, and pore size distribution are three closely related concepts important
Level MEASUREMENT 1/2016
 Level MEASUREMENT 1/2016 AGENDA 2 A. Introduction B. Float method C. Displacer method D. Hydrostatic pressure method E. Capacitance method G. Ultrasonic method H. Radar method I. Laser method J. Level
Scissor Mechanisms. Figure 1 Torero Cabin Service Truck. Scissor Mechanism was chassis mounted and lifted the cabin to service aircraft
 Scissor Mechanisms Scissor mechanisms are very common for lifting and stabilizing platforms. A variety of manlifts, service platforms and cargo lifts utilize this visually simple but structurally complex
Pressure Measurement
 Pressure Measurement Manometers Sensors, Transducers Ashish J. Modi Lecturer, Dept. of Mech.Engg., Shri S.V.M. inst. Of Technology, Bharuch Pressure Pressure is a force per unit area exerted by a fluid
Bearing Capacity and Settlement Response of PMS Tanks on Cohesionless Soil Lithology in Lekki, Lagos of Nigeria
 Available online at www.scholarsresearchlibrary.com European Journal of Applied Engineering and Scientific Research,, ():- (http://scholarsresearchlibrary.com/archive.html) ISSN: 8 Bearing Capacity and
USE OF IN-PLACE INCLINOMETERS (IPI) DURING LATERAL LOAD TESTING
 DURING LATERAL LOAD TESTING") ABSTRACT USE OF IN-PLACE INCLINOMETERS (IPI) DURING LATERAL LOAD TESTING Joel Swenson 1, Tom Richards 2, and John Rowley 3 Inclinometers can be used to measure the deflected shape of the micropile during
ABSTRACT USE OF IN-PLACE INCLINOMETERS (IPI) DURING LATERAL LOAD TESTING Joel Swenson 1, Tom Richards 2, and John Rowley 3 Inclinometers can be used to measure the deflected shape of the micropile during
Modeling of Hydraulic Hose Paths
 Mechanical Engineering Conference Presentations, Papers, and Proceedings Mechanical Engineering 9-2002 Modeling of Hydraulic Hose Paths Kurt A. Chipperfield Iowa State University Judy M. Vance Iowa State
_ pressure transducers. User Manual
 _ pressure transducers User Manual summary introduction DescriPTION preliminary checks Installation taking measurements data management Troubleshooting maintenance Appendix 1 Page 4 Page 5 Page 6 Page
Succeeding with Production Air Leak Testing Methods. Paul Chamberlain President, CEO
 Succeeding with Production Air Leak Testing Methods Paul Chamberlain President, CEO 2 Overview Air Leak Testing Overview Pressure Decay Air Leak Testing Factors impacting leak rate measurement Test Data:
Risk Assessment and Mitigating Measures Regarding Pile Installation at EBS Biohub Jetty
 Geotechnical Safety and Risk V T. Schweckendiek et al. (Eds.) 2015 The authors and IOS Press. This article is published online with Open Access by IOS Press and distributed under the terms of the Creative
Standard Test Method for Consolidated Undrained Triaxial Compression Test for Cohesive Soils 1
 Designation: D 4767 02 Standard Test Method for Consolidated Undrained Triaxial Compression Test for Cohesive Soils 1 This standard is issued under the fixed designation D 4767; the number immediately
Instrumentation and Monitoring of Mahawewa Landslide off Walapane in Central Hills of Sri Lanka
 Instrumentation and Monitoring of Mahawewa Landslide off Walapane in Central Hills of Sri Lanka Idirimanna 1 IAND, Perera 1 KAC, Bandara 1 KMT, Kumara 1 WGBT, Indrathilake 2 HML, Premasiri 1 HMR and Abeysinghe
How to specify a product. Process Sensors and Mechanical Instruments
 How to specify a product Process Sensors and Mechanical Instruments Keep the overview. Here is some guideline information on how to specify our products. Intended as supplementary help to specification
ASSESSMENT AND ANALYSIS OF PIPELINE BUCKLES
 ASSESSMENT AND ANALYSIS OF PIPELINE BUCKLES GE Oil & Gas PII Pipeline Solutions Inessa Yablonskikh Principal Consultant Aberdeen, November, 14 th 2007 Assessment And Analysis Of Pipeline Buckles Introduction
Specific Accreditation Criteria Calibration ISO IEC Annex. Mass and related quantities
 Specific Accreditation Criteria Calibration ISO IEC 17025 Annex Mass and related quantities January 2018 Copyright National Association of Testing Authorities, Australia 2014 This publication is protected
Ranger Walking Initiation Stephanie Schneider 5/15/2012 Final Report for Cornell Ranger Research
 1 Ranger Walking Initiation Stephanie Schneider sns74@cornell.edu 5/15/2012 Final Report for Cornell Ranger Research Abstract I joined the Biorobotics Lab this semester to gain experience with an application
Mechanical Stabilisation for Permanent Roads
 Mechanical Stabilisation for Permanent Roads Tim Oliver VP Global Applications Technology Tensar International toliver@tensar.co.uk Effect of geogrid on particle movement SmartRock Effect of geogrid on
Vessel Weighing. Load Cells and Weigh Modules VPG TRANSDUCERS. Technical Note VPGT-06. Scope. Accuracy. Mode of Operation. Mechanical Considerations
 VPG TRANSDUCERS Load Cells and Weigh Modules Technical Note VPGT-06 Scope Load cells may be used to weigh vessels in various installation configurations. The installation of load cells into a practical
Learn more at
 Full scale model tests of a steel catenary riser C. Bridge 1, H. Howells 1, N. Toy 2, G. Parke 2, R. Woods 2 1 2H Offshore Engineering Ltd, Woking, Surrey, UK 2 School of Engineering, University of Surrey,
Appendix A Preliminary SEMs
 Appendix A Preliminary SEMs SEM images of various gold tailings samples were taken as a preliminary investigation on the observable fabric and the possibilities with regards to using SEM images. These
E02 Rigid hinged stinger with piggyback line
 E02 Rigid hinged stinger with piggyback line This model represents a rigid stinger hinged off the back of a lay vessel using the pipelay supports feature. In addition to the lay pipe, another line is included
A New Piston Gauge to Improve the Definition of High Gas Pressure and to Facilitate the Gas to Oil Transition in a Pressure Calibration Chain
 A New iston Gauge to Improve the Definition of High Gas ressure and to Facilitate the Gas to Oil Transition in a ressure Calibration Chain ierre Delajoud, Martin Girard DH Instruments, Inc. 4765 East Beautiful
Lifecycle Performance of Escape Systems
 Lifecycle Performance of Escape Systems A look at laboratory vs field conditioning of aramid fiber based escape systems. By James Hunter, Cedric Smith, Ole Kils and Tyler Mayer for ITRS 2018 1.1 Introduction
Probabilistic Design Tools for Vertical Breakwaters
 Probabilistic Design Tools for Vertical Breakwaters HOCINE OUMERACI, ANDREAS KORTENHAUS Technical University of Braunschweig, Leichtweifi-Institut fur Wasserbau, Braunschweig, Germany WILLIAM ALLSOP HR
Lab 1c Isentropic Blow-down Process and Discharge Coefficient
 058:080 Experimental Engineering Lab 1c Isentropic Blow-down Process and Discharge Coefficient OBJECTIVES - To study the transient discharge of a rigid pressurized tank; To determine the discharge coefficients
Application of pushover analysis in estimating seismic demands for large-span spatial structure
 28 September 2 October 2009, Universidad Politecnica de Valencia, Spain Alberto DOMINGO and Carlos LAZARO (eds.) Application of pushover analysis in estimating seismic demands for large-span spatial structure
Wind shear and its effect on wind turbine noise assessment Report by David McLaughlin MIOA, of SgurrEnergy
 Wind shear and its effect on wind turbine noise assessment Report by David McLaughlin MIOA, of SgurrEnergy Motivation Wind shear is widely misunderstood in the context of noise assessments. Bowdler et
29th Monitoring Research Review: Ground-Based Nuclear Explosion Monitoring Technologies
 IMPROVED CALIBRATION AND OPERATION OF A STABLE-GAS QUANTIFICATION MANIFOLD AS PART OF A RADIOXENON COLLECTION SYSTEM ABSTRACT Richard M. Williams, James C. Hayes, and Randy R. Kirkham Pacific Northwest
1. A proper preparation of the cone and other material is inevitable prior to a CPTU test.
 PREPARATION FOR CPTU Procedure for saturation of a piezocone for CPTU 1. A proper preparation of the cone and other material is inevitable prior to a CPTU test. 2. GeoMil Equipment recommends to saturate
Hatch cover securing and tightness
 (1986) (Rev 1 1996) (Corr.1 June 2000) (Rev.2 July 2005) (Corr.1 Oct 2005) Hatch cover securing and tightness 1. Application 1.1 The following recommendations apply to steel hatch covers that are fitted