PROCESSING LARGE DATA SETS FROM 100% BOTTOM COVERAGE SHALLOW* WATER SWEEP SURVEYS
|
|
|
- Benjamin Johns
- 6 years ago
- Views:
Transcription
1 PROCESSING LARGE DATA SETS FROM 100% BOTTOM COVERAGE SHALLOW* WATER SWEEP SURVEYS A NEW CHALLENGE FOR THE CANADIAN HYDROGRAPHIC SERVICE by R. G. BURKE, S. FORBES and K. W HITE (*) INTRODUCTION The past two decades have ushered in many new and significant advances in survey technology. The work of our hydrographers can now be carried out more accurately and with greater efficiency due to improvements in positioning systems, computers and echo sounding systems. Many of these advantages have been offset by the steady and dramatic evolution that has taken place in the marine community over this period. Basic econom ics dictate that ships be larger in order to make most commercial operations profitable. Operations, in turn, must be geared to maximize cargoes and minimize turn around. These same economic pressures also com e to bear directly on shipowners and masters to compromise the traditional underkeel safety margins. As these safety margins shrink, the mariner is forced to rely more and more on the competence of hydrodynamic engineers in their predictions of hull behaviour under a wide variety of operating conditions and the competence of hydrographers and the accuracy of their equipment. In order to cope effectively with these new demands, the Canadian Hydrographic Service (CHS) procured its first sweep system in The Navitronic SeaDig 201 sweep system was acquired to carry out detailed 100% bottom coverage surveys of critical areas such as harbour entrances, dock sites and dredged channels. Assembled in a transportable configuration, the system could be trucked or shipped to a remote location and be operationally deployed within a day [l]. In a demonstration of its capability, the system was deployed near Grise Fjord in the Canadian Arctic during The success of this system provided a catalyst for the acquisition of a second and larger system. The second system, a specially designed 34.8 metre (*) Department of Fisheries and Oceans, Canadian Hydrographic Service (Atlantic), Science Sector, Scotia-Fundy Region, Nova Scotia, Canada.

2 The FCG Smith.
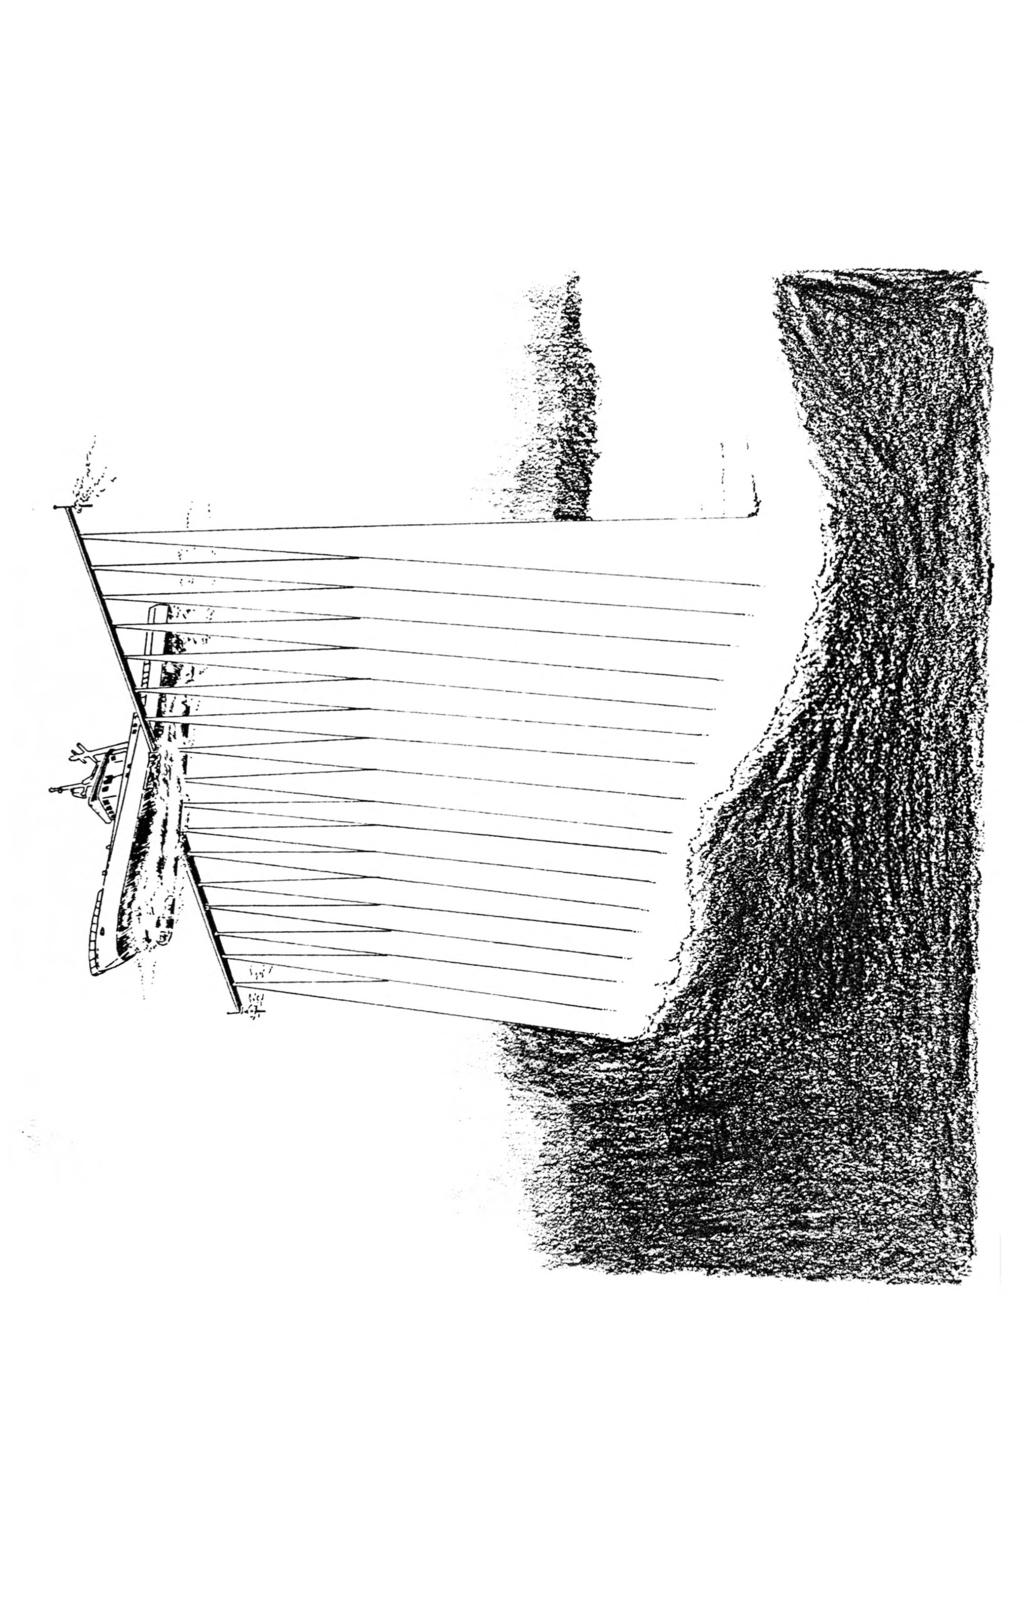
3
4 catamaran, was built to deploy an array of thirty-three transducers and give a swath coverage of approximately 44 metres. The FCG Smith was commissioned and went into service during the 1986 survey season (Fig. l). The vessel and its equipment have been previously described in the literature [2]. In addition to the increased survey capabilities that have resulted from the acquisition of these system s, a new ch allenge has com e forth for field hydrographers and cartographers data sets that are orders of magnitude larger than they have traditionally dealt with in the past! The FCG Smith with its thirtythree echo sounders operating at their maximum rate of 20 pings per second, is ca p ab le of m aking 2,376,000 depth m easurem ents per hour. A depth p reprocessor, which is part of the Navitronic Sweep System, selects only a small percentage of all depth measurements for logging and subsequent post-processing. Some 300,000 to 500,000 depth measurements are logged during a typical day. Obviously, with bathymetric data sets of this magnitude it is impossible for a human to analyse, edit, and display this information in a timely fashion without sophisticated softw are tools and a ca p able com puting system. This paper describes the software that has been developed by the CHS to cope with the requirements and addresses some future considerations. Data Acquisition The data acquisition software was purchased as part of the two turn-key sweep packages supplied by N avitronic AS of Denmark. O n the FCG Smith system, the data acquisition software is written in HP PASCAL and runs on the HP237 computer which controls the sweep system. The package provides the following: 1. A real time operational display of ail critical survey parameters. 2. Fix and line following computations with a left/right steering display. In addition, the computer is interfaced directly to the autopilot and the vessel may be steered along a survey line by either the computer or a helmsman. 3. Logging of survey parameters including depths, positions, etc., to a Tandberg TDC 3000 tape recorder. 4. A user friendly interface to the sweep system. CHS. All post-processing software currently in use has been developed by the Data Processing A Brief Background W hen the first sweep system becam e operational during 1983, the Hydrographic Acquisition and Processing System Software (HAAPS), a package developed by the CHS for processing data from conventional surveys, was used [3]. It ran on an HP1000 computer system and was designed to handle data

5 from semi-automated chart scalers or launch data loggers. Normally, along track profiles and quick look plots were produced on site, utilizing software and hardware provided by Navitronic AS. Final and more rigorous processing was carried out on the HP 1000 computer system after the party had returned from the field. The HP1000 computer system lacked the speed and disc space required to cope efficiently with the volume of data. In addition, the HAAPS data structure was never designed to accommodate the multi-transducer data set. Consequently, a number of compromises had to be made in order to process the data within a reasonable amount of time. First, when the data was transferred to the HP1000 com puter and formatted into conventional sounding files, only three of the eighteen depths for each data set were used the shallowest on the port, the shallowest on the starboard and the deepest sounding. Format restrictions resulted in the loss of transducer identification, which in turn severely hampered data identification and verification. A n interactive editor that had been developed to work with the conventional data could not be utilized with the sweep data sets due to format differences [4]. This made the source identification and checking of questionable soundings very awkward and time consuming. The production of shallow biased, overplot-removed, bathymetric plots proved to be another serious bottleneck. Disc space limited the data set to approxim ately 5 0,0 0 0 soundings. T o sort and overplot this quantity of data for a plot at the scale normally used (1/2,000) required approximately 13 to 14 hours of CPU time. Typically, only 1000 to 2500 soundings could be plotted from the data set at the selected scale. Plotting required an additional hour or more. If sin error was discovered, the bad sounding would have to be located by placing the track plot over the bathymetric field sheet and examining along track profile plots and data listings to uniquely identify the data point in question. Once the offending sounding had been deleted, the whole overplot rem oval, plot, verification and edit cycle would repeat itself. While it was possible to process and arrive at a clean data set using the HAAPS software, it was soon recognized that improved tools would be needed in the future. At this time, the CHS was in the process of phasing in new computers to replace the obsolete HP1000 systems. Consequently, no effort was made to enhance the HAAPS software package for processing sweep data. The selection of the Micro V A X II and the decision to acquire a second and larger sweep system occurred at approximately the same time. Data Structures An Important and Basic Design Consideration During the initial evaluation of the new computer package for the FCG Smith sweep system, the following fundamental considerations were taken into account: 1. The system should be capable of processing all data on site to create a clean data set suitable for incorporation into the construction of a nautical chart or a patch that could be issued via a Notice to Mariners.

6 2. The system should be able to cope with the volume of data gathered and have sufficient capability to keep abreast of the processing workload. 3. The system should allow the data processor to quickly and conveniently identify and trace data backward or forward through the processing system. It should also allow the processor to quickly compare the results from a number of survey passes over a critical or contentious point. 4. The system should be simple and easy to use. Items 1 and 2 are largely dictated by the power of the computer system, whereas 3 and 4 tend to be more a function of the software tools that are developed. The selection of the Micro V A X II as the computer system resulted from a detailed evaluation of a number of system s by shipboard users of computers at the Bedford Institute of Oceanography. Figure 2 shows the current configuration of the system acquired for the FCG Smith. During the early stages of the software design, it became abundantly clear that the data structure would be a critical elem ent in the overall softw are package. If com puter speed and storage w ere not a consideration, an ideal situation would be to establish a data structure that would retain all data on-line and in a coherent structure for both the raw and processed data. While this concept was given serious consideration, it had to be rejected simply because of disc storage limitations. In the end, a data structure that is referred to as a flat file (FFILE) by the CHS was selected. The FFILE was designed to retain all the raw data in addition to the processing status flags and corrections associated with each sounding and position. It should be noted that the raw sweep data is in a som ew hat compressed format. Each position has associated with it thirty-three depths, boom orientation, tide, time, data set number, etc. In addition, each sounding has a percentage factor that is used to interpolate its actual position relative to the current and previous fix. The percentage factor is measured by the depth preprocessor at the time the data is logged. Associated with each depth is a status flag byte whose bits are set in accordance with the various processing and editing functions that are carried out on the data. Figure 3 shows a breakdown of the status flag. By choosing this approach it is possible to store raw and processed data within the same data structure, even though it is in a somewhat compressed fashion. For the purposes of displaying, editing and plotting the data, it is necessary to expand the file into a new and temporary work file (PFILE). The PFILE contains most of the information within the FFILE and is considerably larger as each depth is given a unique position. The data processor may optionally elect to run a pre-selection program on the FFILE to flag redundant data and reduce the size of the PFILE. The selected depths within an overplot removed PFILE may be flagged back to the FFILE. Consequently, it is not essential to save the PFILE as it may be easily recreated at any time by retrieving the appropriately flagged soundings. Should there be a need to examine all data from one or a number of flat files, as may be the case in a contentious area, it is a simple matter to override the appropriate flags in order to extract the desired data.
7 TS V05 9 TRACK MT DRIVE Fig. 2. Simplified block diagram of the computer system. Processing Software A suite of programs has been written covering all stages of the processing, from the initial transfer of the raw survey data logged on the Tandberg TDC 3000 tape recorder to the Micro VAX II computer to the final transfer of the processed data into the NTX format. This latter step enables the data to be used by the CHS Computer Assisted Chart Production system known as CARIS II [5]. The main routines that have been written for data processing are as listed: 1. TANDBERG transfers logged sweep data to the Micro VAX II disc. The transfer process creates a new disc file known as a flat file (FFILE).
8 DEPTH STATUS BYTE 7 6 S Reserved Rosen/od Selected Bad Position Delated Redundant Channel not used Reserved FlG. 3. Depth status byte. The FFILE contains all the logged data in addition to a status byte for each depth and fields for additional data and tide corrections. 2. RAWLIST lists an entire FFILE or any portion of it. 3. RAWMERGE concatenates FFILES. 4. T1GEN and COTDE generates, applies, and edits tide corrections to the FFILE. 5. RAWSCAN scans the FFILE and carries out the following functions: 5.1 Reports data gaps. 5.2 Performs critical depth selection. A 3-dimensional search is carried out on the depth data set. Any depths that do not contribute any additional depth information for processing are flagged as redundant. 5.3 Identifies and reports questionable depths. 5.4 Flags data in the FFILE that are to be rejected due to bad positions. Tlus function is not carried out on the first pass. Another routine, PCREAT, creates a filter file which is subsequently utilized by RAWSCAN to identify bad positions. 5.5 Performs user defined edits based on times, limiting depths and transducer number. 6. PCREAT reads the FFILE and selects depths as determined by the various status bits, computes a unique position for each selected depth and writes the data to another file (PF1LE) with a format suitable for plotting bathymetry, the vessel s track, or a swath plot to show the area covered by the sweep survey. The program also uses a position filter to flag bad navigation and a position filter file is created for RAWSCAN to update the flat file.
 on the basis of user-selected depth intervals.")
9 7. FDATA utilizes the PFILE to suppress soundings that will overplot at a given scale. The selection algorithm is shoal biased and the shallowest soundings are (lagged for plotting. It is also possible to select and examine a deep bias subset of the same data or merge a number of PFILES into one file. 8. CSORT sorts the file (PFILE) on the basis of user-selected depth intervals. Each depth interval may be represented by a unique colour. This program is required because the HP 7586B is a carousel pen plotter and frequent pen changes result in grossly exaggerated plot times. 9. PMANUAL provides for the manual entry of buoys, control points, rocks or depths DAPLT and COPYPLOT creates and plots vessel survey tracks, selected depths, swath coverage, buoys, rocks and control points PLOCATE locates, using a plotted field sheet of selected soundings and a digitizer tablet, any questionable sounding requiring further verification or checking. All depth data at that location from each survey pass can be quickly located and displayed for editing. This program requires that all the FFILES for the data in question be on line as well as the merged PFILES with overplot suppression carried out. 12. RAWUPDAT maps back to the FFILE the selection and processing status of all corresponding soundings in the PFILE. A simplified block diagram of the processing is shown in Figure 4. RAWUPDAT is not shown on the diagram as it can normally be run at a number of different stages in the processing. Data Processing The first task that must be performed before any data processing can take p lace is the transfer of data to the M icro VAX II (Fig. 4). O nce this is accomplished, tide corrections are added to the FFILE. The normal practice on larger projects is to pre-process each day of data to clean and edit it prior to.m erging with the files from the previous days. RAWSCAN is used to flag redundant data, report data gaps and edit bad or unwanted data. It should be noted that data is never discarded. It is flagged and may be recalled at a later date by instructing the various programs to override the appropriate status bits in the depth status byte. Normally, the pre-processing is done overnight in a batch mode with the aid of procedure files. The process is started at the end of the survey day and a track plot, swath plot and overplot-removed bathymetric plot are available the next morning (Fig. 5, 6 and 7). The first look pre-processing takes 1 to 5 hours. Once the quick look has been completed, the editing and verification normally require considerably more time and go through several iterations. The amount of effort required is dependent upon factors such as bottom complexity, frequency of false echoes, quality of positioning, etc., and varies widely from data
10 FIG. 4. Simplified block diagram of the data processing. set to data set. At this stage in the data processing, one can examine the echograms generated at the time the data was logged by the Navitronic Sweep
11
12 System as well as use PLOCATE and the digitizer tablet to point to and identify soundings in question. The program allows the user to identify and print all the soundings within a given box centered on the point being examined. Normally, the surveys are carried
13 " ' '«/ IS Ï., i*?m>h ft1* *'%,**... * «mh'îl,n«'*.! **... jh; «... ' 1*7 'H mi* '» «T'* V I* III 1«"«I* M H ' k <«. > Vil»», 14. < M^K** *!r» '» **u. ri. '«..I!» h. n," «ILS-. "* 1*1 '_ " 'Vv " iif'y 1* "i., is m i» S, n.p * ', * '* a is" «' *' ïc Oh».'!!. ft.svl, 'i«f «I * J l»»»«. *H Ili'H ' l«*l»«i4 I. '* ï ï K V A ï ^ f è? ',. n.'xs'sa.- ii<.i*1. y**' #'*.»» ii>.a, * ü r > '"A v ^ V - jp ' - '-.î :¾^¾ '. j'fr " H 'H l i ia M> t«*-. *«<>«tia.an, >< '1 - ' 4 'V S.--1* T "... *...< *. aa_1 *»l '*i * "U.ft,'iC ' 'V * V 1'... -V" :::!«*'* * '«7.... '«S*» *«(I,»ll. **>(, ' <«1 <'«1 - *» fc*«ii,, '- "C s V - *? >,...* ï J S «î > - I*» 11(11, ii,?l at'* S. lltifa'1*'*! )li Ilf l»l.. '» IM 'V Î'Ü,,. - * n«.., 'It.»i Y,'", ii,»»*.. "» * i"i* A. 11( " I, î*«ii»»> Î. " * '».... ' - C t ;» "» it.
14 out with considerable overlap and there are two or more passes over every point in the survey area. The ability to find and list a pass by pass presentation of the critical depths for a given point is essential in eliminating false returns and confirming the presence of a strong and consistent target. Figure 8 shows a typical output. In addition, it is possible to list all the soundings in the box or individually list all depths for a given pass that falls within the box. PLOCATE may be used to suppress any soundings that are erroneous. After bad depths are suppressed, it is necessary to re-run the overplot-removal program (FDATA) to ensure that a new and correct depth selection is made. PMANUAL can be used to cre a te a file containing buoys, control points, and drying rocks. A colour banded contour plot is normally generated and RAWUPDAT is used to map back the selected soundings to the FFILE, which is subsequently archived. Typically, at scales of 1/1,000, approximately 0.5% to 0.8% of all logged depths are selected for plotting on the field sheet. It is very difficult to give the precise time required to process a data set because each project is unique. On average, it is estimated that a typical day of survey data collection requires three to five days to process. PORTAUXBASQUESJHARBOUR SURVEY SCALE 2500 SUPPRESSION RATE 14 MONTH 1 DAY 18 YEAR 88 TIME 08:10:16 SEARCHING AT DIGITIZED POINT SEARCHING FROM 79 TO 85 DM SEARCH WINDOW 6.5 METRES NORTH BY 6.7 METRES EAST TIME TX DAY N. E. PLOT NAV SDG DSN TIDE PLOT ACTUAL LOOKED FOR SUPPR ACTUAL SHOALEST SUPPR ACTUAL DEEPEST SUPPR ACTUAL SHOALEST SUPPR ACTUAL DEEPEST SUPPR ACTUAL SHOALEST SUPPR ACTUAL DEEPEST SUPPR ACTUAL SHOALEST SUPPR ACTUAL DEEPEST 32 SOUNDINGS WITHIN OVERPLOT BOX
15 Problem Areas Three areas of data acquisition and processing that have created the most difficulties are: 1. L ack o f Disc S pace T he Micro VAX II Computer System was acquired with the maximum amount of disc space available at the time it was purchased (210 Mbyte). The fact that this would cause some difficulties was realized; however, it was anticipated that a larger disc system would be installed at a later date. The current disc capacity limits the amount of data that can be kept on-line to about seven days of survey data. Considerable time is lost in off-line storage and retrieval (up and down loading) of files. A more suitable disc system would have a 1 to 2 gigabyte capacity. Unfortunately, fiscal restraints have prevented the system from being upgraded. 2. P oor Positioning The Atlas Polar Fix positioning system has been plagued with tracking and filter problems. In addition, a positioning bias of up to 4 metres was applied to the logged data as a result of timing and data packing considerations in the logging system. These problems created data gaps and positioning errors that made it more difficult for the data processor to identify and verify the existence of a target or false echo. Modifications have been recently made to both the Atlas Polar Fix and the logging software that should eliminate or minimize these problems. 3. False E choes Any digital echo sounder system may generate a number of questionable or false depth m easurem ents. Incorrect depths may result from acoustical or electrical noise, fish, marine plants, suspended sediment, etc. With sweep data one normally has two or more passes over the same area. If a feature occurs consistently, then one can normally assume that a depth value is not the result of acoustic noise or fish. Each project has its unique problems. On one survey in which the bottom was relatively flat, the sweep system would consistently pick up a number of small targets approximately 0.4 metre in height. The next day, the same thing would happen with the exception that the targets were in different locations. This was very puzzling until it was discovered that the area was notorious for lobster poaching! It is extremely difficult to carry out accurate surveys under such conditions. The Future The FCG Smith has had two very successful survey seasons. Whilst the system is considered fully operational, there is no question that improvements can
16 be made to the software. Field staff have suggested a number of ideas where changes can make the software more user friendly or efficient. When funds become available the disc capacity will be upgraded. In addition, CARIS II [5] will be utilized for processing field data in the near future. It will expand the system s current limitation of only handling bathymetric data to include the generation and manipulation of all symbols and line work used in the generation of a field sheet or chart. One area of interest that may hold significant potential for improving the speed and ease of data processing is digital terrain modelling. The PLOCATE outputs from various passes over a given area could be used to generate a digital terrain model. Since the data sets would be small, the data processor would be able to quickly generate and examine individual, averaged, differential, etc., models on a colour CRT. Simple three dimensional presentations should make the tedious data verification process much easier and faster. In addition, it is anticipated that the science of artificial intelligence could be applied beneficially to solving some of the challenges in processing sweep data. Summary The CHS has developed a software package for processing large data sets from two vertical acoustic sweep systems. The package has been successfully used during the past two seasons to process an estimated 50 million soundings that have been logged over that period. Based on experience gained to date, there are a number of initiatives that will be undertaken to enhance the data processing through hardware and software modifications, as resources become available. References [1] BURKE, R.G. and F o r b e s, S. ( ) : V ertical A coustic Sw eep System s A New Broom in the Closet for the Canadian Hydrographic Service. Proceedings of H Y D R O 8 4 (pp ), April. [2] KERR, A.J., A d a m s, A.L. and B u r k e, R.G. ( ): C S S FCG Smith Hydrographic Acoustic Sweep Vessel. Intern. Hydrog. Review, Vol. LX IV, No. 2 (pp. 7-14), July. [3] BURKE, R.G., F o r b e s, S. and T r a c e y, R. ( ) : Portable Sem i-autom ated Chart Scalers A Useful Tool for Acquiring Digital Depth D ata. Proceedings of the 20th Annual Canadian Hydrographic Conference (pp ), April. [4] VARMA, H.P. ( ) : A n Interactive G raphics Editor for Hydrography. Lighthouse, Edition No. 3 0 (pp ), November. [5] EVANGELATOS, T.V. ( ) : Upgrade of the Cartographic W orkstations. Lighthouse, Edition No. 32 (pp. 5-9), November.
INTERNATIONAL HYDROGRAPHIC SURVEY STANDARDS
 INTERNATIONAL HYDROGRAPHIC SURVEY STANDARDS by Gerald B. MILLS 1 I. Background The International Hydrographic Organization (IHO) traces its origin to the establishment of the International Hydrographic
Sontek RiverSurveyor Test Plan Prepared by David S. Mueller, OSW February 20, 2004
 Sontek RiverSurveyor Test Plan Prepared by David S. Mueller, OSW February 20, 2004 INTRODUCTION Sontek/YSI has introduced new firmware and software for their RiverSurveyor product line. Firmware changes
S-44 edition 5 The IHO s New Standard For Hydrographic Surveys Chris Howlett Head of Seabed Data Centre United Kingdom Hydrographic Office
 S-44 edition 5 The IHO s New Standard For Hydrographic Surveys Chris Howlett Head of Seabed Data Centre United Kingdom Hydrographic Office Chairman of IHO Working Group that created S-44 edition 5 S-44
Evaluation of the Klein HydroChart 3500 Interferometric Bathymetry Sonar for NOAA Sea Floor Mapping
 Evaluation of the Klein HydroChart 3500 Interferometric Bathymetry Sonar for NOAA Sea Floor Mapping Yuhui Ai, Straud Armstrong and Dean Fleury L-3 Communications Klein Associates, Inc. 11 Klein Dr. Salem,
ICES Guidelines for Multibeam Echosounder Data (Compiled September 2006)
") ICES Guidelines for Multibeam Echosounder Data (Compiled September 2006) If you are considering producing a hydrographic survey please read the following information first. Your survey could be used to
ICES Guidelines for Multibeam Echosounder Data (Compiled September 2006) If you are considering producing a hydrographic survey please read the following information first. Your survey could be used to
Advantages of Using Combined Bathymetry and Side Scan Data in Survey Processing T.M. Hiller, L.N. Brisson
 Advantages of Using Combined Bathymetry and Side Scan Data in Survey Processing T.M. Hiller, L.N. Brisson EdgeTech, West WareHam MA, USA EdgeTech 6205 Combined Bathymetric and Side Scan Sonar EdgeTech
Tutorial for the. Total Vertical Uncertainty Analysis Tool in NaviModel3
 Tutorial for the Total Vertical Uncertainty Analysis Tool in NaviModel3 May, 2011 1. Introduction The Total Vertical Uncertainty Analysis Tool in NaviModel3 has been designed to facilitate a determination
NEW SURVEY MOTOR LAUNCHES FOR THE ROYAL AUSTRALIAN NAVY
 International Hydrographic Review, Monaco, LXVI(l), January 1989 NEW SURVEY MOTOR LAUNCHES FOR THE ROYAL AUSTRALIAN NAVY by Commander John LEECH, RAN (*) INTRODUCTION By any standards the task facing the
NEED FOR SUPPLEMENTAL BATHYMETRIC SURVEY DATA COLLECTION
 305 West Grand Avenue, Suite 300 Montvale, New Jersey 07645 Phone 201.930.9890 Fax 201.930.9805 www.anchorqea.com M EMORANDUM To: Caroline Kwan and Nica Klaber U.S. Environmental Protection Agency Region
THE CHALLENGES OF A LARGE-AREA BATHYMETRIC SURVEY
 THE CHALLENGES OF A LARGE-AREA BATHYMETRIC SURVEY Agenda: - Introduction - Tender - Project Planning - Survey - Processing - Delivery - Conclusion 2 Introduction We know less of the oceans at our feet,
BOTTOM MAPPING WITH EM1002 /EM300 /TOPAS Calibration of the Simrad EM300 and EM1002 Multibeam Echo Sounders in the Langryggene calibration area.
 BOTTOM MAPPING WITH EM1002 /EM300 /TOPAS Calibration of the Simrad EM300 and EM1002 Multibeam Echo Sounders in the Langryggene calibration area. by Igor Kazantsev Haflidi Haflidason Asgeir Steinsland Introduction
1 st Tidal and Water Level Working Group Meeting DHN, Niteroi, Brazil 31/03/09 02/04/09 Vertical Offshore Reference Framework (VORF) Chris Jones
 Chris Jones") 1 st Tidal and Water Level Working Group Meeting DHN, Niteroi, Brazil 31/03/09 02/04/09 Vertical Offshore Reference Framework (VORF) Chris Jones United Kingdom Hydrographic Office Presentation Structure
1 st Tidal and Water Level Working Group Meeting DHN, Niteroi, Brazil 31/03/09 02/04/09 Vertical Offshore Reference Framework (VORF) Chris Jones United Kingdom Hydrographic Office Presentation Structure
14/10/2013' Bathymetric Survey. egm502 seafloor mapping
 egm502 seafloor mapping lecture 10 single-beam echo-sounders Bathymetric Survey Bathymetry is the measurement of water depths - bathymetry is the underwater equivalent of terrestrial topography. A transect
THE CANDU 9 DISTRffiUTED CONTROL SYSTEM DESIGN PROCESS
 THE CANDU 9 DISTRffiUTED CONTROL SYSTEM DESIGN PROCESS J.E. HARBER, M.K. KATTAN Atomic Energy of Canada Limited 2251 Speakman Drive, Mississauga, Ont., L5K 1B2 CA9900006 and M.J. MACBETH Institute for
GNSS Technology for the Determination of Real-Time Tidal Information
 GNSS Technology for the Determination of Real-Time Tidal Information Benjamin Kidder C-Nav Positioning Solutions European region Outline of Topics Covered Introduction to Tides Past and Present Methods
Paper for consideration by ENC Working Group. Use of AU6 ENC cells as an option for Bathymetric ENCs (benc)
") Paper for consideration by ENC Working Group Use of AU6 ENC cells as an option for Bathymetric ENCs (benc) Submitted by: Alvaro Sanchez (AHS) Executive Summary: Compilation of high density bathymetric
Paper for consideration by ENC Working Group Use of AU6 ENC cells as an option for Bathymetric ENCs (benc) Submitted by: Alvaro Sanchez (AHS) Executive Summary: Compilation of high density bathymetric
High Precision Hydrography in Canada, the ST. Lawrence River Channel, HD Bathymetry, Production, Distribution and Updating
 High Precision Hydrography in Canada, the ST. Lawrence River Channel, HD Bathymetry, Production, Distribution and Updating Marc Journault Canada CHS, Louis Maltais Canada CHS, and Richard Sanfaçon Canada
Navigation with Leeway
 Navigation with Leeway Leeway, as we shall use the term, means how much a vessel is pushed downwind of its intended course when navigating in the presence of wind. To varying extents, knowledge of this
Optimizing Sound Speed Profiling to Meet TPU Requirements using a CAST Gauge
 Optimizing Sound Speed Profiling to Meet TPU Requirements using a CAST Gauge (Computer Aided Sound speed Technology) Derrick R. Peyton, Steven Smyth, Arnold Furlong ODIM Brooke Ocean Jonathan Beaudoin
Data Collection and Processing: Elwha Estuary Survey, February 2013
 Data Collection and Processing: Elwha Estuary Survey, February 2013 Ian Miller, WA Sea Grant Olympic Peninsula Field Office, 1502 E. Lauridsen Blvd #82, Port Angeles, WA 98362 immiller@u.washington.edu
THE RAPID DIGITISATION OF TIDE CHART RECORDS
 International Hydrographic Reuiew, Monaco, LV (2), July 1978. THE RAPID DIGITISATION OF TIDE CHART RECORDS by W.R. BLAIN & N.B. W E B B E R Department of Civil Engineering, University of Southampton, U.K.
Examples of Carter Corrected DBDB-V Applied to Acoustic Propagation Modeling
 Naval Research Laboratory Stennis Space Center, MS 39529-5004 NRL/MR/7182--08-9100 Examples of Carter Corrected DBDB-V Applied to Acoustic Propagation Modeling J. Paquin Fabre Acoustic Simulation, Measurements,
Marine Renewables Industry Association. Marine Renewables Industry: Requirements for Oceanographic Measurements, Data Processing and Modelling
 Marine Renewables Industry Association Marine Renewables Industry: Requirements for Oceanographic Measurements, Data Processing and Modelling October 2009 Table of Contents 1. Introduction... 1 2. Measurements
APPENDIX G WEATHER DATA SELECTED EXTRACTS FROM ENVIRONMENTAL DATA FOR BCFS VESSEL REPLACEMENT PROGRAM DRAFT REPORT
 APPENDIX G WEATHER DATA SELECTED EXTRACTS FROM ENVIRONMENTAL DATA FOR BCFS VESSEL REPLACEMENT PROGRAM DRAFT REPORT Prepared for: B.C. Ferries Services Inc. Prepared by: George Roddan, P.Eng. Roddan Engineering
Engineering Surveying - II CE313. Hydrographic Survey Lecture 06 Muhammad Noman
 Engineering Surveying - II CE313 Hydrographic Survey Lecture 06 Muhammad Noman Hydrographic Surveying Hydrographic surveying is the branch of the survey which deal with any body of still or running water
ENVIRONMENT AGENCY GREAT OUSE AND 100 FT DRAIN QUARTERLY BATHYMETRIC SURVEY DECEMBER 2013 SITE SURVEY REPORT NO. H6787
 ENVIRONMENT AGENCY GREAT OUSE AND 100FT DRAIN QUARTERLY BATHYMETRIC SURVEY DECEMBER 2013 NO. H6787 LONGDIN & BROWNING (SURVEYS) LIMITED CHERRY TREE HOUSE CARMARTHEN ROAD SWANSEA SA1 1HE H6787 1 Measured
Meeting the Challenges of the IHO and LINZ Special Order Object Detection Requirements
 Meeting the Challenges of the IHO and LINZ Special Order Object Detection Requirements Erik Hammerstad Kongsberg Maritime P. O. Box 111, N-3191 Horten, Norway erik.oscar.hammerstad@kongsberg.com Abstract
AC : MEASUREMENT OF HYDROGEN IN HELIUM FLOW
 AC 2010-2145: MEASUREMENT OF HYDROGEN IN HELIUM FLOW Randy Buchanan, University of Southern Mississippi Christopher Winstead, University of Southern Mississippi Anton Netchaev, University of Southern Mississippi
Performance Analysis of the EdgeTech 6205 Swath Bathymetric Sonar
 Performance Analysis of the EdgeTech 6205 Swath Bathymetric Sonar Lisa Nicole Brisson, Lead Bathymetry Product Engineer, EdgeTech, Boca Raton, FL Damon Wolfe, Lead Bathymetry Sales Engineer, EdgeTech,
Plot the Path. Mary Anne Otten. lesson three
 Plot the Path Mary Anne Otten lesson three Subject/Grade: Grade 2, Math, Social Studies, Science Duration: one class period Materials needed: Per class: Day the Great Lakes Drained Away by Charles Ferguson
ASSESSMENT OF CORRECTNESS OF INFORMATION OBTAINED FROM AUTOMATIC IDENTIFICATION OF SHIP S SYSTEM (AIS)
") Journal of KONES Powertrain and Transport, Vol. 17, No. 3 2010 ASSESSMENT OF CORRECTNESS OF INFORMATION OBTAINED FROM AUTOMATIC IDENTIFICATION OF SHIP S SYSTEM (AIS) Henryk niegocki Gdynia Maritime University,
Journal of KONES Powertrain and Transport, Vol. 17, No. 3 2010 ASSESSMENT OF CORRECTNESS OF INFORMATION OBTAINED FROM AUTOMATIC IDENTIFICATION OF SHIP S SYSTEM (AIS) Henryk niegocki Gdynia Maritime University,
Compact Light Weight RC Boat for Hydrographic Surveys on Dams, Creeks, Rivers, storm water retention pits and other waterways.
 Accura Hydrographic RC Survey Boat Compact Light Weight RC Boat for Hydrographic Surveys on Dams, Creeks, Rivers, storm water retention pits and other waterways. Utilises Sounder & Transducer from CEE
Naval Postgraduate School, Operational Oceanography and Meteorology. Since inputs from UDAS are continuously used in projects at the Naval
 How Accurate are UDAS True Winds? Charles L Williams, LT USN September 5, 2006 Naval Postgraduate School, Operational Oceanography and Meteorology Abstract Since inputs from UDAS are continuously used
H ydrog ra p h ic S urve y Using SEABAT
 H ydrog ra p h ic S urve y Using SEABAT Hirokazu Mori, Tadashi Yamamoto and Isao Tedokon, Hydrographic Department, Japan Coast Guard The original was written in 1999, and our hydrographic surveys using
EXPEDITION ADVENTURE PART 2: HIGHER RESOLUTION RANGE SEISMIC IMAGING TO LOCATE A SUNKEN PIRATE SHIP OFF ILE ST MARIE.
 EXPEDITION ADVENTURE PART 2: HIGHER RESOLUTION RANGE SEISMIC IMAGING TO LOCATE A SUNKEN PIRATE SHIP OFF ILE ST MARIE. Jakob B.U. Haldorsen, and Douglas E. Miller, Schlumberger-Doll Research, Ridgefield,
ENHANCED PARKWAY STUDY: PHASE 2 CONTINUOUS FLOW INTERSECTIONS. Final Report
 Preparedby: ENHANCED PARKWAY STUDY: PHASE 2 CONTINUOUS FLOW INTERSECTIONS Final Report Prepared for Maricopa County Department of Transportation Prepared by TABLE OF CONTENTS Page EXECUTIVE SUMMARY ES-1
Utilizing Vessel Based Mobile LiDAR & Bathymetry Survey Techniques for Survey of Four Southern California Breakwaters
 Utilizing Vessel Based Mobile LiDAR & Bathymetry Survey Techniques for Survey of Four Southern California Breakwaters Western Dredging Association: Pacific Chapter September 2012 Insert: Pipe Location
Wade Reynolds 1 Frank Young 1,2 Peter Gibbings 1,2. University of Southern Queensland Toowoomba 4350 AUSTRALIA
 A Comparison of Methods for Mapping Golf Greens Wade Reynolds 1 Frank Young 1,2 Peter Gibbings 1,2 1 Faculty of Engineering and Surveying 2 Australian Centre for Sustainable Catchments University of Southern
BUYER S GUIDE AQUAlogger 530WTD
 OCEAN & ENVIRONMENTAL BUYER S GUIDE AQUAlogger 530WTD Wireless Temperature and Depth Logger AQUAlogger 530WTD The AQUAlogger 530WTD has an innovative design that includes the ability to transfer stored
PORTS AUSTRALIA. PRINCIPLES FOR GATHERING AND PROCESSING HYDROGRAPHIC INFORMATION IN AUSTRALIAN PORTS (Version 1.5 November 2012)
") PORTS AUSTRALIA PRINCIPLES FOR GATHERING AND PROCESSING HYDROGRAPHIC INFORMATION IN AUSTRALIAN PORTS (Version 1.5 November 2012) PREFACE These Principles have been prepared by the Hydrographic Surveyors
PORTS AUSTRALIA PRINCIPLES FOR GATHERING AND PROCESSING HYDROGRAPHIC INFORMATION IN AUSTRALIAN PORTS (Version 1.5 November 2012) PREFACE These Principles have been prepared by the Hydrographic Surveyors
Interferometric Swath Bathymetry for Large Scale Shallow Water Hydrographic Surveys
 Interferometric Swath Bathymetry for Large Scale Shallow Water Hydrographic Surveys Lisa N. Brisson 1, Damon A. Wolfe 1, Matthew Staley P.S.M. 2 1 EdgeTech 4 Little Brook Rd West Wareham, MA 02576 2 USACE
BathySurvey A Trimble Access hydrographic survey module
 BathySurvey A Trimble Access hydrographic survey module Contents 1. Introduction... 3 2. Installation... 4 3. Main Screen... 5 4. Device... 6 5. Jobs... 7 6. Settings Odom Echotrac... 8 7. Settings Ohmex
ASSESSMENT OF CORRECTNESS OF INFORMATION OBTAINED FROM AUTOMATIC IDENTIFICATION OF SHIP S SYSTEM (AIS)
") ASSESSMENT OF CORRECTNESS OF INFORMATION OBTAINED FROM AUTOMATIC IDENTIFICATION OF SHIP S SYSTEM (AIS) Henryk Śniegocki Akademia Morska w Gdyni, Katedra Nawigacji Aleja Jana Pawła II 3, 81-345 Gdynia,
ASSESSMENT OF CORRECTNESS OF INFORMATION OBTAINED FROM AUTOMATIC IDENTIFICATION OF SHIP S SYSTEM (AIS) Henryk Śniegocki Akademia Morska w Gdyni, Katedra Nawigacji Aleja Jana Pawła II 3, 81-345 Gdynia,
DEPARTMENT OF THE NAVY DIVISION NEWPORT OFFICE OF COUNSEL PHONE: FAX: DSN:
 IMAVSBA WARFARE CENTERS NEWPORT DEPARTMENT OF THE NAVY NAVAL UNDERSEA WARFARE CENTER DIVISION NEWPORT OFFICE OF COUNSEL PHONE: 401 832-3653 FAX: 401 832-4432 DSN: 432-3653 Attorney Docket No. 85031 Date:
Dynamic Positioning Control Augmentation for Jack-up Vessels
 DYNAMIC POSITIONING CONFERENCE October 9-10, 2012 Design and Control Session Dynamic Positioning Control Augmentation for Jack-up Vessels By Bradley Deghuee L-3 Communications 1 Introduction Specialized
WMB-160F Multi-beam Fishing System
 WMB-160F Multi-beam Fishing System Take away the guess work and see what s REALLY below your boat! Seven Systems in One 2 WMB-160F WMB-160F Screen Shots The WMB-160F is a multi-beam sonar that has been
Overview. 2 Module 13: Advanced Data Processing
 2 Module 13: Advanced Data Processing Overview This section of the course covers advanced data processing when profiling. We will discuss the removal of the fairly gross effects of ship heave and talk
Which compressed air system design is right for you?
 WEBINAR BRIEF / PRESENTED BY Which compressed air system design is right for you? -1- When good compressed air equipment goes bad by Ron Marshall Over the years, many wellmeaning companies have taken the
Upgrading Vestas V47-660kW
 Guaranteed performance gains and efficiency improvements Upgrading Vestas V47-660kW Newly developed controller system enables increased Annual Energy Production up to 6.1% and safe turbine lifetime extension
Work Horses of the Breathing Air Industry
 High Pressure Breathing Air Equipment Work Horses of the Breathing Air Industry Pegasus Compressor The Pegasus vertically enclosed compressor is a full-featured system that incorporates the latest technology
FIG: 27.1 Tool String
 Bring up Radioactive Tracer service. Click Acquisition Box - Edit - Tool String Edit the tool string as necessary to reflect the tool string being run. This is important to insure proper offsets, filters,
Oracle Utilities Meter Data Management Release Utility Reference Model MDM.Manage VEE and VEE Exceptions
 Oracle Utilities Meter Data Management Release 2.0.1 Utility Reference Model 4.2.1.2 MDM.Manage VEE and VEE Exceptions January 2014 Oracle Utilities Meter Data Management Utility Reference Model 4.2.1.2
sorting solutions osx separator series
 osx separator series Comex offers a newly developed complex optical sorting system, in a user friendly platform, for the identification and separation of particles and materials, based on their many physical
THE USE OF SPATIAL STATISTICS IN HYDROGRAPHY
 International Hydrographie Review, Monaco, LXIX(l), March 1992 THE USE OF SPATIAL STATISTICS IN HYDROGRAPHY by Peter KIELLAND 1 and Michel DAGBERT 2 Paper presented at the Canadian Hydrographic Conference
EEC 686/785 Modeling & Performance Evaluation of Computer Systems. Lecture 6. Wenbing Zhao. Department of Electrical and Computer Engineering
 EEC 686/785 Modeling & Performance Evaluation of Computer Systems Lecture 6 Department of Electrical and Computer Engineering Cleveland State University wenbing@ieee.org Outline 2 Review of lecture 5 The
Improve Process Reliability
 Convenient Conductivity Calibration to Meet Pharmacopeia Regulations Pharmacopeias require that conductivity measurement systems be periodically calibrated to ensure their precision. The range of accessories
A PRACTICAL APPROACH TO QUALITY CONTROL AND QUALITY ANALYSIS OF DEPTH DATA
 A PRACTICAL APPROACH TO QUALITY CONTROL AND QUALITY ANALYSIS OF DEPTH DATA ABSTRACT Ulf Olsson, Mats Ericson, Stigbjörn Nilsson, Hans Öiås Hydrographic Office, Swedish Maritime Administration, Sweden Quality
Characterizing Ireland s wave energy resource
 Snapshots of Doctoral Research at University College Cork 2011 Characterizing Ireland s wave energy resource Brendan Cahill Hydraulics & Maritime Research Centre, UCC Introduction In theory, the energy
Outline. Terminology. EEC 686/785 Modeling & Performance Evaluation of Computer Systems. Lecture 6. Steps in Capacity Planning and Management
 EEC 686/785 Modeling & Performance Evaluation of Computer Systems Lecture 6 Department of Electrical and Computer Engineering Cleveland State University wenbing@ieee.org Outline Review of lecture 5 The
What s Up in Navigation Displays?
 What s Up in Navigation Displays? Captain PAUL CHAPMAN paul.chapman@compassadjuster.com.au 2009 What s up in Navigation Displays? Captain Paul Chapman Situation Awareness When following a passage plan,
Modeling of Hydraulic Hose Paths
 Mechanical Engineering Conference Presentations, Papers, and Proceedings Mechanical Engineering 9-2002 Modeling of Hydraulic Hose Paths Kurt A. Chipperfield Iowa State University Judy M. Vance Iowa State
Road Data Input System using Digital Map in Roadtraffic
 Data Input System using Digital Map in traffic Simulation Namekawa,M 1., N.Aoyagi 2, Y.Ueda 2 and A.Satoh 2 1 College of Management and Economics, Kaetsu University, Tokyo, JAPAN 2 Faculty of Engineering,
Minimum depth, mean depth or something in between?
 Minimum depth, mean depth or something in between? Tannaz H. Mohammadloo a, Mirjam Snellen a, Dick G. Simons a, Ben Dierikx b, Simon Bicknese b a Acoustics Group, Department of Control & Operations, Faculty
Aids to navigation can include buoys, day beacons, range markers, and lighthouses.
 This boating safety course manual has been approved by Transport Canada strictly on the basis that it meets the minimum requirements of basic boating safety knowledge set out in Transport Canada s Boating
Fail Operational Controls for an Independent Metering Valve
 Group 14 - System Intergration and Safety Paper 14-3 465 Fail Operational Controls for an Independent Metering Valve Michael Rannow Eaton Corporation, 7945 Wallace Rd., Eden Prairie, MN, 55347, email:
PREDICTING THE ABILITY OF SURVIVAL AFTER DAMAGE IN TANKERS. José Poblet Martínez - SENER, (Spain) José Javier Díaz Yraola - SENER, (Spain)
 José Javier Díaz Yraola - SENER, (Spain)") 8 th International Conference on 477 PREDICTING THE ABILITY OF SURVIVAL AFTER DAMAGE IN TANKERS Abstract José Poblet Martínez - SENER, (Spain) José Javier Díaz Yraola - SENER, (Spain) To meet the demand
8 th International Conference on 477 PREDICTING THE ABILITY OF SURVIVAL AFTER DAMAGE IN TANKERS Abstract José Poblet Martínez - SENER, (Spain) José Javier Díaz Yraola - SENER, (Spain) To meet the demand
PART 5 - OPTIONS CONTENTS 5.1 SYSTEM EXPANSION 5-3
 PART 5 - OPTIONS CONTENTS Para Page 5.1 SYSTEM EXPANSION 5-3 5.2 SENSORS 5-3 5.2.1 Trim Angle Sensor 5-3 5.2.2 Mast Rotation Sensor 5-3 5.2.3 Heel Angle Sensor 5-3 5.2.4 Barometric Pressure Sensor 5-3
APPLICATION OF GPS RTK TECHNIQUE TO SHIP HULL TRAJECTORY DETERMINATION DURING LAUNCHING
 POSTER PAPER SESSION APPLICATION OF GPS RTK TECHNIQUE TO SHIP HULL TRAJECTORY DETERMINATION DURING LAUNCHING Zofia Rzepecka, Alojzy Wasilewski Institute of Geodesy, University of Warmia and Mazury in Olsztyn
Swing Labs Training Guide
 Swing Labs Training Guide How to perform a fitting using FlightScope and Swing Labs Upload Manager 3 v0 20080116 ii Swing labs Table of Contents 1 Installing & Set-up of Upload Manager 3 (UM3) 1 Installation.................................
SEA-LEVEL AND SEA-STATE MEASUREMENTS WITH RADAR LEVEL SENSORS. Dr. Ulrich Barjenbruch 1 and Jens Wilhelmi 2
 SEA-LEVEL AND SEA-STATE MEASUREMENTS WITH RADAR LEVEL SENSORS Dr. Ulrich Barjenbruch 1 and Jens Wilhelmi 2 The German Federal Institute of Hydrology (BfG) developed a cost-efficient method to monitor the
Nortek Technical Note No.: TN-021. Chesapeake Bay AWAC Evaluation
 Nortek Technical Note No.: TN-021 Title: Chesapeake Bay AWAC Evaluation Last Edited: October 5, 2004 Authors: Eric Siegel-NortekUSA, Chris Malzone-NortekUSA, Torstein Pedersen- Number of Pages: 12 Chesapeake
2011 ScheduALL FOXTEL
 2011 ScheduALL FOXTEL Introduction If you're watching subscription television Down Under, it's likely your TV set is tuned to FOXTEL, Australia's leading subscription television provider. In addition to
AUTOMATIC DREDGING PROFILE AND CONTOUR CONTROL
 AUTOMATIC DREDGING PROFILE AND CONTOUR CONTROL Jay Wise 1 ABSTRACT Phillips and Jordan, a leading excavating and disaster recovery contractor, was faced with the challenge to manage a civil contract involving
Admiralty e-navigator
 Admiralty e-navigator Admiralty e-navigator Service e-navigation is the harmonised collection, integration, exchange, presentation and analysis of maritime information onboard and ashore by electronic
Emerging Subsea Networks
 THE FUTURE OF MARINE SURVEY APPLICATIONS FOR SUBMARINE CABLES Ryan Wopschall (Fugro) Email: rwopschall@fugro.com Fugro Pelagos, Inc. - 3574 Ruffin Road, San Diego, California 92123 USA Abstract: New advances
HumiSys HF High Flow RH Generator
 HumiSys HF High Flow RH Generator Designed, built, and supported by InstruQuest Inc. Versatile Relative Humidity Generation and Multi-Sensor System The HumiSys HF is a high flow version of the previously
MOREHEAD CITY HARBOR, NC. Dredged Material Management Plan (DMMP)
") MOREHEAD CITY HARBOR, NC Dredged Material Management Plan (DMMP) Public Meeting/Info Session 15 January 2014 US Army Corps of Engineers Morehead City Harbor DMMP Presentation Topics Morehead City Harbor
MOREHEAD CITY HARBOR, NC Dredged Material Management Plan (DMMP) Public Meeting/Info Session 15 January 2014 US Army Corps of Engineers Morehead City Harbor DMMP Presentation Topics Morehead City Harbor
Products and Services HR3D, AUV3D
 Products and Services HR3D, AUV3D Multi-streamer Short Offset High Resolution 3D Seismic Acquisition Peter Sack Tor Haugland Sound Oceanics, LLC Houston, Texas USA 15 March 2012 Background Petromar V West
RESOLUTION A.817(19) adopted on 23 November 1995 PERFORMANCE STANDARDS FOR ELECTRONIC CHART DISPLAY AND INFORMATION SYSTEMS (ECDIS)
 adopted on 23 November 1995 PERFORMANCE STANDARDS FOR ELECTRONIC CHART DISPLAY AND INFORMATION SYSTEMS (ECDIS)") A 19/Res.817 15 December 1996 Original: ENGLISH ASSEMBLY 19th session Agenda item 10 RESOLUTION A.817(19) adopted on 23 November 1995 PERFORMANCE STANDARDS FOR ELECTRONIC CHART DISPLAY AND INFORMATION
A 19/Res.817 15 December 1996 Original: ENGLISH ASSEMBLY 19th session Agenda item 10 RESOLUTION A.817(19) adopted on 23 November 1995 PERFORMANCE STANDARDS FOR ELECTRONIC CHART DISPLAY AND INFORMATION
Mapping the Sea Bottom Using RTK GPS and Lead-Line in Trabzon Harbor
 Mapping the Sea Bottom Using RTK GPS and Lead-Line in Trabzon Harbor Arzu ERENER and Ertan GÖKALP, Turkey Key Words: Real-Time Kinematic GPS, Lead Line, Roll Effect, Hydrographic surveys. SUMMARY The harbor
South Bay Coastal Ocean Observing System California Clean Beaches Initiative
 South Bay Coastal Ocean Observing System California Clean Beaches Initiative Quarterly Report March 2004 to City of Imperial Beach Eric Terrill 1 1 Scripps Institution of Oceanography, University of California,
Survey design and acquisition of a 4-C ocean-bottom seismometer survey over the White Rose oilfield, offshore Newfoundland
 White Rose OBS, 2002 Survey design and acquisition of a 4-C ocean-bottom seismometer survey over the White Rose oilfield, offshore Newfoundland Kevin W. Hall and Robert R. Stewart ABSTRACT CREWES, in conjunction
The Use of Ultrasonic Inspections at Elevated Temperature
 18th World Conference on Nondestructive Testing, 16-20 April 2012, Durban, South Africa The Use of Ultrasonic Inspections at Elevated Temperature Alex McLAY, Jan VERKOOIJEN, TÜV Rheinland Sonovation 4906AZ
Reply of Guyana Annex R2
 Summary of Findings: Analysis of Recent Shoreline Revisions to the This report assesses recent shoreline changes made to the 2005 edition of Dutch nautical chart NL 2218. This new edition is credited jointly
STUDY REPORT W&AR-03 RESERVOIR TEMPERATURE MODEL ATTACHMENT B DON PEDRO RESERVOIR BATHYMETRIC STUDY REPORT
 STUDY REPORT W&AR-03 RESERVOIR TEMPERATURE MODEL ATTACHMENT B DON PEDRO RESERVOIR BATHYMETRIC STUDY REPORT DON PEDRO RESERVOIR BATHYMETRIC STUDY REPORT Prepared for: TURLOCK IRRIGATION DISTRICT MODESTO
Deploying the TCM-1 Tilt Current Meter in an Inverted (Hanging) Orientation By: Nick Lowell, Founder & President
 Orientation By: Nick Lowell, Founder & President") Lowell Instruments Application Note #TCMA Deploying the TCM-1 Tilt Current Meter in an Inverted (Hanging) Orientation By: Nick Lowell, Founder & President 1 Introduction The TCM-1 Tilt Current Meter (TCM)
Lowell Instruments Application Note #TCMA Deploying the TCM-1 Tilt Current Meter in an Inverted (Hanging) Orientation By: Nick Lowell, Founder & President 1 Introduction The TCM-1 Tilt Current Meter (TCM)
FULL SCALE MEASUREMENT OF DYNAMIC SHIP MOTIONS AND SQUAT
 FULL SCALE MEASUREMENT OF DYNAMIC SHIP MOTIONS AND SQUAT Mr. Gary Rolph Chief Hydrographic Surveyor Port of Brisbane Corporation Mr. Peter Rumball Surveyor Port of Brisbane Corporation Dr. Terry O'Brien
IDeA Competition Report. Electronic Swimming Coach (ESC) for. Athletes who are Visually Impaired
 for. Athletes who are Visually Impaired") IDeA Competition Report Electronic Swimming Coach (ESC) for Athletes who are Visually Impaired Project Carried Out Under: The Department of Systems and Computer Engineering Carleton University Supervisor
IDeA Competition Report Electronic Swimming Coach (ESC) for Athletes who are Visually Impaired Project Carried Out Under: The Department of Systems and Computer Engineering Carleton University Supervisor
Temperature, salinity, density, and the oceanic pressure field
 Chapter 2 Temperature, salinity, density, and the oceanic pressure field The ratios of the many components which make up the salt in the ocean are remarkably constant, and salinity, the total salt content
A STUDY OF THE LOSSES AND INTERACTIONS BETWEEN ONE OR MORE BOW THRUSTERS AND A CATAMARAN HULL
 A STUDY OF THE LOSSES AND INTERACTIONS BETWEEN ONE OR MORE BOW THRUSTERS AND A CATAMARAN HULL L Boddy and T Clarke, Austal Ships, Australia SUMMARY CFD analysis has been conducted on a 100m catamaran hull
CORRELATION BETWEEN SONAR ECHOES AND SEA BOTTOM TOPOGRAPHY
 CORRELATION BETWEEN SONAR ECHOES AND SEA BOTTOM TOPOGRAPHY JON WEGGE Norwegian Defence Research Establishment (FFI), PO Box 115, NO-3191 Horten, Norway E-mail: jon.wegge@ffi.no False alarms resulting from
Air Force Calibration Interval Analysis of Test, Measurement and Diagnostic Equipment (TMDE) Based on Maintenance Data Collection (MDC)
 Based on Maintenance Data Collection (MDC)") Air Force Calibration Interval Analysis of Test, Measurement and Diagnostic Equipment (TMDE) Based on Maintenance Data Collection (MDC) Speaker: Scott Brockway AFMETCAL 813 Irving-Wick Dr. W. Bldg 2 Heath
Air Force Calibration Interval Analysis of Test, Measurement and Diagnostic Equipment (TMDE) Based on Maintenance Data Collection (MDC) Speaker: Scott Brockway AFMETCAL 813 Irving-Wick Dr. W. Bldg 2 Heath
UNIVERSITY OF WATERLOO
 UNIVERSITY OF WATERLOO Department of Chemical Engineering ChE 524 Process Control Laboratory Instruction Manual January, 2001 Revised: May, 2009 1 Experiment # 2 - Double Pipe Heat Exchanger Experimental
A real time vessel air gap monitoring system
 Journal of Physics: Conference Series A real time vessel air gap monitoring system To cite this article: D McStay and K Thabeth 2009 J. Phys.: Conf. Ser. 178 012038 View the article online for updates
IFREMER, Department of Underwater Systems, Toulon, France. L u c i e Somaglino, P a t r i c k J a u s s a u d, R o main P i a s co, E w e n Raugel
 F i r s t s e a t r i a l s w i t h E M 2 0 4 0 m u l t i b e a m s o u n d e r i n n o v a t i v e i n t e g r a t i o n o n H y b r i d R O V A r i a n e IFREMER, Department of Underwater Systems, Toulon,
Hydrographic Surveying Methods, Applications and Uses
 Definition: Hydrographic Surveying Methods, Applications and Uses It is the branch of surveying which deals with any body of still or running water such as a lake, harbor, stream or river. Hydrographic
LEADER SEARCH RADAR LIFE LOCATOR
 INTRODUCTION OF: Ultra Wide Band Victims detector & Locator V30.09.13.00 Product Concept i. The is designed to be simplistic in use whilst producing reliable and accurate information in the search for
Specifications for the CMI 2409 Magnetocardiograph
 Specifications for the CMI 2409 Magnetocardiograph Revision date April 14, 2006 1 518-381-1000 (tel) The CMI-2409 system consists of a holder (A), a patient bed (B) and a workstation (not shown in the
Sentry de-brief summaries 2011/2012
 Three cruises*: 1 Sentry/TowCam 1 Sentry/TowMag 1 Sentry/Jason *All cruises were post-refit 1 Pre-Cruise Planning: For two cruises everything was fine and went well For 1 cruise - planning began just one
Drilling Efficiency Utilizing Coriolis Flow Technology
 Session 12: Drilling Efficiency Utilizing Coriolis Flow Technology Clement Cabanayan Emerson Process Management Abstract Continuous, accurate and reliable measurement of drilling fluid volumes and densities