Plasma Volume Hematocrit (PVH): Big Data Applied to Physiology Enabled by a New Algorithm
|
|
|
- Barbara Weaver
- 6 years ago
- Views:
Transcription

1 Syracuse University SURFACE Dissertations - ALL SURFACE August 2016 Plasma Volume Hematocrit (PVH): Big Data Applied to Physiology Enabled by a New Algorithm Paul Washington Dent Syracuse University Follow this and additional works at: Part of the Physical Sciences and Mathematics Commons Recommended Citation Dent, Paul Washington, "Plasma Volume Hematocrit (PVH): Big Data Applied to Physiology Enabled by a New Algorithm" (2016). Dissertations - ALL This Dissertation is brought to you for free and open access by the SURFACE at SURFACE. It has been accepted for inclusion in Dissertations - ALL by an authorized administrator of SURFACE. For more information, please contact surface@syr.edu.
2 ABSTRACT This work describes the ongoing analysis of blood noninvasively in vivo along with the in vitro validation of the algorithm. The blood is taken as two components, red blood cells and plasma, both of which cause elastic emission (from Mie and Rayleigh scattering) and inelastic emission (from fluorescence and Raman emission). The algorithm describes the linear dependence of the volume fractions of both red blood cells and plasma with both the elastic and inelastic emissions where the two equations are independent. These equations are used to calculate the Hematocrit which is defined as the volume fraction of red blood cells in the total volume of blood. We believe that monitoring changes in the Hematocrit with sufficient sensitivity could give information about many physiological parameters including an early indication for internal hemorrhaging. The stability of the baseline was analyzed in 10 test subjects across 29 experiments including over 8 million frames of data to give the smallest physiological increment of ±0.033 Hematocrit units. Compared to the medical standard blood draw method, with a standard deviation of ±2.0 Hematocrit units, our device is 60 times more sensitive to changes in the Hematocrit. Repeating patterns in the Hematocrit can be analyzed by a Fourier transform to give respiration rate and pulse rate earning the title of big data. Changes in the Hematocrit were also observed in dialysis patients (where the blood is manually cleaned due to kidney failure) and in a rat model where large portions of the blood can be removed and reintroduced. Blood loss and addition of fluid reveal changes in the Hematocrit that are distinguishable from the baseline. The algorithm was validated by a well-defined in vitro system modeling the blood components. The model
3 demonstrates that an optically thin sample in the linear range produces a good fit by the algorithm. Finally, the blood was analyzed in vitro to demonstrate that the red blood cells and plasma show linearity within the physiological ranges observed in vivo. At 830 nm excitation, the same wavelength used in vivo, volume fractions of red blood cells and plasma at the physiological range demonstrate linearity. All of the experiments and analysis appear to give evidence supporting the measuring of changes in the Hematocrit noninvasively in vivo on a medically useful timescale.
4 Plasma Volume Hematocrit (PVH): Big Data Applied to Physiology Enabled by a New Algorithm by Paul W. Dent B.S., Marietta College, 2011 M.Phil., Syracuse University, 2013 Dissertation Submitted in partial fulfillment of the requirements for the degree of Doctor of Philosophy in Chemistry. Syracuse University August 2016
5 Copyright Paul Dent 2016 All Rights Reserved
6 Dedicated to my parents, Tim and Claire Dent, for their unconditional encouragement, support, and love. Dedicated also to my best friend and loving wife, Laura Dent, who gives me motivation, inspiration, and abundant joy. v
7 Acknowledgements: Syracuse was my first home away from home and will always hold a special place in my life. I have my undergraduate research advisor, Dr. Jeitler, to thank for encouraging me to consider graduate school in the first place. I feel as though I have done a great deal of growing over my years here in Syracuse and I have a lot of people to thank for that growth. First and foremost, Dr. Chaiken took me into his lab even though he wasn t sure if he wanted to take a new student. My time spent in the lab was both guided and at the same time open for me to formulate ideas and try new things. If I ever had a question or concern, there was always an open door for conversations yet I was the one able to take control of my research. I have gained countless nuggets of wisdom from Dr. Chaiken and was still able to learn and investigate on my own. My skills as a scientist have greatly improved under the guidance of Dr. Chaiken and I will continue to grow as I embark on my own journey. I am also grateful that Dr. Deng was still working in the lab at the time and was able to teach me how everything worked and to help me understand the broader concepts of the in vivo research. My parents, Tim and Claire, deserve more thanks than I can give for all that they ve done to teach me and encourage me to strive in all that I do. They have instilled in me a desire to learn and a dedication to work hard at everything I do. They have been nothing but supportive and always willing to help in any way they can. My brothers, Chris and Kyle, have also been incredibly supportive of me in my continued education and I am thankful for such an encouraging family. Since coming to Syracuse, my family has grown to include Laura, my wonderful wife. My life has been so filled with joy since we started dating and were married not long after. She challenges me to be a better vi
8 person and is constantly offering love and support in all that I do. I am excited to begin our new adventure as we move on from Syracuse. Along the way, I have made many friends and am thankful for the ways that they have enriched my life. Patrick Lutz, one of my first friends in Syracuse, made studying for classes and preparing for presentations so much more enjoyable. We were able to challenge each other and at the same time offer new insights on the problems we faced. I am thankful to have spent three years as roommates. Ricky McDonough is the reason that I stayed healthy as a graduate student. I did my best to teach him how to think critically about designing experiments and he taught me how to lift weights and stay motivated. Seth Fillioe and Sai Han Myo Tun have been working hard to learn all of the things that I ve been working on with the ongoing in vivo project. They have both taken the initiative to develop their own projects and to work together on the ongoing studies. I look forward to seeing where all of these guys end up after they graduate. There have also been a number of undergraduate students who have helped work on my various projects over the years. Alycia Cucka, Colin Reynolds, Jordan Hartwig, Lynn Chui, Woojin Chung, and Anmol Grewal have all helped with the in vivo work in various ways. Robert Gratton started to look at phosphorylation of albumin in preparation for the Lasix experiments that have yet to be started. Finally, Melanie Fellner helped with the in vitro blood experiments and started working towards blood glucose measurements on the current system. They have all helped in some capacity to gather and analyze data and I am grateful for them all. vii
9 Table of Contents Acknowledgements...v Table of Contents...vii List of Symbols and Acronyms...x List of Figures...xi List of Tables...xiv 1. Introduction Previous Work and Motivation for Noninvasive in vivo Blood Analysis History of Hematocrit Measurements Scope and Layout for the Dissertation Hypotheses Investigated Background and Theory Measuring EE and IE in vivo Theoretical Model and PVH Algorithm Calibration of the Algorithm Normal Physiological Responses Importance and Motivation Experimental Baseline Responses Pressure Effects Postural and Orthostatic Induced Fluid Shifts Summary PVH Measurements in a Rat Model...56 viii
10 4.1. Motivation for Use of Rat Model Experimental Results Summary in vitro Model to Validate the PVH Algorithm Background Theory Experimental Training Set Data Applying the Algorithm Observation of Quartz Settling Porphyrin Photodegredation Summary Blood Samples Investigated in vitro Interest in Study Experimental Experiments at 785 nm Experiments at 830 nm Summary Discussion, Future Work, and Conclusions Discussion Future Work Conclusions ix
11 Appendix A Appendix B References Vita x
12 List of Symbols and Acronyms BSN CCD CsCl EE FDA FT Hct HF s Hgb IE LTM NIR PBS PDPM PV PVH RBC s RTE SpO2 VM Binary spectronephelometry Charge coupled device Cesium chloride Elastic emission US Food and Drug Administration Fourier transform Hematocrit Human factors Hemoglobin concentration Inelastic emission LighTouch Medical Near Infrared Phosphate buffered saline Position-detection pressure monitor Plasma volume Plasma volume and Hematocrit Red blood cells Radiation Transfer Equation Oxygen saturation of the blood Valsalva maneuver xi
13 List of Figures Figure 1.1: Schematic diagram of the Tissue Modulator for glucose measurements...2 Figure 1.2: Image of the PDPM system...4 Figure 1.3: Image of the Fresenius (Gambro) dialysis machine...9 Figure 2.1: Schematic of laser penetration during in vivo blood measurements...19 Figure 2.2: Typical Raman spectrum from a finger...20 Figure 2.3: Real-time output of the CRIT-LINE...25 Figure 2.4: Data comparing LTM to CRIT-LINE for constants in algorithm...26 Figure 2.5: 20 sec data comparing LTM to CRIT-LINE...27 Figure 2.6: Correlation between two sets of data calculated with identical zeroes...28 Figure 3.1: Two images of the finger probe used in this study...35 Figure 3.2: Measured Hematocrit % comparing pre-bleached to bleaching skin...38 Figure 3.3: Hematocrit % on four occasions for both A) Joe and B) Paul...39 Figure 3.4: Hematocrit % data changing for pulse and breathing...40 Figure 3.5: Fourier transform from 30 minutes worth of baseline data...41 Figure 3.6: Screenshot of raw data changing with different breathing rates...42 Figure 3.7: Frequencies for A) normal B) slow and C) fast breathing...42 Figure 3.8: Changing Hematocrit % with added pressure in four patients...44 Figure 3.9: Measured PV and Hct during a Valsalva maneuver...47 Figure 3.10: Textbook example Valsalva maneuver...47 Figure 3.11: Raised legs show orthostatic redistribution in changing Hematocrit...49 Figure 3.12: Enlarged view of raised legs from Figure xii
14 Figure 3.13: Tilt-table experiment with blood pressure monitoring...51 Figure 4.1: Schematic of monitoring and blood removal sites in rat model...58 Figure 4.2: Image of the pressure monitoring device...59 Figure 4.3: Typical baseline with PVH and pressure data...59 Figure 4.4: Hct change from whole blood removal and addition...61 Figure 4.5: Hct change from whole blood removal and Normocarb addition...62 Figure 4.6: Real time Hct and PV during a whole blood removal experiment...63 Figure 4.7: Real time PVH on adding Normocarb without prior blood removal...64 Figure 5.1: Model of photon path through cuvette...72 Figure 5.2: Experimental geometry of 785 nm homemade apparatus...78 Figure 5.3: Two dimensional calibration curve of quarts and porphyrin...81 Figure 5.4: Linear fits of the calibration curves after algorithm...83 Figure 5.5: Linear fits from extra parameters added to the algorithm...85 Figure 5.6: Settling of quartz spheres over time...86 Figure 5.7: Characteristic density profiles for settling...87 Figure 5.8: Porphyrin decay comparing bubbled oxygen and argon...89 Figure 5.9: Absorption of Soret band (411 nm) for porphyrin...90 Figure 5.10: Settling with added 1.0x azide to quench porphyrin degradation...91 Figure 5.11: Settling with added 0.5x azide to quench porphyrin degradation...92 Figure 5.12: Temperature variations from porphyrin degradation...93 Figure 6.1: Images of scattering and fluorescence of RBC s and plasma Figure 6.2: Linear ranges of RBC s and Plasma for both EE and IE at 785 nm xiii
15 Figure 6.3: Training set of RBC s and Plasma for both EE and IE Figure 6.4: Algorithm applied to data from Figure Figure 6.5: Linear ranges of RBC s and Plasma for both EE and IE at 830 nm Figure 6.6: Training set of RBC s and Plasma for both EE and IE Figure 6.7: Linear ranges of RBC s and Plasma at a new 90 degree geometry Figure 7.1: Hematocrit measured on three patients during hemodialys Figure 7.2: PVH measurements on a resting patient as the bladder turns on xiv
16 List of Tables Table 2.1: Absorption and scattering coefficients for the phases comprising skin...19 Table 5.1: Linear fit parameters from calibration curves of quartz and porphyrin...81 xv
17 1 1. Introduction 1.1. Previous Work and Motivation for Noninvasive in vivo Blood Analysis The Chaiken lab began investigating in vivo measurements of blood in 1997 with the motivation to achieve noninvasive blood glucose. Published results in made claim to be the first published noninvasive in vivo Raman measurement of blood glucose followed by a succession of subsequent articles ,3,4 This measurement of blood glucose was (and still is) somewhat of a holy grail due to implications for replacing the US Food and Drug Administration (FDA) approved finger stick method. Diabetes was a growing issue in 2000 and still is with over 29 million in the US, or about 9.3 % of the US population affected in While prevention of diabetes is a huge priority, it is also important to care for those living with the disease. Individuals with type 2 are able to control symptoms if they know their blood glucose levels but daily pricking of fingers is not appealing. In order to achieve success, the new method of measurement must be superior to the FDA-approved finger stick. The original Chaiken Group noninvasive prototypes required a test subject to hold a finger against an aperture/orifice on the Tissue Modulator to analyze the volar side of the fingertip, as depicted in Figure The volar side of the finger was chosen due to the network of blood vessels beneath the skin with a relatively high perfusion close to the surface. The aperture was aligned with the focus of the laser and the light collection system to ensure collection of signal from blood vessels. In some prototypes, the test subjects could align their fingers using three small bumps the size of Braille dots for positional reference.
18 2 Figure 1.1. Schematic diagram of the early prototype Tissue Modulator used to obtain glucose measurements. 1 In the Chaiken lab published another small clinical study showing noninvasive blood glucose results compared to the FDA-approved HemoCue. 7,8,9 While the data showed glucose levels could be measured with accuracy and precision commensurate with the HemoCue at low glucose levels (e.g. <129 mg/dl) paradoxically it was not adequate at higher glucose levels. This study provided optimism for eventually producing accuracy and precision with a noninvasive in vivo measurement of blood glucose; however, there remained issues preventing further accuracy. Two of the more pressing issues were 1) the then current enabling technologies and 2) the existing understanding of physiological effects on in vivo measurements.
19 3 The onset of the project in 1997 followed a time of improvement of the enabling technologies for Raman spectroscopy. 10,11 At the time, advancements made these types of experiments possible whereas they were impractical before. With the pace of technological advancement, there are now enabling technologies far surpassing those at the start of the project. 12,13 Specifically, significant advances have been made in lasers, filters and detectors. Continuous wave lasers in the physiological window are smaller, more efficient, and easier to couple to measurements either by free space or fiber. Pulsed lasers with higher peak power and sufficiently high repetition rates are now available that will allow temporal filtering to produce much higher signal to noise ratios than before. The increasingly advanced technology is paving the way for noninvasive in vivo blood glucose monitoring in the near future. One of the most difficult factors to account for with in vivo measurements can be generalized as human factors (HF s) and issues relating to physiological factors. HF s encompasses many different factors that we understand and some yet to be uncovered. One human factor involves the human-machine interface and it relates to the positioning of the laser on the skin, the pressure of the finger against the aperture needed to ensure stable physical placement, and the effect of that pressure on the perfusion and composition of blood in the region probed by the laser light. Figure 1.2 shows a finger pressed against the position-detection pressure monitor (PDPM) 14,15 which monitored the positioning and pressure of a finger in the instrument in laser prototypes. A person simply cannot sit motionless on an arbitrary spatial or temporal scale, regardless of motivation, necessitating the PDPM to account for movement and pressure during the measurement

20 4 process in order to facilitate, inter alia, automatic selection of the most reliable data for processing to a glucose measurement. Figure 1.2. The PDPM system measures both the position and contact area of the fingertip along with the applied pressure. 14 The effect of positional variation on the information content of skin spectra also arises from near infrared (NIR) fluorescence in both static tissue and blood. Investigation has demonstrated that at incident powers allowed by the IRB, the fluorescence from skin is initially not constant over the first several minutes indicating that something is happening to the fluorophores in the irradiated volume on the molecular level. 16,17 Not all contributing molecules to this signal are known but several major contributors have been documented. 17 The fluorescence signal is degraded by the NIR source and will decrease for about the first five minutes, which we call photobleaching. It was also demonstrated that the rate of decay is commensurate with the laser power. With flowing blood, there is constantly new unbleached blood passing through the focus. However, we observe that once a spot is bleached the fluorescence becomes consistent, demonstrating the majority of bleaching to be from the static tissue. When the
21 5 focus of the laser moves across the finger, there is a new period of bleaching for the unbleached area. We have established by direct observation that once a spot has been bleached, it remains bleached for at least 45 minutes then eventually fades with all contrast gone 24 hours later. Pressure of the finger against the aperture is an issue for both too much pressure and not enough pressure. Calibration of glucose concentration depended on measurements of a finger both pressed and unpressed where the unpressed had a normal blood flow and pressing a finger would evacuate blood from the region providing a blank. It was hypothesized in the small clinical trial that most of the outlying data points corresponded to either insufficient or excess pressure. These types of human factors are intrinsic to in vivo measurements and must be accounted for if well-defined measurement processes and machine executable algorithms are to be designed. The other challenge to obtaining acceptable noninvasive glucose measurements involves achieving a better understanding of physiological effects on in vivo measurements in at least two ways. First, the tissue modulation algorithm involves moving blood, in particular red blood cells (RBC s) during a measurement cycle that causes the cloudiness, i.e. the turbidity of the probed volume to change. An improved treatment of the effect of light propagation in turbid media on making quantitative measurements is required and will be described in this thesis. Also, the movement of glucose between the intravascular space and the interstitial volume complicates measurements in a completely different manner but that will not be within the scope of this thesis.
22 6 To perform quantitative spectroscopic measurements in turbid media, using a completely new algorithm that could also be used in glucose monitoring, in Chaiken and Goodisman published a new algorithm for monitoring Hematocrit (Hct). Hct is defined as the volume fraction of RBC s expressed as a percentage of the total blood volume that includes only RBC s and plasma. The Hct and plasma volume are calculated by simultaneous measurement of both elastic emission (EE), which includes all Rayleigh and Mie scattering, and inelastic emission (IE), a combination of both fluorescence and Raman scattering. The plasma volume obtained using this algorithm is corrected for the turbidity caused mostly by the RBC s and so when combined with a glucose signal from plasma constitutes an improvement over our earlier approach for measuring glucose. But, in its own right, we note that the leading preventable cause of death, worldwide, civilian or military, for all people ages is undetected internal hemorrhage for which Hct, if measurable with sufficient precision, accuracy and sensitivity, may be an early indicator. 19,20,21 Thus, not only is the Hct measurement an important medical technology to be used for noninvasive glucose monitoring, but it could also be used clinically for the Hct and intravascular plasma volume measurements themselves. These are highly regulated quantities that could form the basis for at least one new vital sign and enable improved diagnosis and treatment of a variety of medical conditions History of Hematocrit Measurements The term Hematocrit traces back to 1891 when German scientist S. G. Hedin used a hand-crank device to spin blood and thereby pack RBC s into the bottom of a tube. 22,23
23 7 Variations of this method are being used today with a centrifuge, but the concept remains the same where the Hematocrit is determined as the height of the RBC s in the tube divided by the total height of the blood. Hct measurement can be used as a vital sign where deviations from normal can indicate health issues. The normal ranges of Hct or packed cell volume (PCV) fraction depend on the size of the blood vessel from which the blood in question was sampled. In large vessels the Hct is for a Caucasian man and for a Caucasian woman. 24 On the other hand, smaller vessels such as the capillaries are thought to contain blood with an Hct of around 0.15 although accurate measurement of Hct in the capillaries remains elusive because a finger stick will puncture larger vessels beneath the capillaries. Photoplethysmography 25 involves the use of light absorption to monitor the presence of blood in a volume of tissue. In 1970 Victor Twersky described a theory for optical absorption measurements in a solution composed of scattering particles suspended in an absorbing medium that was applied to measurements of whole blood and cell cultures. 26 The turbidity correction proposed by Twersky is used in oximetry and hemoglobinometry both of which require two wavelengths, one being the isosbestic point for the oxy-deoxy hemoglobin binary equilibrium at 805 nm and other wavelengths. 27 Hemoglobinometry requires that a second wavelength be employed that is both sensitive and selective to water absorption in the intravascular space. Unfortunately the NIR water absorption spectrum is overlapped with broad protein, carbohydrate and lipid-based absorptions, and the absorption by interstitial water is not differentiated from intravascular water. Searching for wavelength combinations is hampered further by the need to overlap the two wavelengths in space because very
24 8 different scattering coefficients can result as the wavelength difference increases. Finally, the Twersky algorithm assumes a direct and constant relationship between the Hct and total hemoglobin concentration (Hgb) and it is not necessarily constant in time and it is certainly not constant across patients. One of the underlying issues with older classical types of measurements is the need to remove blood for analysis. An instrument called the CRIT-LINE 28 makes the claim of being a noninvasive Hematocrit measurement for dialysis patients, though that claim is somewhat misleading. The claim to be noninvasive holds true only if the patient is attached to a dialysis machine which is itself invasive. The CRIT-LINE attaches to the dialysis machine which is used to clean the blood for patients with renal failure demonstrated in Figure Whole blood is analyzed before entering the dialysis machine through a transparent window of known dimensions and the Hct is calculated based on the Twersky algorithm. This in vitro measurement of blood avoids interferences from the static tissue and keeps the relationship between Hct and Hgb fairly constant over the measurement. While this method of Hct measurement is incredibly useful for dialysis, it is only useful in a system where the blood is removed. Chapter 2 will describe in more detail the measurement process and algorithm to obtain the Hct and the plasma volume (PV) simultaneously noninvasively in vivo.
 measurements without graduate student participation. At the time, Dr. Chaiken and Dr.")
25 9 Figure 1.3. Left: Fresenius (Gambro) dialysis machine, Right: In-line spectral cell showing probing light Scope and Layout for the Dissertation When I joined the Chaiken lab at the end of 2012, Dr. Bin Deng was performing post-doctoral work on noninvasive in vivo plasma volume and Hematocrit (PVH) measurements without graduate student participation. At the time, Dr. Chaiken and Dr. Deng were set up for both animal studies on Sprague Dawley rats and human studies on dialysis patients in collaboration with Dr. Sriram Narsipur of the Upstate Medical University. I was immediately introduced to all Hct projects while learning on the job. The dialysis study was nearly complete when I joined but I had significant input on the animal studies. Once Dr. Deng moved on, I took the lead on all Hct related projects along with my development of an in vitro project to validate the PVH algorithm used for Hct calculation. In this thesis the instrument dedicated to in vivo analysis using the PVH algorithm for measured plasma volume and Hematocrit in both rat and human subjects using interchangeable probes will be referred to interchangeably as either the PVH or the LighTouch Medical (LTM) Instrument. The particular prototype currently in use in the
26 10 Chaiken Group also has the capacity to produce Raman spectra as well although it is clear that a stand-alone PVH device could be produced that would be very small, portable, battery powered and possibly even wearable. Unlike the old system where the finger was held against the aperture, the new system includes a finger probe connected by fiber optics much like the ubiquitous finger clip used in pulse oximetry. The existing framework obtained from the published glucose measurement research led to a quick transition toward clinical type studies for PVH. However, having the capacity to measure existing physiological parameters with radically improved accuracy, precision and sensitivity immediately revealed some gaps in our understanding of the same, necessitating more foundational types of studies. Since the amount and type of data produced by the PVH is unprecedented, being able to rationalize the observations in terms of known and relatively well understood or at least accepted facts and principles adds to our confidence that we are actually measuring what we think we are measuring. The constants in the PVH algorithm have been calculated several ways including the use of scattering and absorption coefficients but the latest calibration was obtained from a study on dialysis patients. Data collected at the dialysis center included nine patients over several months and was published 27 with a comparison to the FDAapproved CRIT-LINE measurements. This provided a calibration of the PVH based device that has been used ever since. The LighTouch device showed comparable Hct values with the added information of plasma volume while making a truly noninvasive measurement. While the measurements proved encouraging, a motion defect caused by a mismatch in fiber optics causes large shifts in the signal when the patient moves.
27 11 Experiments at the dialysis center were ideal because of large shifts in the Hct with a known cause in a human subject. The function of dialysis serves to clean blood of patients with renal failure. The blood is pumped out of the body and contacted to a dialyzing solution across a semipermeable membrane which allows flow of waste products out of the blood and into the dialyzing solution before being pumped back into the body. The dialyzing solution is a glucose solution that gives an added benefit for us to also observe changes in the glucose Raman features. The removal of fluid always causes the Hct to increase during the course of dialysis although the amount depends on the rate of fluid removal and the rate of back-filling of fluid from the interstitial space into the intravascular space. The background and theory along with the calculation of the algorithm are presented in Chapter 2. One of the most foundational studies that can be done with a medical device is to define what constitutes a normal baseline. The investigation of a baseline has taken the shape of the subject sitting or lying still and being silent, e.g. not even speaking for up to two hours at a time. Observations can be made about the tendency for drift with a filling bladder or different fluctuations appearing due to changes in breathing patterns while sleeping. The LighTouch was calibrated using the FDA-approved CRIT-LINE and it is interesting to combine LighTouch measurements with established physiological parameters (e.g. volume and mass of urine if subject urinates immediately before and after baseline measurement to search for internal consistency). All of these types of observations are essential to establish normal behavior as precisely as possible and thereby to prevent false diagnoses and to enable more effective treatment using the device.
28 12 With a probe attached to the finger, a person has the capacity for movement and that movement can cause shifts in the Hct due to orthostatic redistribution of blood. For instance, when a person moves in a way that flexes the abdominal muscles, as in the wellknown Valsalva maneuver (VM) 29,30, the venous return via femoral vein to the heart is impeded because the diaphragm muscles expand. This restricts the movement of RBC s differently than the plasma motion showing a temporary decrease in Hct near the time and place of the contraction, which is before the blood enters the heart. How this scenario plays out in the subsequent cardiac output is mostly known in terms of heart rate and blood pressure, as this is a well-defined medical protocol that is used in assessment of cardiac performance. The PVH also measures pulse rate as well as Hct and plasma volume in real time. A portion of the work presented here documents and attempts to rationalize the response of the PVH to such physiological stimuli as further validation of the algorithm. As internal stimuli can cause fluctuations, so can external stimuli. The importance of an applied pressure at the measurement site was addressed with the PDPM on the old system but the new system employs Velcro to attach the probe to the finger at constant pressure. A final product is more likely to have a clip for the finger, also at constant pressure, but the prototype can show results indicating when the pressure is not optimal. If the measurements themselves can be interpreted to indicate when the probe pressure is not appropriate then systems can be designed to automatically correct measurements under such conditions. Chapter 3 will investigate what constitutes normal and induce both internal and external stimuli to observe changes. A portion of this chapter is reproduced from work that was published. 31
29 13 In conjunction with the dialysis studies from Chapter 2, a rat model was also investigated. The palm of a rat paw shows similarities to the human finger (e.g. ridged skin which led to a probe specifically designed for use in rat studies). A portion of the rat studies corresponding to Hct changes from fluid removal and replacement experiments was published 32 in concurrence with the dialysis study. The use of a rat model allows for experiments that remove relatively large portions of blood followed by fluid replacements that would not be as viable an option in early human studies. These studies are essential to show the changing Hct as an indication to blood loss from the system. The data and analysis for rat studies are presented in Chapter 4, which has been partially reproduced from the published work. 32 While the algorithm used for both the rat and human studies appears to behave as anticipated, it is also important to verify by an in vitro model the validity of the algorithm. Furthermore the algorithm provides a solution to a common and general problem, spectroscopic monitoring of solute concentration in slight but variably turbid solutions. A model system was designed in a cuvette containing quartz spheres as a scattering particle commensurate with the size of a red blood cell and solubilized porphyrin to model the fluorescence of the plasma. Due to the high density of quartz spheres, the background solution was a cesium chloride (CsCl) solution adjusted to a density of 1.42 g/ml after filtration, which kept the quartz suspended sufficiently long for a homogeneous measurement. The small but measurable background fluorescence from the CsCl modeled the constant background from the static tissue. A two dimensional calibration curve or training set was comprised of six concentrations of both quartz and porphyrin with all combinations for 36 samples.
30 14 Having two changing concentrations and two measured values, EE and IE, made for a simple bilinear fit contingent on concentrations comprising a linear range in both measured values. This algorithm for blood analysis takes the same form where, by pure good fortune, the RBC s and plasma happen to be linearly correlated to EE and IE at the normal concentrations observed in the fingertips. This model system established well-defined linear relationships for analyzing samples within the concentration ranges. The algorithm was utilized in modeling the settling of the quartz spheres over time, which was similar in shape to sedimentation curves. Experimental analysis of the settling was fit using computational modeling giving credence to the algorithm. The utility of a model system is to control or measure as many factors as possible for the testing of the algorithm since that gives confidence to the ability of the algorithm to perform in the noninvasive in vivo setting, in which the characteristics of the living medium cannot be manipulated with complete impunity. This work was published 33 and is reproduced in Chapter 5. After modeling the algorithm in a well-defined system, we ventured into analyzing the blood in vitro. Initially the blood came from rat study experiments to maximize results obtained from procedures performed on the rats. The blood collected would be centrifuged and separated by pulling out the pure plasma then washing the RBC s with phosphate buffered saline (PBS). The studies started on the same instrument as the quartz and porphyrin in vitro system at 785 nm but the scattering and fluorescent signal from the RBC s dominated the signal at that wavelength. Linear ranges were established independently for both plasma and RBC s and both were well behaved separately. When the algorithm was applied to a training set, similar to the model system
31 15 from Chapter 5, there was a good fit of the data with slopes near 1 and intercepts near zero. Overall, blood is a difficult solution to handle in vitro. The RBC s are somewhat delicate such that an abrasive handling can cause them to burst, which makes homogenizing a solution difficult. The RBC s also tend to cluster together or stick to the walls of the container, which affects the scattering of the light and observed concentration. The samples were diluted into a linear range but difficulties persisted. At 785 nm excitation the scattering from the RBC s dominates over the plasma making the sampling difficulties stand out. Also, the linear range for RBC s at 785 nm was slightly below the normal physiological range ( v/v) due to the greater scattering coefficient. Therefore, it was determined that a different wavelength, 830 nm which is used in vivo, may give a better balance between signals from RBC s and plasma and be more directly comparable to the in vivo measurements. The studies on the 785 nm system deliver the laser to the top of the cuvette through a hole in a mirror and collects the backscattered light from the mirror. The same orientation was used for the 830 nm system in the previous experiments so that only the wavelength was changed. Experiments on each component of the blood separately to find linear ranges revealed that both the RBC s and plasma were linear above the normal physiological range in both EE and IE. However, when mixed for a training set the IE was not as stable for sufficient linearity as opposed to the EE which was sufficiently linear. We hypothesize that a larger volume fraction of RBC s compared to the 785 nm study may be causing multiply scattered photons from the side walls of the cuvette to cause variability in the fluorescence.
32 16 Having multiple probes for the 830 nm system allowed for the arrangement where the laser was delivered through the top of the cuvette and the signal was collected through the side of the cuvette at a 90 degree angle. The probes were aligned such that the focus of each probe was overlapping in space. In this orientation both the EE and IE decreased as either plasma or RBC s were added to the solution giving evidence that the turbidity significantly decreased the amount of light reaching the focus of the light collection system. The path length through the blood solution in the cuvette is long (~1 cm) compared to the diameter of the capillaries (~10 µm), a factor of 100, making this in vitro approach much more susceptible to multiple scattering effects. Despite the greater path length through the RBC s in vitro there is still linearity in volume fractions greater than the physiological ranges observed by the in vivo measurements. The in vitro blood trials showed that linear relationships exist for both RBC s and plasma at volume fractions relevant to in vivo measurements considering changes in path length. However, blood turns out to be difficult to homogenize and keep consistent throughout in vitro experiments. Although attempts to replicate the in vitro model experiments employing the components of whole blood was unsuccessful at 830 nm, the individual components demonstrated linearity at physiologically relevant volume fractions which fulfils the basic requirement for the algorithm to be applicable to that system. Experiments comprised of in vitro blood are described in Chapter 6. Combining results from both in vivo and in vitro experiments facilitates a broader understanding of the data collected. Experiments in vivo characterized normal Hematocrit changes in human patients along with known changing Hct in the dialysis center. A rat model verified results obtained from the dialysis studies and provided a
33 17 broader range of possible experiments. Modeling the algorithm with a well-defined system provides confidence in the ability of the algorithm to measure small changes and in vitro blood experiments show signal linearity in relevant volume fraction ranges Hypotheses Investigated i) Hematocrit acts as a vital sign with only relatively small measurable changes over time due to physiological effects. The Hct monitoring can also be used to measure other vital signs such as the pulse rate and breathing rate for comparison. ii) Changes in Hct due to loss of blood are measurable and significantly different from normal physiological changes. iii) The PVH algorithm, used to calculate the Hematocrit in vivo, applied to a model system in vitro demonstrates the ability to accurately calculate changing concentrations of a two-phase optically thin system. iv) Physiologically relevant volume fractions of blood components show linearity with respect to both EE and IE.
34 18 2. Background and Theory 2.1. Measuring EE and IE in vivo For the purpose of presenting the PVH algorithm, we take the skin as being composed of three phases 15,18,21,34, static tissue that deforms when mechanical stress is applied, and blood that is itself composed of 2 phases: red blood cells and plasma that both move when mechanical stress is applied. The distribution of scattering centers and fluorophores is considered spatially homogeneous, the specific nature of the cells comprising the static tissue is considered irrelevant, and the scattering contribution of the RBCs is dominant. There is a region beginning from the outermost skin surface, called the stratum corneum and extending to beneath the surface a certain depth where there is capillary blood, interstitial fluid and tissues that are viable, shown in Figure 2.1. Incident NIR light that penetrates to just below the specific depth where the tissues begin to have capillaries and are viable makes only a small relative contribution to the net amount of light remitted from the exact same surface location as the incident light. Therefore the remitted light has sampled dead tissues on the surface and viable tissues containing only capillaries working with human volar side fingertip ridged skin and NIR incident laser light at, for example, 830 nm. Given the scattering and absorption coefficients from published values 35,36 measured in vitro shown in Table 2.1, the propagation of remitted light generated as described occurs in the single scattering limit.
 scattering coefficient (cm -1 ) r=rbc 4.5 300 p=plasma 0.3 0.")
 despite the presence of the strongly scattering RBC s. Note that the")
35 19 Figure 2.1. Schematic of laser penetration during in vivo blood measurements showing the majority of collected photons as singly-scattered. Table 2.1. Absorption and scattering coefficients for the three phases comprising skin from in vitro measurements. phase absorption coefficient (cm -1 ) scattering coefficient (cm -1 ) r=rbc p=plasma t=static tissue 5 12 Since the volume percent occupied by blood 37 in relatively well perfused fingertip skin i.e.3-5% of the total is still quite small, the skin in that region should be considered optically thin (i.e. the average photon passes through the medium without an absorption or scattering event) despite the presence of the strongly scattering RBC s. Note that the

36 20 Hct of capillary blood 38 is much smaller than in blood sampled from any larger vessels, for example 10%-30% is a realistic full range for capillary blood. It is easy to estimate a volume percent or concentration range over which the production of fluorescence is linear in fluorophore concentration. The production of fluorescence has long been known to be linear in concentration in optically thin materials 39 and we expect the production of Raman scattered light to be the same in that respect. When one actually probes fingertip skin 14 with NIR laser light a typical spectrum of the remitted light is given in Figure 2.2. There is always light of the same wavelength as the incident light and light shifted to longer wavelengths. We refer to the unshifted light as being elastic emission (EE) and the wavelength shifted light as being inelastic emission (IE). We note that there is obviously Raman scattered light in addition to fluorescence but we shall use the entire IE as indicated in Figure 2.2 without trying to resolve them. Figure 2.2. Intensity versus frequency from a typical 20 ms frame of Andor charge coupled device (CCD). The sections used to calculate the IE ( cm -1 ) and the EE (-30 to +10 cm -1 ) are shown. The low shift integration limit for the IE is chosen to ensure that no EE is included in the IE.
37 21 First we note that a number of arbitrary baseline correction algorithms exist in the biomedical Raman literature 40,41 but there really is no actual knowledge about how to separate the Raman from the fluorescence. A recent advance in baseline subtraction of the fluorescence from biological samples works based on Kasha s rule 42, stating that fluorescence emission is essentially constant for small changes in excitation wavelength while the Raman signal changes according to the excitation wavelength. 43 After some processing of the signals, this gives a difference spectrum which essentially removes the fluorescence background. For purposes of applying the PVH algorithm, we assume that the EE and IE can be used exactly as shown in Figure 2.2 and note that for all practical purposes, e.g. stand-alone PVH devices, obtaining the EE and IE as shown could be easily accomplished with one wavelength, filters and single channel detectors, forgoing any need for CCD cameras and spectrographs. At any given Raman shift there is fluorescence and Raman emission representative of the constituents present in the probed volume of tissue. Direct observation of Figure 2.2 shows that Raman scattered emission is a small contribution to the total IE. Nevertheless, to the extent either the fluorescence or Raman changes in the course of time, the algorithm will produce an apparent plasma volume change or apparent Hct change. The photobleaching of the tissue autofluorescence by the probing laser itself causes changes in the apparent Hct and plasma volume whether the EE changes or not. Implicitly corrected for the turbidity, the apparent Hct and plasma volume represents a very sensitive and quantitative probe of chemical changes in the probed volume.
38 22 There is actually significant latitude in what raw measurement can serve as IE for this algorithm. In vitro validation of this algorithm with, for example, quartz spheres suspended in a fluorescent or Raman active fluid show that simple fluorescence or even a Raman signal corresponding to a single constituent can be used as the IE so long as the other assumptions in the model are satisfied. Using the IE as a measure of the overall chemical composition of a probed tissue volume is reasonable as long as the physical processes that generate the IE are mathematically independent of the processes that determine the strength of the EE. This ensures that the equations below can be inverted and we show specific data concerning the effect of photobleaching below. The EE is determined completely by the absorption loss experienced by the incident light and the physical scattering characteristics of the materials in the probed volume. The absorption loss is disconnected from the IE because the fluorescence quantum yield is independent of the absorption and scattering coefficients. Thus the EE is much more connected with all the physical processes that determine where and how light propagates in the tissues but less with how IE is produced Theoretical Model and PVH Algorithm In order to model the propagation of light in the probed volume using the radiation transfer equation 34,44 (RTE) in the single scattering limit, we assume that the tissues are spatially homogeneous and that there are no voids. Moreover, when we apply external mechanical pressure to the tissue, or if the heart beats, sending a pressure wave throughout the intravascular volume, the blood moves but no voids are developed. These
39 23 assumptions can be summarized by the following equations as well as the definition of Hct. 1 = φ r + φ p + φ s (no voids) [2.1] 0 = dφ r + dφ p + dφ s (zero sum game) [2.2] Hct = φ r (φr + φ p ) (definition) [2.3] where, ϕr, ϕp and ϕs denote the volume fractions of RBC s, plasma and static tissue respectively. We previously published comparisons using this model to spatial scans of skin 34 easily reproducing the measurements and suggesting that the model would also be accurate if we modeled temporal changes at one location over time (e.g. cardiac pulse, external mechanical pressure or Valsalva maneuver). Using the RTE in the single scattering limit, and as is known to be true for quantitative fluorescence measurements 39 in optically thin samples, the EE and IE are given by the bilinear forms. EE = θ 1 + θ 2 φ p + θ 3 φ r [2.4] IE = θ 4 + θ 5 φ p + θ 6 φ r [2.5] We thus have 2 independent equations in 2 unknowns and 2 quantities that we measure (e.g. EE and IE). If the equations are independent they can be inverted to allow calculation of the plasma volume fraction and the RBC volume fraction and by closure the Hct and the static tissue volume fraction. φ r = a + b ( EE EE 0 ) + c ( IE IE 0 ) [2.6] φ p = d + e ( EE EE 0 ) + f ( IE IE 0 ) [2.7] We have inverted equations 2.4 and 2.5 and expressed the result in the form of equations 2.6 and 2.7 because our immediate medical goal is best served with monitoring
40 24 changes in plasma volume and Hct since such changes are the indicators of deviations from homeostasis. Given the success of the CRIT-LINE, being able to monitor even relative changes noninvasively and in vivo for all patients is a worthwhile goal and possibly is less affected by calibration issues across individuals as would be the case for absolute Hct. With regard to absolute Hct, the quantities EE0 and IE0 are the average values of EE and IE and in practice these can be measured at the outset of a monitoring session, compared to the CRIT-LINE which calculates plasma volume from the initial Hct reading of a session, and then all subsequent changes are relative to the patient s own previous state. They can also be a single set of values obtained by averaging the measured EE0 and IE0 values of a large number of people and this leads to calibration across individuals and possibly the capacity to monitor absolute Hct. Note that the parameters a-f contain absorption coefficients and quantum yields and if changes occur (e.g. oxygenation of the RBC s) the background absorption and quantum yields for emission can be affected. In that case the PVH device will respond to changes in oxygenation of the RBC s. Presently we are only concerned with relative changes and we have published 25,45 at least 3 different approaches to calibration: finding the appropriate values of the parameters a-f including from numerical modeling and the in vitro measured absorption and scattering coefficients of plasma, RBC s and skin tissue. Minimally since we have 6 parameters (e.g. a-f), we need a set of six pairs of EE and IE to pair with specific plasma volume and RBC volumes, in order to assign the values for parameters a-f. Note that using Equation 2.3 we calculate the individual plasma and RBC volumes from the Hct
, the relative")
41 25 and plasma volume given by the CRIT-LINE. Having more measured data pair sets can give more precise estimates of the optimal values for the parameters Calibration of the algorithm During a dialysis session monitored by the CRIT-LINE, there is real-time output showing the Hct with the associated Hgb, the oxygen saturation (SpO2), the relative accumulated %Δ of plasma volume since the beginning of the session and the elapsed time, shown in Figure 2.3. Digital output obtained from the CRIT-LINE produced a 20 second time series for direct comparison. The PVH algorithm calculates the RBC volume and plasma volume separately to calculate the Hct as opposed to the CRIT-LINE which calculates the Hct directly under the assumption that the total volume of blood is constant in the probed volume (which is true for the in vitro cell). The CRIT-LINE uses another algorithm 46 to calculate the accumulated change in plasma volume. Figure 2.3. Real time output of the CRIT-LINE. 27 Dialysis sessions were conducted with simultaneous measurements by both the CRIT-LINE and the LighTough instrument. The CRIT-LINE produced data for both Hct and relative plasma volume averaged over 20 seconds while the LighTouch produced both EE and IE every 3 seconds. Data from both instruments were averaged over the
42 CritLine Hct% 26 same timescale for comparison, shown in Figure 2.4. A bilinear regression for both the Hct and plasma volume on both EE and IE gave the parameters, a, b and c for Hct and d, e and f for the plasma volume. These parameters a-f obtained from comparison to the CRIT-LINE were used for all subsequent studies for both human and animal subjects with consistent results LTM Hct CritLine Hct LTM Hct Linear Regression Y = A + B * X Parameter Value Error A B R SD N P < data point (time) Figure 2.4. Training set used to obtain parameters a-f for use in all subsequent experiments including rats. 27 The correlation between the Hct measured independently by the CRIT-LINE and the LighTouch instrument is quite good (r 2 =0.95, p<0.0001, N=18). Plasma volume is only indirectly calculated by the CRIT-LINE from the Hct as opposed to the LighTouch which calculates the plasma volume separately from the Hct. Despite there being nothing constraining the raw data to produce agreement in this new algorithm, there is nonetheless a correlation between the calculated Hct and plasma volume. To demonstrate the reproducibility between experiments, Figure 2.5 shows the Hct calculated by both the CRIT-LINE and LighTouch on a different patient obtained weeks later. Hct calculated by
43 27 the new algorithm used the a-f calculated from Figure 2.3 and the zeros, EE0 and IE0, obtained from the beginning of the experiment LTM Critline Hct seconds Figure sec per data point from both the CRIT-LINE and the new algorithm. 27 There are several factors at play but overall the general trend is conserved. First, the displacement of about 1-2 Hct units is due to the parameters a-f constraining the Hct to start at for the LighTouch. Differences in skin tones between patients would present different levels of melanin and intrinsic NIR fluorescence which affects the IE. Presently we are more concerned with observing changes than calculating the absolute Hct though the present accuracy may be sufficient for many purposes. Second, the first 600 seconds show a more rapid change in the Hct for the LighTouch than for the CRIT- LINE. There is photobleaching of the autofluorescence in vivo that is avoided by the in vitro approach of the CRIT-LINE. To demonstrate that the data after the photobleaching tracks with the CRIT-LINE, the data is plotted differently in Figure 2.6. Separating the data into during and after photobleaching demonstrates a good linear correlation overall.


44 28 Figure 2.6. Same data from Figure 2.5 plotted to show correlation between two sets of measurements with a single set of zeros and a single set of a-f parameters previously obtained from a different patient. 27 The black line from Figure 2.6 corresponds to the overall level of noise and sensitivity after the bleaching is completed. The trend and total change in Hct, after bleaching, between the CRIT-LINE and LighTouch tracked well in Figure 2.5 so an r 2 of 0.56 demonstrates variability from factors other than changes in the Hct. If the precision and accuracy of the CRIT-LINE are ignored, this data gives a signal to noise of about 1 with an upper-bound of about 0.5 Hct units for the noise. This performance of the LighTouch out measures the conventional invasive Hct procedures 47 and at least matches the performance of the FDA-approved CRIT-LINE. A single set of parameters obtained in this manner has been in use in the PVH for nearly 3 years.
45 29 3. Normal Physiological Responses 3.1. Importance and Motivation The movement of water and water borne materials within and between the vascular system and other compartments within the body is a fundamental requirement for homeostasis 45 requiring constant physiological regulation. The precise, real time continuous quantitation of these variables has proven difficult to achieve. Current technologies 25 obtain signals from red blood cells and water that cannot be distinguished as intra or extra vascular fluid, and their movements and overall disposition follow the movement of the plasma, a variable essentially unobservable noninvasively until recently. 15 The observation in real time of unusual compartment shifts, for example, could provide early indications of internal bleeding, simple dehydration, electrolyte imbalance, kidney failure, physical exhaustion, cardiac dysfunction and other serious acute and chronic conditions that allow medical professionals to provide timely interventions. 20 In pediatric practice in which the sampling of fluids and tissues is particularly problematic, patients with chronic renal failure, cyanotic congenital heart disease and hematologic disorders would immediately benefit from our device. Undetected internal bleeding nearly always results in death that almost always can be successfully treated if the bleeding can be detected and located in time, or within the Golden Hour. 19 Noninvasive hemoglobinometry, oximetry and Hematocrit measurement has its roots in the work of Victor Twersky 26 who showed how to deal with the combined absorption and scattering of blood and other living tissues in closed form equations. The efficacy and validity of Twersky s treatment is evident not only in the decades-long
46 30 utility of the pulse oximeter in medicine but also in the success of devices that analyze blood outside the human body. 31,46 The use of hemoglobinometry to check for internal bleeding and other conditions is commonplace but there appears to be room for significant improvement 48 with more than one factor contributing to this situation. First, hemoglobin concentration (Hgb in grams/decileter) is more a measure of oxygen transport capacity and Hematocrit (Hct as a unitless fraction) is more a measure of blood viscosity. The same net Hgb could be consistent with larger or smaller RBC s each with different hemoglobin content per RBC 49. Thus the physiological implications of changes in either parameter may be subtly different. Second, in developing his algorithms Twersky assumed a constant relationship between Hct and Hgb (Hgb=35*Hct) and so the same data 50,51 can be used to calculate either Hgb or Hct noninvasively with the result being that neither parameter is exactly what it is supposed to be. But perhaps the most important shortcoming may be that while the raw data that goes into Twersky s algorithm attempts to assess the presence of water (e.g. plasma in a manner that allows for quantitative comparison of hemoglobin content to water content), the absorption spectroscopy of intravascular water is indistinguishable with that of extravascular water. Thus the Twersky approach can be quite useful for some applications, such as spot-checking for anemia because the achievable absolute error for Hct or Hgb is roughly 8-9%. But it is less useful for dynamic physiological responses to perturbations that cause fast and large shifts in fluid content within and across compartments. The plasma increasingly maintains the intravascular pressure as the vessel size decreases and the motion of the plasma always precedes the motion of the formed
47 31 parts i.e. the RBC s. RBC s therefore do not track the movement of the plasma exactly and the presence of RBC s does not guarantee the presence of intravascular water (plasma). Absorption spectroscopy itself has shortcomings compared to other approaches for obtaining subsurface spectroscopic signals for use in noninvasive medical devices. By necessity, absorption spectroscopy involves measuring small changes on a large background of incident light and this entails a lower signal to noise than measuring fluorescence or even Raman scattered light, which are both background free measurements. It is an empirical fact that all biological tissues emit fluorescence when irradiated with NIR laser light and that this fluorescence bleaches (in other words decreases exponentially over time with continued irradiation). Furthermore Raman scattered light is superimposed on this autofluorescence and separating the two is at best problematic. At FDA allowed incident light power levels, spot sizes of 10 2 µm in diameter and any wavelength 785 nm or longer, bleaching of perfused skin is complete within 10 minutes and then is stable afterwards for an apparently indefinite time. The source of the autofluorescence is at once from many sources and from no particular single source. Hemoglobin and other porphyrin containing materials are one obvious generic source but there are undoubtedly others and not being able to focus on a single source frustrates attempts to formulate countermeasures. Our particular interest in biomedical spectroscopy originated 1 in trying to achieve noninvasive blood glucose monitoring by NIR Raman spectroscopy. We have long argued that the tissue modulated autofluorescence is a viable measure of blood volume in the probed volume of tissue. By tissue modulated we indicate that using various external perturbations (e.g. applied
48 32 pressure and temperature changes) to intentionally vary the perfusion and therefore fluorescence of the probed volume. Indeed, blood moves under the influence of external pressure but the surrounding static tissues simply deform. By subtraction we deduce a blood volume to associate with the Raman signals from specific analyte molecules to calculate their blood concentrations. The issue of photobleaching is particularly important because if the amount of fluorescence per unit volume of blood is not constant then using emission to quantify blood volume will be dependent on the individual and may not stay constant for the same individual over time. Moreover quantitative monitoring (other than the rate of decay of the emission itself) is impossible during the bleaching period since the volumetric relationship is changing. However, experiments 16 show that the residence time of blood in the probed and therefore bleached volume is small and so the volumetric relationship between emission and blood is always maintained, while that involving the static tissues surrounding the blood is not, until after the bleaching period. More importantly, we know that after the bleaching period, the fluorescence of plasma is a larger proportion of the total than before. Since the bleaching involves the static tissue, and the blood is constantly replenished, by emission spectroscopy the water in the tissue may be distinguishable from the water in the plasma, unlike in the use of absorption spectroscopy. If the blood were slowly bleached the long term baselines would all have a negative slope as more and more bleached blood would accumulate in the intravascular space, which is not observed, so we conclude that whatever bleaching occurs in the blood is much less than what occurs in the static tissue.
49 33 Although the autofluorescence enjoys a good possibility for being a volume surrogate, the propagation of incident and generated light in the probed volume complicates scattering and it is not possible to tissue modulate a given volume of tissue without moving the RBC s and altering the propagation of light into and out of the probed volume. By examination of the relative content of the gross phases present in tissue (for example the static tissue, RBC s and plasma), and the elastic scattering coefficients of each, and then choosing excitation and remitted light collection geometry carefully, it is possible to ensure that the probed volume is effectively optically thin. In this case most if not all of the light collected is produced by single scattering interactions and this allows for a simple algorithm to simultaneously account for the mild but variable turbidity of the probed volume while quantifying the various kinds of emission. We have validated this approach in a model in vitro system 33 in Chapter 7 below and termed the approach binary spectronephelometry (BSN). Our previous experiments with dialysis patients demonstrated the need to understand baseline physiological regulation processes manifested by plasma volume and Hematocrit. A routine dialysis session typically requires 3-4 hours during which the patient must be stationary. Humans are not closed physical systems with heat and water being continuously lost to the surroundings so the stability of vital signs indicate that these processes are indeed occurring. Under dialysis the Hct increases steadily as indicated by the CRIT-LINE and we anticipate the same under normal conditions with healthy subjects. Insensible perspiration and normal kidney function continuously regulating blood composition causes the net intravascular water content of a test subject to decrease albeit at a much smaller rate than under dialysis. Experiments of fluid
50 34 removal and replacement in a rat model 31 show consistent results but in this case the simultaneous variation of probe pressure and blood pressure due to anesthesia make such observations more difficult to quantify with our present ancillary instrumentation. Our earliest human experiments involved the Valsalva maneuver and tourniquets and also produced consistent, if small, effects. Therefore to show unequivocally that BSN directly monitors and successfully processes signals from plasma itself, we sought in this study to execute procedures that more clearly separate the movement of RBC s from that of plasma Experimental All procedures were conducted with local IRB (SUNY-Upstate Medical University) approval in Syracuse, NY (Appendix A). Photoplethysmography was performed using a Nellcore 200 commercial oximeter and sampling the test point 9 (TP9) or test point 10 (TP10) signals for the plethysmographic response at either 600 or 947 nm. 21 The Nellcore response was sampled using an ADInstruments Powerlab 2/20 and transferred from there to a PC. Note, the results rendered the greater the absorption the less the photocurrent. All other spectroscopic measurements employed a modified commercial Raman spectrometer (Lambda Solutions, Waltham, MA) and a specially designed probe intended to mimic the type of aperture-orifice shown in Figure 1.1. The probe has a rectangular, flat surface containing an aperture with a lens placed near the inside end of the aperture such that when the surface is pressed against the skin and held there using Velcro straps, the light is delivered to the skin extruding into the hole at approximately f=2.0. The delivery and collection is symmetric so the collection is also at
 placed between the collimating lens and the grating")

51 35 f=2.0 with an approximate 150 µm diameter spot size. The rest of the optics and filtering is standard for Lambda Solutions probes but there is an additional Raman notch filter (Semrock, Rochester, NY) placed between the collimating lens and the grating to allow adjustment of the EE and IE for optimum dynamic range. The pictures in Figure 3.1 show how the probe is interfaced to the skin and the hand overall. Since Raman spectra are collected with the unit used in this study, a focused laser was employed but this may be unnecessary for PVH applications. The possibility of a stand-alone PVH-only probe could utilize a clip-type arrangement, as is standard for pulse oximetry which could be adapted for purposes of monitoring at various locations to localize suspected internal hemorrhage or for wearable applications. We have studied the effect of probe pressure on the results and it is important to not strap the probe too tightly as it can restrict blood flow, as will be seen below. In general, as long as the patient finds the probe comfortable and the aperture stationary relative to the skin surface, the pressure is adequate and valid, wherein interpretable results should be expected. Figure 3.1. Two views of the finger probe used in this study. A disposable sheath could be used in addition to alcohol swabbing the probe between uses to insure cleanliness. Tissue is soft matter that extrudes into any hole that may constitute an optical aperture designed to produce reliable mechanical registration between the probe and the tissue to be probed. This leads to systematic short and longer time optical responses that will be discussed below. In addition, we can have blood pressure fluctuations for various reasons, as well as changes in oxygenation. The largest known source of error for this
52 36 probe is systematic. Whenever there is slight movement of the probe aperture with respect to the skin surface, the probing light reaches unbleached skin causing an apparent decrease in the Hematocrit, and then an increase as the skin bleaches 17, typically reaching the same previously established equilibrium bleached level in less than 20 seconds, although more time is required if the amount of previously unbleached skin is commensurate with the original spot size (i.e. there was a large movement of the probe). Test subjects included the PI, graduate and undergraduate students working in the lab. All test subjects understood the experimental procedures and consented to the experiments with the understanding that stopping at any point was acceptable. Data from students was used for their own purposes (e.g. undergraduate research final reports, Research Experience for Undergraduates (REU) posters and similar presentations) in addition to this thesis. Only results from the PI and myself were published in the open literature. Baseline data was collected while the subject lay still for an extended period of time, possibly sleeping. Fluid shifts were induced through raising of the legs or tilting the futon on which the subject reclined Baseline Responses A measurement of changing Hct to diagnose an issue such as internal bleeding necessitates an understanding of what normal baseline behavior is and how to recognize the same in the PVH output. The Hct is regulated by the body and just like other vital signs (e.g. pulse rate, breathing rate, blood pressure and temperature) that exhibit normal fluctuations. Filling of the bladder 52, insensible fluid loss from respiration 53 and evaporation from trans-epidermal diffusion 54 are a few examples of autonomic processes
53 37 that cause a slow increase in Hct over time in a patient. These autonomic processes are not necessarily constant within an individual or across a population of individuals yet normal ranges have been well known for many years. 51,53,54 Measuring healthy individuals over longer periods of time on many occasions can give a sense of how these normal autonomic processes effect the Hct over time. Note that intentional fluid intake orally or otherwise would have the opposite effect as systemic fluid loss. Ten different test subjects were monitored for at least 90 minutes each in a total of 29 experiments to measure the baseline behavior of the Hct over time. Over the course of the experiments, it was discovered that allowing the laser to bleach the skin before starting the collection would improve the dynamic range displayed as shown in Figure 3.2. Equations 2.6 and 2.7 from Chapter 2 showed that the PVH algorithm chooses zeroes as measured EE and IE from the beginning of the data set. When these zeroes are chosen from skin already bleached then the zeroes are a better representation of the subsequently collected data. Seven of the baseline experiments were done without pre-bleaching the skin and 22 of the experiments were done with pre-bleaching before starting the experiment. In order to keep consistency between experiments, the pre-bleaching time was set to ten minutes for each experiment. Figure 3.2 demonstrates the difference between an experiment that had pre-bleaching and one that did not.
54 not pre-bleached pre-bleached 29.6 Hematocrit % Hemocycle Figure 3.2. Measured Hematocrit % over time comparing pre-bleaching to not prebleaching of the finger before starting the experiment. Each hemocycle is 3.3 seconds and contains 150 averaged 0.02 second frames of data. The algorithm is designed such that the starting Hct is always exactly % because we are more interested in changes from homeostasis than in an absolute measurement. It is expected that a healthy patient would have a consistent measured Hct over time. A percentage change taken as the difference between the starting and the ending Hct % across all 29 experiments is 3.41±2.83 %. Taking only the experiments that were pre-bleached gives a % change of 2.83±2.05 %. A different method for calculating the variability over time, the difference between the highest and lowest measured Hct in each experiment, gives 6.72±3.32 % for all experiments. Figure 3.3 demonstrates how these two numbers could be so different as the start and end are not always the lowest and highest points. Nonetheless an average change of less than 7% from the highest to lowest point demonstrates a stable measurement of the Hct over time in a healthy individual.
55 39 Hematocrit % A 4/3 10/14 10/21 10/ Hemocycle Hemocycle Figure 3.3. Hematocrit % over time on four separate occasions for A) subject 1 and B) subject 2. Hematocrit % B 4/2 6/24 6/26 10/15 As a whole, the baseline data demonstrates stability over time and reveals much more information than the standard finger stick method for Hct measurements. Medical professionals tend to take Hct values from a finger stick as ±2 units such that a measured value of 28% would have a range of % for that measurement. Figure 3.3 shows that the experiment with the greatest total change is less than 2 Hematocrit units over 90 minutes and shows details of the smallest physiological increment to about ±0.033 units calculated over all 29 baselines (approximately 8 million frames included). That means the variability from one measurement to the next is 60 times more precise than the finger stick method. We also do better with a continuous real-time measurement and when a small section of data is analyzed, additional information believed to be pulse rate and breathing rate can be seen as in Figure 3.4.
56 Hematocrit (%) Time (sec) Figure 3.4. Typical one minute of Hematocrit % to show repetitions in the signal. Taking a Fourier Transform (FT) of 30 minutes worth of data in Figure 3.4 brings out repeating the units seen in Figure 3.5. The two frequency ranges that emerge are from Hz and Hz. The peak at around 0.23 Hz should correspond to a breathing rate ranging from breaths per minute, which is in the normal range. 55 The peak at around 1 Hz would give a pulse rate of about pulses/minute which is also in the normal range. The 20 second repetitions from Figure 3.4 should be at around 0.05 Hz which is very noisy in Figure 3.5. We believe this repetition to be the sinus arrhythmia (normal range of 3-4 cycles/minute) 56 which only appears when the patient is quiet and resting but not while talking.
57 Power as MSA (%)^2 (1E-6) Frequency (Hz) Figure 3.5. Fourier transform of 30 minutes worth of data from a baseline spectrum. Validating the assignment of the 0.25 Hz peak as the breathing rate is as simple as purposefully changing the breathing rate which is visible in even the raw data shown in Figure 3.6. For the first 100 (5.5 minutes) Hemocycles I kept a normal breathing rate in Figure 3.7A. At 100 Hemocycles I switched my breathing pattern to 5 seconds inhalation and 5 seconds exhalation for a total of 10 seconds per breath lasting for 100 Hemocycles as in Figure 3.7B. At 200 Hemocycles I switched my breathing pattern to 1 second inhalation and 1 second exhalation for a total of 2 seconds per breath lasting for 100 Hemocycles in Figure 3.7C. The breathing time was checked on a watch to keep the pattern consistent.
 0.0000 0.0 0.2 0.4 0.6 0.8 1.0 Frequency (Hz) 0.0000 0.0 0.2 0.4 0.6 0.8 1.0 Frequency (Hz) Figure 3.")
58 42 Figure 3.6. Screenshot of raw Hct data while changing breathing rate. Power as MSA (%)^ A 16 breaths/min 3.76 sec/breath Power as MSA (%)^ B 6 breaths/min 10 sec/breath Power as MSA (%)^ C breaths/min 2.05 sec/breath Frequency (Hz) Frequency (Hz) Frequency (Hz) Figure 3.7. Frequencies of various breathing patterns. A) Normal breathing rate at about 3.75 sec/breath. B) Slow breathing rate at 10.0 sec/breath. C) Fast breathing rate at 2.0 sec/breath. Measuring the plasma volume and Hematocrit noninvasively in vivo reveals a plethora of medically relevant information. Plasma volume could indicate fluid shifts and potentially be an indicator for dehydration or a full bladder especially in monitoring unconscious patients. Hematocrit gives information about the viscosity of the blood and could indicate internal bleeding. Patterns in the plasma volume and Hct can also give additional information such as the pulse rate and breathing rate from a simple FT. With a stable baseline for real time measurements PVH could be a useful tool in many medical situations. To our knowledge, there is no other device that can provide so much big data concerning physiology. The term big data here refers to a measurement of a large volume which can be analyzed for patterns or trends. For each 20 msec frame there
59 43 is a Raman spectrum recorded from which we measure both the EE and IE to calculate RBC volume and plasma volume for the Hct. Trends in the PV and Hct can then be analyzed for the pulse rate and breathing rate to give a larger data set than just one point of data per measurement Pressure Effects The PDPM, discussed in Chapter 1, was developed to give a patient visual feedback about contact and pressure against the probe. While the current model of finger probe was not designed to be used with a PDPM, the pressure of the probe against the finger can have an effect on the measured spectra. When a finger is pressed against the aperture of the probe the skin extrudes into the aperture. If the pressure is not sufficient there is little extrusion into the aperture which may cause the focus of the laser to not converge in the capillaries. Conversely, if the finger exerts excess pressure against the aperture it can impede the flow of blood through the capillaries (i.e. cause occlusion which results in pooling of RBC s at the site of the probe) and a red dot is visible in the skin in the center of the aperture. Human factors is a broad term used to describe how a patient can either purposefully or inadvertently cause errors in the collection of data. Imagine a patient sitting in a chair at the doctor s office with a probe attached to one finger who, without thinking, pushes down on the armrests of the chair to adjust his posture. Pressing against the armrest with the probe would cause a greater pressure against the aperture which could trap RBC s giving a temporary spike in the measured Hct. With this in mind we set out to measure the effect of intentional increases in probe pressure to the measured Hct.


60 44 An experiment was designed where each patient would press on the probe and the opposite side of the finger to increase the pressure of the finger against the aperture of the probe. The patients were asked to start pressing on the probe at 30 Hemocycles and hold until 35 then release. At 60, 90 and 155 Hemocycles the patients were asked to press and hold for 10 Hemocycles each time. The procedure was repeated for each patient on three different fingers to avoid placing the probe on a spot that had been previously bleached or partially bleached. This experiment took place before the procedure of pre-bleaching the skin was implemented so the bleaching can be seen at the beginning of each measurement. Four patients were asked to repeat this procedure on three different fingers, which is shown in Figure 3.8. Figure 3.8. For each Hemocycle (3.3 seconds) the Hematocrit % was measured in each patient. The procedure stated that each patient should be pressing on the probe from 30-35, 60-70, and Hemocycles. Each patient attempted to replicate the procedure on three different fingers.
61 45 The data in Figure 3.8 shows that subjects 2 and 4 were able to consistently increase the measured Hct by pressing on the probe. Subjects 1 and 3 were able to increase the measured Hct only some of the time. The manner in which the pressure is applied may play a factor in the change to the Hct. For example, subject 3 had drops in Hct for two of the pressure increases with the middle finger experiment. It is possible that applying unequal pressure to one side of the aperture could cut off flow of RBC s entering the tissue extruded into the aperture while allowing outflow which would show a decrease in Hct. A medical term called turgor describes the ability of the skin to return to the original shape after it has been pressed in. The turgor often decreases with age but it is possible for a younger person to have poor turgor. In the development of the PDPM, variability in level of compliance from a human subject was observed. 14 Giving the subject explicit directions and detailed feedback does not guarantee that the subject is capable of successfully performing the task repeatedly. Of the four test subjects only two were able to apply adequate pressure to reliably cause an increase in the measured Hct. The results demonstrate the apparent increase in measured Hct when an applied pressure traps RBC s in the skin extruding into the aperture of the probe but that the reproducibility is dependent on the compliance of the subject. A different approach to changing pressure internally instead of externally is a standard medical procedure called the Valsalva maneuver which can be explained as attempting to push air against a closed orifice. 29,30 It is actually a very nuanced procedure involving many details in exactly how a given maneuver is executed. A common example of this occurs on an airplane with a sudden change in altitude when a passenger may hold
62 46 their nose closed and attempt to blow air from the closed orifice to clear sinus fluids that impair hearing. The act of pushing against a closed orifice requires flexing of the diaphragm to increase pressure within the abdomen and that impedes the return of venous blood to the heart, resulting in decreased cardiac output. When attempting to rationalize the Hct and plasma volume changes recorded during any perturbation from homeostasis there are two necessary rules. First, the RBC s only move when the plasma pushes them and, second, the plasma always moves first. Figure 3.9a shows the characteristic response of a Valsalva maneuver in both the plasma volume and the Hct when the procedure is initiated with an exhalation. 57,58 The initial abdominal pressure increase at around 7 seconds produces a push of plasma before the continued pressure (i.e. diaphragm expansion) decreases the amount of blood reaching the heart from the femoral venous return. The RBC s motion always lags the plasma flow; the RBC motion is caused by the plasma flow resulting in an increase in measured plasma volume and decreasing Hct in the periphery at the earliest stages of the procedure. When the Valsalva maneuver is released at around 47 seconds the flow of RBC s is restored and the Hct increases quickly followed by a decrease in plasma volume which may indicate that the increase in RBC s serves to block flow of the plasma momentarily. After a few seconds the PV and Hct return to their original levels at homeostasis. Figure 3.9b demonstrates that a Valsalva maneuver starting with an inhalation gives a different response which causes a rise in the Hct rather than a decrease. Inhalation serves to inflate the lungs which further decreases the venous return causing the drop in plasma volume and apparent increase in Hct.
63 47 Hematocrit % Hematocrit Plasma Volume Time (s) a Figure 3.9. Measured plasma volume and Hematocrit during a Valsalva maneuver beginning with a) exhalation and b) inhalation. The vertical lines indicate the beginning and the end of the Valsalva maneuver in each experiment. The Valsalva maneuver serves as a standard test to observe characteristic changes to both the plasma volume and Hct in real time. The Chaiken lab first published the Plasma Volume % measured Hematocrit during a Valsalva maneuver in 2012 along with Figure 3.10 which was reprinted from Wikipedia with permission. 21 Starting the Valsalva maneuver with an inhalation before applying pressure gives the plasma volume from Figure 3.9b a similar shape to the systolic blood pressure from Figure 3.10 making it likely that the Valsalva maneuver performed in Figure 3.10 started with an inhalation. Both the plasma volume and Hct behave as would be expected for both the inspiratory and the expiratory VM. Hematocrit (%) Hematocrit Plasma Volume Time (s) b Plasma Volume (%) Figure The textbook physiological response of pulse rate and systolic blood pressure to execution of the Valsalva maneuver (taken from Wikipedia with permission).
64 Postural and Orthostatic Induced Fluid Shifts Applying either internal or external pressure is one way to observe changes in the PV and Hct but one could also change the orientation of the body to induce orthostatic redistribution. Section 3.3 showed data where individuals laid in the horizontal position for baseline responses but we should be able to observe the blood moving as the legs of a patient are raised. Figure 3.11 shows the results of 6 separate experiments executed over a 3 month period involving a single, healthy male test subject aged 60. Each experiment was initiated by the test subject placing the probe on the middle finger of the right hand and pre-bleaching the location for 10 minutes while either sitting or lying supine on the cot. After the pre-bleaching procedure the test subject assumed the supine position, if not already in that position, and data collection began. For all of the orthostatic redistribution experiments (top) the pre-bleaching was done in the supine position but for 2 of the 3 pure baseline experiments (below), the subject was sitting while bleaching, and then became supine just before PVH data collection began. For these experiments, the Hct can be seen to increase faster at the outset of the experiment than later. Thus each data collection began with the subject supine, motionless and speechless and all data sets in Figure 3.11 extended continuously for 2 hours with PVH measurements being taken continuously at 50 samples/sec. When the time scale is in Hemocycles the raw data has been averaged to produce readings every 3 seconds in order to mimic what a practitioner would see if she/he were observing the PVH output with a 3 second refresh time. Earlier experiments showed that speaking and wakefulness is reflected by a more chaotic data set while a sleeping subject always produced very periodic fluctuations in PVH and Hct.


65 49 Figure Top: 3 trials with the same test subject where the legs are raised and lowered where indicated. Bottom: 3 trials with the test subject lying flat with no perturbation. For the upper data sets, at the times indicated by the arrows, a lab assistant raised the legs of the test subject and placed them on a large, firm, vaguely cylindrical support pillow so that the test subject was relaxed in a near lithotomy position. As shown in Figure 3.12 in all cases the plasma volume immediately increased/hct decreased reaching a peak/minimum in 20 seconds before slowing increasing back to the original level, which is roughly where it appeared it would have been in the context of the background fluctuations that were occurring when the postural/orthostatic perturbations were initiated. Background fluctuations appear to be of two types systematic/deterministic and random. Deterministic fluctuations were identified because their appearance and frequency was related to the probe pressure at the skin. When the
66 50 legs were lowered and the subject resumed the supine position we also see a smaller but clear repetition of the earlier behavior wherein the plasma volume increased immediately with the Hct changing in a complementary manner Legs elevated 20 second fall time Hematocrit % Hemocycle (3 seconds) Figure Expanded scale from Figure 3.11 showing speed of fluid movement for topmost trial with legs being elevated. We also performed the same experiment but instead of the subject visiting the lithotomy position, a tilt table was employed such that at 200 Hemocycles the subjects feet were elevated to approximately the same height as for Figure 3.11 but the hands were also elevated. In this case we observed similar overall effects involving an immediate change in PV with each orthostatic transition but now the PV immediately fell with elevation before increasing again after removing the tilt. Although 2 hour experiments were also performed, for purposes of producing Figure 3.13 in a 30 minute experiment, we also employed an automatic blood pressure cuff (Omron) on the right arm (opposite of the PVH) allowing us to record blood pressure and pulse rate throughout. There appear to be correlations between the action of the cuff on the left arm and the PVH measurements on the right finger tips.
67 51 Plasma Volume % Plasma Volume % Systolic Pulse Rate Diastolic Hemocycle (3 seconds) Figure Tilt table elevate legs 14 degrees at first arrow, return to 0 degrees incline at second arrow. PVH measured at right middle fingertip and BP cuff on left arm Blood Pressure and Pulse Rate The lithotomy position in places the legs in such a position that only fluid can flow from the legs into the mid and upper torso. Figure 3.11 shows Hct decrease as the legs are lifted. In this position since the arms and hands are at the same level as the rest of the torso, the increase in plasma volume occurs sharply and has a slow decrease presumably as the RBC s catch up later. One might imagine that interstitial fluid could eventually move also but this cannot be discerned uniquely from the present experiments. The tilt table experiment depicted in Figure 3.13 is different from the lithotomy position experiments in that the arms and hands are also elevated relative to the upper torso and so when the elevation occurs, the hands and arms are also elevated and the net fluid flow should be outward as observed. When the tilt is removed the arms and hands become level with the upper torso and so the plasma volume should increase as upper torso fluids flow into and through the arms and hands as observed. It is interesting to note
68 52 that the deterministic fluctuations are continuous and the other effects are essentially superimposed on top of them. We consider this observation as further proof that the probe sensitive fluctuations are due to the interaction of the probe aperture with the capillaries. The tilt table experiments that included the blood pressure cuff monitoring in Figure 3.13 suggest that, at least in the no elevation/supine position, perturbations in overall blood flow indicated by the mere presence of blood pressure/pulse rate measurements can be observed by the PVH device on the opposite arm. We have certainly seen an effect on plasma volume and Hct before when the pressure cuff/tourniquet were on the same arm but we had not done the experiment before in the supine position. Similarly we note that on a number of occasions in Figure 3.13 (e.g. between about seconds) the diastolic blood pressure appears to track the plasma volume. Since the intravascular plasma is what transmits the blood pressure, and the background plasma volume is present during diastole, this seems reasonable. Between about 275 and 400 seconds there are 7 cycles of deterministic fluctuation and these are uninvolved with the blood pressure measurements, again supporting the idea that these are due to local probe induced effects. Since the algorithm directly calculates the plasma volume and RBC volume, we could have reported those two parameters as the basic result of these experiments. We did not do that because they track each other very closely and small changes are not easily seen. We propose that plasma volume and Hct are the more useful parameters because Hct is a well-known physiological parameter and plasma volume may be the more useful vital sign given its potential connection to blood pressure. The calibration of the PVH
69 53 to the CRIT-LINE chooses a-f that yield the expected result. Additionally, the CRIT- LINE only actually measures Hct from that, with assumptions of normality and total blood supply the plasma volume is calculated. The behaviors of the subsequent raw data, however, could easily cause this procedure to produce meaningless or even unphysical results if this entire analysis were erroneous. It may be an assumption of the model but there is no mathematical constraint on the application of the algorithm for either Hct or plasma volume to assume a certain range of values or to be complimentary. As noted above, the two parameters are calculated from two independent equations and if the raw data were not internally consistent, any calculated result is possible. This suggests that if there was loss of either plasma or RBC s from the intravascular space, the algorithm would produce a consistent result Summary Establishing a baseline response in the plasma volume and Hct affords a definition of what constitutes normal so that abnormal can also be defined. The human body is incredibly complex with many systems running in unison to keep homeostasis and the state of homeostasis itself undoubtedly varies somewhat from person to person. Thus we find it more useful to define a set of zeroes at the beginning of the monitoring session for each patient and observe changes from that starting point. We have established with many hours of baseline data on multiple patients that the Hematocrit calculated by this algorithm is very stable. From one point to the next the smallest physiological increment is only ±0.033 Hct % variability and over the course of about two hours the average difference from start to end was within ±1.0 Hct %. Compared to
70 54 the standard finger stick method of Hct measurements, in which a measured value of 29 % would mean it is in the range of %, the PVH algorithm is able to monitor small and systematic changes. A medical device used to monitor the Hct noninvasively in vivo would also greatly benefit from simultaneous monitoring of other vital signs. By taking a Fourier Transform of the measured Hct, the frequencies for the pulse and the breathing rate are observed. The FT analysis is a convenient means for averaging time dependent data over a specific interval to simultaneously show not only the pulse rate but also the breathing rate. One could imagine many clinical settings, such as patient monitors in hospital rooms where an output of Hct, plasma volume, pulse rate, and breathing rate would be beneficial to the medical staff. For example, the breathing rate could be used remotely to monitor if a patient is awake or sleeping based on a different breathing rate or temporal pattern 54 or it could help diagnose some sleep disorders such as sleep apnea. The behavior of the plasma volume and Hct signal the transfer of fluids between compartments including the onset of dehydration and kidney function. We have purposefully chosen experiments which require minimal movement because of what we call the motion defect. Figure 3.3b shows the motion defect in the green trace at around 725 and again at around 900 Hemocycles which looks like the spectrum makes a major jump over one Hemocycle. The motion defect is from mismatching fiber optic diameters such that a motion of the cord can change the amount of light reaching the detector. This is a problem that is easy to fix but would also require recalibration. For that reason, fixing the motion defect has been delayed to keep measurements consistent throughout and to make the most from this round of
71 55 development. As such, the variations calculated across all of the baseline data includes the motion defects, meaning that the Hct % variation between measurements would surely be lower. There is also the issue of pressure and specifically the pressure of the skin in contact with the probe. The skin extrudes into an aperture in the probe and the pressure of the contact dictates how far the skin extrudes into the aperture. If there is not enough pressure, the skin extrudes very little into the aperture and the focal point of the laser is not focused into the capillaries. If the pressure is too high, the flow of the capillaries can be impeded and there can be irregularities in the data such as pooling of the RBC s in the extruded tissue. The next design of the finger probe would benefit from a system that controls the contact pressure. Despite a couple limitations in the current design of the instrument, the measured Hct is stable over long periods of time and shows movement from known physiological responses. The Valsalva maneuver shows textbook responses and also demonstrates how the PVH algorithm responds to changes in the blood. Postural changes can also be used to observe characteristic fluid redistribution. These changes would be lost in the noise of contemporary Hct measurements yet they are distinct changes observable directly from the out of the PVH instrument.
72 56 4. PVH Measurements in a Rat Model 4.1. Motivation for Use of Rat Model In trauma and emergency medical situations, as commonly occur in the military and civilian worlds, 19,20 determining 1) whether a person is bleeding internally and if so 2) the location and rate of that bleeding can be the difference between life and death. In the Golden Hour after injury, insuring the integrity and function of the cardiovascular system is essential but autonomic compensation for the loss of fluid from the intravascular space can delay diagnosis and, consequently, treatment. Compensation causes changes that begin before the patient is in danger (e.g. during a routine blood donation). As bleeding continues, changes in blood composition occur in response to changes in intravascular pressure. Eventually reserve RBC s and protein from the spleen and liver enter the intravascular space, altering the Hct and the oncotic balance between interstitial fluids and the blood plasma, and extending the time before circulatory collapse. The goal of this research was to determine if pressure and compositional changes can be detected noninvasively and in vivo in a rat model. This chapter focuses on monitoring relative changes in Hct and plasma volume that accompany blood removal and fluid replacement in a rat model in order to learn how to use them as vital signs to diagnose, locate and treat internal hemorrhage in humans. We report experimental details specific to rats since all of our previous in vivo results have involved only humans. 21 The results of blood removal-fluid replacement experiments are shown in terms of the variation in plasma volume and Hct in response to specific stimuli.
73 Experimental All procedures performed using animals were conducted under IACUC approval at Syracuse University (Appendix B). The spectroscopic measurements employed a modified commercial Raman Spectrometer (Lambda Solutions, Waltham, MA) and a specially designed probe intended to mimic the type of aperture-orifice described in Chapter 3 in the context of human monitoring. The probe comprises a 2 mm ID tube with a 2 mm flat lip containing a lens placed near the end of the tube such that when the tube is pressed against the skin, the light is delivered to the skin protruding into the hole at approximately f=2.0. The delivery and collection is symmetric so the collection is also at f=2.0 with an approximate 150 µm diameter spot size. The rest of the optics and filtering is standard for Lambda Solutions probes but there is an additional Raman notch filter (Semrock, Rochester, NY) placed between the collimating lens and the grating to allow adjustment of the EE and IE for optimum dynamic range. The rats used in this study were Sprague Dawley which were pre-cannulated (right jugular) to reduce stress on the animals from multiple procedures drawing blood. The animals were fully anesthetized with a ketamine/xylazine mixture and allowed to rest on a heating pad for all procedures regardless of if blood was drawn or not. A schematic of the blood removal site and the monitoring site of the rats is given in Figure 4.1.
74 58 Figure 4.1. Schematic depiction of the site of monitoring and the site of blood removal via the right jugular vein. In all data shown the blood is removed from the left carotid artery. Fluid replacement involves either the same whole blood initially removed or NormoCarb, an electrolyte replacement fluid commonly used for fluid replacement during dialysis. (In accordance with Creative Commons License the animal drawing is adapted from ) The measurement process used an improvised platform (base from Lambda Solutions) that allows us to know how the pressure between the probe and the tissue varies in time and whether there is gross motion. Blood is very responsive to externally applied pressure. Data interpretation utilizes the probe-tissue pressure changes during monitoring blood removal and fluid replacement. Having tried ears, tails, belly and front and back paws we chose front paws as the preferred site. The paw is placed between the probe and rubber bulb shown in Figure 4.2 and the pressure in the bulb is measured by a capacitance manometer. If there is motion of any kind or if there are internal pressure changes, it is recorded in the digital record provided by an AD Instruments Power Amp/data logger. That record, combined with direct observation, allows differentiation between movement and internal pressure fluctuations. An example of the baseline behavior of the plasma volume and Hct for a rat with no blood removal and fluid replacement is shown in Figure 4.3.

 of plasma volume and Hct and spontaneous variation in probe pressure during")

75 59 Figure 4.2. Lambda Solutions probe mounted on microscope base with probe contacting a latex bulb whose internal pressure can be monitored. The rat paw is placed in between the probe and bulb, palm up. Figure 4.3. Typical baseline behavior (20 msec per data point) of plasma volume and Hct and spontaneous variation in probe pressure during course of an experiment in which no blood removal or fluid replacement occurred. The variation in probe pressure is due to the response of tissue to recover homeostasis compared to the state before the probe was applied as well as systemic changes due to onset of anesthesia and sedation and near the start of monitoring at 33 minutes, bleaching of tissue autofluorescence. (capacitance manometer is MKS Instruments, Andover, MA)
76 Results The results of all experiments were qualitatively identical and internally consistent after 54 separate procedures, some involving baseline measurements and some involving blood removal and fluid replacement, involving 20 different rats. The responses that will be shown below can therefore be considered typical however, as we learned with human studies, 14 better reproducibility results from achieving more reproducible probe placement and pressure. Since we learned that there is a reproducible baseline behavior as shown in Figure 4.3 we were able to design a series of experiments to be executed over a few weeks with a single rat in which a baseline response for that specific rat could be obtained and then used to help interpret the behavior for the same rat in later blood removal-fluid replacement experiments. Since the baseline behavior depends on the age and weight of the rat and dosage of the ketamine-xylazine combination used, having recent rat specific baseline data allowed subtraction of the baseline responses to better compare quantitatively, the device provided Hct and plasma volume responses to the known blood removal and fluid replacement. We have termed this subtraction orthostatic correction because it involves the redistribution of blood and other fluids to placing the rat in the monitoring platform immediately after anesthesia is administered and the animal is adjusting. It must be emphasized that the Hct and plasma volume changes shown below could all be seen in real time without any such correction and we shall show one such data set below. Over a 3 week period, the same rat was used to obtain 1) a baseline response which involved no fluid replacement/removal at all, 2) a response involving major blood loss followed by replacement with whole blood, and 3) a response involving major blood
77 61 loss followed by replacement with Normocarb. Correcting the response of the two replacement experiments using the baseline response allows observations. According to the results produced by the algorithm some general observations can be made. First, removal of whole blood always results in a decrease of Hct and increase of plasma volume. The decrease in Hct depends on the rate of blood removal and the amount removed. Second, fluid replacement using whole blood, as seen in Figure 4.4, results in an increase in Hct whereas, third, straight Normocarb replacement, as shown in Figure 4.5, produces a more muted response due to an increase in the number of RBC s into the intravascular space. Note that all observations were visible in real time without the baseline correction. baseline corrected percent change initiate pull-but no flow start stop push 0.3 Heplock re-initiate pull-achieve flow 156 s pause pull@3.0 ml resume pull 150 s delta Hct (4-1) corrected for orthostatic redistribution finish total start whole blood push finish 2.8 ml push Heplock Hemocycles (3 sec) Figue 4.4. Behavior of Hct with fluid replacement using whole blood replacement after whole blood removal. Annotation gives timescales and amounts of removal and replacement.
78 62 percent change relative to control(no procedure) initiate pull-but no flow start stop push 0.3 ml saline re-initiate pull-achieve flow 129 sec resume pull 180 sec delta Hct (9-1) corrected for orthostatic fluid shift stop ml total start Normo push pause ml resume push finish ml total push Heplock Hemocycles (3 sec) Figure 4.5. Behavior of Hct with fluid replacement using Normocarb after whole blood removal. Annotation gives timescales and amounts of removal and replacement. Figure 4.4 shows the sizes of the observed fluctuations as a function of the accumulated amount of blood removed at least as much as the amount actually removed at a single moment. That is, removing an additional ml after 2.4 ml removed produces a different Hct response than the first ml removed. In humans we expect Stage 2 compensation to begin after removing about 15% of the available blood supply which corresponds to about 2.4 ml for a 225 g Sprague Dawley rat. Since we use one set of a-f parameters obtained from human data and the EE0 and IE0 are set for each rat at the beginning of each monitoring run, we do not necessarily accept the actual numerical values of the Hct change or the plasma volume change due to blood loss at this point only because it cannot be independently confirmed. Presently we can report that the observed changes are very small and reproducible.
79 63 Figure 4.6 documents removal of blood from a large vessel at bleeding rates of roughly 15-20% of total blood (about 16 ml) in 2-3 minutes and the results clearly show that the effects are discernable from normal background homeostatic variations. The plasma relates to blood pressure since the intravascular space must be filled in order to support pressure. Stage 1 compensation for blood loss includes constriction of the vascular bed maintaining the internal pressure when the intravascular plasma volume is reduced by blood loss. Thus the apparent plasma volume increases since the available intravascular volume itself is decreased. plasma volume V p Vp push 0.05ml Heparin autofluorescence photobleaching period checking patency establish baseline intentional slight probe movement reopen hstats Hct exsanguination 63 in 39 sec interval sec additional 1.5 ml removed close hstats 2.5 ml blood removed close hstats open carotid hemostat <0.7 ml additional removed close hstats Hct (%) push 0.05ml Heparin reopen stats additional 1.8 ml removed Hemocycles (3 sec) Figure 4.6. The real-time raw behavior of Hct and plasma volume to blood loss removal from carotid artery with no fluid replacement is shown without orthostatic correction. In Figure 4.7 we show the result of infusing 2 ml Normocarb without blood removal. Direct observation of nearly contemporaneous urination showed that the Normocarb was being removed from the intravascular space almost as fast as we could
80 64 inject it. Nevertheless there is a clear response that we assume involves the flushing of fluorescent materials from the intravascular space into the interstitial space. Plasma Volume (%) Blood Volume Hct Hemocycle Figure 4.7. Response of Hct and plasma volume to 2 injections of Normocarb (2 ml each) starting at 200 and 400 hemocycles without prior blood removal. Hct (%) 4.4. Summary The new algorithm clearly presents a new approach to monitoring blood noninvasively and in vivo. We have previously shown 22 that hemoglobinometers, oximeters and photoplethysmographic devices in general also produce a response for the kinds of stimuli we employ and we expect that they would also produce responses to the bleeding and fluid replacement employed in this study. Such devices are all based on Twersky 26 algorithms whereas the new algorithm is completely different, providing an opportunity to improve our capacity to detect, locate and treat internal hemorrhage. First, the Twersky algorithm assumes a relationship between the hemoglobin concentration and the Hematocrit, that is, the Hgb concentration (in g/dl) is 35 times the Hct, which is not necessarily justified, particularly in cases where homeostasis is not in
81 65 force. Thus the algorithm is calculating a number that increases with both Hct and Hgb but may not be physically related to either exclusively. This idea is consistent with the fact that a strong correlation between the noninvasive measurement of either Hct or Hgb using Twersky and the invasive finger stick Hgb (such as HemoCue or conventional centrifuge) Hct measurement is well established. But to our knowledge in the literature, credible approaches 50,51 to either noninvasive measurement produces Hgb or Hct that has 8.3 % error compared to either conventional measurement. This is apparently not sufficiently sensitive, accurate or precise to provide the type of information that medical practitioners need for our intended use 48. Conventional measurements 47 are often less precise and accurate than either the noninvasive measurements due to sampling error and errors in sample handling. Why is the present algorithm more sensitive? Except for probing geometry, one channel of the algorithm described in Chapter 2 is that the EE is identical to one channel of nearly any photoplethysmographic device. Most photoplethysmographic devices work in a trans-illumination geometry in which the effects of multiple scattering cannot be avoided. In the approach described herein we avoid multiple scattering by choosing an excitation-collection geometry that minimizes collecting light that has penetrated too deeply into the tissue. This gives the present approach an advantage that is analogous to the advantage in vitro nephelometry enjoys over in vitro turbidometry 59. Nephelometry allows a roughly 2-3 order of magnitude decrease in the detection limit for any directly comparable turbidometric approach. For all turbidometric cases we are measuring a relatively small change on a large background signal that is comparable with the shot
82 66 noise for the background. There is no background in nephelometry and there is no signal at all unless scattering occurs. The IE is even more immune to background noise since it is so easy to separate from the probing light. The absence of a background for either the EE or the IE causes the present algorithm to be intrinsically more precise and accurate in the same sense that fluorescence is superior to absorption based measurement systems. 48 The present approach uses a single light source to probe the tissue and the Twersky based approach uses 2 light sources, and their mutual overlap in the tissue volume is not necessarily unchanged as Hct and plasma volume change. Fundamentally, the absorption based approaches such as Twersky s are ideal for oximetry (SPO2) because of the existence of convenient isosbestic points for oxy-deoxy Hgb. They are less successful for Hgb or Hct measurement because the net probed volume absorption is dominated by hemoglobin. As suggested by Table 1 the absorption measurement approach is not sufficiently sensitive to the blood fluid (e.g. the water based phase, plasma). Even at 947 nm the absorption of water in blood plasma cannot apparently be differentiated from interstitial water based fluids. The interstitial fluids do not fluoresce to the same extent as blood plasma. Plasma contains more substances than interstitial fluid. The latter composition is dominated by the presence of small organic molecules and electrolytes. These additional primarily protein components appear to contribute a greater fluorescence per unit volume to plasma. Therefore the IE has a significant contribution from plasma in addition to that from hemoglobin. The relative contributions of these two sources can be adjusted somewhat by choice of excitation wavelength but the effect of Hgb oxygenation is
83 67 noticeable when 830 nm excitation is used. In this study 830 nm provided a good balance between plasma fluorescence and hemoglobin fluorescence but a small oxygenation defect was observed. We have presented data from blood removal and fluid replacement experiments involving a rat model and a new algorithm intended to calculate relative Hct and plasma volume changes. The data suggests that the algorithm actually calculates the intended physical parameters and that bleeding and fluid replacement may be observed with sufficient sensitivity and stability to allow timely diagnosis, location and treatment of hemorrhage. More study is required but this algorithm may be a significant improvement over photoplethysmographic technologies.
84 68 5. in vitro Model to Validate the PVH Algorithm 5.1. Background Chemical analysis of turbid samples 60 without the need for physical sampling, pre-filtration or equivalent sample preparation is always desirable. For example, algaebased biofuel production has received much attention 61,62,63,64,65 as a more environmentally friendly renewable energy source. To manage oil production from algae, it will be necessary to monitor the growth of algae in the growth medium before processing. To avoid contamination or other perturbation of the culture it would be advantageous to avoid direct physical sampling. Vibrational spectroscopy in combination with standard chemometrics allows determination of the levels of nutrients and metabolic waste materials in the growth medium of PC-3 human prostate cancer cells 66 but only after filtering the cells out of the medium. The determination of the viability of bacteria, yeast, algae or stem cells in a growing culture would benefit from a noninvasive procedure. Each involves determination of the volume fraction of a highly scattering phase within the algae, bacteria, yeast, stem cells or debris, dispersed in a homogeneous second phase that produces Raman and/or fluorescence emission, in addition to Rayleigh and Mie scattered light. With NIR light the probing is almost always nondestructive but there are other potential applications where this algorithm could be applied using UV-visible or other light for probing noninvasively. A number of groups 67,68,69,70 are interested in similar problems and calculate the effect of the turbidity on some spectral property such as spectral distortion of remitted emission or absorption spectra where the emission can be fluorescence or Raman. The
85 69 radiation transfer equation can be used, as can Monte Carlo approaches depending on the importance of multiple scattering effects in the measurements and the desired goals. One could use various calibration approaches combined with chemometric techniques such as principal component analysis or partial least squares on corrected data to obtain absolute concentrations. Absorption-based approaches 68 often focus on associating a meaningful pathlength to spectra of turbid samples. Ancillary measurements are sometimes proposed 67 wherein diffuse reflectance can be combined with Raman to give turbidometric or nephelometric information for a calibration model. The measurements would have to be made simultaneously to provide quantitative algorithmic input for the spectroscopic correction. If turbidity-corrected data can be obtained, a variety of approaches can be tried. Warner and McGowan 71,72 have used multiple excitation wavelengths with multiple emission wavelengths to analyze multi-component mixtures. Choosing a specific approach for a specific goal will depend on the specific properties of the system in question but there has been considerable effort directed at finding new and clever approaches to compensate for turbidity in spectroscopic probing of matter. We encountered this problem in the noninvasive in vivo probing of tissue 14,34 using a single NIR laser. For that situation the remitted light was easily partitioned into two components: one that seemed to be mostly affected by turbidity effects and another that was mostly related to the chemical composition of the volume probed. Given our specific goals 6 we used the radiation transfer equation 34 to model irradiation of the outer layers of skin and collection of remitted light in our specific geometry and found that we
86 70 could account for our observations with a model that considered only singly scattered light explicitly. In fact, from the published 35,36 absorption and scattering coefficients of the main components of the probed medium red blood cells, plasma and skin cells given in Table 2.1, it could be shown 34 that single scattering dominates such as the scattering length for the highest blood perfusion and for the expected range of Hematocrit is longer than the distance from the outside of the skin to the nearest outer capillary loops. Thus the region between the outside of the skin and the outermost capillary loops is optically thin. Furthermore, the experimental conditions for a relatively small f number for the incoming light are such that, based on Monte Carlo simulations of similar probing 70 the collected light from offset=0 relative to the light entry point will be mainly >90% from the nearest subsurface region. This region is defined by the prevailing scattering length and so, when probing most if not all skin with NIR, the collected Raman or fluorescence is in fact dominated by single scattered light. This was also indicated by numerical radiation transfer equation simulations. 34 To demonstrate the generality of our approach and support future applications in which the goal is to quantitatively monitor chemistry in situ in turbid media or the spatial homogeneity of the turbidity of a sample, this chapter applies it to a well-defined model system. It comprises particulate scattering centers dispersed in a less strongly scattering but fluorescent or Raman active surrounding medium. Quantitative determination of a fluid-based concentration and the relative phase volumes of the fluid and particulate phases requires simultaneous accounting for turbidity and spectroscopy. First we introduce the algorithm for two-phase systems. In particular, we show why volume
87 71 fractions are linear functions of IE and EE. Then we describe the in vitro system on which measurements were made and show how the results support the theory. This system has some features of the blood system, such as spatial inhomogeneity and lightinduced solution chemistry. The latter mimics the well-known autofluorescence and bleaching effects of NIR probing of tissues and biological media in vivo. 5.2 Theory We now develop the model for our system to indicate when the assumed linear dependences are likely to be valid and provide insight into the behavior of the IE and EE when the assumptions of the model are not met experimentally. The predictions of the model are then checked against experimental results for a system of quartz spheres suspended in an aqueous medium. The EE and IE will be linear functions of one volume fraction and one concentration, instead of two volume fractions. A beam of radiation, with intensity I, starts from a source in layer 1 (vacuum), located at x = 0, y = 0, z = b; it propagates in the x-z plane and enters the 2nd (2-phase) layer at x = b tan 1, y = 0, z = 0, where it changes direction because of Snell refraction (see Figure 6.1). Layer 2 is infinite in the x- and y- directions, and bounded by the planes z = 0 and z = h. The beam is attenuated as it moves downward through layer 2. At any point along the beam (circle in Figure 5.1), elastic and inelastic scattering may take place (they contribute to the intensity attenuation). The scattered radiation is assumed to be spherically symmetric, so some of it (long-dashed line in Figure 5.1) is scattered in a direction such that, after Snell refraction at the surface, it hits the detector (of course the scattered radiation beam is also attenuated in the medium). The detector is parallel to the
88 72 x-y plane and centered at x = X, y = 0, z = c. Along the x-direction, it extends from X d/2 to X+d/2; along the y-direction, it extends from f/2 to +f/2. Figure 5.1. A beam of intensity I originates at the source (x = 0, z = b), passes through the upper phase, is refracted at the phase boundary, and propagates (with attenuation) through the lower phase (dashed line). At any point on the beam (circle), a spherical scattered wave is produced, part of which (long-dashed line) reaches the detector at z = c, x = X. Layer 2 involves two phases, denoted by a and b, with the volume fraction of a equal to, so the volume fraction of b is 1. Let the absorption coefficients for the two phases be a and b, the elastic scattering coefficients be a and b, and the inelastic scattering coefficients be a and b. Then for a beam with intensity I, the absorbed intensity per unit volume is I[ a+(1 ) b], the elastically scattered intensity is I[ a+(1 ) b], and the inelastically scattered intensity is I[ a+(1 ) b]. The total attenuation coefficient is = ( a + a + a) + (1 )( b + b + b) [5.1] so the intensity of a beam decays exponentially according to I(r) = I(0) e r [5.2]
89 73 where r is distance along the beam direction. This applies to the incoming and scattered radiation. The beam starts at x = 0, z = b and enters the condensed phase at x = b tan 1, z = 0 (see Figure 5.1). The angle 2 is calculated by Snell s Law. Since n2> n1, sin 1 / sin 2>1 and 1> 2. Then, a distance r down the beam, we reach the point x = b tan 1 + r sin 2. If I is the initial intensity, the intensity here is I e r. The elastically scattered radiation (outgoing spherical waves) has intensity proportional to I e r [ a+(1 ) b] [5.3] (independent of direction), and the inelastically scattered radiation is given by a similar formula with replacing. The ray of interest is the ray that exits the condensed phase after passing through a distance r* (see Figure 5.1), changes direction at the surface, and hits the center of the detector, which is at z = c, x = X. If the exit point is z = 0, x = xe then (X xe)/c = tan 1* [5.4] and (xe r sin 2 b tan 1)/r* = sin 2* [5.5] The intensity is reduced by a factor e r* (the distance traveled in phase 1 is unimportant since there is no attenuation of the beam in this phase). Only radiation deflected into the detector by a single scattering event is considered explicitly. There is a possibility that some of the scattered radiation undergoes another scattering event which changes its direction so that it never reaches the detector; this reduces the detected intensity. There is also a possibility that radiation scattered from the incoming beam, in a direction which would not allow it to reach the detector,
90 74 undergoes another scattering event which changes its direction so that it does reach the detector; this increases the detected intensity. These double-scattering trajectories are much less likely than the single-scattering trajectories we consider, since the scattering length is large compared to the dimensions of the system. Furthermore, the contributions of the two kinds of double-scattering trajectories to the detected intensity partially cancel. For these reasons, in this geometry btan xe being small or stated differently that the spatial offset between where the ray enters and where it exits approaches 0, neglect of explicit consideration of multiple-scattering events can be a very good approximation. As supported by Monte Carlo simulations 11, the larger is btan -xe the greater the contribution of multiple scattered light to the total remitted light. Note that here multiple scattering is considered in an average way, through the attenuation coefficient. We require an expression for r* in terms of r. Combining the above equations, we get r* sin 2* = X c tan 1* r sin 2 b tan 1 [5.6] where r cos 2 = r* cos 2* [5.7] Thus we start from 1 (given by the experimental set-up), and calculate 2 using Snell s Law: n2/n1 = sin 1 / sin 2 = sin 1* / sin 2*. Then the equations [5.6] and [5.7] allow calculation of 2* and r* for any r. Equation [5.7] is rewritten as and substituting into equation [5.6] gives sin 2* = 1- ( r cos θ 2 ) 2 [5.8] r* r* 2 (r cos θ 2 ) 2 = X c (r*) 2 (r cos θ 2 ) 2 (n 1 r*/n 2 ) 2 r* 2 +(r cos θ 2 ) 2 r sin 2 b tan 1 [5.9]
91 75 Since 1 and 2 are known and constant, this equation allows calculation of r* for any r. It is also necessary to take into account the angle between the outgoing beam direction and the normal to the detector, since this determines the solid angle subtended by the detector. As shown in Figure 5.1, this angle is equal to 1*, and n1 sin 1* = n2 sin 2*, with sin 2* given by a previous equation. The scattering event considered explicitly gives a spherical wave, so intensity decreases as (r*) until it exits the condensed phase. Assuming the wave is still diverging, r* must be replaced by r* + d*, where d* obeys (d*) 2 = c 2 + (X xe) 2 [5.10] Here, d* is the distance between the exit point and the detector. The total intensity at the detector is proportional to the integral over r of e r (for attenuation of incident beam intensity) multiplied by e r* (for attenuation of scattered intensity), by the elastic or inelastic scattering coefficient, by cos 1*, and by the ratio of the detector area to the area of the sphere of radius r*+d*. This gives q I* = I [ a+(1 ) b] cos 1* dr e (r+r*) A 0 4π(r*+d*) 2 [5.11] for elastic scattering, where A is the area of the detector and I is the original intensity. Here, q = h sec 2. For inelastic scattering, a and b are replaced by a and b. In the integral, the angles 1* and 2*, like r*, are functions of r. Equation [5.11] shows the dependence of detected intensity on, the volume fraction of phase a (quartz) in the condensed phase. There is an explicit dependence, as well as an implicit one, through. The attenuation coefficient is given by Equation [5.1], which suggests it is only weakly dependent on. If constant, I* will clearly be a linear function of (volume fraction of quartz). In addition, the scattering from the
92 76 aqueous phase comes only from the dissolved porphyrin, so that b and b are proportional to the porphyrin concentration cp. This means that the scattered radiation I* is also a linear function of cp. The dependence of on and cp is negligible for optically thin or dilute systems. Most important, it will be shown that experimental EE and IE are indeed linear functions of and cp for our system Experimental For these trials we acquired the needed materials. Meso-tetra (4-sulfonatophenyl) porphine dihydrochloride (porphyrin) was purchased from Frontier Scientific, both cesium chloride and sodium azide from Sigma Aldrich, and 8 µm diameter quartz microspheres (SiO2MS-1.8 8um) from Cospheric. All reagents were used without further purification. All solutions were filtered before use with Whatman 0.2 µm Inorganic Membrane Filters ( ). Then we prepared the samples. An aqueous CsCl fluid phase was prepared in DI water having a density of 1.42 g/ml after filtration. A stock porphyrin solution was prepared by adding excess porphyrin to DI water then was filtered to give a 513 µm solution which was measured by absorbance. A stock solution of sodium azide was prepared at 500 µm in filtered DI water. Samples were prepared by suspending quartz spheres in the filtered CsCl solution. The highest concentration of quartz was prepared at v/v by a measurement of the mass and converting to volume by the given density. Each subsequent sample was prepared by a two-fold serial dilution of the previous sample using the stock CsCl solution to dilute. The blank sample at 0.0 v/v consisted of the filtered CsCl solution in the absence of quart. The training set had six
93 77 samples each starting with zero porphyrin. After the initial 30 second spectrum at zero porphyrin, 10 µl of the stock porphyrin was added and stirred in the cuvette with a rinsed and dry thin metal spatula before acquiring a subsequent spectrum. This was repeated until 50 µl of porphyrin had been added for each sample. Settling curves were conducted on freshly prepared samples with v/v quartz and 8.55 µm porphyrin. Absorption spectra were obtained using a Cary 50 UV/Vis spectrophotometer. Temperature data was collected on a Vernier LabQuest 2 Logger Pro with a temperature sensor attachment. NIR emission spectra were obtained using a homemade apparatus with a continuous wave external cavity laser operating at 785 nm (Process Instruments, Salt Lake, UT). The laser delivers a maximum of 450 mw at the sample in a 1.5 cm -1 spectral bandwidth within a multimode spatial distribution. By direct observation, the depth of focus was ~7 mm. From the top of the cuvette, its center was located ~2 ± 1 cm below the surface of the liquid or equivalently ~1 ± 1 cm from the bottom of the cuvette. The data was collected on a -55 C cooled Andor CCD camera where each spectrum had an acquisition time of 30 seconds with 150 accumulations of 200 msec frames. The experimental geometry is shown in Figure 5.2.

94 78 Figure 5.2. Experimental geometry of the 785 nm homemade apparatus Training Set Data The validity of the algorithm is dependent on the linear dependence of both EE and IE on quartz volume fraction and porphyrin concentration. To demonstrate this and calibrate the model to a specific system, a training set with six quartz volume fractions and six porphyrin concentrations, including all combinations, was measured. Results are shown in Figure 5.3. The dark current was measured 6 times and the average EE and IE were 2.96x10 6 ±409 and 1.44x10 8 ±2.35x10 4 respectively where the uncertainties represent 1 standard deviation. These uncertainties are about % standard error or less and are much smaller than the spread in data so we know that the main sources of noise and error for IE and EE are other factors. Since the noise in the dark current, assuming it is all shot noise, amounts to only 0.06 % of the dark EE (1719 counts) or 0.008% of the dark IE (11996 counts) and the observed variability in the measured training set is much greater, the largest source of noise and error is the variable placement of the cuvette
95 79 (which changes reflections from the bottom and sides of the cuvette) and the reproducibility in stirring. It may be noted that EE and IE signals are observed for plain aqueous CsCl in the cuvette in the absence of quartz or porphyrin. As in all such systems, there is a volume determined by the excitation and collection optics and the etendue of the spectrograph from which light can potentially enter the spectrograph and be accurately focused onto the detector in the output image plane. The presence of apertures and distance ensures that only a very small amount of light from within the cuvette can propagate through the spectrograph to the detector(s). Direct observation shows that in the system used to collect the data, incident light is loosely focused in the space several millimeters below the surface of the sample solution and several millimeters from the bottom of the cuvette. Although most of the light we analyze comes from that volume in the cuvette, there is also a reproducible background EE and IE because some of the incident light propagates to the bottom of the solution, to an extent depending on the quartz and porphyrin volume fraction and concentration. Therefore, some EE and IE is produced when the light contacts the bottom of the cuvette. That light must propagate back through the cuvette and the porphyrin and quartz spheres as well as the optical system outside of the cuvette to be ultimately collected. This is a well-defined background emission that is well managed by our procedure as indicated by the overall good statistics and internal consistency of the training set. Note that all in vivo systems possess a third phase static tissue that produces a background and all in vitro experiments must somehow contain the system under study and the container almost always produces some kind of background EE and IE, in
96 80 addition to the EE and IE from contained material. This is the signal that is observed for plain aqueous CsCl in the cuvette with no quartz orporphyrin. However, the main limitations on accuracy and precision in applying this algorithm in vivo to date are socalled human factors. 14 After examining a larger range, the upper limit of the quartz volume fraction was chosen to be the edge of linearity to display the model s range of applicability. Note that the contribution of porphyrin to EE is negligible compared to that of the quartz, so that simple linear least squares regression of the quartz volume fraction on EE alone was not statistically significantly different from bilinear regression that includes IE. The situation is similar to the in vivo Rayleigh scattering coefficient of plasma 36 being smaller than that of RBC s, one way in which the present system resembles the in vivo situation. The plots are linear in all cases. For the 24 plots of Figure 5.3, the values of the dimensionless parameter X, equal to the slope multiplied by the maximum x-value and divided by the average y-value, and the values of the coefficients of determination R 2 are given in Table 5.1. The plots are identified by the panel of Figure 4 (A, B, C, or D) and numbered from bottom to top (1 to 6). The values of R 2 are 0.98 or greater for all the plots of A, B, and D. For the plots of C, R 2 is not a useful measure of linearity because the best-fit lines are horizontal. More relevant are the root-mean-square deviation from the mean divided by the mean, or X, the ratio of the largest deviation from the mean to the mean. A small value of X indicates a plot which is essentially horizontal. Calculated values of X are, for plots C1 through C6: 2.8%, 1.0%, 0.2%, 1.7%, 2.0%, 2.0%. Only for C1 is X greater than 2%. The problem here is the 2 nd point. When it is removed, X drops to 0.7%.
97 81 Table 5.1. Values of X (maximum excursion from mean divided by mean value) and R 2 (coefficient of determination) for the plots of Figure 6.3. Plot # X parameter R 2 Plot # X parameter R 2 A B A B A B A B A B A B C D C D C D C D C D C D Figure 5.3. Training set data arranged to show trends in both EE and IE for each species. The EE (-13 to 44 cm -1 ) and IE (900 to 1900 cm -1 ) are calculated after a dark current subtraction of each spectrum. The EE (a) and IE (b) of changing quartz have lines at the following porphyrin concentrations: 0.0 µm ( ), 1.7 µm ( ), 3.4 µm ( ), 5.1 µm ( ), 6.8 µm ( ), and 8.5 µm ( ). The EE (c) and IE (d) of changing porphyrin have lines at the following quartz volume fractions (1x10⁻⁵ ): 0.0 v/v ( ), 5.2 v/v ( ), 10.4 v/v ( ), 20.8 v/v ( ), 41.7 v/v ( ), and 83.3 v/v ( ).
98 82 The horizontality of the plots of Figure 5.3A shows that the porphyrin does not contribute to the elastic scattering intensity EE. This is also the reason that the plots of Figure 5.3A fall on top of each other. The rejected data point (0.0 v/v quartz and 1.7 µm porphyrin), which deviates from linearity in Figures 5.3A and 5.3C, could be due to various experimental errors (e.g. a dust particle or back reflection). It serves as an example that the EE and IE can in fact be counted as independent measurements, a requirement for applicability of the algorithm. Although the EE from this spectrum could be rejected by the Q-Test at a 99% confidence, 73 the IE data point cannot be considered an extraneous value by the same test. Only the EE data point was excluded from subsequent analyses Applying the Algorithm Since both EE and IE are bilinear functions of (quartz volume fraction) and cp (porphyrin concentration), and cp are linear functions of EE and IE so we can write equations [5.12] and [5.13]. cp =a+ b(ee) + c(ie) [5.12] = d+ e(ee) + f(ie) [5.13] The parameters a-f were obtained from a bilinear fit on the training set in Figure 5.3. The values were: a = ( )M, b = )M, c = ( )M, d = ± , e = 10 10, f = Note that quartz volume fraction and numbers of counts are unitless. Using these parameters in the algorithm of [5.12] and [5.13] to predict the quartz volume fraction and porphyrin concentration from the values of EE and IE of the
99 83 training set, we obtained the results shown in Figure 5.4. Calculated values are on the y- axis, actual or expected values on the x-axis. For quartz, the slope is unity (corresponding to perfect prediction) to within 0.4% and the intercept is zero to well within the standard error; R 2 = For the porphyrin R 2 is considerably lower (0.94) but the slope is still unity and the intercept is zero, both within their respective standard errors. The standard error of the estimate is calculated as σ est = (Y est Y act ) 2 N [5.14] where N is the number of points (35 in the present case), and Yest is the value of or cp calculated from the linear equations, and Yact is the actual value of or cp. The value of est is 1.85x10 for the volume fraction of quartz, and 7.02x10 for the porphyrin concentration. None of the points in Figure 6.4 deviates from the trend line by more than two standard deviations. Figure 5.4. The algorithm was applied to the training set data to calculate quartz and porphyrin. (a) The expected volume fraction of quartz is plotted against the quartz volume fraction calculated from the bilinear fit. (b) The expected concentration of porphyrin is plotted against the concentration of porphyrin calculated from the bilinear fit.
100 84 Despite the fit to the porphyrin displaying satisfactory linear correlation, there appears to be systematic error: in other words, curvature. Graphing the porphyrin and quartz residuals against each other, a linear fit produces an R 2 of about 0.1, an estimate of the covariance 60 between the two predicted values. This suggests that about 10% of the prediction errors in quartz and porphyrin are correlated with each other in a manner not accounted for by the purely linear model and including a cross term EE*IE in the fitting function did improve R 2 significantly. Correlated errors could result from laser power fluctuations or cuvette placement as just two examples and so a more extensive discussion is beyond the scope of this paper. We also introduced quadratic terms in EE and IE so that =a+ b(ee) + c(ie) + d(ee 2 ) [5.15] cp=e+ f(ee) + g(ie)+ h(ee 2 ) [5.16] The values found for the parameters are as follows: a = , b = 10 10, c = 10 10, d = 10 10, e = ( )M, f = ± )M, g = ( ± )M, h = ( )M. Using only the term in EE 2 in addition to the linear terms, the results of Figure 5.5 are obtained. There is a significant improvement in R 2 for the porphyrin, Figure 5.5B. The intercept is closer to zero and the slope closer to unity, than each was in the fits of Figure 5.4, which did not include the quadratic term. We also analyzed, using our model, the data obtained as the quartz spheres settled through and out of the observation volume of the laser. The density of the CsCl solution is such that, in the 30 seconds that each individual sample is analyzed for the training set,
101 85 there is no significant change in the measured signals. Direct visual observation shows that about 22 minutes is required for the quartz to settle to the bottom of the cuvette as the fluid phase above becomes progressively clearer. Figure 5.5. The algorithm with an added EE quadratic term was applied to the training set data to calculate quartz and porphyrin. (a) The volume fraction of quartz calculated from the fit is plotted against the actual or expected volume fraction. (b) The concentration of porphyrin calculated from the fit is plotted against the actual or expected concentration of porphyrin. The statistics of each fit line demonstrates the accuracy of the fit Observation of Quartz Settling A sample of the measured EE and IE during settling is shown in Figure 5.6. For fresh samples, both EE and IE curves are very reproducible. However, if a sample is stirred and analyzed again as in Figure 5.6B, the EE repeats the first run, starting at the level at the beginning of the first run, while the IE reverts to the level at the end of the first run, which is lower than the beginning level. It is well known 16,17 that aqueous porphyrin emission is bleached when irradiated with NIR in the presence of oxygen, so that the initial IE in the second run is close to the final IE in the first run is not surprising.
102 86 This bleaching is analogous to the well-known bleaching of autofluorescence 17 that occurs when tissue is irradiated with NIR in vivo. Figure 5.6. Calculated EE (a) and IE (b) of a fresh sample (83.3x10⁻⁵ v/v quartz and 8.55 µm porphyrin) where squares represent the first run and circles the second run, begun after the solution was stirred again. Each data point is calculated from a 30 second spectrum averaged over 150 accumulations. The EE is due almost exclusively to the quartz (see Figure 5.3C), whereas the IE has contributions for both quartz and porphyrin. The porphyrin makes a much greater contribution to the IE for the concentrations we use. The ratio of the average slopes of the lines in the training set figures 5.3B and 5.3D shows the comparison. The ratio is 49:1 indicating that an increase of 0.02 ppm in quartz volume fraction produces an IE increase equivalent to an increase in porphyrin concentration of 1 M. For the initial ~7 minutes, the system is almost homogeneous and the training set algorithm allows calculation of and cp. When settling becomes important and the system becomes spatially inhomogeneous, the algorithm cannot be used, although the EE and IE can still be used to monitor the evolution of the system. Settling depletes the quartz, starting at the top of the container (z = 0). Density profiles calculated for a related system 74 are presented in Figure 5.7.
103 87 Figure 5.7. Characteristics of settling. (a) Density profiles calculated for a related system 72 at times t0 = 10, t1 =30, t2 = 50, t3 = 70, t4 = 90 and t5 =110 minutes. The profiles are almost vertical, indicating a sharp boundary between a quartz suspension and a quartz-free solution. (b) Approximate two-layer description of system when sedimentation front has moved down almost to the bottom of the cuvette (z = -h). Note that the volume fraction of solution is essentially the same everywhere. It varies from 1 to 1 but, since the volume fraction of quartz is less than 10-3, the change is negligible. Thus the contribution of the porphyrin to EE is given by equation [5.11] above, with = 0 at all times, and the contribution to IE is given by [5.11] with b replaced by b. Since b and b are proportional to the porphyrin concentration, we must take into account the degradation of the porphyrin. We get an estimate of the degradation rate from the measured inelastic scattering intensities, since they are dominated by the porphyrin. When cp = 0 and = , IE = , which represents the contributions of the quartz and the cuvette. The IE values for the first 6.5 minutes of the settling experiment are reduced by this amount, and the difference, representing the porphyrin, is fitted to an exponential e Ct. The best-fit value of the degradation rate constant C is min -1.
104 88 When the sedimentation front has moved far down (see Figure 5.7B), there is essentially no quartz for z > k (where h k is small). The contribution of the quartz to the elastic scattering is given by a modification of equation [5.11]: q Iquartz* = I cos 1* dr φ(z)β p a e (r+r*) A [5.17] 4π(r*+d*) 2 Now is a function of z, and the integral extends from p = k sec 2 to q = h sec 2. For the inelastic scattering, is replaced by. If h k is small, the integrand in [5.17], except for (z), is roughly independent of r. This makes the integral approximately q p proportional to T = dr φ(z). Since all of the quartz is in the lower layer, h < z < k, T represents the total quartz in the system, which is constant. This means that Iquartz* approaches a constant for large time. The contribution of the quartz to the measured scattering may be obtained by subtracting the porphyrin and cuvette contributions from the measured scattering. From the linear fits of Figure 5.3 data for zero quartz and M cp M we obtain EE = cp, IE = cp. Combining these with the effective porphyrin concentration as a function of time, t, we obtain the porphyrin + cuvette contributions to the IE and the EE. Plotted against time, the curves are roughly parallel, as expected Porphyrin Photodegredation Some experiments were conducted to more fully appreciate the effect of the porphyrin photochemistry on the training set and other measurements. Figure 5.8 displays the EE and IE for two identical solutions containing both porphyrin and quartz, one with
105 89 dissolved oxygen in equilibrium with the local atmosphere and the other with the oxygen reduced by pre-bubbling argon through the solution. The EE is essentially unaffected but the IE is much smaller when more oxygen is present, indicating that most if not all of the reduction in IE is due to porphyrin photochemistry involving oxygen. Figure 5.8. EE (a) and IE (b) of two identical fresh samples (83.3x10⁻⁵ v/v quartz and 8.55 µm porphyrin), one bubbled with argon and the other with oxygen. The squares represent the solution bubbled with argon and circles the solution bubbled with oxygen. Soret band (411 nm) absorption measurements were made on the fluid phase before and after irradiation (with the quartz spheres filtered out before each measurement), as shown in Figure 5.9. These spectra demonstrate that under identical conditions, the effective porphyrin concentration is decreased by >80% during a 22 minute settling period. Assuming exponential decay, cp = c0 e Ct, this gives C = ln (0.2) 22 min = min-1 [5.18] which agrees well with the estimate above, from the IE during the first 6.5 min of settling, of min -1.
106 Absorbance Wavelength (nm) Figure 5.9. Soret band (411 nm) absorption of two identical fresh samples (83.3x10⁻⁵ v/v quartz and 8.55 µm porphyrin). The solid line is the measured absorption of the filtered solution without exposure to the NIR laser while the dashed line is the solution filtered after 22 minutes of irradiation. Another estimate of C may be obtained in the context of the two-layer model introduced above. At later times, the contribution of porphyrin to the IE is mostly from the upper layer, and would be constant in time were it not for the decay of porphyrin. The IE should then behave like I(t) = A + B e Ct with A representing the contribution of the lower layer and the container; it is expected that A is smaller than B. Fitting the IE for t 14 minutes to I(t) yields A = , B = , C = min -1. Using a later start time gives a lower value of C. We also performed experiments involving azide, a known physical quencher of singlet oxygen, 75 in the form of added sodium azide. In these experiments, EE and IE were measured while the system was allowed to settle for 22 minutes (first run), the system was stirred and the measurement repeated for 22 minutes (second run), and stirring and measurement were repeated once more (third run). The presence of azide in the absence of porphyrin has no significant effect on either IE or EE. However, when both porphyrin and oxygen are present, azide does have an effect, as shown in Figure 5.10.
107 91 Figure EE (a) and IE (b) of a fresh sample (83.3x10⁻⁵ v/v quartz, 85.5 µm porphyrin, and 85.5 µm azide) where squares represent the first run, circles the second, and triangles the third with stirring between successive runs. The results in Figure 5.10 are for a concentration of azide equal to the porphyrin concentration compared to Figure 5.11 where the azide concentration is half that of the porphyrin. The settling of the quartz, as indicated by the EE, is accompanied by a decrease in the IE, which continues in successive runs. However, this decrease is less than in the absence of azide. With higher azide concentration, the decrease is even smaller. The known quenching of excited porphyrin by azide 76 in competition with singlet oxygen production at higher azide concentration accounts for these observations.
 where black squares represent the first run, red circles the second, and blue triangles the third with stirring between successive runs.")

108 92 Figure EE (a) and IE (b) of a fresh sample (83.3x10⁻⁵ v/v quartz, 85.5 µm porphyrin, and 42.3 µm azide) where black squares represent the first run, red circles the second, and blue triangles the third with stirring between successive runs. When azide is present with porphyrin, the EE during the course of the settling has a more drawn-out appearance, with neither the quartz volume fraction nor the porphyrin concentration becoming as low at 22 minutes. In addition, the first settling profile in the sequence has a more distinct fall off than the later ones and the EE is actually greater for the later runs than the first run. By distinct we mean that the EE has a discernable second stage starting at about minutes whereas the fall-off for successive runs is smoother with no second stage. All of these observations are consistent with the idea that the quartz settling is disturbed by laser-induced temperature gradients, such as heating. Figure 5.12 shows the results of measurement, using a thermocouple, of the temperature of the solution during settling and irradiation, using fresh solutions similar to those of Figures 5.7, 5.10, and There is a sharp temperature rise if both porphyrin and azide are present, a relatively weak temperature rise if only porphyrin is present and a very weak one if only azide is present. The temperature rise starts immediately when the irradiation begins and immediately reverses when the laser light is removed. Only when
 Temperature change with 785 nm laser irradiation. Red represents a fresh sample with 8.83x10⁻⁵ v/v quartz and 85.")
 The same increasing temperature data is shown from A along with the decline in temperature after the laser was turned off. 5.8.")
109 93 light, porphyrin, oxygen, and azide are all present is the temporal profile of the quartz settling affected and a distinct temperature rise observed. Figure (a) Temperature change with 785 nm laser irradiation. Red represents a fresh sample with 8.83x10⁻⁵ v/v quartz and 85.5 µm of both quartz and azide, green with only quartz and porphyrin, and black with only quartz and azide. (b) The same increasing temperature data is shown from A along with the decline in temperature after the laser was turned off Summary The above measurements are for a two-phase system, with one phase being a solution of variable concentration that does not scatter elastically and the other a strongly elastic scattering pure solid phase. The results show that a simple linear algorithm can be calibrated to allow simultaneous determination of concentration and phase volume fractions from measurements at a single excitation wavelength, with the remitted light separated into two components. It is thus possible to obtain quantitative information from dynamically turbid solutions if the effect of the turbidity is accounted for by simultaneously measuring the EE in addition to the IE. Usually, the IE is the only signal available. One reason for this demonstration was to establish the validity of a linear algorithm for a simple system having some of the features of the kind of system we
110 94 ultimately seek to describe. Our goals were first to gauge the performance of the algorithm under nearly ideal conditions and then to assess the interpretability of the response of the algorithm to perturbations in the system. The results show that linear relations exist between the IE and the EE, and the quartz (elastic scatterer) volume fraction and fluorophore or Raman scatterer concentration. The EE is linear in the quartz volume fraction and statistically independent of the porphyrin concentration cp. When linear relations were used to calculate and cp from measured EE and IE, they accounted for over 94% of the variation in and cp. Addition of a quadratic term in elastic scatterer volume fraction to the linear treatment improved the correlation with the measured porphyrin values by 3% which was statistically significant 77 at better than 99% confidence, but did not make a statistically significant change in the ability to predict quartz volume fraction. Successive applications of the F test showed that each quadratic term (EE 2, IE 2, IE*EE) made a statistically significant improvement in the predictive calibration for porphyrin. Nevertheless the linear terms and EE 2 alone contain almost all of the dependence on both porphyrin and quartz of EE and IE. The calibration lines for calculated porphyrin and quartz versus actual porphyrin and quartz had slopes of 1.0 and intercepts of 0.0 within experimental error. The shot noise of the raw EE and IE or the dark current (from integrating the same pixel ranges for EE and IE) was not enough to account for the spread in the raw data in the training set. We conclude that the detection limits in this system are determined by reproducibility in sample placement and stirring. Note that in an in vivo setting, placement error would be quite different since the cuvette is the surrounding
111 95 static tissue. There is no stirring but human factors could induce motion and other defects. When any in vivo probed region is irradiated 17 the autofluorescence bleaches (or decreases), reaching a steady state value (material is supplied by, for example, blood flow) in seconds to several minutes, depending on the tissue, the applied power, and the excitation and emission wavelengths. Our apparatus 15 monitors this decay and calculates reference EE0 and IE0 when the IE has reached steady state. The present work shows that the rate constant for bleaching can be extracted from the data, so that earlier time points can be used. Since unbleached tissue produces much more IE, movement of the point at which the incident light contacts the tissue (for example, due to the human patient being noncompliant with instructions) causes a temporal spike in the apparent plasma volume and Hematocrit. The best measure of the precision in the apparatus for the in vitro system is the spread in the values predicted for the training set data. Using the purely linear algorithm, the standard deviation for predicted quartz volume fraction is 19 ppm and 0.72 M for predicted porphyrin concentration. These values are 2% and 10% of the range over which the algorithm was calibrated, and were obtained without optimization of apparatus or procedure, and with a single light source in the NIR for which there is only very weak absorption by porphyrin. The background of reflections involving the cuvette, and fluorescence from the cuvette made reproducible cuvette placement essential to obtaining precise results. For the ranges of and cp studied, the EE was independent of porphyrin concentration and linear in quartz v/v, and the IE linear in both. For larger ranges, the IE
112 96 fit was improved by adding small quadratic terms in quartz and porphyrin and a cross term, to the linear terms in quartz and porphyrin. The linear algorithm underestimates the porphyrin for larger quartz volume fractions because the raw IE becomes concave down with quartz volume fraction beyond the linear range. Sometimes, the turbidity can be reduced to the level required for applicability of the linear algorithm, such as a simple dilution of a sample might be adequate to reduce native turbidity to a level that can be calibrated for in advance. It is not surprising that this algorithm can be applied successfully to the volumetric analysis since the use of empirically calibrated turbidity or nephelometry measurements for endpoint detection in precipitation reactions is well known. 78 On the other hand, an absorption loss due to uncontrolled dissolved materials in the fluid phase might interfere with that approach. Since it allows analysis at concentrations well below the detection limit of the same analyte by absorption 76, use of fluorescence by itself in quantitative analysis of a fluid phase is common. However, sample preparation, e.g. filtering may be required for reliable, precise and accurate results. In certain situations, where simultaneous chemical and volumetric analysis of a turbid fluid phase is required, the approach we describe can be executed conveniently using a single laser source, simple spectral filters, single channel detectors and possibly in situ or with little or no sample preparation. The simultaneous determination of an absorber/scattering system like this could not be accomplished by absorption/optical density measurements using a single-color light source. We studied this system because of analogies to our main interest, in vivo applications. When applied to blood measurements, the algorithm of Equations [2.4] and
113 97 [2.5] is used in the form of Equations [2.6] and [2.7], which involve reference values for the EE and IE since clinical interests focus attention on changes from the reference state of homeostasis. The anatomy of most tissues is very well defined and the principle of steady states or homeostasis 43 ensures that in general changes in physiological parameters that determine the optical properties of a tissue like skin occur slowly. Thus, if the volume fraction and chemistry of tissue are constant or nearly so, the algorithm will reveal changes in concentrations of materials in the only fluid changing to any appreciable extent: the blood.
114 98 6. Blood Samples Investigated in vitro 6.1. Interest in Study The in vitro study described in Chapter 5 provided a model system that is analogous to the blood in that the quartz spheres modeled the red blood cells and the porphyrin modeled the plasma. RBC s form a circle in the x-y plane but have a biconcave shape in the z-axis rather than forming a sphere. 79 They also contain a solution inside allowing them to deform which changes the viscosity of the blood. 80 The quartz sphere is sufficient for modeling the RBC s in the context of the algorithm but fails to fully model all of the properties of the RBC s. The algorithm uses the measure of EE, a result of physical scattering, to calculate RBC concentration but the RBC s do not have a spherical shape as the quartz spheres do resulting in slightly different scattering properties. Using a solubilized porphyrin to model the plasma fits as there is a natural level of porphyrin in the plasma and the porphyrin gives a fluorescence signal, as does the plasma. 81 The in vitro model provides support that the algorithm works well in a controlled and defined system. The in vivo environment is very well defined physically and is highly regulated internally to achieve homeostasis supporting the evidence that the algorithm is measuring changes in the blood noninvasively based on the data and explanations from Chapters 3-5. To further give evidence to the validity of the algorithms calculations of PV and Hct, an in vitro study with blood should be investigated. Two of the requirements for the algorithm are that the majority of collected light must be in the single scattering range and that the measured values are within a linear range. Figure 2.1 demonstrated how the in vivo probe was designed to collect mostly singly scattered light and section 5.2 describes the prevalence of singly scattered light from the cuvette model. When
115 99 measured in vivo, the blood cannot be intentionally changed to make a calibration curve, therefore an in vitro model of blood should be able to demonstrate physiologically relevant linear ranges for volume fractions of PV and RBC s. Another important aspect of attempting to obtain justification for the in vivo use of the algorithm from an in vitro model system involving blood itself has to do with the unusual optical properties of RBC s. It is well known that the elastic scattering coefficient depends on RBC orientation, deformation, and axial migration within whatever vessel contains the sample. Such changes of RBC orientation are known to occur as a function of flow and shear rate in vivo and also in in vitro flow systems. Being aware of this complexity from the outset we adjust our expectations as to how well we can meet the conditions for the applicability of the model and the associated algorithm in any static RBC containing system Experimental All procedures performed using animals were conducted under IACUC approval at Syracuse University. Whole blood was drawn from rats at the end of their lifespan to use for in vitro experiments. Blood was also drawn from Dr. Chaiken and me at a nearby hospital by a registered nurse. The 830 nm spectroscopic measurements employ the same instrument used in Chapter 3 except with probes designed for liquid samples. Each spectrum had an acquisition time of 200 seconds with 10,000 accumulations of 20 msec frames. The 785 nm spectroscopic measurements were obtained on the same instrument described in Chapter 5.
116 100 The materials used include Phosphate Buffered Saline 10X, purchased from Santa Cruz. The PBS was filtered before use with Whatman 0.2 µm Inorganic Membrane Filters ( ). Whole blood was collected in BD Vacutainer TM Plastic Blood Collection Tubes with K2EDTA 5.4 mg (Fisher Scientific). The sample preparation used the 10X PBS which was diluted to 1X with filtered DI H2O for use in experiments. The whole blood was separated and cleaned before use as follows. The fresh blood was centrifuged for six minutes at 6.0 g to separate the plasma from the RBC s. The plasma was decanted from the top of the RBC s and placed in a separate container. To wash the RBC s, 1 ml of 1X PBS was added and gently mixed by inverting the sample tube several times. The RBC s were then centrifuged as before. The top layer of PBS and white blood cells were decanted and disposed. The RBC s were then washed a second time. Any dilutions of plasma or RBC s were made into the 1X PBS solution Experiments at 785 nm The instrument used in Chapter 5 was dedicated to in vitro experiments making it the instrument of preference for the quartz and porphyrin model. Since the model system worked so well on the 785 nm instrument, the blood was also analyzed on the same system for comparison and reproducibility. Direct comparisons between an in vitro experiment at 785 nm and the in vivo experiments at 830 nm will not be possible however, demonstration of linearity in both PV and Hct is for EE and IE would further give credence to the algorithm.

117 101 Both the plasma and the RBC s cause some scattering in solution though RBC s cause much more scattering. The RBC s are particles which scatter and the plasma contains proteins which can cause scattering. At the upper limit of the single scattering range, an increase in volume fraction will no longer produce a linear increase in signal. The first step is to find the point at which the signal starts to turn over due to multiple scattering. Figure 6.1 gives a visual of the increase in scattering from plasma and RBC s. Figure 6.1. Images of 785 nm irradiated diluted plasma (left), diluted RBC s (middle), and more concentrated RBC s (right). The plasma contains macromolecules and platelets that cause some scattering but mostly fluorescence while the RBC s cause a large amount of both scattering and fluorescence. Images from Figure 6.1 were taken during the experiments in Figure 6.2 to find the linear ranges of both plasma and RBC s for measured EE and IE. The middle and right images from Figure 6.1 demonstrate how an increase in RBC volume fraction decreases the penetration of the laser into the solution and increases the probability of multiply scattered photons. Note that signals produced by the cuvette walls (including the sides and bottom respectively) also can be important at both high and very low RBC volume fractions. A different penetration effect occurs when EE and IE are collected at 90 degrees to the incident light, as will be described in Chapter 6.4, compared to when light is collected in a purely backscattered configuration.


118 102 Qualitatively, as with all other systems checked, starting at zero concentrations, both the EE and IE increase linearly with 1) increasing concentration of scattering center e.g. RBC s and 2) increasing concentration of molecules such as proteins respectively. At some point the increase stops and the EE and IE actually decrease with added scattering center and molecular concentrations causing the curves to turn over. Figure 6.2. The EE and IE of both RBC and plasma volume fractions were analyzed over several days to find the linear ranges. Each data point is dark current subtracted. Data in Figure 6.2 from 8/16 demonstrated clearly that the RBC s would turn over in signal for both EE and IE at around v/v which equates to 3 µl of pure RBC s in a 3 ml solution. The ranges of plasma proved to be linear in the ranges tested and while

 and IE (900 to 1900 cm -1 ) are calculated after a dark current subtraction of each spectrum.")
119 103 the turning point was not observed, the abundance of collected blood dictated the volume fractions used. With linear ranges established, a training set was designed with six volume fractions of RBC s and six volume fractions of plasma and all of the combinations between, shown in Figure 6.3. Figure 6.3. Training set data arranged to show trends in both EE and IE for each species. The EE (-13 to 44 cm -1 ) and IE (900 to 1900 cm -1 ) are calculated after a dark current subtraction of each spectrum. The EE (a) and IE (b) of RBC s have lines at the following plasma volume fractions: 0.0 ( ), 0.02 ( ), 0.04 ( ), 0.06 ( ), 0.08 ( ), 0.1 v/v ( ). The EE (c) and IE (d) of changing plasma lines at the following RBC volume fractions (1.0E -4 ): 0.0 ( ), 1.33 ( ), 2.67 ( ), 4.0 ( ), 5.33 ( ), and 6.67 v/v ( ). The trends for the training set were fairly linear with the IE more stable than the EE because incident light impinging on the cuvette surfaces produces much more EE and IE and there is no specular reflection of IE. Changes in counts for EE are on the same

120 104 scale for both RBC s and plasma but the IE change for RBC s is much stronger than for the plasma. To test if the linearity is sufficient for the algorithm, a multiple linear regression was performed for both changing RBC s and plasma to give the parameters a-f from Equations 6.1 and 6.2. R = a+ b(ee) + c(ie) [6.1] P = d+ e(ee) + f(ie) [6.2] Measured EE and IE values can then be used in these equations to calculate RBC and plasma volume fractions in Figure 6.4. A good fit should have a slope near 1.0 and an intercept near 0. Slopes of and and intercepts of 0, both within experimental error, demonstrate a good overall fit to the data for both the RBC s and plasma with the algorithm. Figure 6.4. The algorithm was applied to the training set data to calculate RBC s and plasma. (a) The expected volume fraction of RBC s is plotted against the RBC volume fraction calculated from the bilinear fit. (b) The expected volume fraction of plasma is plotted against the volume fraction of plasma calculated from the bilinear fit. The purpose of exploring this in vitro experiment of blood was to compare the results to the blood measured in vivo. In the volar side of the fingertip, there is a volume fraction of RBC s around which amounts to an estimated Hct of around 0.1
121 105 with a perfusion of about 3% blood within the probed region. 18 Figure 6.3 shows the high end of RBC volume fraction to be at amounting to about five times lower than the physiological level. Plasma volume fraction at the physiological level would be near the bottom of the range in Figure 6.3. It is known that at 785 nm the scattering coefficient for RBC s is greater than at 830 nm where the in vivo measurements are made. 36 A repeat of the same type of experiments at 830 nm should therefore give a turnover point for RBC s that is nearer the physiological range and should also give a better balance between the signals for plasma Experiments at 830 nm Experiments at 785 nm were convenient due to the function of the instrument as a dedicated in vitro system and comparability with the quartz and porphyrin model from Chapter 5. Performing the same type of in vitro blood experiment at 830 nm would have the extra benefit of comparing more directly with the in vivo measurements. The finger probe from the in vivo experiments is attached through a fiber optic as shown in Figure 3.1. The finger probe is detachable with different probes that can be attached. A probe specifically designed for liquid samples was attached for use in the following experiments. Keeping as many variables consistent as possible, the liquid probe was mounted above the cuvette holder so that the geometry was identical to the 785 nm setup from Figure 5.2. Design of the mount allowed the cuvette to be secured into the cuvette holder without moving the probe or the holder, keeping the focus in a consistent spot just below the surface of the liquid. Linear ranges were found and are shown in Figure 6.5.

122 106 Figure 6.5. The EE and IE of both RBC and plasma volume fractions were analyzed to find the linear ranges. Each data point is dark current subtracted. RBC s show linearity over the range for EE but turns over in IE after volume fraction which happens to be around the physiological range. Plasma appears to show linearity for both EE and IE across the range chosen and probably to higher volume fractions. Compared to the 785 nm system, the signal of the RBC s has greatly decreased and evened out the signal balance between the RBC s and plasma by more than a factor of 4. Within the linear ranges established from Figure 6.5, a training set was comprised of six volume fractions of each RBC s and plasma having every combination which is shown in Figure 6.6.
 and IE (900 to 1900 cm -1 ) are calculated after a dark current subtraction of each spectrum.")
 and IE (d) of changing plasma lines at the following RBC volume fractions: 0.000 ( ), 0.001 ( ), 0.002 ( ), 0.003 ( ), 0.004 ( ), and 0.005 v/v ( ).")
123 107 Figure 6.6. Training set data arranged to show trends in both EE and IE for each species. The EE (-13 to 44 cm -1 ) and IE (900 to 1900 cm -1 ) are calculated after a dark current subtraction of each spectrum. The EE (a) and IE (b) of RBC s have lines at the following plasma volume fractions: 0.0 ( ), ( ), ( ), ( ), ( ), v/v ( ). The EE (c) and IE (d) of changing plasma lines at the following RBC volume fractions: ( ), ( ), ( ), ( ), ( ), and v/v ( ). The EE shows fairly consistent linear trends for both the RBC s and the plasma. The IE however, was very inconsistent in this and other attempts of the same experiment. Linear ranges of both RBC s and plasma independently appeared well behaved in linearity but the mixed samples were consistently poor in linearity. It is possible that the RBC s are concentrated enough to cause multiple scattering possibly from the sides of the cuvette or that this configuration allows a reflection from the bottom of the cuvette.
124 108 The camera from Figure 6.1 worked well with images from the 785 nm laser but the 830 nm laser did not show up by camera or the eye making visual observation of scattering difficult. Scattering from the bottom or sides of the cuvette is always a possibility but it is more likely to affect the EE rather than the IE. If the turbidity of the sample is too high, the laser may not be reaching the focus and there could be multiply scattered photons arriving back to the detector. To test the effects of scattering by the sample, the geometry of the instrument was changed. Each probe has a port for the laser and a port for the detector connected by fiber optics. With two liquid probes, one could be placed in the z-axis and the other in the x- axis to give a detection at 90 degrees. Two probes were mounted individually and the laser input was shifted between the two probes to align the focus of each probe to the same point. When the foci of both probes were aligned the laser was placed in the z-axis probe and the detector in the x-axis probe to give a standard 90 degree nephelometric geometry. Fresh blood was obtained to determine a linear range in the new geometry of the probes. After some initial experiments with the blood, it appeared that the signal may not be optimized so the system was better aligned for optimized signal. When more blood was obtained, more experiments were done to determine the linear ranges, shown in Figure 6.7.


125 109 Figure 6.7. The EE and IE of both RBC and plasma volume fractions were analyzed to find the linear ranges. Each data point is dark current subtracted. Unlike previous experiments, the signal decreased with increasing either plasma or RBC s. The purpose of arranging the probes in this nephelometric orientation was to determine if the laser might be reflecting off the bottom of the cuvette or if the turbidity is causing multiply scattered photons. The decreasing of both EE and IE signal in this experiment gives evidence to an increase in turbidity causing less photons to arrive at the focus of the collection optics. The probe with the detector is aligned so that it will collect the majority of signal from the spot where the laser will come to a focus and the signal seems to be decreasing with the shape of an exponential decay.
126 Summary Noninvasive in vivo optical probing of biological tissues is necessarily affected by both physical propagation effects and spectroscopy. These last two chapters have used well-defined in vitro model systems to validate the PVH algorithm. It is possible to show that across the exact range of chemical concentrations and density of physical scatterers encountered in biological systems of interest, the algorithm works well and with full internal consistency. It is always possible to find linear ranges for the EE and IE dependencies on the volume fractions because the dependence always approaches linear as the volume fraction of scattering centers approaches 0. Notwithstanding the usual complications in conduction experiments with RBC s that is, aggregation, oxygenation variation, and motion effects, even the blood mimicking experiments produced results essentially as expected. The basic assumption of the PVH algorithm is that the system (of scatterers with concentration C) in question is optically thin or dilute. These terms relate to the exponentially decreasing dependence of the intensity of light as it penetrates a medium in the z-direction where there is absorption and scattering (for simplicity we will account for both with the variable µ). I(z) = I 0 e µzc [6.3] Since the leading term in the general Taylor series expression (around z=0) for the exponential has the form for x=µzc: e x = 1 + x + x 2 2! + [6.4] Thus, for µzc being small enough e.g. if µzc<1 the higher order terms in Equation 6.4 can be neglected and the dependence of the intensity decrease is always linear which
127 111 leads to two solutions. First, since z is the position variable, the properties of the system are contained in the product µc. If µc is large then the system is still linear if z is small enough, it is optically thin. If µc is small because C is small enough given the magnitude of µ, then the system is optically dilute. If given these parameters the optical distances involved (and produces adequately large spectroscopic signals) are the same or larger than the physical distances involved (e.g. in the dimensions of the cuvette), then it will not be possible to construct an in vitro model system without encountering wall effects in the data, as observed. The most important part of the last statement is partially the wall artifacts observed in the in vitro system based on blood components are to be fully expected, and predominantly that in vivo systems have challenges for noninvasive chemical analysis using spectroscopy that are different. We have little recourse but to adopt to the nature of tissue as an analytical sample but container effects are much less of a problem when analysis of capillary blood in the outermost reaches of the epidermal-dermal boundary is the goal. Furthermore, when capillary blood is the goal the issue of RBC tumbling and other motion-induced scattering effects is obviated because the RBC s execute constrained motion as they traverse such tight vessels, because there is no room to tumble and in fact they only traverse by deformation along the way.
128 Discussion, Future Work, and Conclusions 7.1. Discussion Throughout my research we were confronted with the problem of trying to ascertain whether the PVH was actually measuring what we want and expect it to measure. Using the most direct path to this end, we showed that the algorithm produces unambiguous results when applied to in vitro systems. We coupled those results with independent results on in vivo systems for added credibility. However, these kinds of measurements have never been possible in in vivo systems before and so we immediately were confronted with trying to guess what the actual physiological results are. Thus to harvest that credibility we had to hypothesize what the actual physiological response is to the perturbations we employed. This also naturally led us to consider the clinical value of that information if we conclude that PVH actually measures the physical properties that we believe are being measured. Thus, the first hypothesis investigated was that the Hematocrit acts as a ʻvital signʼ with only relatively small measurable changes over time due to physiological effects. The Hct monitoring can also be used to measure other vital signs such as the pulse rate and breathing rate for comparison. The four commonly recognized vital signs are blood pressure, temperature, pulse rate, and respiratory rate. A vital sign is a measurable physiological parameter that is regulated by autonomic functions in the body and a change in one or more of the vital signs can indicate a medical problem. Efficient ways to measure these vital signs have existed for many years but we believe that if the Hematocrit was monitored with sufficient precision it could be added as a vital sign.
129 113 The present standard method for measurement of Hct is to stick a finger (or do some other type of blood draw) to squeeze blood (and interstitial fluids) into a tube which is centrifuged in order to measure the height of the RBC column relative to the total height of the blood. The Hct value depends on the internal diameter of the vessels from which the blood is sampled. Alternatively the blood could be drawn from directly from a vein. Either way, the commonly accepted error and precision on this type of Hct measurement is about ± 2 units (due mostly to sampling errors) on a normal scale ranging from around 36 to 53. With this large of an error in the standard measurement, there would need to be even greater changes in the Hct for it to be used as a vital sign which is perhaps why it presently is not. Our measurement of the Hct takes an entirely different approach by analyzing the blood noninvasively by scattering from a laser which is recorded every 20 msec. Averaged over many hours of observation of motionless patients the variation from one measurement to the next is only ± units which is 60 times better than the finger stick method. Apparently, measurement of the Hct with the smallest physiological increment of ± units has allowed us to see small fluctuations that have never before been observed. One such observation is a standard medical procedure called the Valsalva maneuver in which a person tries to push air out of a closed orifice. The effect of the VM on other vital signs such as the blood pressure, pulse rate, and breathing rate has been measured previously so we can demonstrate that our measurement of the Hct, in Figure 3.9, is consistent with the literature. 29,30,57,58 Variations in the technique of the Valsalva manoeuver have been shown to greatly influence the pattern of cardiovascular response to the test. 82 For example, before
130 114 starting the Valsalva maneuver, the patient can either inhale or exhale producing different effects in the response. Inhalation before the VM causes the lungs to expand and take up more room in the thoracic cavity, causing a greater decrease in the venous return, which causes a greater decrease in the total ejected volume and therefore an increase in Hct. Exhalation before the VM makes for a less dramatic obstruction of the venous return allowing more plasma to slip through showing a decrease in Hct. The VM has been proposed 83,84 as a noninvasive basis for cardiac health assessment precisely because many autonomic processes respond depending on the VM technique employed. What has been lacking is a sensitive, quantitative, continuous and noninvasive method for measuring relevant parameters in real time as they change during the VM. 85 PVH would seem to offer an ideal and essential addition to the VM as a cardiac diagnostic. Knowing that the increases and decreases in Hct make sense with a known physiological test, we can take a Fourier transform of the data to observe patterns in the Hct from both pulse rate and breathing rate. The pulse rate can be measured with an automated blood pressure cuff as shown in Figure 3.13 and corroborates with the Fourier transform data. Figure 3.13 describes an experiment where the legs end of a futon was raised while the patient was in the supine position. Orthostatic redistribution occurs when the orientation of the body e.g. the heart and circulatory system changes relative to gravity. The raising of the legs caused blood to rush to the head and showed a spike in the pulse rate from around 75 pulse/min up to around 80 pulse/min then the pulse rate relaxed back down to 74 pulse/min after equilibration to the new orientation. Taking the Fourier transform of the data to observe pulse rate was discovered after the data from
131 115 Figure 3.13 was published yet it only further gives evidence to the validity in the Hct measurement. A Fourier transform of the data not only gives the pulse rate but it also gives the breathing rate. The oxygenation of the blood slightly changes the fluorescence of the RBC s which is shown in the data. Demonstration of the breathing rate is given in Figure 3.7 where 10 minute intervals of controlled breathing rates were observed. A normal breathing rate showed a strong peak at 0.26 Hz or 16 breaths/min. Changing the breathing rate to 10 seconds per breath gave a strong peak at 0.1 Hz and a breathing rate of 2 seconds per breath gave a strong peak at 0.5 Hz. From only one laser noninvasively probing the skin, we are able to monitor two of the commonly accepted vital signs, pulse rate and respiration rate, along with the Hematocrit/plasma volume which we believe could also be associated as a vital sign. We are able to measure the Hct to ±0.033 units from one measurement to the next and for a sedentary subject Hct generally stays within 1.0 unit over the course of a 2 hour experiment. Until now the changes in Hct from physiological stimuli that we observe would have been lost in the noise of standard measurements. A vital sign is only useful when the technology enables a measurement precise enough to determine changes on a scale relevant to physiological changes. We hold that this measurement of Hct would be useful as a vital sign if the instrument was in the hands of medical professionals. In addition to the Hct, the plasma volume seems to follow the blood pressure as well but more experiments are needed to make a quantitative connection between the two values. If the plasma volume could be used to measure the blood pressure and the Hct was taken as a vital sign, this device
132 116 could be used to measure all the vital signs continuously except temperature in real time through a simple noninvasive finger probe. The second hypothesis states that changes in Hct due to loss of blood are measurable and significantly different from normal physiological changes. Beyond use in noninvasive glucose monitoring by Raman spectroscopy, the purpose for developing the algorithm to measure the plasma volume and Hematocrit was to detect changes in the Hct from internal bleeding. To investigate blood loss in controlled situations, we were approved to conduct studies in a dialysis center and to do a study on rats. Dialysis is necessary for cleaning the blood when a patient has renal failure. Many dialysis patients have an arteriovenous fistula inserted into their arm to provide a direct connection to a strong vein that can be repeatedly used for blood removal and replacement. During the procedure the patient is typically reclined in a chair for 3 to 5 hours while the blood is cleaned. An FDA-approved device called the CRIT-LINE was developed to analyze the blood while it is in the dialysis machine in an effort to indicate if the dialysis machine is pulling or pushing either too hard or not hard enough. A machine set to pull or push against a human interface cannot determine if the pressure needs to be adjusted so the CRIT-LINE was designed to give patients a more comfortable dialysis procedure. The CRIT-LINE calculates a number that is not quite Hgb or Hct but reports both with the assumption that (Hgb=35*Hct) which is not necessarily constant over time or across patients. Nonetheless, this is an FDA-approved device that is safe and effective for that stated purpose. We were able to calibrate our algorithm by the CRIT- LINE Hct output knowing that the Hct we measure in the finger is necessarily different but proportional to the Hct in a large vein. The difference is not entirely important
133 117 because the algorithm is designed such that we are only measuring changes from the prevailing Hct and plasma volume calculated at the beginning of an experiment. The dialysis center was not only chosen for the comparison to the CRIT-LINE but also because there is a large portion of blood removed from a human patient in a controlled setting. Transfusion, infusion and blood donation centers such as blood banks are also ideal venues for testing. Finding patients with an internal bleed would be very difficult but the dialysis center offers a measurement on a human where the blood composition is being changed. After the blood has made its way through the dialysis machine cleaning impurities from the plasma, it flows back into the patient with the same RBC count but with fluids reduced. This gives an increase in Hct as the RBC s stay essentially constant and the fluorescence of the plasma is decreasing. The motion defect in the probe from mismatched fiber optics makes some of the dialysis data difficult to follow but Figure 7.1 shows the observed Hct for three of the dialysis sessions with few motion defects Hematocrit % Time (min) Figure 7.1. Hematocrit monitored for three different patients during a hemodialysis procedure.
134 118 The first 5 to 10 minutes of data corresponds to an apparent increase in Hct due to bleaching of the static tissue yet the trend is continually increasing with the exception of the motion defects which are characterized by fast vertical jumps in the Hct. Figures 2.4 through 2.6 highlight that the Hct measured by the LighTouch matches well with the FDA-approved CRIT-LINE while having the advantage of being truly noninvasive. Despite the motion defects (which will be easily fixed in the next model) as required the Hct can be seen to continue upward as the impurities in the blood are removed. The observation of changing Hct with blood loss was also investigated in a rat model. Experiments in a rat model gives the advantage of controlled blood removal and addition while the rat is under anesthesia. The rat also has a much smaller supply of blood so the removal of only 2.5 ml corresponds to about 15% of the total blood supply. Differing from the dialysis experiments, the rat experiments can show the response of blood removal without reentry of blood back into the system at the same time. Figures 4.4 through 4.6 show that when a large portion of the blood is removed the Hct consistently decreases. Figures 4.4 and 4.5 also show that when whole blood is added back to the system there is an increase in Hct compared to an addition of a blood replacement fluid where the Hct begins to increase at first but falls after the replacement fluid is added. At the start of these experiments there were certain physiological effects that were not accounted for. The two that stand out are temperature and blood pressure. As the rat is anesthetized the blood pressure will drop which causes the rat to get cold. The rats were laid on a heating pad to keep them from getting too cold but the temperature was not measured in any of the experiments. Technology to measure the blood pressure in rats
135 119 has been known for many years 86 but the Chaiken lab did not have the equipment to make this measurement. Changing blood pressure should show an effect on the PVH measurement and this technology would have helped elucidate if any of the changes in Hct were due to changing blood pressure. Figures 4.2 and 4.3 demonstrate the capacitance manometer that was used to measure changes in pressure under the paw. While this did give a pressure measurement that followed the trend in Hct, it was implemented towards the end of the study. If another rat study is planned, temperature and blood pressure would be measured in every experiment. In both the dialysis experiments and rat model, the changing Hct is observable in real time. The dialysis creates a steady state with RBC s moving out of and back into the body and the Hct increases with the removal of fluid borne impurities from the plasma. Experiments in the rat model show a decrease in Hct with removal of whole blood and an increase when whole blood is introduced back into the system. Both of these experiments give evidence to an observation of changing Hct over the background noise noninvasively in real time. The third hypothesis states that the PVH algorithm, used to calculate the Hematocrit in vivo, applied to a model system in vitro demonstrates the ability to accurately calculate changing concentrations of a two-phase optically thin system. To model the blood, quartz spheres serve as a substitute for RBC s and porphyrin as a substitute for plasma. Quartz spheres were chosen at a diameter analogous to the size of a red blood cell and the density of the solution was adjusted with CsCl in order to suspend the quartz spheres long enough for each measurement. For in vivo measurements the static tissue is assumed to be essentially constant and only the RBC s and plasma change
136 120 giving two components measured by two signals, the EE and IE. This model system has a background signal from the CsCl solution and cuvette while having two changing components and the same two measured signals. A training set was composed of six concentrations of each component in the linear range having all combinations of concentrations. Figure 5.3 demonstrates that both components display linearity in both EE and IE. A bilinear fit was applied for each component to model the change in signal for changing concentration to give the six constants in Equations 5.12 and 5.13 comprising the algorithm. The measured signals were then plugged back into the algorithm to determine how well it can predict concentrations within the linear range. Figure 5.4 demonstrates that the graphs of actual concentration vs. calculated concentration produce a fit with slope near 1 and intercept near 0 for each component. To further investigate the ability of the algorithm to follow changes in concentrations, the mixed sample of quartz and porphyrin was analyzed over a longer time period. Our collaborator Jerry Goodisman had previously done modeling on sedimentation, similar to the quartz spheres settling, so he applied a similar model in Equation The settling of the quartz spheres fit well with the sedimentation model and is shown in Figure 5.6. Trends in the EE were similar across multiple experiments where the signal would stay consistent for about 6 minutes then start to drop as the sedimentation front moved down past the focus of the laser. The IE however, did not show the same consistent trend across multiple experiments on the same sample. It is known in the literature that porphyrin can photodegrade under near-ir irradiation. In the sedimentation curves, the IE signal has a constantly decreasing slope
137 121 superimposed on the same sedimentation curve from the EE. The second sedimentation of the same sample starts with the IE at the same intensity as it ended with after the first sedimentation while the EE has returned to the original intensity. This same type of experiment was repeated with a known quencher of the photodegredation, sodium azide, where the IE shows a similar shape to the EE over multiple sedimentation experiments in Figures 5.10 and A secondary confirmation of the photodegredation was observed by the disappearance of the Soret absorption band upon irradiation in Figure 5.9. Despite the sedimentation of the quartz and photodegredation of the porphyrin, the acquisition time was chosen such that the sample was essentially unchanged over the duration of observation for the training set. This two-phase optically thin system is well modeled by the algorithm to determine both porphyrin and quartz concentrations based on the measurement of both EE and IE. A good fit to a model system gives confidence that the algorithm is also behaving properly in the in vivo measurements. The fourth hypothesis states that physiologically relevant volume fractions of blood components show linearity with respect to both EE and IE. In the volar side of a fingertip the profusion is about 3-5% with an Hct of about 0.1 giving a volume fraction of RBC s between and a plasma volume fraction of The volume fraction of blood components was analyzed first at 785 nm excitation to parallel the experiments of the model system in Chapter 5. In determining the linear ranges the plasma was linear in both EE and IE well past the physiological range. The RBC s, however, were only linear to around a volume fraction of which is below the physiological range by a factor of three. But the capillary rich section of skin is only about µm thick and the cuvette produces signals from 1-2 cm deep. Thus, the
138 122 cuvette/optical system creates a physically thick sample and container effect i.e. effects that would not occur in vivo are unavoidable in that particular in vitro venue. Nonetheless, the blood components could still be analyzed within the linear ranges to verify the fit of the algorithm. A training set was devised with six volume fractions of RBC s and six volume fractions of plasma analyzing every combination. The measurements were relatively linear and fitting to the algorithm gave slopes near 1 and intercepts at 0 within experimental error. Within the linear ranges the algorithm works well with the blood components but the RBC s deviate from linearity at the normal physiological range. At 785 nm excitation the scattering, absorption and fluorescence of RBC s is greater than at longer wavelengths which is why in vivo measurements are made at 830 nm. If the scattering from RBC s is sufficiently decreased at 830 nm then the physiological range of volume fractions should fall within the linear range. Having demonstrated that the components of blood can be modeled by the algorithm within linear ranges at 785 nm excitation, the instrument used to analyze blood in vivo at 830 nm excitation was adapted for in vitro experiments. Measurements in vivo are made with a finger probe attached by fiber optics which can be detached in favor of a liquid probe. The liquid probe was mounted analogous to the 785 nm system where the laser enters the cuvette from the top and collects the backscattered light. At 830 nm excitation the RBC s showed linear behavior in the EE to more than double the volume fraction of the physiological range. However, the IE only showed linear behavior to volume fraction which is right at the top of the linear range. The images in Figure 6.1 demonstrate what happens to the scattering when the volume
139 123 fraction of the RBC s is large. As the volume fraction of RBC s increases, the depth to which the laser penetrates decreases and extraneous scattering starts at the bottom of the cuvette but eventually moves outward towards the walls of the cuvette. To investigate the effects of the RBC s scattering on the light reaching the focus, a 90 degree nephelometric geometry was designed. The LighTouch device employs different fiber optics for the laser and the detector allowing two different probes, one with the laser and the other with the detector. Both of the probes were mounted such that the laser probe was in the z-axis and the detector probe was in the x-axis with the foci of both probes were overlapped in space. If the volume fraction of RBC s was scattering the majority of the light before reaching the focus, this geometry should show a large decrease in signal reaching the detector. Data in Figure 6.7 does show that increasing the volume fraction of both RBC s and plasma within the physiological range decreases the signal reaching the detector. Volume fraction of both RBC s and plasma within the normal physiological range at 830 nm excitation show linearity in the EE signal. When analyzed separately the IE was well behaved enough for linear results, however, the mixing of both RBC s and plasma at the physiological range resulted in less than linear trends. A secondary 90 degree geometry demonstrates that the turbidity of the samples is hindering light from reaching the focus and likely causing multiply scattered photons to reach the detector. Analyzing the components of blood in a cuvette serves to model the in vivo measurements yet it is not exactly the same. When the laser probes the skin in vivo, there is a layer of static tissue (about 100 µm) with a much lower scattering coefficient before the laser makes it to the capillaries. In vivo systems are physically thin in addition to
140 124 being optically thin and this makes designing a simple in vitro system to mimic in vivo systems difficult with currently available instrumentation. The laser then reaches the capillaries, which have about a 10 µm diameter containing the blood with the larger scattering coefficient. In comparison, the in vitro blood experiments have the highly scattering RBC s mixed throughout the entire solution causing the scattering to be spread over the entire depth of penetration ( 1 cm). Even with this difference against the in vitro experiment, there is still linearity within the physiological range of both RBC s and plasma. The algorithm only works within the linear range and by sheer luck (for in vivo systems that are simultaneously physically and optically thin) the physiological range of RBC s and plasma give linear results for both EE and IE Future Work The work presented here is part of an ongoing project in noninvasive in vivo blood analysis that is far from finished. The project started with a noninvasive measure of blood glucose and transitioned into a measure of plasma volume and Hematocrit before I joined the lab. Measurement of PV and Hct is important in the detection of internal bleeding which is the leading preventable cause of death worldwide, military or civilian, for all people ages 18 to 47. There is still work to be done to make PVH ready for market to be used in medical settings. Alternatively, a turbidity corrected measure of plasma volume from PVH gives the ability to associate Raman intensity from blood glucose (or other potential analytes) to a volume for a noninvasive blood glucose concentration in vivo.
141 125 One of the greatest obstacles in the PVH research right now is the motion defect from a mismatch in fiber optics. Fixing the motion defect is simple but it would require that the instrument be recalibrated for the algorithm. The immediate downside in needing to recalibrate is that new results may not be correlated to the data as it is presently calibrated. It is probable that previous experiments may need to be repeated on the new calibration. An immediate benefit to fixing the motion defect is that it could open new avenues of research such as active physiology. The instrument is being used as it is now and is producing new and interesting results but the fear is that trying to fix the motion defect could cause new unforeseen problems that hinder the research. With knowledge that the probe will eventually be fixed, the future work will include experiments with a device that does not have the motion defect. As mentioned above, the PVH algorithm could be used for interesting studies in the area of active physiology. With enabling technologies advancing in recent years, it is conceivable to imagine a new design that could fit the hardware of the device in the size of a watch and transmit the data wirelessly. This type of design could be used to give valuable information to athletes; for example, a marathon runner could have an indication from the plasma volume that dehydration is setting in. In the long term baseline experiments the Hct tends to drift up and the plasma volume tends to drift down. Part of this effect is due to insensible water loss from both respiration and perspiration. One could imagine that the plasma volume could be used to track when there has been a significant loss of fluid to indicate a need for rehydration. Due to the motion defect, and the absolute necessity of establishing normal baseline behavior, experiments so far have been limited to minimal movement. It would
142 126 be interesting to monitor people exercising in different manners to observe how the blood flow and composition are affected. Does an exercise like rowing, where the person is sitting, have a different effect on the blood flow than running where the person is standing? Are there observable differences in blood flow from lifting weights compared to cardio-oriented exercises? Breathing rate and pulse rate from a wearable would also give additional information for these types of studies. There are so many possibilities of interesting questions that could be answered if this technology was utilized in active physiology applications. Aside from the fluid loss from perspiration and respiration, there is also a change from the kidneys removing fluids which produces an increase in Hct and a decrease in plasma volume. Figure 7.2 shows one baseline experiment where kidney function appears to turn on at around 600 Hemocycles. This type of response in the signal could be useful for medical professionals who care for patients who either have difficulties with communication or lack the capacity to indicate a need to use the restroom. From the baseline experiments that we have done, we believe that it may be possible to observe the kidneys turning on before the patient even notices.
143 Hematocrit Plasma Volume Hematocrit % Plasma Volume % Hemocycle Figure 7.2. Measured PV and Hct in a resting patient where the bladder appears to turn on at around 600 hemocycles. To study the effects of the kidney activity on Hct and plasma volume in a controlled study, we could use a diuretic called Lasix 87, which turns on the kidneys, and an antidiuretic Desmopressin 88,89 as a negative control which reduces urine production. Both of these are prescription drugs and are not difficult to obtain for experiments. Lasix is known as a loop diuretic which shows a high (<95%) binding affinity to proteins such as human serum albumin, which could potentially show changes in the Raman signal. Figure 2.2 shows a typical spectrum of a human finger which has Raman features above the fluorescence baseline mainly due to protein. If the Lasix were to make a large enough effect on the protein content, it could show a change in the Raman spectrum. Even if the Raman spectrum does not change significantly, there should be measurable differences in the Hct and plasma volume corresponding to the increased kidney function. Desmopressin works as an antidiuretic to reduce the amount of water that is eliminated by the urine. There should still be changes in the Hct and plasma volume but it should show opposite effects from the Lasix. Lasix should show an increase in Hct until the
144 128 bladder needs to be evacuated and the Desmopressin should show an increase in plasma volume with a corresponding decrease in Hct. A condition called Raynaud s disease 90, which can cause loss of blood in the fingers due to cold or emotional stimuli, would make for an interesting study. In the early 2000 s when the Chaiken lab was working on glucose, they would apply pressure to a finger to evacuate the blood for a blank sample. Raynaud s disease causes vasoconstriction in the fingertips which evacuates RBC s making the fingers look devoid of color. Analyzing patients with Raynaud s disease before and after the vasoconstriction could give a quantitative measurement of how much of the in vivo signal comes from the RBC s. With good technique, applying pressure evacuates a significant amount of the blood from the probed region but a patient with Raynaud s evacuates much more of the RBC s from the region. In a different direction, temperature effects could be observed in the blood. The blood is largely used for temperature regulation so in response to cold the body has autonomic compensation mechanisms. When exposed to the cold, the body will give preference to keeping the core warm and uses a mechanism called cold-induced vasodilation (CIVD) to periodically send more blood to the extremities. In studying the effects of gloves and wind on cold fingers, Shitzer et. al. 91 measured the temperature of the finger exposed to cold. At about 20 minute intervals there was an increase in temperature that they assume is due to changes in the blood flow. This is something that we could actually measure in real time 1 and we could do it with the instrument as it is now.
145 129 The easiest way to measure this may be to move the instrument to a walk-in freezer without gloves on to measure the plasma volume and Hct over time. To give a secondary measurement, a temperature probe could be connected to an adjacent finger at the same spot as the probe to measure changes in temperature along with the PVH. We should be able to reproduce the results from Shitzer et. al. along with providing more information about the blood flow and composition. A downside to the walk-in freezer is that it could cause problems with the cooling function of the instrument (since the freezer is colder than the detector) or changes to adhesives within the instrument. A similar effect could be obtained by blowing air over dry ice onto the hand with the probe. Finally, an improvement to the experiments in Chapter 7 could come from using tissue phantoms 92 to more accurately model the different volume fractions of blood components in the capillaries. The in vitro model in a cuvette served the purpose to demonstrate that the physiological ranges of plasma and RBC s show linearity when dispersed in the entire volume. Using physically thin tissue phantoms that avoid edge/finite size effects would give a better model having the RBC s and plasma contained in a small diameter just below the surface. Designing the phantom limb to anatomical proportions for a finger may not be difficult 93 but including something like capillaries below the surface could potentially be challenging. Along with the difficulties of adding something like capillaries, there could be melting issues with blood absorbing the excitation. To summarize the ideas from this section, with a technology making a physiological measurement that was previously unobtainable, there are numerous areas to study that could reveal subtle changes in blood dynamics. A huge area for potential
146 130 research lies in active physiology including all kinds of exertion of the body. It would also appear that PVH could be used to detect when the kidney function begins to fill the bladder so a study with diuretics and antidiuretics could help show the usefulness for a medical professional to noninvasively monitor the kidney activity in, for example, an unconscious patient. Patients with Raynaud s disease could be utilized to study the effects that an absence of RBC s in vivo would have on the algorithm. A cold stimulus could be used to observe an autonomic cold induced vasodilation response as the body tries to warm a cold limb. Lastly, the use of tissue phantoms could improve upon the in vivo blood analysis by providing a sample that is both physically and optically thin as is the tissue in a finger above the capillaries. Measurement of the plasma volume and Hct has the potential to provide important information to clinicians but the future plan is to move towards a better measurement of glucose. With the improvement of enabling technologies since the early 2000 s and now a turbidity corrected measurement of plasma volume by PVH, the noninvasive in vivo measurement of glucose might be possible at a sufficient precision. The production of a small noninvasive device providing an accurate measurement of blood glucose in real time could revolutionize the management of diabetes for those who cannot stand constantly pricking their fingers Conclusions This work describes the ongoing analysis of blood noninvasively in vivo along with the in vitro validation of the algorithm. The blood is taken as two components, red blood cells and plasma, both of which cause elastic emission (from Mie and Rayleigh
147 131 scattering) and inelastic emission (from fluorescence and Raman emission) in varying quantities from a single light source at 830 nm. Having two components and two measured quantities, two independent linear equations can be used to correlate each component to the measured EE and IE. Red blood cell volume and plasma volume are given by the equations which are then used to calculate the Hematocrit (volume fraction of RBC in the total volume of blood). From this approach, the Hct can be measured to a smallest physiological increment of ± units compared to ± 2.0 units from the standard blood draw method. With this new level of precision, subtle changes can now be observed which were impossible before. We hold that with this new level of precision, the Hct could potentially be used as a new vital sign. The first question to ask when measuring something new is if it actually works. The measurement of Hct itself is not new but this level of precision with a continuous noninvasive measurement certainly is new. Enough is known about the circulatory system to meaningfully compare match our results with the common understanding of the physiology involved. We have observed changes in the plasma volume and Hct from fluid shifts on a tilt table, the Valsalva maneuver, dialysis patients, and whole blood removal from a rat model. Each of the various measurements appear to behave as would be expected from the known physiology further giving evidence that we are in fact measuring changes in the plasma volume and Hematocrit in real time. Further evidence is given by in vitro demonstration of the algorithm on both a model system and blood. As long as the sample is optically thin and the collected photons are singly scattered, the algorithm behaves as expected and gives good results.
148 132 The second question to ask is if it would be useful outside of the research lab. We have shown that an important application for the measurement of PVH is for real-time noninvasive detection of internal hemorrhaging. More testing is needed but it would appear from the rat experiments that changes in response from blood loss are greater than the baseline changes. Presently there is not a commercially available device which can noninvasively monitor the blood to determine if there is an internal bleed. From the trends in the Hct we have also shown that two vital signs, respiration rate and pulse rate, are observed by a Fourier transform of time domain PVH measurements. It may be possible for a medical professional to monitor if a patient is sleeping or awake based on changes in the respiration rate and pulse rate. It would also appear that changes in the Hct slope could give an indication of when the bladder is filling. The combination of these vital signs in a compact device could serve to improve the quality of care in a medical setting by providing new information for the medical professionals. The final question is where the future of this research lies. It would certainly seem that this PVH technology is moving towards becoming a commercially viable product to be found in many diverse medical settings. As it is now, this device could report plasma volume, Hct, respiration rate and pulse rate without needing the capability to measure a Raman spectrum, which would decrease the size and cost of such a device. It would also seem that with the plasma volume from PVH and improved enabling technologies the time to start working towards a noninvasive in vivo measure of blood glucose is near. The ability to measure a glucose signal from the Raman scattering noninvasively in vivo while
149 133 correlating it to a quantitative, turbidity corrected measure of volume should give a reliable measure of the blood glucose to become the new FDA standard of care. Appendix A: IRB in vivo Human Study Protocol TITLE OF STUDY: IN VIVO RAMAN SPECTROSCOPY (IVRS) OF HUMAN FINGERTIP CAPILLARY BEDS: A PILOT STUDY Research Protocol: 1 June, 2012 Background: The leading preventable cause of death for people between 18 and 45 world-wide is uncontrolled internal bleeding i.e. hemorrhage (A. Sauaia et al, J. Trauma 38, (1995)). Internal bleeding can be very difficult to reliably detect when there is no visible external injury and the rate of blood loss is not rapid. Two indicators of rapid blood loss are fluctuations in hematocrit and blood protein concentration. Monitoring of either of these analytes requires an invasive blood draw and at least 3-5 minutes to obtain a single
150 134 measurement. The LighTouch device shines imperceptible red light onto the skin and measures the light that reflects back using the method of Raman Spectroscopy. Some of this light is color shifted and some is not. Using a validated, proprietary algorithm (J. Chaiken et al, J Biomed Opt 14(5), (2009) & 15(3), (2010)), the LighTouch device combines the signal in this remitted light and calculates hematocrit, glucose, protein and potentially other analytes. The resultant information is derived without painful physical insult to the patient and can trend changes in these blood analytes in order to predict the need for intervention. Previous IRB approved clinical trials over the last 10 years at SUNY Upstate Medical University using this method demonstrated useful performance for blood glucose. We propose to validate the same procedure here for hematocrit and protein. Since hematocrit and protein concentrations change during hemodialysis, that setting provides an ideal model to monitor these fluctuations over time and assess the precision and accuracy of the LighTouch device. This technique will not affect the usual dialysis treatment in any way. The subject will place one finger into the machine for exposure to a harmless incoming light signal. Sensors within the machine will detect light scatter allowing calculation of analytes and parameters such as total protein and hematocrit. Literally hundreds of individuals have experienced the LighTouch device since 1999 (beginning with SUNY HSC IRB #3920 (4/3/99) and since Crouse Hospital IRB Approved Protocol (8/23/07) with several subsequent renewals) and there has never been an unpleasant response or adverse outcome. The system is analogous to having a laser pointer shining on one's finger-tip. The ultimate goal of this research is to develop the device into a reliable non-invasive measure of critical blood analytes that can be determined quickly and accurately at the patient's bedside. Specific Objectives To ascertain if spectroscopic signals obtained from IVRS technology and methodology can be associated with hematocrit variations, plasma/red blood cell volume fluctuations, and potentially other blood analytes (whole blood protein) changes. Eligibility Criteria: Study subjects will be recruited from patients who receive routine hemodialysis at the University Dialysis Center. Prospective subjects who will be eligible include: 1. Adults age 18 and above; 2. Able and competent to fully understand and provide informed consent; 3. Stable on routine dialysis treatment for at least 3 months with no clinical evidence of on-going bleeding. Children and pregnant women are excluded from this Pilot study. The exclusion of children is due to the mechanical limitation of the LighTouch device probe, which is designed based on adult ergonomics and anthropometrics. The exclusion of pregnant
151 135 women is due to the unclear influence of laser exposure to both the mother and fetus at this point in time. Both populations will be studied in the future. Study Design: In parallel with the standard hemodialysis procedure, test subjects will use the LighTouch device to provide spectra of their blood in vivo during times of relatively rapid change in blood volume, ie at the onset and conclusion of dialysis. We will first collect several minutes of baseline IVRS spectra for each subject and then monitor the spectral variations for 30 min after initiation of the hemodialysis treatment. Since a typical hemodialysis procedure takes approximately 3.5 to 4 hours, subjects will have the option to suspend the IVRS measurements during the majority of the treatment session for convenience. Light scatter readings using the finger probe will resume for the final 30 minutes of the hemodialysis procedure. We anticipate that hematocrit, plasma/red blood cells volume, and protein analytes are changing most rapidly at the beginning and the end of a hemodialysis cycle when approximately 250 cc of priming volume is infused and removed respectively affording the opportunity to monitor this variation. Results will be compared with (1) the same signals observed over repeated measures during the baseline collection period; (2) an existing FDA approved commercial blood flow monitor CritLine (Hema Metrics, Kaysville, Utah); (3) hematocrit and total protein obtained through routine lab examinations within the standard of care. This strategy will be deemed valid if hematocrit and protein variations calculated from related spectroscopic signals are consistent with existing technology (#2) and gold standard lab evaluations (#3). Statistical Methods, Data Analysis and Interpretation: The LighTouch device has been shown to provide reliable and reproducible spectra of blood and tissues in human fingertips (J. Chaiken et al, Review of Scientific Instruments 81, (2010)). Therefore, a relatively small sample size of test subjects will be recruited in the pilot study. For statistical purposes, at least 3 5 subjects with different dialysis access, e.g. arteriovenous fistula, temporary dialysis catheters, gortex grafts, etc., will be included. Because of the continuous readings obtained with IVRS, thousands of data points will be obtained with each subject. Results will be interpreted as a comparison between expected hematocrit/plasma/red blood cells volumes variation patterns based on existing CritLine and lab values when compared with IVRS data. Confidentiality: All subject specific information will be de-identified during data acquisition by assigning a random number to each subjects data-collection tool. Strict adherence to HIPPA regulations will be followed. Data will be encrypted on a password protected laptop which will be housed in a locked location and accessible only to study personnel.
152 136 Study Flow Chart: Review potential subjects for inclusion criteria PI and co-investigators explain benefits/risks and protocol to potential subjects and seek informed consent Refusal Stop Agree to participate Introduce the LighTouch device to subject before onset of routine dialysis session and familiarize with finger sensor Take the blood pressure and pulse rate of the patients and engage their fingertips with the LighTouch apparatus Preparation and set ups for the routine hemodialysis procedure and CRIT- LINE monitor Expose the fingertip with laser for 100 sec and then start collecting baseline spectra Start IVRS measurements Start hemodialysis Stop IVRS measurements Stop hemodialysis Data processing, analysis, interpretation, and comparison with references Organize notes and CRIT-LINE readings taken while performing hemodialysis procedure
153 137 Anticipated Outcomes & Risks: The LighTouch device was used in four prior Upstate and SU IRB approved studies between March 1999 and March Several hundred of subjects were studied with the device and there were no incidents of sensation or major or minor long-term effects. The device uses near infrared light very similar to a CD player laser. Near infrared light is low energy, non-ionizing light very similar to light from a heat lamp. Although it exceeds the FDA exposure limit, we propose to use <200 mw/cm 2 since recently, Feld and coworkers at MIT/ Deaconess (J. Biomed. Opt. 10, (2005)) report results from an IRB approved study that used 300 mw (i.e. 0.3 Watts) while reporting minimal discomfort to only one of 24 volunteers and no histological damage to anyone as checked microscopically by a dermatologist. Our previous COPD related protocol at Crouse Hospital was allowed for 200 mw with no adverse effects observed. The IVRS is a noninvasive technology and the nature of this study is observatory with no intervention to the normal dialysis procedure. Therefore no risks or long term medical consequences are anticipated. The results of this study are expected to refine the capability of the LighTouch device in continuous noninvasive in vivo blood hematocrit, plasma/red blood cells volumes, and other blood bearing analytes monitoring. References: 1. Sauaia, F. A. Moore, E. E. Moore, K. S. Moser, R. Brennan, R. A. Read and P. T. Pons, "Epidemiology of trauma deaths: a reassessment," The Journal of trauma 38(2), (1995) 2. J. Chaiken, J. Goodisman, B. Deng, R. J. Bussjager and G. Shaheen, "Simultaneous, noninvasive observation of elastic scattering, fluorescence and inelastic scattering as a monitor of blood flow and hematocrit in human fingertip capillary beds," J Biomed Opt 14(5), (2009) 3. J. Chaiken and J. Goodisman, "On probing human fingertips in vivo using near-infrared light: model calculations," J Biomed Opt 15(3), (2010) 4. J. Chaiken, B. Deng, R. J. Bussjager, G. Shaheen, D. Rice, D. Stehlik, J. Fayos, "Instrument for near infrared emission spectroscopic probing of human fingertips in vivo, " Review of Scientific Instruments 81, (2010)
154 Appendix B: IACUC Protocol 138
155 139

156 140

157 141
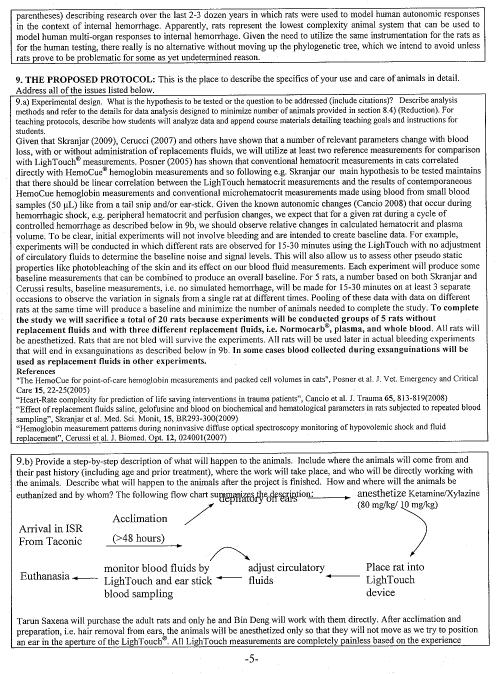
158 142

159 143
BIOPAC Blood Flow Monitor
 BIOPAC Blood Flow Monitor Technique - Laser Doppler Flowmetry (LDF) The LDF100C is a laser Doppler blood perfusion monitor used to measure real-time micro-vascular red blood cell perfusion in tissue. LDF100C
Pressure Sensitive Paint (PSP) / Temperature Sensitive Paint (TSP) Part 1
 / Temperature Sensitive Paint (TSP) Part 1") AerE 545 class notes #12 Pressure Sensitive Paint (PSP) / Temperature Sensitive Paint (TSP) Part 1 Hui Hu Department of Aerospace Engineering, Iowa State University Ames, Iowa 50011, U.S.A Introduction
AerE 545 class notes #12 Pressure Sensitive Paint (PSP) / Temperature Sensitive Paint (TSP) Part 1 Hui Hu Department of Aerospace Engineering, Iowa State University Ames, Iowa 50011, U.S.A Introduction
White Paper. Chemical Sensor vs NDIR - Overview: NDIR Technology:
 Title: Comparison of Chemical Sensor and NDIR Technologies TSN Number: 25 File:\\MII- SRV1\Metron\Bridge_Analyzers\Customer_Service_Documentation\White_Papers\25_G en EGA NDIR vs Chemical Sensor.docx Created
New Generation System M, leading the World in the Non-Invasive Measurement of Critical Real-Time Parameters.
 New Generation System M, leading the World in the Non-Invasive Measurement of Critical Real-Time Parameters. System M Spectrum Medicals total commitment to continuous product improvement is demonstrated
Lung Volumes and Capacities
 Lung Volumes and Capacities Normally the volume of air entering the lungs during a single inspiration is approximately equal to the volume leaving on the subsequent expiration and is called the tidal volume.
LOW PRESSURE EFFUSION OF GASES revised by Igor Bolotin 03/05/12
 LOW PRESSURE EFFUSION OF GASES revised by Igor Bolotin 03/05/ This experiment will introduce you to the kinetic properties of low-pressure gases. You will make observations on the rates with which selected
Real-time Analysis of Industrial Gases with Online Near- Infrared Spectroscopy
 Real-time Analysis of Industrial Gases with Online Near- Infrared Branch 5 Petrochemical, Biofuels Keywords Process, NIR, Gases, Gas Cell, Ethylene, Carbon Dioxide, Propane, Butane, Acetylene Summary Near-infrared
LOW PRESSURE EFFUSION OF GASES adapted by Luke Hanley and Mike Trenary
 ADH 1/7/014 LOW PRESSURE EFFUSION OF GASES adapted by Luke Hanley and Mike Trenary This experiment will introduce you to the kinetic properties of low-pressure gases. You will make observations on the
Chapter 13: The Behavior of Gases
 Chapter 13: The Behavior of Gases I. First Concepts a. The 3 states of matter most important to us: solids, liquids, and gases. b. Real Gases and Ideal Gases i. Real gases exist, ideal gases do not ii.
Equation 1: F spring = kx. Where F is the force of the spring, k is the spring constant and x is the displacement of the spring. Equation 2: F = mg
 1 Introduction Relationship between Spring Constant and Length of Bungee Cord In this experiment, we aimed to model the behavior of the bungee cord that will be used in the Bungee Challenge. Specifically,
DEPARTMENT OF THE NAVY DIVISION NEWPORT OFFICE OF COUNSEL PHONE: FAX: DSN:
 IMAVSBA WARFARE CENTERS NEWPORT DEPARTMENT OF THE NAVY NAVAL UNDERSEA WARFARE CENTER DIVISION NEWPORT OFFICE OF COUNSEL PHONE: 401 832-3653 FAX: 401 832-4432 DSN: 432-3653 Attorney Docket No. 85031 Date:
The Effect of a Seven Week Exercise Program on Golf Swing Performance and Musculoskeletal Screening Scores
 The Effect of a Seven Week Exercise Program on Golf Swing Performance and Musculoskeletal Screening Scores 2017 Mico Hannes Olivier Bachelor of Sport Science Faculty of Health Sciences and Medicine Bond
Indications for Use: Caution: Note:
 IV 1 2 IV This reference is to be used in conjunction with the Crit-Line IV Monitor User s Guide (P/N CL80050002). Refer to the User s Guide for a complete description of alerts, warnings, cautions, and
FLUORESCENCE DETERMINATION OF OXYGEN
 FLUORESCENCE DETERMINATION OF OXYGEN Objectives This experiment will familiarize the students with the principles of fluorescence quenching as well as the Ocean Optics FOXY Fiber Optic Sensor System. Spectra
MSD 96-Well MULTI-ARRAY and MULTI-SPOT Human Granulocyte Colony Stimulating Factor (hg-csf) Ultrasensitive Assay
 Ultrasensitive Assay") MSD 96-Well MULTI-ARRAY and MULTI-SPOT Human Granulocyte Colony Stimulating Factor (hg-csf) Ultrasensitive Assay Summary This assay measures Human Granulocyte Colony Stimulating Factor (G-CSF) in a 96-well
MSD 96-Well MULTI-ARRAY and MULTI-SPOT Human Granulocyte Colony Stimulating Factor (hg-csf) Ultrasensitive Assay Summary This assay measures Human Granulocyte Colony Stimulating Factor (G-CSF) in a 96-well
Biography. Abstract. Keywords. Body box, garments, validation, calibration, clean garments, IEST-RP-CC003.3, garment. Introduction and Scope
 NEW METHOD CALIBRATION FOR CALIBRATION OF A BODY BOX [Paper presented at IEST s ESTECH 2003 Conference, Phoenix, AZ, May 18-21] Rajan Jaisinghani, Technovation Systems, Inc. Biography Rajan (Raj) Jaisinghani
Gerald D. Anderson. Education Technical Specialist
 Gerald D. Anderson Education Technical Specialist The factors which influence selection of equipment for a liquid level control loop interact significantly. Analyses of these factors and their interactions
The physiological functions of respiration and circulation. Mechanics. exercise 7. Respiratory Volumes. Objectives
 exercise 7 Respiratory System Mechanics Objectives 1. To explain how the respiratory and circulatory systems work together to enable gas exchange among the lungs, blood, and body tissues 2. To define respiration,
Respiration. Figure 22: Schematic representation of the respiratory system
 Respiration One of the seven characteristics of something which is living is respiration. Strictly speaking, respiration is the process that takes place at cellular level and is one of three different
CHAPTER 16 %UHDWKLQJ*DV0L[LQJ3URFHGXUHV
 CHAPTER 16 %UHDWKLQJ*DV0L[LQJ3URFHGXUHV 16-1 INTRODUCTION 16-1.1 Purpose. The purpose of this chapter is to familiarize divers with the techniques used to mix divers breathing gas. 16-1.2 Scope. This chapter
CORESTA RECOMMENDED METHOD N 6
 CORESTA RECOMMENDED METHOD N 6 DETERMINATION OF VENTILATION DEFINITIONS AND MEASUREMENT PRINCIPLES (2015 Revision September 2016) 1. SCOPE This CORESTA Recommended Method specifies a method for the determination
A Hare-Lynx Simulation Model
 1 A Hare- Simulation Model What happens to the numbers of hares and lynx when the core of the system is like this? Hares O Balance? S H_Births Hares H_Fertility Area KillsPerHead Fertility Births Figure
Naval Postgraduate School, Operational Oceanography and Meteorology. Since inputs from UDAS are continuously used in projects at the Naval
 How Accurate are UDAS True Winds? Charles L Williams, LT USN September 5, 2006 Naval Postgraduate School, Operational Oceanography and Meteorology Abstract Since inputs from UDAS are continuously used
Kinetic-Molecular Theory
 GASES Chapter Eleven Kinetic-Molecular Theory! Recall that our only previous description of gases stated that gases completely fill and take the shape of their containers.! The Kinetic-Molecular Theory
A New Piston Gauge to Improve the Definition of High Gas Pressure and to Facilitate the Gas to Oil Transition in a Pressure Calibration Chain
 A New iston Gauge to Improve the Definition of High Gas ressure and to Facilitate the Gas to Oil Transition in a ressure Calibration Chain ierre Delajoud, Martin Girard DH Instruments, Inc. 4765 East Beautiful
Air-Sea Interaction Spar Buoy Systems
 DISTRIBUTION STATEMENT A: Distribution approved for public release; distribution is unlimited Air-Sea Interaction Spar Buoy Systems Hans C. Graber CSTARS - University of Miami 11811 SW 168 th Street, Miami,
Proceedings of Meetings on Acoustics
 Proceedings of Meetings on Acoustics Volume 9, 2010 http://acousticalsociety.org/ 159th Meeting Acoustical Society of America/NOISE-CON 2010 Baltimore, Maryland 19-23 April 2010 Session 1pBB: Biomedical
CHAPTER 1 INTRODUCTION TO RELIABILITY
 i CHAPTER 1 INTRODUCTION TO RELIABILITY ii CHAPTER-1 INTRODUCTION 1.1 Introduction: In the present scenario of global competition and liberalization, it is imperative that Indian industries become fully
PURE SUBSTANCE. Nitrogen and gaseous air are pure substances.
 CLASS Third Units PURE SUBSTANCE Pure substance: A substance that has a fixed chemical composition throughout. Air is a mixture of several gases, but it is considered to be a pure substance. Nitrogen and
Wave Motion. interference destructive interferecne constructive interference in phase. out of phase standing wave antinodes resonant frequencies
 Wave Motion Vocabulary mechanical waves pulse continuous periodic wave amplitude period wavelength period wave velocity phase transverse wave longitudinal wave intensity displacement amplitude phase velocity
Technical Note. Determining the surface tension of liquids by measurements on pendant drops
 Technical Note Pendant Drop Measurements Technical note: TN316e Industry section: all Author: FT, TW Date: 12/2010 Method: Drop Shape Analyzer DSA100 Keywords: Methods, surface tension, interfacial tension,
Water Treatment: Fundamentals and Practical Implications of Bubble Formation
 Water Treatment: Fundamentals and Practical Implications of Bubble Formation Paolo Scardina Thesis submitted to the Faculty of the Virginia Polytechnic Institute and State University In partial fulfillment
EXPERIMENTAL RESULTS OF GUIDED WAVE TRAVEL TIME TOMOGRAPHY
 18 th World Conference on Non destructive Testing, 16-20 April 2012, Durban, South Africa EXPERIMENTAL RESULTS OF GUIDED WAVE TRAVEL TIME TOMOGRAPHY Arno VOLKER 1 and Hendrik VOS 1 TNO, Stieltjesweg 1,
Homeostasis and Negative Feedback Concepts and Breathing Experiments 1
 Homeostasis and Negative Feedback Concepts and Breathing Experiments 1 I. Homeostasis and Negative Feedback Homeostasis refers to the maintenance of relatively constant internal conditions. For example,
Let s talk about Capnography
 Let s talk about Capnography This is one of a series of articles by Keith Simpson BVSc MRCVS MIET (Electronics) discussing the practical aspects of some common monitoring techniques. Capnometry is the
Test Plans & Test Results
 P09051 Oxygen Gas Sensor Test Plans & Test Results By: Samuel H Shin (EE), Jeremy Goodman (ue) Table of contents 1. TITLE: OXYGEN MEASUREMENT TEST VIA FABRICATED OXYGEN GAS SENSOR SYSTEM... 2 1.1. Introduction...
Figure 2: Principle of GPVS and ILIDS.
 Summary Bubbly flows appear in many industrial applications. In electrochemistry, bubbles emerge on the electrodes in e.g. hydrolysis of water, the production of chloride and as a side-reaction in metal
Undertow - Zonation of Flow in Broken Wave Bores
 Lecture 22 Nearshore Circulation Undertow - Zonation of Flow in Broken Wave Bores In the wave breaking process, the landward transfer of water, associated with bore and surface roller decay within the
Cover Page for Lab Report Group Portion. Pump Performance
 Cover Page for Lab Report Group Portion Pump Performance Prepared by Professor J. M. Cimbala, Penn State University Latest revision: 02 March 2012 Name 1: Name 2: Name 3: [Name 4: ] Date: Section number:
General Accreditation Guidance. User checks and maintenance of laboratory balances
 General Accreditation Guidance User checks and maintenance of laboratory balances January 2018 Copyright National Association of Testing Authorities, Australia 2010 All intellectual property rights in
Waves. harmonic wave wave equation one dimensional wave equation principle of wave fronts plane waves law of reflection
 Waves Vocabulary mechanical wave pulse continuous periodic wave amplitude wavelength period frequency wave velocity phase transverse wave longitudinal wave intensity displacement wave number phase velocity
ANALYTICAL SCALE HPLC AGILENT SYSTEMS OPERATIONAL QUALIFICATION
 ANALYTICAL SCALE HPLC AGILENT SYSTEMS OPERATIONAL QUALIFICATION Standard OQ Test Suite This document describes the test program for qualifying LC analytical-scale Agilent systems; the following table lists
This test shall be carried out on all vehicles equipped with open type traction batteries.
 5.4. Determination of hydrogen emissions page 1 RESS-6-15 5.4.1. This test shall be carried out on all vehicles equipped with open type traction batteries. 5.4.2. The test shall be conducted following
Application Note AN-107
 SPEC Sensor TM Characterization & Calibration Considerations Scope This document is provided to describe the considerations needed to characterize, calibrate, verify and validate the measurement performance
CDI Blood Parameter Monitoring System 500 A New Tool for the Clinical Perfusionist
 Original Article Blood Parameter Monitoring System 500 A New Tool for the Clinical Perfusionist David W. Fried, MS Ed, CCP; Joseph J. Leo, BS, CCP; Gabriel J. Mattioni, BS, CCP; Hasratt Mohamed, CCP; Raymond
DEVICES FOR FIELD DETERMINATION OF WATER VAPOR IN NATURAL GAS Betsy Murphy MNM Enterprises 801 N. Riverside Drive Fort Worth, Texas 76111
 INTRODUCTION Water vapor in natural gas has more than a substantial effect on the quality of the gas stream. Without quality measurement of water vapor the gas is basically not saleable. Contracts are
Underwater measurement of photosynthetically active radiation
 Underwater measurement of photosynthetically active radiation Mark Blonquist, Damon Nitzel, and Bruce Bugbee Apogee Instruments, Inc., Logan, Utah Introduction Quantum sensors (photosynthetically active
Vibration-Free Joule-Thomson Cryocoolers for Distributed Microcooling
 Vibration-Free Joule-Thomson Cryocoolers for Distributed Microcooling W. Chen, M. Zagarola Creare Inc. Hanover, NH, USA ABSTRACT This paper reports on an innovative concept for a space-borne Joule-Thomson
Undertow - Zonation of Flow in Broken Wave Bores
 Nearshore Circulation Undertow and Rip Cells Undertow - Zonation of Flow in Broken Wave Bores In the wave breaking process, the landward transfer of water, associated with bore and surface roller decay
1999 Microcomponents Technology SLYA017A
 Application Brief Number 001 1999 Microcomponents Technology SLYA017A IMPORTANT NOTICE Texas Instruments and its subsidiaries (TI) reserve the right to make changes to their products or to discontinue
Micro Channel Recuperator for a Reverse Brayton Cycle Cryocooler
 Micro Channel Recuperator for a Reverse Brayton Cycle Cryocooler C. Becnel, J. Lagrone, and K. Kelly Mezzo Technologies Baton Rouge, LA USA 70806 ABSTRACT The Missile Defense Agency has supported a research
Evaluating the Influence of R3 Treatments on Fishing License Sales in Pennsylvania
 Evaluating the Influence of R3 Treatments on Fishing License Sales in Pennsylvania Prepared for the: Pennsylvania Fish and Boat Commission Produced by: PO Box 6435 Fernandina Beach, FL 32035 Tel (904)
MEMORANDUM. Investigation of Variability of Bourdon Gauge Sets in the Chemical Engineering Transport Laboratory
 1 MEMORANDUM TO: FROM: Prof. Davis Hubbard Prof. Faith A. Morrison DATE: 22 April 2014 RE: Investigation of Variability of Bourdon Gauge Sets in the Chemical Engineering Transport Laboratory Introduction
Thermo Scientific Model 146i Principle of Operation
 Thermo Scientific Model 146i Principle of Operation The Model 146i Multi-gas Calibrator dilutes calibration gases to precise concentrations. The diluted gases are used to perform zero, precision and Level
Paper 2.2. Operation of Ultrasonic Flow Meters at Conditions Different Than Their Calibration
 Paper 2.2 Operation of Ultrasonic Flow Meters at Conditions Different Than Their Calibration Mr William Freund, Daniel Measurement and Control Mr Klaus Zanker, Daniel Measurement and Control Mr Dale Goodson,
Aalborg Universitet. Published in: Proceedings of Offshore Wind 2007 Conference & Exhibition. Publication date: 2007
 Aalborg Universitet Design Loads on Platforms on Offshore wind Turbine Foundations with Respect to Vertical Wave Run-up Damsgaard, Mathilde L.; Gravesen, Helge; Andersen, Thomas Lykke Published in: Proceedings
29th Monitoring Research Review: Ground-Based Nuclear Explosion Monitoring Technologies
 IMPROVED CALIBRATION AND OPERATION OF A STABLE-GAS QUANTIFICATION MANIFOLD AS PART OF A RADIOXENON COLLECTION SYSTEM ABSTRACT Richard M. Williams, James C. Hayes, and Randy R. Kirkham Pacific Northwest
Ti-Pure TITANIUM DIOXIDE DETERMINATION OF SLURRY RHEOLOGY METHOD: T WP
 Ti-Pure TITANIUM DIOXIDE DETERMINATION OF SLURRY RHEOLOGY METHOD: T4400.308.01.WP 1 TITANIUM DIOXIDE (Ti-Pure ) Rheology of Titanium Dioxide Slurries I. Principle Rheology is a measurement of the fluid
Advanced Test Equipment Rentals ATEC (2832) OMS 600
 OMS 600") Established 1981 Advanced Test Equipment Rentals www.atecorp.com 800-404-ATEC (2832) OMS 600 Continuous partial discharge monitoring system for power generators and electrical motors Condition monitoring
Established 1981 Advanced Test Equipment Rentals www.atecorp.com 800-404-ATEC (2832) OMS 600 Continuous partial discharge monitoring system for power generators and electrical motors Condition monitoring
Characterization and formulation of cocrystals
 Characterization and formulation of cocrystals Cocrystals can deliver unique physical properties, but taking full advantage of these improved properties requires a new approach to cocrystal formulation
SOLUTIONS Homework #1
 SOLUTIONS Homework #1 INTRODUCTION TO ENGINEERING IN MEDICINE AND BIOLOGY ECEN 1001- Fall 2003 R. Mihran Due Tuesday, 9/9/03 Question 1: a) Chapter 1 of the text discusses the fact that a significant fraction
MATRIX-MG Series. Innovation with Integrity. Automated High-Performance Gas Analyzers FT-IR
 MATRIX-MG Series Automated High-Performance Gas Analyzers Innovation with Integrity FT-IR The MATRIX-MG Series comprises three high-performance FT-IR gas analyzers in a compact and rugged housing. They
Laser-Induced Bubbles in Glycerol-Water Mixtures
 Laser-Induced Bubbles in Glycerol-Water Mixtures Allison R. McCarn, Erin M. Englert, and Gary A. Williams Department of Physics and Astronomy, University of California, Los Angeles, California 90095, USA
Unit II Problem 4 Physiology: Diffusion of Gases and Pulmonary Circulation
 Unit II Problem 4 Physiology: Diffusion of Gases and Pulmonary Circulation - Physical principles of gases: Pressure of a gas is caused by the movement of its molecules against a surface (more concentration
Level MEASUREMENT 1/2016
 Level MEASUREMENT 1/2016 AGENDA 2 A. Introduction B. Float method C. Displacer method D. Hydrostatic pressure method E. Capacitance method G. Ultrasonic method H. Radar method I. Laser method J. Level
CHAPTER 3 RESULTS AND DISCUSSION
 CHAPTER 3 RESULTS AND DISCUSSION The research included the development and verification of the earlier apparatus, and the collection and validation of moisture diffusion data under both isothermal and
INTRODUCTION TO THE SPECTROPHOTOMETER AND PIPETTING SKILLS
 INTRODUCTION TO THE SPECTROPHOTOMETER AND PIPETTING SKILLS Section A: Intro to the spectrophotometer A commonly used instrument in the analysis of cellular extracts is the Spectrophotometer. Today you
CHAPTER IV FINITE ELEMENT ANALYSIS OF THE KNEE JOINT WITHOUT A MEDICAL IMPLANT
 39 CHAPTER IV FINITE ELEMENT ANALYSIS OF THE KNEE JOINT WITHOUT A MEDICAL IMPLANT 4.1 Modeling in Biomechanics The human body, apart of all its other functions is a mechanical mechanism and a structure,
Improved Algorithm for Measurement of Blood Pressure based on a Laser Doppler Flowmetry Signal
 Master of Science Thesis in Biomedical Engineering Department of Biomedical Engineering, Linköping University, 2016 Improved Algorithm for Measurement of Blood Pressure based on a Laser Doppler Flowmetry
Operational Behaviour of Safety Valves with Constant Superimposed Backpressure
 Operational Behaviour of Safety Valves with Constant Superimposed Backpressure Arne Gastberg Albert Richter ARI-Armaturen GmbH & Co. KG When selecting spring loaded safety valves, an accurate knowledge
A Reliable and Tracer Gas Independent Leak Detector for Food Packages
 19 th World Conference on Non-Destructive Testing 2016 A Reliable and Tracer Gas Independent Leak Detector for Food Packages Silvio DECKER 1 1 INFICON GmbH, Köln, Germany Contact e-mail: Silvio.Decker@inficon.com-
Ultrasound Dose Calculations
 Ultrasound Dose Calculations One of the advantages of ultrasound therapy remains the reasonably broad range of trials from which effective treatment doses can be established. In principle, there is no
Gas Laws. Introduction
 Gas Laws Introduction In 1662 Robert Boyle found that, at constant temperature, the pressure of a gas and its volume are inversely proportional such that P x V = constant. This relationship is known as
Analysis of Shear Lag in Steel Angle Connectors
 University of New Hampshire University of New Hampshire Scholars' Repository Honors Theses and Capstones Student Scholarship Spring 2013 Analysis of Shear Lag in Steel Angle Connectors Benjamin Sawyer
Chapter 11 Waves. Waves transport energy without transporting matter. The intensity is the average power per unit area. It is measured in W/m 2.
 Energy can be transported by particles or waves: Chapter 11 Waves A wave is characterized as some sort of disturbance that travels away from a source. The key difference between particles and waves is
Laser Spectrometers for Online Moisture Measurement in Natural Gas. Ken Soleyn GE M&C
 Laser Spectrometers for Online Moisture Measurement in Natural Gas Ken Soleyn GE M&C ken.soleyn@ge.com Introduction TDLAS (Tunable Diode Lase Absorption Spectroscopy) Moisture Analyzers have become the
Autodesk Moldflow Communicator Process settings
 Autodesk Moldflow Communicator 212 Process settings Revision 1, 3 March 211. Contents Chapter 1 Process settings....................................... 1 Profiles.................................................
Chapter # 08 Waves. [WAVES] Chapter # 08
![Chapter # 08 Waves. [WAVES] Chapter # 08](/thumbs/94/121079132.jpg "Chapter # 08 Waves. [WAVES] Chapter # 08") Chapter # 08 Waves Q2) Write short answers of the following questions. i) What is the difference between progressive and stationary waves? Answer: Progressive Waves 1 Progressive waves are the result of
Chapter # 08 Waves Q2) Write short answers of the following questions. i) What is the difference between progressive and stationary waves? Answer: Progressive Waves 1 Progressive waves are the result of
NHL & NHLPA Future Goals Program Hockey Scholar TM
 Curriculum Guide NHL & NHLPA Future Goals Program Hockey Scholar TM Your local NHL team has made it all the way to the Stanley Cup Final and now you just need to win 4 games to bring home the cup! You
INSTRUMENT INSTRUMENTAL ERROR (of full scale) INSTRUMENTAL RESOLUTION. Tutorial simulation. Tutorial simulation
 INSTRUMENTAL RESOLUTION. Tutorial simulation. Tutorial simulation") Lab 1 Standing Waves on a String Learning Goals: To distinguish between traveling and standing waves To recognize how the wavelength of a standing wave is measured To recognize the necessary conditions
Lab 1 Standing Waves on a String Learning Goals: To distinguish between traveling and standing waves To recognize how the wavelength of a standing wave is measured To recognize the necessary conditions
A review of best practices for Selection, Installation, Operation and Maintenance of Gas meters for Flare Applications used for Managing facility
 A review of best practices for Selection, Installation, Operation and Maintenance of Gas meters for Flare Applications used for Managing facility mass balance and compliance 1. What, When and Why? 2. Flare
Temperature, salinity, density, and the oceanic pressure field
 Chapter 2 Temperature, salinity, density, and the oceanic pressure field The ratios of the many components which make up the salt in the ocean are remarkably constant, and salinity, the total salt content
Understanding How the Appearance of Optical Fiber Splices Relates to Splice Quality
 Understanding How the Appearance of Optical Fiber Splices Relates to Splice Quality Douglas Duke & David Mansperger Fusion Splicing Systems, AFL, Duncan, SC Doug.Duke@AFLglobal.com David.Mansperger@AFLglobal.com
EXPLORING MOTIVATION AND TOURIST TYPOLOGY: THE CASE OF KOREAN GOLF TOURISTS TRAVELLING IN THE ASIA PACIFIC. Jae Hak Kim
 EXPLORING MOTIVATION AND TOURIST TYPOLOGY: THE CASE OF KOREAN GOLF TOURISTS TRAVELLING IN THE ASIA PACIFIC Jae Hak Kim Thesis submitted for the degree of Doctor of Philosophy at the University of Canberra
Acoustical Modeling of Reciprocating Compressors With Stepless Valve Unloaders
 Acoustical Modeling of Reciprocating Compressors With Stepless Valve Unloaders Kelly Eberle, P.Eng. Principal Engineer keberle@betamachinery.com Brian C. Howes, M.Sc., P.Eng. Chief Engineer bhowes@betamachinery.com
Online gas monitoring by using Raman spectroscopy
 NEXTLAB Conference, 2-4 April 2014 Online gas monitoring by using Raman spectroscopy Yamina OUABBAS H. Lucas 2, J. P. Viricelle 1, S. Grimaldi 3, B. Allard-Breton 3 1 Ecole Nationale Supérieure des Mines,
E. Agu, M. Kasperski Ruhr-University Bochum Department of Civil and Environmental Engineering Sciences
 EACWE 5 Florence, Italy 19 th 23 rd July 29 Flying Sphere image Museo Ideale L. Da Vinci Chasing gust fronts - wind measurements at the airport Munich, Germany E. Agu, M. Kasperski Ruhr-University Bochum
Wind Flow Validation Summary
 IBHS Research Center Validation of Wind Capabilities The Insurance Institute for Business & Home Safety (IBHS) Research Center full-scale test facility provides opportunities to simulate natural wind conditions
An investigation of kinematic and kinetic variables for the description of prosthetic gait using the ENOCH system
 An investigation of kinematic and kinetic variables for the description of prosthetic gait using the ENOCH system K. OBERG and H. LANSHAMMAR* Amputee Training and Research Unit, University Hospital, Fack,
Modeling the Dependency of Oxygen Saturation Levels in Tissue on the Blood Flow of Capillary Units
 Modeling the Dependency of Oxygen Saturation Levels in Tissue on the Blood Flow of Capillary Units University of Western Ontario Department of Medical Biophysics Ryan Divigalpitiya Supervisor: Dr. Dan
A SURVEY OF 1997 COLORADO ANGLERS AND THEIR WILLINGNESS TO PAY INCREASED LICENSE FEES
 Executive Summary of research titled A SURVEY OF 1997 COLORADO ANGLERS AND THEIR WILLINGNESS TO PAY INCREASED LICENSE FEES Conducted by USDA Forest Service Rocky Mountain Research Station Fort Collins,
Chem 110 General Principles of Chemistry
 CHEM110 Worksheet - Gases Chem 110 General Principles of Chemistry Chapter 9 Gases (pages 337-373) In this chapter we - first contrast gases with liquids and solids and then discuss gas pressure. - review
Engineering Note. Algorithms. Overview. Detailed Algorithm Description. NeoFox Calibration and Measurement. Products Affected: NeoFox
 Engineering Note Topic: NeoFox Calibration and Measurement Products Affected: NeoFox Date Issued: 04/18/2011 Algorithms Overview NeoFox is a dynamic measurement system that has been designed to work with
Drilling Efficiency Utilizing Coriolis Flow Technology
 Session 12: Drilling Efficiency Utilizing Coriolis Flow Technology Clement Cabanayan Emerson Process Management Abstract Continuous, accurate and reliable measurement of drilling fluid volumes and densities
Instruction Guide for using Dive Tables (draft)
") Instruction Guide for using Dive Tables (draft) Revision 1.0 US Navy Tables Rev 6 December 2009 Landis Bullock This guide is intended to supplement the instruction of a qualified SCUBA Instructor, not
Instruction Guide for using Dive Tables (draft) Revision 1.0 US Navy Tables Rev 6 December 2009 Landis Bullock This guide is intended to supplement the instruction of a qualified SCUBA Instructor, not
Chapter 11 Waves. Waves transport energy without transporting matter. The intensity is the average power per unit area. It is measured in W/m 2.
 Chapter 11 Waves Energy can be transported by particles or waves A wave is characterized as some sort of disturbance that travels away from a source. The key difference between particles and waves is a
Section 1 Types of Waves. Distinguish between mechanical waves and electromagnetic waves.
 Section 1 Types of Waves Objectives Recognize that waves transfer energy. Distinguish between mechanical waves and electromagnetic waves. Explain the relationship between particle vibration and wave motion.
The Bubble Dynamics and Pressure Field Generated by a Seismic Airgun
 The Bubble Dynamics and Pressure Field Generated by a Seismic Airgun Katrina L. de Graaf B.Eng(Naval Architecture)(Hons) National Centre for Maritime Engineering and Hydrodynamics Australian Maritime College
The Ideal Gas Constant
 Chem 2115 Experiment # 8 The Ideal Gas Constant OBJECTIVE: This experiment is designed to provide experience in gas handling methods and experimental insight into the relationships between pressure, volume,
Applying Hooke s Law to Multiple Bungee Cords. Introduction
 Applying Hooke s Law to Multiple Bungee Cords Introduction Hooke s Law declares that the force exerted on a spring is proportional to the amount of stretch or compression on the spring, is always directed