Graphing Your Motion
|
|
|
- Edmund Small
- 6 years ago
- Views:
Transcription
1 Graphing Your Motion LabQuest 35 Graphs made using a Motion Detector can be used to study motion. A Motion Detector measures the distance to the nearest object in front of it by emitting and receiving pulses of ultrasound. A calculator can use distance and time measurements to calculate velocity. In this experiment, you will use a LabQuest and a Motion Detector to produce graphs of your own motion. OBJECTIVES In this experiment, you will Use a LabQuest and a Motion Detector to measure distance and velocity. Use a LabQuest to produce graphs of your motion. Analyze and interpret graphs of your motion. MATERIALS LabQuest LabQuest App Vernier Motion Detector meter stick masking tape PROCEDURE Part A Position 1. Find an open area at least 4 m long in front of a wall. Use short strips of masking tape on the floor to mark distances of 1 m, 2 m, and 3 m from the wall. You will be measuring your position from the Motion Detector in your hands to the wall. 2. If your Motion Detector has a switch, set it to Normal. Connect the Motion Detector to DIG 1 of LabQuest and choose New from the File menu. If you have an older sensor that does not auto-id, manually set up the sensor. Physical Science with Vernier 35-1

2 LabQuest On the Meter screen, tap Length, then change the data-collection length to 10 seconds. Select OK. 4. Open the hinge on the Motion Detector. When you collect data, hold the Motion Detector so the round, metal detector is always pointed directly at the wall. Sometimes you will have to walk backwards. 5. Explore data collection for a position vs. time graph. a. Take a starting position one meter in front of the wall. b. Signal your partner to start data collection. c. When the fast clicking begins, walk to a distance of two meters and stop. d. After data collection is complete, a graph of position vs. time will be displayed. Discuss the results with your partners. 6. Repeat Step 5 walking more quickly this time. 7. Match a position vs. time graph. a. Choose Motion Match New Position Match from the Analyze menu. A target graph will be displayed for you to match. b. Examine the graph and plan what you will do to match it. c. Take your starting position in front of the Motion Detector. d. Have your partner start data collection. e. Move according to your plan. f. Examine the graph of the results. g. In Processing the Data (Part A), sketch a graph of your results in the space provided. Important: Your sketch should show both the target line produced by LabQuest and the graph of your motion. Then, in the space provided, describe what you had to do to match the first graph. h. If you would like to try matching the same graph, start data collection again when you are ready to stalk walking. If you are ready to match another graph, proceed to Step Repeat Step 7 so everyone in your group has a chance to match a position vs. time graph. Note: When you choose Motion Match New Position Match again, a new target graph will be displayed. PROCESSING THE DATA (PART A) 1. Describe the difference between the two lines on your graph made in Steps 5 6. Explain why the lines are different. 2. How would the graph change if you walked toward the Motion Detector rather than away from it? Test your answer using the Motion Detector Physical Science with Vernier
3 3. What did you have to do to match the graph you were given in Step 7? Graphing Your Motion 4. Sketch a position vs. time graph for a car that starts slowly, moves down the street, stops at a stop sign, and then starts slowly again. Part B Velocity 9. Choose Motion Match Remove Match from the Analyze menu. Change the y-axis to velocity. To do this, tap the y-axis label and select Velocity. 10. Make a graph of your motion when you walk away from the detector with constant velocity. To do this, stand about 1 m from the wall. Have your lab partner start data collection, then walk slowly away from the Motion Detector. After data collection is complete, a graph of velocity vs. time will be displayed. Discuss the results with your partners. 11. Repeat Step 10 walking more quickly this time. 12. LabQuest can also generate random target velocity graphs for you to match. Choose Motion Match New Velocity Match from the Analyze menu to view a velocity target graph. 13. Write down how you would walk to produce this target graph. Sketch or print a copy of the graph. 14. To test your prediction, choose a starting position and stand at that point. Have your partner start data collection. When you hear the Motion Detector begin to click rapidly, walk in such a way that the graph of your motion matches the target graph on the screen. It will be more difficult to match the velocity graph than it was for the position graph. 15. If you were not successful and want to match the same target graph again, start data collection when you are ready to start walking. Repeat this process until your motion closely matches the graph on the screen. Print or sketch the graph with your best attempt. 16. Repeat Steps so everyone in your group has a chance to match a velocity vs. time graph. Note: When you choose Motion Match New Velocity Match again, a new target graph will be displayed. Physical Science with Vernier 35-3
4 LabQuest 35 PROCESSING THE DATA (PART B) 5. Describe the difference between the two lines on the graph made in Step Explain why the lines are different. 6. What is the definition of velocity? 7. What did you have to do to match the graph you were given in Step 12? How well does your graph agree with the graph provided? Velocity 8. Sketch a velocity vs. time graph for a person who walks, stops for a few seconds, and then starts to run. Time Velocity Time 35-4 Physical Science with Vernier

5 Mapping the Ocean Floor LabQuest 19 Oceanographers, marine geologists, and archeologists use echo sounders to investigate objects below the surfaces of bodies of water. An echo sounder consists of a transducer that sends out and receives sound waves. A signal is sent out and bounces back from a submerged surface. Scientists use the speed of sound in water and the time it takes for the signal to bounce back to calculate the depth of the object. The deeper the object, the longer it takes for the sound to return. A map of the ocean floor is made by sending out a series of pings in a grid pattern and recording the depths. Echo sounders use different frequencies to map different things on the ocean floor. Sonar, which is short for sound navigation ranging, is the name given to this echo sounding system. It was invented during World War I to detect submarines. The Vernier Motion Detector works in a similar manner. In this activity, you will use a Motion Detector to map objects on a simulated ocean floor. OBJECTIVES In this experiment, you will Use a Motion Detector to measure distances. Map simulated ocean floors. MATERIALS LabQuest LabQuest App Motion Detector 1 m board masking tape 2 or more boxes PRE-LAB QUESTIONS 1. What else can you think of that measures distance by sending out a sound signal? 2. What factors make it difficult to study the ocean floor directly? Earth Science with Vernier 19-1
6 LabQuest 19 PROCEDURE Part I Ocean Floor 1 Figure 1 1. Prepare the Motion Detector for data collection. a. Get the board that will act as the support for your Motion Detector. b. Tape or clamp the Motion Detector to one end of the board. Make sure that the round screen of the Motion Detector is not covered and is pointing downward. c. Place the board with the Motion Detector flat on your table as shown in Figure Prepare the ocean floor for data collection. a. Place the box on the floor underneath the Motion Detector. Note: The Motion Detector must be at least 40 cm from the top of the box. b. Line up the Motion Detector so that when it is moved along the table edge it will pass over the box. 3. If your Motion Detector has a switch, set it to Normal. Connect the Motion Detector to DIG 1 of LabQuest and choose New from the File menu. If you have an older sensor that does not auto-id, manually set up the sensor. 4. On the Meter screen, tap Rate. Change the data-collection rate to 4 samples/second and the data-collection length to 15 seconds. 5. Collect distance data. a. Move the board to position the Motion Detector to the left of the box. b. When everything is ready, start data collection. Then, slowly slide the board across the tabletop so that the Motion Detector passes over and past the box. 6. Determine and record the distance to the floor. a. Identify a flat portion of the graph that represents the floor. Tap and drag your stylus across the region that represents the floor to select the region. b. Choose Statistics Position from the Analyze menu. c. Record the mean (average) distance to the floor in meters. d. Choose Statistics Position from the Analyze menu to turn off the statistics Earth Science with Vernier
7 7. Determine and record the distance to the box. Mapping the Ocean Floor a. Identify the flat portion of the graph that represents the box. b. Tap and drag your stylus across the region that represents the box to select the region. c. Choose Statistics Position from the Analyze menu. d. Record the mean (average) distance to the box in meters. 8. Sketch and label your graph. Part II Ocean Floor 2 9. Prepare Ocean Floor 2. a. Set up two boxes in the shape of steps. The tallest box must be at least 40 cm from the Motion Detector. b. Repeat Steps 5 8. Be sure to record all three distances. Part III Hidden Ocean Floor 10. Your teacher will have a hidden ocean floor for you to measure. Repeat Steps 5 8 for the concealed object or objects Graph Sketches Ocean Floor 1 Ocean Floor 2 Hidden Ocean Floor DATA Ocean floor 1 single box Ocean floor 2 box 1 Ocean floor 2 box 2 Hidden ocean floor box 1 Hidden ocean floor box 2 Hidden ocean floor box 3 (if detected) Distance to floor (m) Distance to box (m) Box height (m) Earth Science with Vernier 19-3
8 LabQuest 19 PROCESSING THE DATA 1. In the space provided in the data table above, find the height of each box. Do this by subtracting the distance to the box from the distance to the floor. 2. Which was your best result? Why do you think it was better than your other results? 3. How did the shape of your graph compare to the actual object(s) in each case? Explain. EXTENSIONS 1. Try other hidden ocean-floor arrangements. 2. Research the sonar process and compare it to what you did in this activity Earth Science with Vernier
9

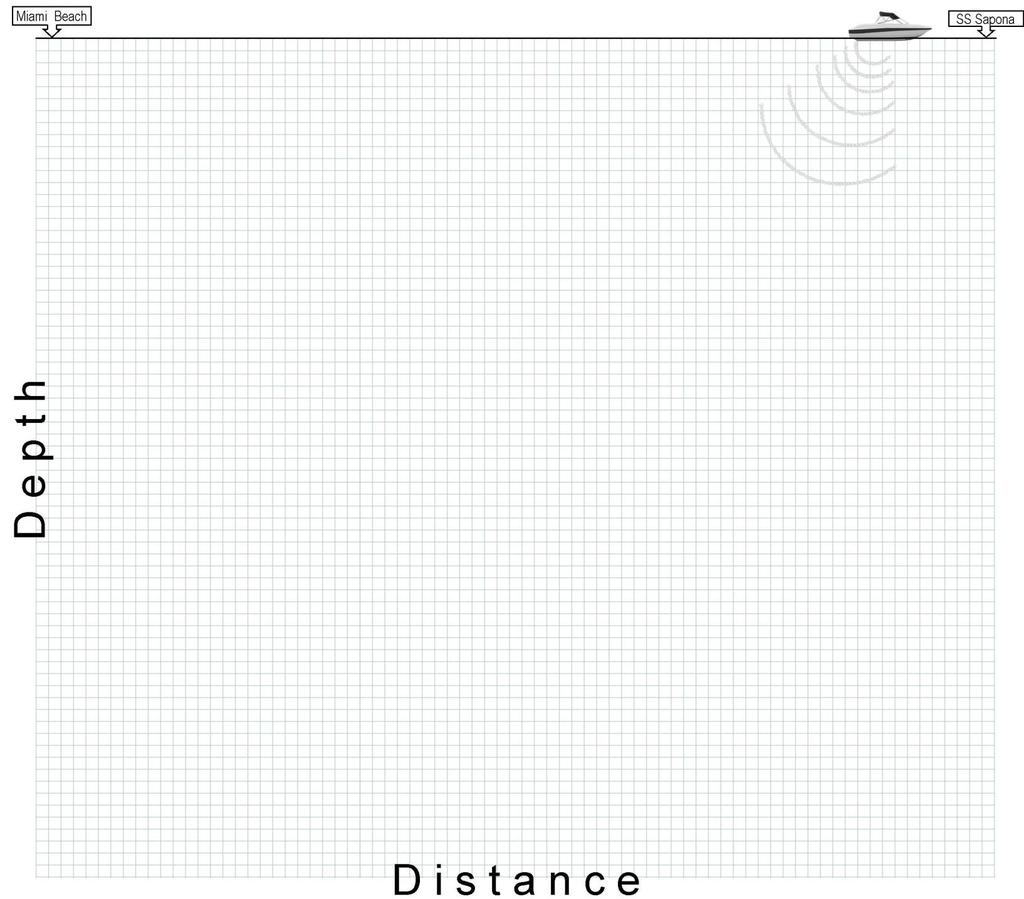
10 LESSON PLAN: How Does Sonar Work? Mapping the Ocean Floor DEVELOPED BY: Kenneth A. Nagel, Apex High School, Academy of Information Technology, Apex NC, 2011 Naval Historical Foundation Teacher Fellowship ACTIVITY NAME: Ocean Floor Mapping Worksheet OBJECTIVE: Provide students a basic understanding of how sonar (SOund NAvigation and Ranging) is used to map the ocean floor. Students use a simple calculation to determine the depth of the ocean floor at 15 points from Miami Beach eastward to the wreck of the SS Sapona in the Bahama Islands. This is a total distance of 53 miles. MATERIALS: Data Map with sonar duration times listed (last page) Graph Paper (following page). INSTRUCTIONS: Ocean Floor Mapping Worksheet In 1926, the SS Sapona, a ship used to transport alcohol during prohibition, ran aground during a hurricane. Today the ship sits almost 54 miles from the beaches of Miami, yet even at this distance the water is so shallow that much of Sapona s remains are well above the surface. You can actually see the remains of the ship on Google Earth at these latitude and longitude coordinates: 25 39'2.22"N 79 17'36.17"W. How is it that fifty-four miles out from the beach this ship is sitting in such shallow water? How deep is the water where the ship lies if it can still be seen above the waves? Does the water stay shallow all the way from Miami Beach to the wreck? With sonar sounding data it s possible for us to sketch a profile of what the ocean floor looks like between Key Biscayne Beach and the wreck of the Sapona. The map on the following page shows the Atlantic Ocean from Miami Beach eastward to the Bahamas. Imagine, you are on a boat traveling out to scuba dive the wreck of the Sapona. Along the way the boat you are traveling on is collecting sonar data. The sonar is emitting a soundwave and tells you how long it took the sound to travel to the bottom and bounce back. Using the times listed on the map, construct a cross-section showing the slope of the ocean. Remember, in saltwater sound travels at 5000 ft/sec.
11 .

12 Data Map: The 17 positions on the map shown here give the length of time that a sonar pulse took to travel to the ocean floor and back to the sonar array onboard your boat. Use the formula discussed in the article to determine the depth at each location. Transfer the data to the Ocean floor worksheet to create an ocean floor profile.
13 Mapping the Ocean Floor Instructions and data sheet Background: Name: The surface of the oceans covers an area of more than 12 million square km! Did you ever wonder what was below the surface of all that water? Many early explorers did, and they used several methods to try to determine the shape of the ocean floor. At one time, sailors tied weights to the end of ropes and lowered them to the ocean floor, marked the distance when the rope hit bottom, and then measured that distance. You can imagine what a slow process this was! In the early 1900s, sonar was invented by a French scientist. He used this technology to get sound wave readings of the ocean floor. This was a great discovery because it allowed scientists to get faster and more accurate readings. A device called an echo sounder is simply aimed downward, at which point it gives off a sound signal. The sound signal travels to the ocean floor and bounces, or echoes, off the surface. The device picks up the echo and then computes the ocean depth at that point. To do this calculation yourself, all you need to know is the speed of sound in water (1,500 m/s), and the time it took for the sound signal to echo. During this activity, you will use this method to construct a map for two different regions of the ocean floor. Procedures: Atlantic Profile: 1. Compute the Total Distance Traveled by the Sound by multiplying the Time for the Signal to Return by the Speed of Sound (1,500 m/s). 2. Record this distance on the Data Table on the back of this sheet. 3. Divide your Total Distance Traveled by 2 to get your Ocean Depth in meters. 4. Record this depth on the Data Table. 5. Plot the Distance from Beach (x-axis) and the Ocean Depth (y-axis) in meters using the Atlantic Profile graph on the Mapping the Ocean Floor Lab handout. Sea level (Depth = 0 meters) is the line already shown on the graph. 6. Once the points are plotted, connect the points and shade in the profile of the ocean floor. 7. Label the following ocean floor features on your graph. Use page 48 and 49 as a reference. Continental Shelf, Continental Slope, Continental Rise, Island, Mid-ocean ridge, Abyssal Plain Pacific Profile: 1. Using the Pacific Profile data on the Mapping the Ocean Floor Lab Lab Sheet Plot the Distance from Beach on the x-axis and the Ocean Depth on the y-axis. For this set of data, the depth has already been calculated for you. 2. Once the points are plotted, connect the points and shade in the profile of the ocean floor. 3. Label the following ocean floor features on your graph. Use page 48 and 49 as a reference. Continental Slope (directly next to shore), Seamount, Trench (the deep one) 4. This map shows both the Philippine Plate and Pacific Plate. Within the oceanic crust beneath the ocean floor, sketch what you think the subduction zone would look like. (Show one plate going under the other.) 5. In this activity you created two different ocean floor profiles. One major difference between the two profiles is the scale of the distance from the shore. Even though both of your profile pictures cover the width of your paper, they do NOT represent the same distance. You need to get a sense of how each of the two profiles compare to each other. Determine how much of your Atlantic Profile would be covered by the Pacific Profile. To do this, draw a bracket [bracket] at the bottom of your Atlantic profile representing the width of your Pacific Profile. * When finished graphing both profiles, answer all discussion questions on the back of your * graph sheet using complete sentences.
14 Data for Atlantic Profile Data for Pacific Profile Distance from Beach Time for Signal Total Distance Ocean Depth (meters) Distance from Ocean Depth (km) to Return Traveled (meters) (Total Distance 2) Beach (km) (meters) (seconds) (Time x 1500 m/s) above level above sea level
15 Name: Period: Date: Atlantic Profile Mapping the Ocean Floor Lab Pacific Profile
16 Discussion Questions: Answer in complete sentences. Atlantic Profile 1. What two pieces of information are needed to determine ocean depth? 2. Describe how a seamount could become an island. ALSO, describe how an island could become a seamount. 3. The island on your graph for the Atlantic Profile is part of a chain of islands located near 26 W and 38 N latitude. Use a globe or world map to locate and identify this island chain. 4. For the first data table, once you have found the total distance traveled by the sound wave, why is it necessary to divide it by 2? (*HINT: Think about where the sound signal has to travel.) Pacific Profile 5. This profile shows the seafloor at the Marianas Trench, the deepest known point in any of the world s oceans. Describe what s happening in this area to create this trench. Please write the name of the trench on your profile. 6. Explain how the seamount (between 72km and 128 km from the shore) may have formed near this trench. Comparing the two: 7. How do the two profiles differ from one another? Be descriptive of each region of ocean floor. 8. In oceanography, the edges of the continents are referred to as margins. Depending on what type of plate activity is occurring, a margin may be considered an active margin or a passive margin. Based on your knowledge of plate tectonics, which of the two profiles would you consider to be active, and which would be passive. Explain your reasoning in detail, referring to each profile. Then, label each profile as either passive or active on each graph.
17 Reflectivity of Light LabQuest 23 Light is reflected differently from various surfaces and colors. An understanding of these differences is useful in choosing colors and materials for clothing, in choosing colors for cars, and in city planning. Astronomers use reflectivity differences to help determine characteristics of planets. In this experiment, you will be measuring the percent reflectivity (albedo) of various colors. You will measure reflection values from paper of various colors using a Light Sensor and then compare these values to the reflection value of aluminum foil. The aluminum foil will arbitrarily be assigned a reflectivity of 100 percent. You will then calculate percent reflectivity using the relationship % Reflectivity = value for paper value for aluminum 100 OBJECTIVES In this experiment, you will Use a LabQuest and a Light Sensor to measure reflected light. Calculate percent reflectivity of various colors. Make conclusions using the results of the experiment. MATERIALS LabQuest LabQuest App Light Sensor ring stand and utility clamp white paper black paper 2 other pieces of colored paper aluminum foil Figure 1 Physical Science with Vernier 23-1
18 LabQuest 23 PROCEDURE 1. If your Light Sensor has a switch, set it to 600 lux. Connect the sensor to LabQuest and choose New from the File menu. If you have an older sensor that does not auto-id, manually set up the sensor. 2. Set up the mode. a. On the Meter screen, tap Mode. Change the mode to Selected Events. b. Select Average over 10 seconds and select OK. 3. Start data collection. 4. Use a utility clamp and ring stand to fasten the Light Sensor 5 cm from and perpendicular to a piece of colored paper as shown in Figure 1. The classroom lights should be on. 5. When the light reading displayed on the screen is stable, tap Keep. Note: LabQuest will be taking data for the next 10 seconds. 6. Obtain a second piece of colored paper. Repeat Steps 4 5. Continue with this method to collect and record readings for aluminum, black, white, and two other colors. 7. Stop data collection and tap Table to view the data. Record the reflection values in your data table. DATA Color Aluminum Black White Reflection Value PROCESSING THE DATA 1. Calculate the percent reflectivity (albedo) of each color using the formula given in the introduction. Show your work and record the results in the table below. Color Aluminum Black White Percent Reflectivity 100% 23-2 Physical Science with Vernier
19 Reflectivity of Light 2. Which color, other than aluminum, has the highest reflectivity? 3. Which color has the lowest reflectivity? 4. What materials might give a planet a high reflectivity or albedo? Explain. 5. Does the planet Earth have high reflectivity? Why? EXTENSION 1. Design an experiment to determine if there is a relationship between reflected light and heat absorbed by various colors or materials. Physical Science with Vernier 23-3
20 Name Date Heart Rate and Body Position Computer 25 Does the position of your body affect your heart rate? In this experiment, you will use a Heart Rate Monitor to measure your heart rate while sitting, lying, and standing. You will then use your results to answer the question. OBJECTIVES In this experiment, you will Use a Hand-Grip Heart Rate Monitor or Exercise Heart Rate Monitor to measure your heart rate while sitting, lying, and standing. Analyze the results of your experiment. Compare your results with those of other students. Answer the question posed in the introduction. MATERIALS computer Vernier computer interface saline solution in dropper bottle (for use with Exercise HR Monitor) PROCEDURE Vernier Hand-Grip Heart Rate Monitor or Vernier Exercise Heart Rate Monitor 1. Plug the receiver module of the Heart Rate Monitor into the Vernier computer interface. 2. Start the Vernier data-collection program and open the file 25 Heart Rate Position from the Middle School Science with Vernier folder. Using a Hand-Grip Heart Rate Monitor Use the following instructions if you are using a Hand-Grip Heart Rate Monitor. 3. Stand facing your table or lab bench. Grasp the handles of the Hand-Grip Heart Rate Monitor your hands. The fingertips of each hand should be placed on the reference areas of the handles. The left hand grip and the receiver are both marked with an alignment arrow. When collecting data, be sure that the arrow labels on each of these devices are in alignment (see Figure 1). The reception range of the plug-in receiver is cm, or about 3 feet. Evaluation copy Figure 1 Middle School Science with Vernier 25-1
21 Heart Rate and Body Position Computer Click to determine that the sensor is functioning correctly. There will be a 15 second delay while data are collected before the first point is plotted on the upper graph. Thereafter, a point will be plotted every 5 seconds. The readings should be consistent and within the normal range of the individual, usually between 55 and 90 beats per minute. 5. If the readings appear unreasonable, reposition your fingers and check the sensor and receiver alignment. 6. Once it is apparent that the sensor is functioning correctly, click and continue with Step 11. Using an Exercise Heart Rate Monitor Use the following instructions if you are using an Exercise Heart Rate Monitor. 7. Depending upon your size, select a small or large size elastic strap. Secure one of the plastic ends of the elastic strap to the transmitter belt. It is important that the strap provide a snug fit of the transmitter belt. 8. Wet each of the electrodes (the two textured oval areas on the underside of the transmitter belt) with 3 drops of saline solution. 9. Secure the transmitter belt against the skin directly over the base of the rib cage. The POLAR logo on the front of the belt should be centered. Adjust the elastic strap to ensure a tight fit. Figure Take the receiver module of the Heart Rate Monitor in your right hand and have a seat well away from the computer monitor. Face away from the computer monitor and your classmates. Sit quietly. Remember that the receiver must be within 80 cm of the transmitter in the Heart Rate Monitor belt. Part I Sitting Heart Rate 11. Once the subject has been seated quietly for about a minute, a partner should click to begin monitoring heart rate. Part II Reclining Heart Rate 12. After 4 minutes of data collection have gone by, the subject should recline on a clean surface or table and facing away from the computer monitor and all classmates. Note: A partner should tell the subject when it is time to recline. Part III Standing Heart Rate 13. After 8 minutes of data collection have gone by, the subject should stand facing away from the computer monitor and all classmates. A partner should again tell the subject when it is time to stand. Data collection will automatically stop after 12 minutes Middle School Science with Vernier
22 Name Date Part IV Recording Data 14. Determine the subject s sitting heart rate. a. Move the mouse pointer to the 2 minute line. b. Press the mouse button and hold it down as you drag across the graph to the 4 minute line to select this part of the graph. c. Click the Statistics button,. Record the Mean (average) sitting heart rate (in bpm). 15. Determine the subject s reclining heart rate. a. Move the mouse pointer to the 6 minute line. b. Press the mouse button and hold it down as you drag across the graph to the 8-minute line to select this part of the graph. c. Click the Statistics button,. Record the Mean (average) reclining heart rate (in bpm). 16. Determine the subject s standing heart rate. a. Move the mouse pointer to the 10 minute line. b. Press the mouse button and hold it down as you drag across the graph to the 12-minute line to select this part of the graph. c. Click the Statistics button,. Record the Mean (average) standing heart rate (in bpm). d. Close all of the Statistics boxes. 17. Print copies of the graph as directed by your teacher. 18. Repeat Steps 3 17 with other members of the team serving as subjects. Middle School Science with Vernier 25-3
23 Heart Rate and Body Position Computer 25 DATA Subject s name Sitting heart rate (beats/min) Reclining heart rate (beats/min) Standing heart rate (beats/min) Difference between sitting and reclining heart rates (beats/min) Difference between standing and sitting heart rates (beats/min) Difference between standing and reclining heart rates (beats/min) PROCESSING THE DATA 1. In the space provided in the data table, subtract to calculate the difference between the sitting and reclining heart rates for each subject. 2. Subtract to find the difference between the standing and sitting heart rates for each subject. 3. Subtract to find the difference between the standing and reclining heart rates for each subject. 4. Does the position of your body affect your heart rate? 5. Compare your results with those of other students. 6. Try to explain the results of the experiment. EXTENSION 1. Measure your heart rate while standing on your head. Compare the results with your other results Middle School Science with Vernier

24 Vernier Lab Safety Instructions Disclaimer THIS IS AN EVALUATION COPY OF THE VERNIER STUDENT LAB. This copy does not include: Safety information Essential instructor background information Directions for preparing solutions Important tips for successfully doing these labs The complete Middle School Science with Vernier lab manual includes 38 labs and essential teacher information. The full lab book is available for purchase at: Vernier Software & Technology S.W. Millikan Way Beaverton, OR Toll Free (888) (503) FAX (503)
25 Dual-Range Force Sensor An Inclined Plane LabQuest 22 An inclined plane is a slanted surface used to raise objects. The sloping floor of a theater, a road over a mountain, and a ramp into a building are examples of inclined planes. In this experiment, you will use a Force Sensor to measure the force needed to lift an object and the force needed to pull the same object up an inclined plane. You will then calculate and compare work done in raising the object to the same height by lifting it and pulling it up an inclined plane. OBJECTIVES In this experiment, you will Use a LabQuest and a Force Sensor to measure force. Compare forces. Calculate work and efficiency. Make conclusions using the results of the experiment. MATERIALS LabQuest LabQuest App Vernier Force Sensor smooth board (at least 0.5 m long) wooden block with a hook books metric ruler paper clip Figure 1: Using the Dual-Range Force Sensor PROCEDURE Using an Inclined Plane 1. Set up a stack of books as shown in Figures Get a board and set up an inclined plane as shown in Figures 1. Measure the length of the board (in meters) and record this value in the data table. Measure and record the height of the inclined plane (in meters). 3. Get a wooden block with a hook on one end. Partly straighten a paper clip leaving a hook at each end. Use the paper clip to attach the wooden block to your Force Sensor. 4. Set the range switch on the Force Sensor to 10 N. Connect the Force Sensor to LabQuest and choose New from the File menu. If you have an older sensor that does not auto-id, manually set up the sensor. Physical Science with Vernier 22-1
26 LabQuest Slowly pull the wooden block up the inclined plane. The Force Sensor should be held parallel to, and about 2 cm above, the surface of the inclined plane, as shown in Figure 1. Once the wooden block is moving at a steady rate, start data collection. Continue pulling the wooden block until data collection is complete (5.0 seconds). 6. Determine the mean (average) force (in N). a. After data collection is complete, choose Statistics from the Analyze menu. b. Record the mean (average) force (in N). Without an Inclined Plane 7. Now determine the force needed to lift the wooden block. a. Repeat Step 5 as you slowly lift the block the same height as the inclined plane. b. Repeat Step 6 and record the value of the force (in N) needed to lift the wooden block. DATA TABLE Length of inclined plane Height of inclined plane Force (average) to pull the block up the inclined plane Force (average) to lift the block m m N N PROCESSING THE DATA 1. Does it take more or less force to move the block using the inclined plane? Explain. 2. A formula for calculating work is W = F X d where W = work (in N m), F = force (in N), and d = distance (in m). Use this formula to calculate work done using the inclined plane. Here, F = the average force needed to pull the block up the inclined plane and d = the length of the inclined plane Physical Science with Vernier
27 An Inclined Plane 3. Calculate work done in lifting the block. Here, F = the average force needed to lift the block and d = the height of the inclined plane. 4. Does it take more or less work to move the block using the inclined plane? 5. A formula for calculating the efficiency of a machine is efficiency = work output work input 100 Use this formula to calculate the efficiency of the inclined plane. Here, work output = the work done lifting the block, and work input = the work done pulling the block up the inclined plane. 6. What causes the difference between the work needed to pull the block up the inclined plane and the work to lift it to the same height? Discuss ways to decrease this difference. EXTENSIONS 1. Study how changing the inclined plane slope changes force. 2. Design an experiment to study your answer to Question Determine the mechanical advantage of the inclined plane. Physical Science with Vernier 22-3
28
29
30
31
32
33

34
35
36
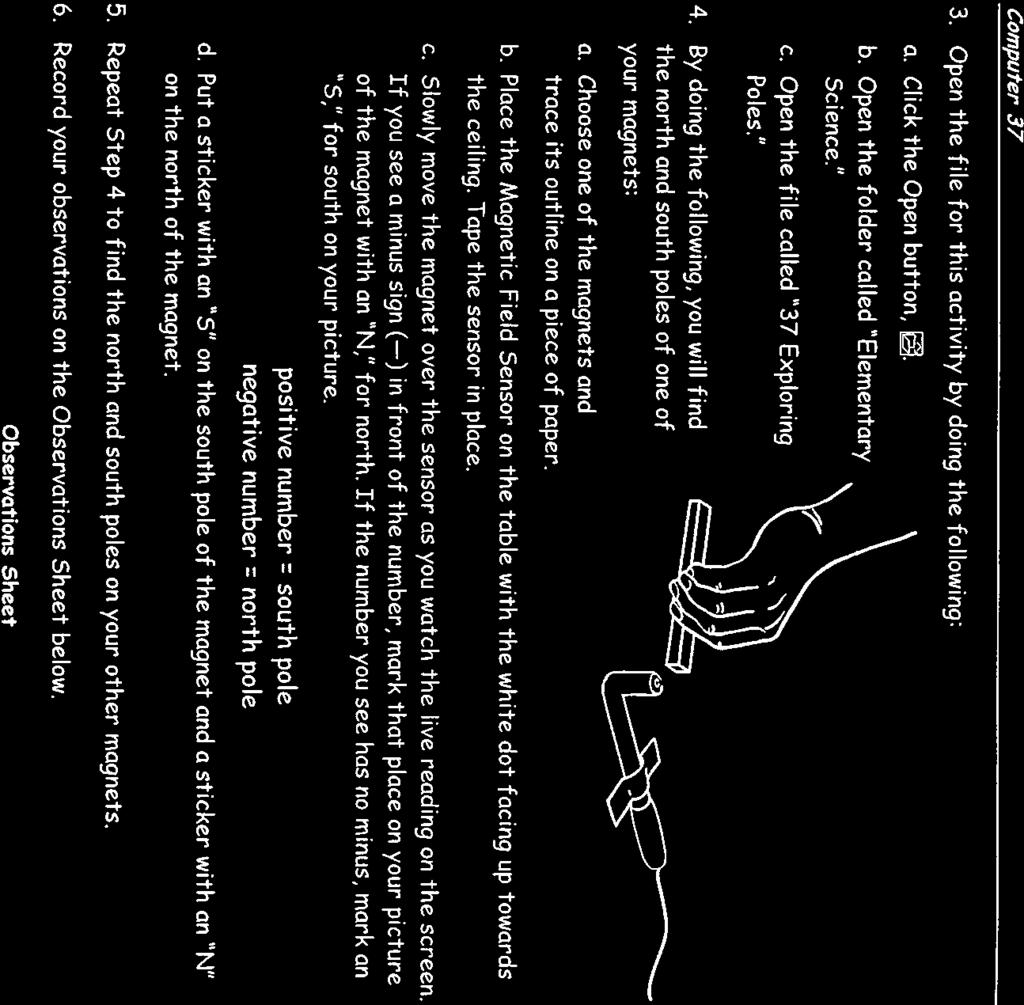
37
38
39
40 Gas Pressure and Volume LabQuest 30 In this simple experiment, you will use a Gas Pressure Sensor and a gas syringe to study the relationship between gas pressure and volume. Temperature and amount of gas will be kept constant. The results will be expressed in words, in a table, with a graph, and with a mathematical equation. These are four methods commonly used by scientists to communicate information. This experiment is similar to one first done by Robert Boyle in 1662 without the use of a calculator, of course. The relationship you will discover is known as Boyle s law. OBJECTIVES In this experiment, you will Use a LabQuest, a Gas Pressure Sensor, and a gas syringe to measure the pressure of an air sample at several different volumes. Make a table of the results. Make a graph of the data. Predict the pressure at other volumes. Describe the relationship between gas pressure and volume with words and with a mathematical equation. MATERIALS LabQuest LabQuest App Vernier Gas Pressure Sensor 20 ml gas syringe PROCEDURE Figure 1 1. Prepare the Pressure Sensor and an air sample for data collection. a. Connect the Pressure Sensor to LabQuest and choose New from the File menu. If you have an older sensor that does not auto-id, manually set up the sensor. b. A 20 ml syringe is already connected to the sensor and set at the 10 ml mark for you. Physical Science with Vernier 30-1
41 LabQuest Set up the mode. a. On the Meter screen, tap Mode. Change the mode to Events with Entry. b. Enter the Name (Volume) and Units (ml). Select OK. 3. You are now ready to collect pressure and volume data. It is easiest if one person takes care of the gas syringe and another operates LabQuest. a. Start data collection. b. Move the piston so the front edge of the inside black ring is positioned at the 5.0 ml line on the syringe (see Figure 2). Hold the piston firmly in this position until the pressure value displayed on the screen stabilizes. c. Tap Keep and enter 5, the gas volume (in ml). Select OK to store this pressure-volume data pair. Figure 2 d. To collect another data pair, move the syringe to 7.5 ml. When the pressure reading stabilizes, tap Keep and enter 7.5 as the volume. Select OK. e. Continue with this procedure using volumes of 10.0, 12.5, 15.0, 17.5, and 20.0 ml. f. Stop data collection. 4. To examine the data pairs on the displayed graph, tap any data point. As you tap each data point, the pressure and volume values are displayed to the right of the graph. Record the pressure (round to the nearest 0.1 kpa) and volume data values in your data table. 5. (optional) Print a graph of pressure vs. volume. DATA Volume (ml) Pressure (kpa) 30-2 Physical Science with Vernier
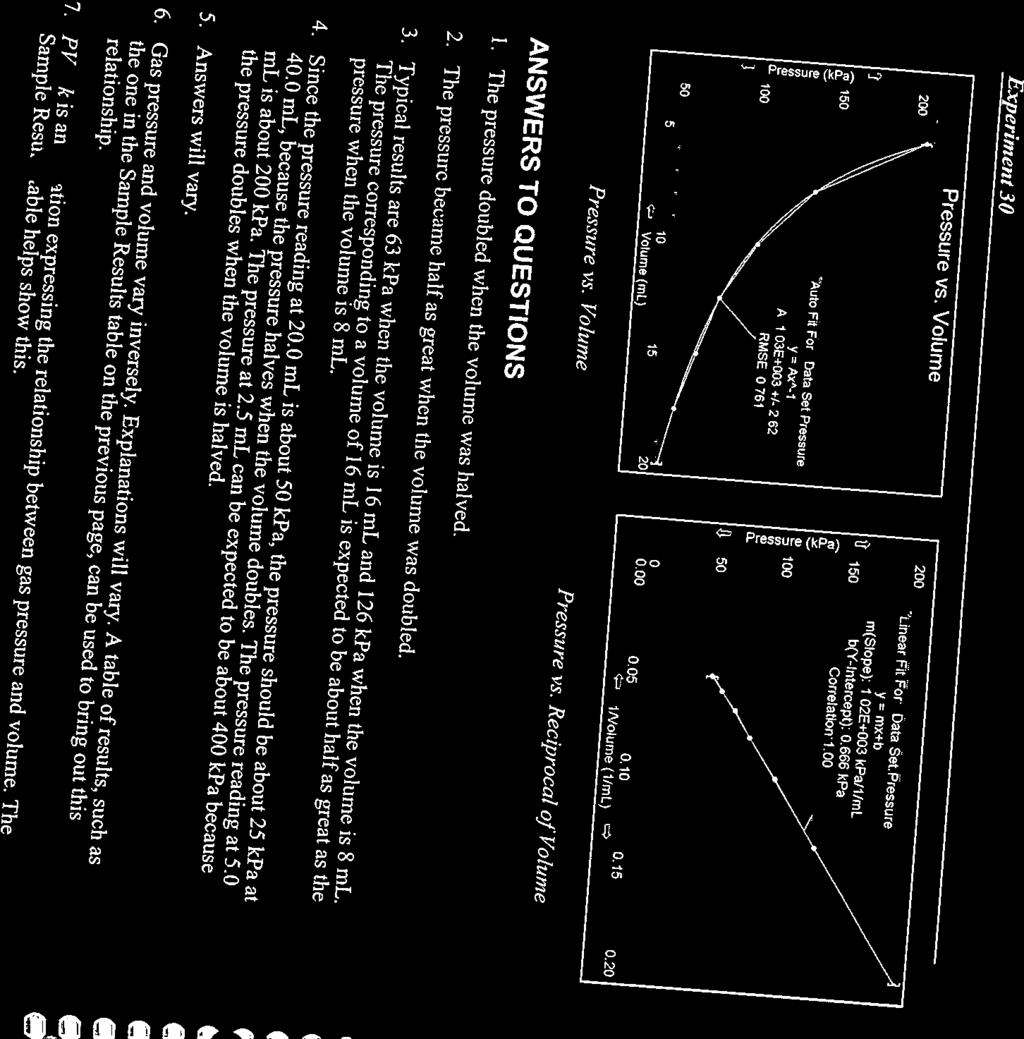
42 PROCESSING THE DATA Gas Pressure and Volume 1. See the data table and note the pressure when the volume is 10.0 ml, and when the volume is 5.0 ml. What happened to pressure when the volume was halved? 2. See the data table and note the pressure when the volume is 20.0 ml. Compare this pressure to the pressure when the volume is 10.0 ml. What happened to the pressure when the volume was doubled? 3. From your data and graph, what is the pressure when the volume is 16 ml? 8 ml? How do these values compare? 4. What would the pressure be at 40.0 ml? At 2.5 ml? Explain how you determined these values. 5. What is the relationship between gas pressure and volume (Boyle s law) in words? Physical Science with Vernier 30-3
43 LabQuest Do gas pressure and volume vary directly or inversely? Explain. 7. Write an equation to express the relationship between gas pressure and volume. Use the symbols P, V, and k. EXTENSIONS 1. Repeat the experiment using a pure, noncorrosive gas, such as oxygen, butane, or carbon dioxide. Compare the results with your results for air. 2. Plot P versus 1/V and discuss the graph. You can do this using graph paper, Vernier Logger Pro Physical Science with Vernier
44
45
46
47
48
49
50
51
52
53
54

55
56
57
58
59
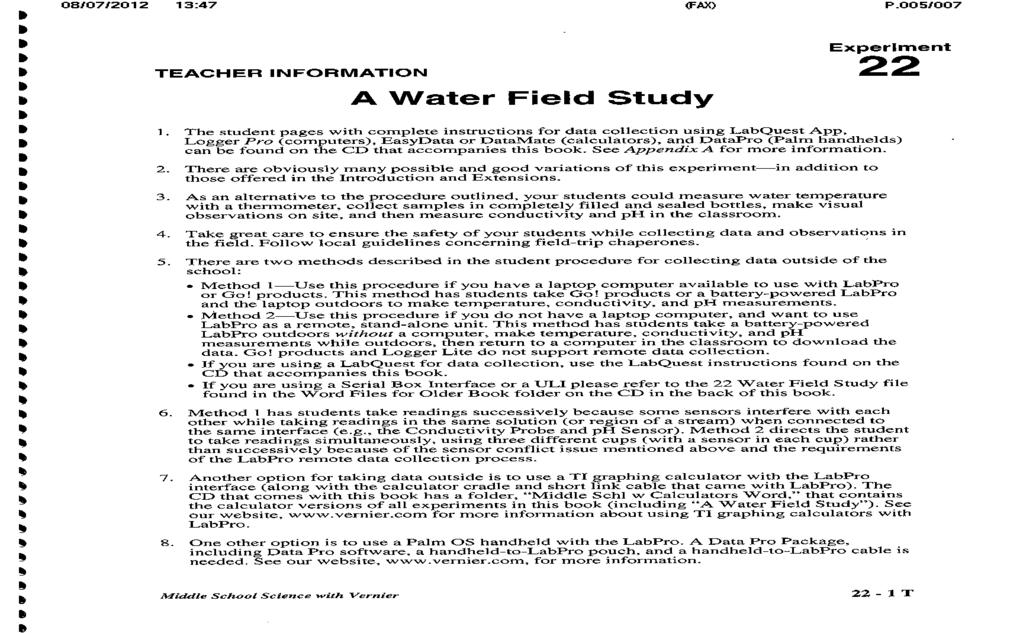
60 Name Date A Water Field Study LabQuest 22 When finding water quality, there are many measurements that can be made. In this experiment, you will measure water temperature, conductivity, and ph. Water temperatures in streams can range from 0 C in the winter to above 30 C in the summer. Cooler water in a stream is generally considered healthier than warmer water. Problems generally occur when changes in water temperature are noted along one stream on the same day. Some sample data are listed in Table 1. Table 1: Water Temperatures of Selected Rivers Site Season Temperature ( C) Season Temperature ( C) Hudson River, Poughkeepsie, NY Winter 5 Summer 25 Mississippi River, Memphis, TN Winter 7 Summer 29 Rio Grande, El Paso, TX Winter 16 Summer 21 Missouri River, Garrison Dam, ND Winter 3 Summer 14 Willamette River, Portland, OR Winter 9 Summer 22 Conductivity values in lakes and streams are typically found to be in the range of 100 to 500 µs/cm. In areas of especially hard water or high salinity, conductivity values may be as high as 1000 µs/cm. Drinking water usually has conductivity in the 50 to 1000 µs/cm range. Some sample data are listed in Table 2. Table 2: Conductivity in Selected Rivers Site Season Conductivity (µs/cm) Season Conductivity (µs/cm) Hudson River, Poughkeepsie, NY Spring 180 Fall 238 Mississippi River, Memphis, TN Spring 266 Fall 440 Rio Grande, El Paso, TX Spring 1020 Fall 1220 Sacramento River, Keswick, CA Spring 142 Fall 120 Ohio River, Benwood, WV Spring 600 Fall 286 The best ph range for most aquatic organisms is ph 6.5 to 8.2. The ph values of streams and lakes are usually between ph 7 and 8. Hard water will often have ph values between 7.5 and 8.5. When doing this experiment, you might choose to compare water quality at two or more points on the same stream, in two or more different streams or lakes, or in a lake and a stream that runs into it. Middle School Science with Vernier 22-1
61 A Water Field Study LabQuest 22 OBJECTIVES In this experiment, you will Use a Temperature Probe to measure water temperature. Use a Conductivity Probe to measure the conductivity of water. Use a ph Sensor to measure the ph of water. Make visual observations at the test sites. Compare water quality. MATERIALS LabQuest LabQuest App Temperature Probe Vernier Conductivity Probe Vernier ph Sensor colorless plastic bottle plastic cup or beaker Figure 1 PROCEDURE Part I Measuring Temperature 1. Connect the Temperature Probe to LabQuest and choose New from the File menu. If you have an older sensor that does not auto-id, manually set up the sensor. 2. Fill the plastic bottle with water taken below the water surface at a point one meter from the shore. CAUTION: Take all necessary precautions to ensure your safety! 22-2 Middle School Science with Vernier
62 Name Date 3. Measure the water temperature. a. Place the Temperature Probe into the sample. b. Gently move the probe in the water and note the temperature reading on the screen. c. When the temperature stops changing, record the reading in your data table. d. Disconnect the Temperature Probe. Part II Measuring Conductivity 4. Set the Conductivity Probe on the µs/cm position. Connect the Conductivity Probe to LabQuest and choose New from the File menu. If you have an older sensor that does not auto-id, manually set up the sensor. 5. Measure the conductivity of the same water sample. a. Place the Conductivity Probe into the water. Briefly swirl the probe in the water. b. Once the conductivity reading is steady, record the value in your data table. Part III Measuring ph 6. Disconnect the Conductivity Probe and connect the ph Sensor to LabQuest. Choose New from the File menu. If you have an older sensor that does not auto-id, manually set up the sensor. 7. Measure the ph of the same water sample. a. Remove the ph Sensor from its protective container and store the container safely aside. b. Rinse the ph Sensor using a plastic cup or beaker and water from the site. c. Place the ph Sensor into the water sample. Briefly swirl the ph Sensor in the water. d. Once the ph is steady, record the reading. Return the ph Sensor to its container. 8. Note and record the clarity (clearness) of the water sample. 9. Make and record other observations (concerning algae, plants, water critters, animals, flow rate, etc.) related to water quality at the site. 10. Repeat Steps 1 9 at one or more other sites. Middle School Science with Vernier 22-3
63 A Water Field Study LabQuest 22 DATA AND OBSERVATIONS Site Temperature ( C) Conductivity (µs/cm) ph Clarity Other observations PROCESSING THE DATA 1. How did the water quality at the different sites compare? 2. What differences did you find? Explain the differences. 3. What similarities did you find? Explain the similarities. 4. At which site was the water best? Explain why it was the best. 5. What new ideas for testing water quality did you come up with while doing this experiment? 22-4 Middle School Science with Vernier
64 Name Date EXTENSIONS 1. Test water quality at the same site at different times. 2. Test the effects of rain or snow on water quality. 3. Test water quality at sites upstream and downstream from a wastewater treatment plant. Middle School Science with Vernier 22-5
65
66
67
Boyle s Law: Pressure-Volume Relationship in Gases
 Boyle s Law: Pressure-Volume Relationship in Gases Computer 6 The primary objective of this experiment is to determine the relationship between the pressure and volume of a confined gas. The gas we use
Air Ball! Evaluation copy
 Air Ball! Computer 24 Do you ever wonder how the National Basketball Association (NBA) decides how much air should be in the basketballs used during a game? The NBA measures the pressure inside the ball
Exploring the Properties of Gases. Evaluation copy. 10 cm in diameter and 25 cm high)
") Exploring the Properties of Gases Computer 30 The purpose of this investigation is to conduct a series of experiments, each of which illustrates a different gas law. You will be given a list of equipment
Exploring the Properties of Gases Computer 30 The purpose of this investigation is to conduct a series of experiments, each of which illustrates a different gas law. You will be given a list of equipment
Boyle s Law. Pressure-Volume Relationship in Gases. Figure 1
 Boyle s Law Pressure-Volume Relationship in Gases The primary objective of this experiment is to determine the relationship between the pressure and volume of a confined gas. The gas we use will be air,
Evaluation copy. Wind Chill. computer OBJECTIVES MATERIALS
 Wind Chill Computer 28 A nice breeze can cool you down on a hot day or send a chill through you on a day that is already cold. Wind carries heat away from our bodies making us feel cooler. This phenomenon
Aerobic Respiration. Evaluation copy
 Aerobic Respiration Computer 17 Aerobic cellular respiration is the process of converting the chemical energy of organic molecules into a form immediately usable by organisms. Glucose may be oxidized completely
Boyle s Law: Pressure-Volume. Relationship in Gases
 Boyle s Law: Pressure-Volume Relationship in Gases The primary objective of this experiment is to determine the relationship between the pressure and volume of a confined gas. The gas we use will be air,
Heating of Land and Water. Evaluation copy. lamp with a 100 W (or greater) bulb. 2 Temperature Probes 2 one-hole stoppers 2 pans beaker.
 bulb. 2 Temperature Probes 2 one-hole stoppers 2 pans beaker.") Name Date Heating of Land and Water Computer 2 How fast land and water heat and cool influences our weather. In Part I of this experiment, you will heat sand and water. You will use two Temperature Probes
Name Date Heating of Land and Water Computer 2 How fast land and water heat and cool influences our weather. In Part I of this experiment, you will heat sand and water. You will use two Temperature Probes
Evaluation copy. Interdependence of Plants and Animals. computer OBJECTIVES MATERIALS
 Interdependence of Plants and Animals Computer 14 Plants and animals share many of the same chemicals throughout their lives. In most ecosystems, O 2, CO 2, water, food and nutrients are exchanged between
CBL Lab GAS PRESSURE & VOLUME MATHEMATICS CURRICULUM. High School. Florida Sunshine State Mathematics Standards
 MATHEMATICS CURRICULUM High School CBL Lab Florida Sunshine State Mathematics Standards GAS PRESSURE & VOLUME John Klimek, Math Coordinator Curt Witthoff, Math/Science Specialist Dr. Benjamin Marlin Superintendent
Boyle s Law: Pressure-Volume Relationship in Gases. PRELAB QUESTIONS (Answer on your own notebook paper)
") Boyle s Law: Pressure-Volume Relationship in Gases Experiment 18 GRADE LEVEL INDICATORS Construct, interpret and apply physical and conceptual models that represent or explain systems, objects, events
Boyle s Law: Pressure-Volume Relationship in Gases Experiment 18 GRADE LEVEL INDICATORS Construct, interpret and apply physical and conceptual models that represent or explain systems, objects, events
Evaluation copy. Vapor Pressure of Liquids. computer OBJECTIVES MATERIALS
 Vapor Pressure of Liquids Computer 10 In this experiment, you will investigate the relationship between the vapor pressure of a liquid and its temperature. When a liquid is added to the Erlenmeyer flask
Exploring the Properties of Gases
 Exploring the Properties of Gases LabQuest 30 The purpose of this investigation is to conduct a series of experiments, each of which illustrates a different gas law. You will be given a list of equipment
Boyle s Law: Pressure-Volume Relationship in Gases
 Boyle s Law: Pressure-Volume Relationship in Gases Experiment The primary objective of this experiment is to determine the relationship between the pressure and volume of a confined gas. The gas we use
Dissolved Oxygen in Water. Evaluation copy. Table 1. Temperature Range ( C) Trout Smallmouth bass Caddisfly larvae
 Trout Smallmouth bass Caddisfly larvae") Dissolved Oxygen in Water Computer 12A Although water is composed of oxygen and hydrogen atoms, biological life in water depends upon another form of oxygen molecular oxygen. Oxygen is used by organisms
Dissolved Oxygen in Water Computer 12A Although water is composed of oxygen and hydrogen atoms, biological life in water depends upon another form of oxygen molecular oxygen. Oxygen is used by organisms
Air Ball! LabQuest Vernier Gas Pressure Sensor Vernier Motion Detector basketball stopper with needle, stopper stem and tubing attached meter stick
 Air Ball! LabQuest 24 Do you ever wonder how the National Basketball Association (NBA) decides how much air should be in the basketballs used during a game? The NBA measures the pressure inside the ball
Lab #12:Boyle s Law, Dec. 20, 2016 Pressure-Volume Relationship in Gases
 Chemistry Unit 6:States of Matter & Basic Gas Laws Name Lab Partner Lab #12:Boyle s Law, Dec. 20, 2016 Pressure-Volume Relationship in Gases Purpose: The primary objective of this experiment is to determine
Heating of Land and Water
 Heating of Land and Water Experiment 8 How fast land and water heat and cool influences our weather. In Part I of this experiment, you will heat sand and water. You will use two Temperature Probes to see
Boyle s Law: Pressure-Volume Relationship in Gases
 Boyle s Law: Pressure-Volume Relationship in Gases The primary objective of this experiment is to determine the relationship between the pressure and volume of a confined gas. The gas we will use is air,
Ball Toss. Vernier Motion Detector
 Experiment 6 When a juggler tosses a ball straight upward, the ball slows down until it reaches the top of its path. The ball then speeds up on its way back down. A graph of its velocity vs. time would
Exploring the Properties of Gases
 Computer 30 The purpose of this investigation is to conduct a series of experiments, each of which illustrates a different gas law. You will be given a list of equipment and materials and some general
PRESSURE-TEMPERATURE RELATIONSHIP IN GASES
 PRESSURE-TEMPERATURE RELATIONSHIP IN GASES LAB PS2.PALM INTRODUCTION Gases are made up of molecules that are in constant motion and exert pressure when they collide with the walls of their container. The
What a Drag! Evaluation copy. Make observations and predictions about shoes. Measure the force needed to pull different shoes across a surface.
 What a Drag! Computer 29 Why do you have to wear tennis shoes to your physical education class? Have you ever worn slippery-soled dress shoes? In this lab, you will observe the differences between the
Vapor Pressure of Liquids
 Experiment 10 In this experiment, you will investigate the relationship between the vapor pressure of a liquid and its temperature. When a liquid is added to the Erlenmeyer flask shown in Figure 1, it
Name Student Activity
 Open the TI-Nspire document Boyles_Law.tns. In this activity, you will use a Gas Pressure Sensor to measure the pressure of an air sample inside a syringe. Using graphs, you will apply your results to
Mapping a Magnetic Field. Evaluation copy. Figure 1: Detecting the magnetic field around a bar magnet
 Mapping a Magnetic Field Experiment 16 The region around a magnet where magnetic forces can be detected is called a magnetic field. All magnets, no matter what their shape, have two poles labeled north
Vapor Pressure of Liquids
 Vapor Pressure of Liquids In this experiment, you will investigate the relationship between the vapor pressure of a liquid and its temperature. When a liquid is added to the Erlenmeyer flask shown in Figure
Introduction. Objectives. Hazards. Procedure
 Experiment: Exploring Gases Note to Students: Check with your instructor to see which parts of this lab (Parts A, B, or C) you will complete. Introduction Gases are made up of molecules that are in constant
Respiratory Response to Physiologic Challenges. Evaluation copy
 Respiratory Response to Physiologic Challenges Computer 20 The respiratory cycle of inspiration and expiration is controlled by complex mechanisms involving neurons in the cerebral cortex, brain stem,
Engineering Design Challenge. Mapping the Ocean Floor
 Engineering Design Challenge Project Title: Project Source: Project Submitter: Mapping the Ocean Floor NOAA, http://tinyurl.com/boydlek STEM Improvement Lesson Development Team Grade Level/Subject: Math,
(Lab Interface BLM) Acceleration
 Acceleration") Purpose In this activity, you will study the concepts of acceleration and velocity. To carry out this investigation, you will use a motion sensor and a cart on a track (or a ball on a track, if a cart
Purpose In this activity, you will study the concepts of acceleration and velocity. To carry out this investigation, you will use a motion sensor and a cart on a track (or a ball on a track, if a cart
Add this important safety precaution to your normal laboratory procedures:
 Student Activity Worksheet Speed and Velocity Are You Speeding? Driving Question What is speed and how is it related to velocity? Materials and Equipment For each student or group: Data collection system
LABORATORY INVESTIGATION
 LABORATORY INVESTIGATION MEASURING THE RATE OF PHOTOSYNTHESIS Light and Photosynthesis About 2.5-3 billion years ago a new chemical process, photosynthesis, was evolved by a unicellular life form. This
Vapor Pressure of Liquids
 Vapor Pressure of Liquids In this experiment, you will investigate the relationship between the vapor pressure of a liquid and its temperature. When a liquid is added to the Erlenmeyer flask shown in Figure
Ideal gas law. Introduction
 Ideal gas law Introduction We think of a gas as a collection of tiny particles in random, thermal motion. When they collide with the sides of a container, they exert a force on the container walls. The
Gas Pressure Volume Relationships Laboratory Simulation
 Gas Pressure Volume Relationships Laboratory Simulation Name Lab Section Problem Statement: How are the pressure and volume of a gas sample related? How do pressure/volume relationships of different gases
Transpiration. DataQuest OBJECTIVES MATERIALS
 Transpiration DataQuest 13 Water is transported in plants, from the roots to the leaves, following a decreasing water potential gradient. Transpiration, or loss of water from the leaves, helps to create
The Gas Laws: Boyle's Law and Charles Law
 Exercise 6 Page 1 Illinois Central College CHEMISTRY 130 Name The Gas Laws: Boyle's Law and Charles Law Objective The simple laws governing the properties of gases can be readily demonstrated experimentally.
Experiment C-6 Gas Solubility
 1 Experiment C-6 Gas Solubility Objectives To measure dissolved oxygen in water by using an oxygen sensor. To learn about physical factors that influence oxygen solubility in water. To examine the dissolved
Resonance in Transverse Waves. Regents Physics
 Title: Resonance in Transverse Waves Original: Revision: Authors: Appropriate Level: Abstract: Time Required: NY Standards Met: Special Notes: 1 July 2004 4 April 2008 Charlene Rydgren, Jeff Harbold, George
SCI-5 MES_Lamb_Oceans Exam not valid for Paper Pencil Test Sessions
 SCI-5 MES_Lamb_Oceans Exam not valid for Paper Pencil Test Sessions [Exam ID:53S2JF 1 Two children are swimming and jumping in the waves at the beach. On which part of the ocean are they standing? A Abyssal
In addition to reading this assignment, also read Appendices A and B.
 1 Kinematics I Introduction In addition to reading this assignment, also read Appendices A and B. We will be using a motion detector to track the positions of objects with time in several lab exercises
Students measure the change in pressure by varying the volume of trapped air in a syringe while:
 How Does a Trapped Gas Behave? Teacher Information Objective Students investigate the effect of changes in the volume of a confined gas on pressure at constant temperature. Using the pressure sensor, students
Boyle s Law VC 09. Experiment 9: Gas Laws. Abstract
 Experiment 9: Gas Laws VC 09 Abstract In this laboratory activity, you will experimentally confirm Boyle s Law, determine absolute zero from Gay-Lussac's Law, and determine the molecular weight of acetone,
The Hudson s Ups and Downs
 The Hudson s Ups and Downs Students will interpret line graphs of Hudson River water levels to learn about tides and tidal cycles in the estuary. Objectives: Students will read line graphs to: examine
Purpose: Hypothesis: Procedure:
 Name: Block: Properties of Water Lab As we have discussed in class and on notes, water has many unique properties that are critical to life on Earth. The goal of this lab is to study the properties of
Exp. 5 Ideal gas law. Introduction
 Exp. 5 Ideal gas law Introduction We think of a gas as a collection of tiny particles in random, thermal motion. When they collide with the sides of a container, they exert a force on the container walls.
Lab 13: Hydrostatic Force Dam It
 Activity Overview: Students will use pressure probes to model the hydrostatic force on a dam and calculate the total force exerted on it. Materials TI-Nspire CAS handheld Vernier Gas Pressure Sensor 1.5
Module 2, Add on Lesson Depth Sensor. Teacher. 90 minutes
 Module 2, Add on Lesson Depth Sensor 90 minutes Teacher Purpose of this lesson Investigate the relationship between pressure and depth Construct a sensor to measure the depth of water Graph data and reason
Pool Plunge: Linear Relationship between Depth and Pressure
 Activity 3 Pool Plunge: Linear Relationship between Depth and Pressure If you dive to the bottom of a swimming pool you will feel an increasing pressure on your eardrums as you descend. The deeper you
EXPERIMENT 12 GAS LAWS ( BOYLE S AND GAY-LUSSAC S LAW)
") EXPERIMENT 12 GAS LAWS ( BOYLE S AND GAY-LUSSAC S LAW) INTRODUCTION: In order to specify fully the condition of a gas it is necessary to know its pressure, volume, and temperature. This quantities are
EXPERIMENT 12 GAS LAWS ( BOYLE S AND GAY-LUSSAC S LAW) INTRODUCTION: In order to specify fully the condition of a gas it is necessary to know its pressure, volume, and temperature. This quantities are
Deep Water Currents Lab
 Deep Water Currents Lab Background: Anyone visiting the seashore is struck by the constant motion of water traveling on the surface of the ocean in the form of waves. But beneath the ocean's surface, water
Clean toilet plunger Sensor extension cable. Add this important safety precaution to your normal laboratory procedures:
 How Does a Trapped Gas Behave? Student Activity Worksheet Driving Question How does a change in volume of a confined gas affect its pressure? Materials and Equipment For each student or group: Data collection
Vapor Pressure of Liquids
 Vapor Pressure of Liquids Experiment 10 In this experiment, you will investigate the relationship between the vapor pressure of a liquid and its temperature. When a liquid is added to the Erlenmeyer flask
Note! In this lab when you measure, round all measurements to the nearest meter!
 Distance and Displacement Lab Note! In this lab when you measure, round all measurements to the nearest meter! 1. Place a piece of tape where you will begin your walk outside. This tape marks the origin.
QUICK WARM UP: Thursday 3/9
 Name: pd: Unit 6, QUICK WARM UP: Thursday 3/9 1) The slope of a distance vs. time graph shows an object s. 2) The slope of a position vs. time graph shows an object s. 3) Can an object have a constant
Newton s Triple Play Explore
 5E Lesson: Explore Newton s Triple Play Explore Stations (80 minutes) Students will explore how forces affect the motion of objects in the following stations. Station : Baseball Forces Baseball Space to
Vapor Pressure of Liquids
 Vapor Pressure of Liquids Calculator 10 In this experiment, you will investigate the relationship between the vapor pressure of a liquid and its temperature. When a liquid is added to the Erlenmeyer flask
Gas Laws: Boyle s and Amonton s Laws Minneapolis Community and Technical College v.9.08
 Gas Laws: Boyle s and Amonton s Laws Minneapolis Community and Technical College v.9.08 I. Introduction The purpose of this experiment is to test the extent real gases (to the limits of our measurements)
The Decomposition of Hydrogen Peroxide
 The Decomposition of Hydrogen Peroxide Calculator 12 The decomposition of hydrogen peroxide in aqueous solution proceeds very slowly. A bottle of 3% hydrogen peroxide sitting on a grocery store shelf is
Lab 4: Transpiration
 Lab 4: Transpiration Water is transported in plants, from the roots to the leaves, following a decreasing water potential gradient. Transpiration, or loss of water from the leaves, helps to create a lower
Evaluation copy. Effect of Vascularity on Skin Temperature Recovery. Computer
 Effect of Vascularity on Skin Temperature Recovery Computer 2 Homeostasis refers to the body s ability to maintain internal conditions (e.g., temperature, ph, hydration) within the narrow limits that are
APBiology Unit 2, Chapter 8
 APBiology Unit 2, Chapter 8 Research Question What factors affect the rate of cellular respiration in multicellular organisms? Background Living systems require free energy and matter to maintain order,
SIXTH GRADE OCEANS 1 WEEK LESSON PLANS AND ACTIVITIES
 SIXTH GRADE OCEANS 1 WEEK LESSON PLANS AND ACTIVITIES WATER CYCLE OVERVIEW OF SIXTH GRADE WATER WEEK 1. PRE: Evaluating components of the water cycle. LAB: Experimenting with porosity and permeability.
Gas Pressure Sensor (Order Code GPS-BTA)
") Gas Pressure Sensor (Order Code GPS-BTA) The Vernier Gas Pressure Sensor is used to monitor pressure changes in gas-law experiments in chemistry and physics, such as Boyle s law (pressure vs. volume) and
Gas Pressure Sensor (Order Code GPS-BTA) The Vernier Gas Pressure Sensor is used to monitor pressure changes in gas-law experiments in chemistry and physics, such as Boyle s law (pressure vs. volume) and
TEMPERATURE S RELATIONSHIP TO GAS & VAPOR PRESSURE
 TEMPERATURE S RELATIONSHIP TO GAS & VAPOR PRESSURE Adapted from "Chemistry with Computers" Vernier Software, Portland OR, 1997 ELECTRONIC LABORATORY NOTEBOOK (ELN) INSTRUCTIONS Read the directions and
Additional Reading General, Organic and Biological Chemistry, by Timberlake, chapter 8.
 Gas Laws EXPERIMENTAL TASK Determine the mathematical relationship between the volume of a gas sample and its absolute temperature, using experimental data; and to determine the mathematical relationship
Ripple Tank Exploring the Properties of Waves Using a Ripple Tank
 Exploring the Properties of Waves Using a The ripple tank is a shallow, glass-bottomed container that is filled with water to a depth of 1 or 2 centimeters. There is a light source that is placed above
1. Photosynthesis and Light. See real-time evidence that light causes photosynthesis to occur!
 Y OU LIGHT UP MY LIFE 1. Photosynthesis and Light You Light Up My Life Student Instruction Sheet Challenge See real-time evidence that light causes photosynthesis to occur! Equipment and Materials computer
Ozobot Bit Classroom Application: Boyle s Law Simulation
 OZO AP P EAM TR T S BO RO VE D Ozobot Bit Classroom Application: Boyle s Law Simulation Created by Richard Born Associate Professor Emeritus Northern Illinois University richb@rborn.org Topics Chemistry,
Objectives. Materials TI-73 CBL 2
 . Objectives Activity 18 To model the cooling rate of different sizes of animals To determine the effect of skin surface area on the cooling rate of animals Materials TI-73 Body Cooling Rate of Animals
#LZ400 LEAKALYZER. Water Loss Sensor INSTRUCTION MANUAL Country Dr. #190 St. Paul, MN
 #LZ400 LEAKALYZER Water Loss Sensor INSTRUCTION MANUAL 2885 Country Dr. #190 St. Paul, MN 55117 800-348-1316 www.leaktools.com Your Partner in Swimming Pool Water Conservation Product Purpose: 2 The Leakalyzer
SS32L Dissolved O 2 Probe
 BIOPAC WWW.biopac.com Systems, Inc. Application Note PH-185 SS32L Dissolved O 2 Probe SS32L Dissolved O 2 Probe BIOPAC Software SS32L Specifications BSL PRO v. 3.6.6 BIOPAC Hardware SS32L Dissolved O 2
Well, Well, Well. BACKGROUND Seasonal upwelling is a very important process in the coastal ocean of the Pacific Northwest.
 Well, Well, Well SUMMARY In this activity students investigate the relationship between winds, surface currents, sea surface temperature and upwelling and downwelling off the coast of OR and WA. Students
Respiration Monitor Belt (Order Code RMB)
") Respiration Monitor Belt (Order Code RMB) The Respiration Monitor Belt is used to measure human respiration rates. It must be attached to the Vernier Gas Pressure Sensor (see Figure 1), which is then connected
Respiration Monitor Belt (Order Code RMB) The Respiration Monitor Belt is used to measure human respiration rates. It must be attached to the Vernier Gas Pressure Sensor (see Figure 1), which is then connected
Physics Experiment 17 Ideal Gas Law Qualitative Study
 Physics 210 17-1 Experiment 17 Ideal Gas Law Qualitative Study Note 1: Parts of this lab involve using a laptop computer and the PASCO ScienceWorkshop Interface to collect data. The lab also involves use
PRODUCT SHEET. Order probe only as RXPROBE02
 SS69L DISSOLVED OXYGEN PROBE TRANSDUCER Order probe only as RXPROBE02 Order interface only as BSL-TCI16 SS69L Components The SS69L transducer measures dissolved oxygen. The SS69L includes a dissolved oxygen
Perilous Plunge. Activity Guide PITSCO. Ideas Solutions V0708
 Perilous Plunge PITSCO & Ideas Solutions S T E M Activity Guide 59779 V0708 Perilous Plunge Activity Guide Introduction... 3 Science Activity Give em the Hooke!... 4 Exploring Hooke s Law.... 5 Technology
Movement and Position
 Movement and Position Syllabus points: 1.2 plot and interpret distance-time graphs 1.3 know and use the relationship between average speed, distance moved and 1.4 describe experiments to investigate the
Observing Waves, Their Properties, and Relationships
 Observing Waves, Their Properties, and Relationships Part I: Setting Up the Activity 1. Refer to the material list for materials needed. 2. To successfully conduct this activity, you will need an area
Walk - Run Activity --An S and P Wave Travel Time Simulation ( S minus P Earthquake Location Method)
") Walk - Run Activity --An S and P Wave Travel Time Simulation ( S minus P Earthquake Location Method) L. W. Braile and S. J. Braile (June, 2000) braile@purdue.edu http://web.ics.purdue.edu/~braile Walk
Walk - Run Activity --An S and P Wave Travel Time Simulation ( S minus P Earthquake Location Method) L. W. Braile and S. J. Braile (June, 2000) braile@purdue.edu http://web.ics.purdue.edu/~braile Walk
What Do You Think? GOALS
 Activity 3 Slinkies and Waves GOALS In this activity you will: Make a people wave. Generate longitudinal and transverse waves on a Slinky. Label the parts of a wave. Analyze the behavior of waves on a
MoLE Gas Laws Activities
 MoLE Gas Laws Activities To begin this assignment you must be able to log on to the Internet using Internet Explorer (Microsoft) 4.5 or higher. If you do not have the current version of the browser, go
Introduction to ChemSense
 Introduction to ChemSense As you may have seen, the ChemSense software allows you to create drawings and animation of chemical phenomena (and non-chemical phenomena for some of you). The software also
LAB : Using A Spark Timer
 LAB : Using A Spark Timer Read through the whole lab and answer prelab questions prior to lab day. Name: F1 Introduction A spark timer is used to make accurate time and distance measurements for moving
Fun with Gas Laws. Prepared by Vance O. Kennedy and Ross S. Nord, Eastern Michigan University PURPOSE
 Experiment 2 Fun with Gas Laws Prepared by Vance O. Kennedy and Ross S. Nord, Eastern Michigan University PURPOSE The purpose of this laboratory experience is to explore the gas law relationships between
g) Use the map compass to provide the general locality of the knoll on the chart.
 Use the map compass to provide the general locality of the knoll on the chart.") The horizontal scale (x axis) of your cross-section/profile is the linear map distance between point A and point B on the map (or between X and Y and Z). It conforms to the map scale. In other words, the
The horizontal scale (x axis) of your cross-section/profile is the linear map distance between point A and point B on the map (or between X and Y and Z). It conforms to the map scale. In other words, the
170 points. 38 points In your textbook, read about modern oceanography. For each item write the word that meets the description.
 Ch 15 Earth s Oceans SECTION 15.1 An Overview of Oceans 38 points In your textbook, read about modern oceanography. For each item write the word that meets the description. (5 points) 1. German research
SC.5.P.13.2 Investigate and describe that the greater the force applied to it, the greater the change in motion of a given object.
 SC.5.P.13.2 Investigate and describe that the greater the force applied to it, the greater the change in motion of a given object. Materials per group: 2 flexible rulers (plastic), 1 small ball of the
Gas Pressure and Distance The Force of the Fizz Within, By Donell Evans and Russell Peace
 Louisiana Curriculum Framework Content Strand Physical Science Chemistry Grade Level 9-12 Objective: The students will... Use a TI 83 Plus Graphing Calculator, a CBL System, a pressure sensor, and film
Biology Unit 2, Structure of Life, Lab Activity 2-3
 Biology Unit 2, Structure of Life, Lab Activity 2-3 Cellular respiration is the release of energy from organic compounds by metabolic chemical oxidation in the mitochondria within each cell. Cellular respiration
Investigating Sinking and Floating
 Chapter 13 Forces in Fluids Investigation 13A Investigating Sinking and Floating Background Information When an object is placed in a fluid, the force of gravity causes part or all of the object to sink
The Causes of Ocean Circulation
 Activity 1 The Causes of Ocean Circulation Goals In this activity you will: Understand the effect of the wind on the movement of water at the ocean surface. Understand the effect of the Coriolis force
Where are you right now? How fast are you moving? To answer these questions precisely, you
 4.1 Position, Speed, and Velocity Where are you right now? How fast are you moving? To answer these questions precisely, you need to use the concepts of position, speed, and velocity. These ideas apply
Gravity, Force and Work
 Gravity, Force and Work Vocabulary: force something that pushes or pulls something else gravity a force that pulls everything toward the center of the earth friction a force that is created when something
Gas Laws: Boyle s and Amonton s Laws MCTC Chemistry v.9.17
 Gas Laws: Boyle s and Amonton s Laws MCTC Chemistry v.9.17 Objective: The purpose of this experiment is confirm Boyle's and Amontons' Laws in the laboratory. Prelab Questions: Read through this lab handout
Experiment P18: Buoyant Force (Force Sensor)
") PASCO scientific Physics Lab Manual: P18-1 Experiment P18: (Force Sensor) Concept Time SW Interface Macintosh file Windows file Newton's Laws 45 m 300/500/700 P18 P18_BUOY.SWS EQUIPMENT NEEDED CONSUMABLES
PASCO scientific Physics Lab Manual: P18-1 Experiment P18: (Force Sensor) Concept Time SW Interface Macintosh file Windows file Newton's Laws 45 m 300/500/700 P18 P18_BUOY.SWS EQUIPMENT NEEDED CONSUMABLES
Why Are Temperatures Different Near the Coasts and Inland?
 2.6 Investigate Why Are Temperatures Different Near the Coasts and Inland? Earlier in this Learning Set, you analyzed climate maps that indicated the effects of latitude on temperature. The maps are repeated
Neuromuscular Reflexes
 Name: Neuromuscular Reflexes Experiment 14A The automatic response of a muscle to a stimulus is called a reflex. The patellar reflex results from tapping the patellar tendon below the knee with a reflex
Experiment #12. Gas Laws.
 Goal To observe gas laws in the laboratory. Experiment #12. Gas Laws. Introduction All ideal gases, regardless of molar mass or chemical properties, follow the same gas laws under most conditions. Gas