High- resolution near- shore geophysical survey using an Autonomous Underwater Vehicle (AUV) with integrated magnetometer and side- scan sonar
|
|
|
- Stewart Bryant
- 6 years ago
- Views:
Transcription
1 High- resolution near- shore geophysical survey using an Autonomous Underwater Vehicle (AUV) with integrated magnetometer and side- scan sonar By Doug Hrvoic, B.A.Sc A Thesis Submitted to the School of Graduate Studies In Partial Fulfillment of the Requirements for the Degree Master of Science McMaster University Copyright by Doug Hrvoic, April 2014 i
2 MASTER OF SCIENCE (2014) (Earth and Environmental Science) McMaster University Hamilton, Ontario TITLE: AUTHOR: SUPERVISOR: High-resolution near-shore geophysical survey using an Autonomous Underwater Vehicle (AUV) with integrated magnetometer and side-scan sonar Doug Hrvoic, B.A.Sc Dr. Joseph Boyce NUMBER OF PAGES: 73 ii
3 Abstract Small, low cost Autonomous underwater vehicles (AUVs) provide ideal platforms for shallow water survey, as they are capable of unmanned navigation and can be programmed to acquire data at constant depth, or constant altitude above the seabed. AUVs can be deployed under most sea states and are unaffected by vessel motions that often degrade sonar and magnetometer data quality. The integration of sonar and magnetometer sensors on AUV s is challenging, however, due to limited payload and strong magnetic fields produced by the vehicle motor. In this study, a Marine Magnetics Explorer Overhauser magnetometer was mated to a portable AUV (OceanServer Iver2) creating the first practical AUV- deployed magnetic survey system. To eliminate magnetic interference from the AUV, the magnetometer was tethered to the AUV with a 5 m tow cable, as determined by static and dynamic instrument testing. The results of the magnetic tests are presented, along with field data from a shallow water test area in Lake Ontario near Toronto, Canada. AUV- acquired magnetic survey data were compared directly with a conventional boat- towed magnetic survey of the same area. The AUV magnetic data were of superior quality despite being collected in rough weather conditions that would have made conventional survey impossible. The resulting high- resolution total magnetic intensity and analytic signal maps clearly identify several buried and surface ferrometallic targets that were verified in 500- khz side- scan sonar imaging and visual inspection by divers. iii
4 Table of Contents Abstract... iii List of Figures... vi Chapter One: Introduction Research Problem Objectives Methods AUV- magnetometer System Static and Field Testing Statement on Authorship Chapter Two: High- resolution near- shore geophysical survey using an Autonomous Underwater Vehicle (AUV) with integrated magnetometer and side- scan sonar Abstract Introduction Methods AUV- magnetometer integration Static testing Inshore geophysical survey Data Processing Results Static tests Powered tests Bathymetry and side- scan sonar Magnetic survey Discussion AUV positioning errors Target detection and diver inspection Integration of magnetic and side- scan sonar data Summary iv
5 6 Acknowledgements Chapter Three: Conclusions Summary Limitations Future Work and Requirements References v
6 List of Figures Chapter #1 Figure 1: AUV- magnetometer system consisting of OceanServer Iver2 AUV, Marine Magnetics Explorer and tow cable system Figure 2: Location of Lake Ontario study site showing location of water supply pipelines Figure 3: Deployment of AUV- magnetometer system at Lake Ontario test site Chapter #2 Figure 1: Schematic showing integrated Iver2 AUV and Explorer Overhauser magnetometer system Figure 2: Lake Ontario test site showing survey track lines (18 line- km) and location of submerged steel pipelines Figure 3: Typical magnetic diurnal variation during a portion of static test Figure 4: Static test results showing magnetometer response to unpowered Iver2 at varying distances and compass orientations Figure 5: Magnetometer response to powering the Iver2 thrusters Figure 6: Noise spectral density plots for powered tests at 3 and 5 m Figure 7: A) Bathymetry map with AUV tracklines. B) 500 khz side- scan sonar mosaic of survey area Figure 8: AUV- magnetometer survey magnetic results. A) Total magnetic intensity (TMI) map corrected for lag and diurnal variation. B) TMI leveled using iterative tie- line leveling. C) TMI profile of line 7 (dashed line in B). D) The analytic signal amplitude (ASA) profile for line vi
7 Figure 9: Boat- towed survey magnetic results. A) Total magnetic intensity (TMI) map corrected for towfish lag and diurnal variation. B) TMI leveled using iterative tie- line leveling. C) TMI profile for line 7 (dashed line in B). D) The analytic signal amplitude (ASA) profile for line Figure 10: Histograms showing residual cross- over errors before and after iterative tie- line leveling Figure 11: Example of DVL positional errors indicated by jumps in AUV end- of- line positions Figure 12: Scatterplot of end- of- line accumulated position errors, illustrating both random and systematic error in the AUV s DVL navigation Figure 13: Analytic signal amplitude plots, calculated from the leveled total field grids, showing distribution of small near- surface magnetic targets Figure 14: AUV analytic signal amplitude overlaid on side- scan sonar mosaic with interpreted ferrometallic targets Figure 15: A) Total Magnetic Intensity (TMI) overlaid on side- scan sonar mosaic for Target #1 (steel anchor) Figure 16: A) Total Magnetic Intensity (TMI) overlaid on side- scan sonar mosaic for Target # Figure 17: A) Total magnetic intensity (TMI) for a portion of pipelines overlaid on the side scan mosaic Table 1: List of magnetic targets shown in Figure 14 and their calculated positions vii
8 Chapter One: Introduction 1.1 Research Problem Magnetometers are essential geophysical tools for subsea geological mapping and ferrometallic object search. Marine magnetometer surveys are conducted routinely in mining and petroleum resource exploration, archaeological surveys, and for detecting and locating pipelines and other seabed ferrometallic objects (Schwartz and Brandenburg, 2009; Weiss et al., 2007; Hall 1966; Clausen and Arnold, 1976; Boyce et al., 2004; Pozza et al., 2004; Nabighian et al., 2005). Magnetic total field and gradient surveys are also employed increasingly for detection and clearance of seabed mines and unexploded ordnance (UXO), which require high precision survey methods and the use of precise and accurate magnetic sensors, with sensitivities in the picotesla range. In conventional marine magnetometer surveys, the sensor is towed from a surface vessel, which can present numerous difficulties when high spatial resolution is required for detection of small targets. The towed sensor position must be calculated with a layback correction, which results in sensor positional errors proportional to the tow cable length. A human- piloted survey vessel may also have difficulty maintaining a precise survey track, or constant velocity, all of which affect the sensor s altitude and signal response. High winds and sea states and the presence of strong currents can also produce significant motion- induced noise and positional errors in the magnetometer data. Conventional shallow- water magnetic survey methods involve towing one or multiple sensors (gradiometers) behind a surface vessel in a grid over the survey area. The viability of surveying a particular area is a function of economics (cost of survey vessel time and man power), environmental concerns (sea state, water depth, wind conditions, currents), and vessel/operator restrictions (towing speed, navigational accuracy, operator skill and fatigue). Each of these factors limit the quality and spatial resolution of the magnetic data. By offering the potential of 1
9 superior performance in each of these areas, AUVs offer the potential of acquiring higher quality data at much higher resolution than previously possible, which in turn has the potential of providing a better understanding of any survey site. The increased resolution will benefit shallow water surveys such as used for archaeological investigation and UXO detection and clearance, giving the ability to detect smaller ferrometallic objects and artifacts, and resolve clusters of objects with better precision. It will also benefit near- surface geological applications such as fault- mapping and high- resolution mapping of shallow basement structure (Suttak, 2013). AUV propulsion systems employ electric motors and actuators, which generate strong magnetic fields and electromagnetic eddy currents. Magnetic and electromagnetic interference from electrical components has been a primary obstacle to integrating a magnetic sensor within an AUV. Several past attempts to fit fluxgate magnetometers within AUV housings have resulted in high nt- scale total noise levels, between nt (Walker et al., 2011; Armstrong et al., 2009; Pei and Yeo, 2009). This in spite of the ability of fluxgate sensors to easily cancel static fields generated by the platform, which indicates that the increased noise is due to dynamic, electromagnetic fields generated by the AUV electrical systems. Total- field sensors, like the one used in this study, do not have the ability to cancel platform static fields because they do not measure the direction of the magnetic field, but they possess superior stability and accuracy that make them more suitable for geophysical survey. An alternate approach, investigated in this thesis, is to tow a magnetic sensor a short distance behind the AUV with a separation sufficient to limit inference from the AUV thruster and other electrical components (Fig. 1). This presents technical challenges for the design of the magnetometer and AUV but has many advantages over conventional approaches. This thesis describes the integration of a total field magnetometer sensor with a commercially available autonomous underwater 2
10 vehicle (AUV). The performance of the integrated AUV- magnetometer system was evaluated through static and field- testing at an open water site in Lake Ontario and comparison with a conventional boat- towed magnetometer survey. The results show that the AUV data were equivalent in accuracy to conventional boat- towed data, and were enhanced in high spatial frequencies that are critical for identification of small ferrous targets. Several surface targets were identified in the AUV- collected data, and some were verified both by the simultaneously collected side scan sonar data, and investigation by divers. The accuracy of the AUV- collected magnetic data were evaluated using tie- line analysis, and compared to a conventional boat- towed survey of the same area. 3
11 Figure 1: AUV-magnetometer system consisting of OceanServer Iver2 AUV, Marine Magnetics Explorer and tow cable system. 4
12 2 Objectives The overall aim of this study was to develop an integrated AUV- magnetometer system and to evaluate its application to the detection and mapping of seabed ferrous targets. The project involved two phases: 1) design and development of an AUV- towed Overhauser magnetometer system (Fig. 1) and 2) static and field- testing of the sensor platform for ferrous target detection. The specific objectives of the thesis were: i) to develop an integrated AUV- magnetometer system for high- resolution seabed ferrous target search, ii) to determine the AUV noise characteristics and develop a tow/tether system that limits, or ideally eliminates the magnetic effects of the tow vehicle and thrusters, iii) to test the capabilities of the AUV- magnetometer system for mapping of ferrous targets in a controlled survey setting, iv) to evaluate potential navigation and other systematic errors in the AUV- magnetometer system, v) to compare the results with a conventional surface- towed Overhauser magnetometer survey collected over the same study area. 3 Methods 3.1 AUV- magnetometer System The AUV- magnetometer system developed in this study employed a commercially available lightweight AUV (OceanServer Iver2) and Overhauser marine magnetometer (Marine Magnetics Explorer)(Fig. 1). The Iver2 was connected to the Explorer magnetometer using a 5 m tow cable designed to limit the magnetic and electromagnetic interference from the AUV (see Section 3.2). The magnetometer tow cable was mated to an expansion connector on the AUV that delivered power and a bidirectional communication channel (Fig. 1). 5
13 Communication was via RS232 at 9600 bps, a protocol already supported by the Explorer magnetometer. The Iver2 received a firmware revision to send appropriate control commands to the Explorer, and to parse and store the Explorer magnetic and diagnostic data. The data were stored in the AUV in an ASCII flat file format to facilitate downloading and post- processing of the magnetometer data. The tow cable was attached to the Iver2 s propeller ring, which had sufficient strength to tolerate the full weight of the Explorer in air. The Explorer was lightened to make it neutrally buoyant in fresh water, and was equipped with swappable brass collars to adjust its buoyancy and trim for water of differing salinity. The Explorer s neutral buoyancy was very important for the system to operate reliably. If the system was operated with the Explorer negatively buoyant, it had a tendency to prevent the Iver2 from surfacing reliably, which interfered with it obtaining a periodic GPS lock, and thereby thoroughly disrupted its operation. In summary, the Iver2 received firmware changes, but no mechanical modifications. The Explorer magnetometer received mechanical changes, but its firmware was not altered. 6
14 Kingston Road Scarborough Pumping Station water pipelines Scarborough Toronto Hamilton STUDY AREA Niagara Falls Lake Ontario Canada USA Rochester Lake Ontario AUV survey track Figure 2: Location of Lake Ontario study site showing location of water supply pipelines 7
15 3.2 Static and Field Testing Static and dynamic tests were conducted to determine the optimum cable length that would limit AUV interference with the magnetometer. Tests of static magnetic fields were conducted first, with the AUV unpowered and at a test site with low local magnetic gradients and isolated from other sources of magnetic interference. The magnetic test sensor was positioned in a fixed location, and continuously corrected in real time with a reference sensor to eliminate temporal (diurnal) variation. The AUV was brought gradually closer to the test sensor, until a significant magnetic offset was detected. The test was repeated in four different directions, to correctly measure both the permanent and induced static fields produced by the AUV. Tests of the dynamic, electromagnetic fields produced by the AUV were conducted in a similar way, but with the AUV submerged in a shallow pool, to provide a realistic load for the AUV s thruster, which was thought to be the largest source of dynamic interference. For dynamic testing, the AUV was held in a fixed position and the magnetic sensor was moved incrementally towards the AUV. At each position, a baseline measurement was taken with the AUV unpowered, after which the AUV was powered up and the thruster gradually engaged to full power. Using the results of the initial tests to set parameters (such as cable length), the AUV- magnetometer prototype was deployed in a shallow water test site in western Lake Ontario (Fig. 2) with a smooth regional gradient, which was ideal for testing line- to- line repeatability and accuracy. The site contains two 1 m diameter steel pipelines that extend more than 1 km offshore. If the AUV were affecting the magnetometer with a static influence, this would be visible as an offset (heading effect) in adjacent lines run in opposite directions. Higher frequency interference would appear clearly against the low background field of the area, and would result in a reduced effectiveness at locating small ferrous anomalies. The large magnetic linear anomalies produced by the steel pipelines were ideal targets for testing the 8
16 positioning capabilities of the AUV, as offsets in the pipeline anomaly due to positioning errors would be easily recognized. Field testing of the AUV- magnetometer system was conducted over a three day period beginning September 7 th, During the first day of survey work, the AUV was deployed from an 8.5 m powerboat at about 8 pm, after nightfall. In conventional boat- towed surveys, low- light conditions are normally a disadvantage, but when deploying the AUV, they proved to be an advantage. The AUV s navigation lights were more visible in the darkness, allowing it to be located easily whenever it was at the surface. At that time, the surface waves were approximately 1 m in amplitude, and winds were strong, at approximately 20 kts from the southwest. The winds had been changing direction in the days prior to the survey causing the wave heights and direction to be variable. These conditions would already be considered marginal for boat- towed survey. But despite these conditions, it was easy to deploy the AUV and magnetometer by hand. The AUV was then driven directly by radio remote to place it about 10 m away from the deployment vessel. The towing of the magnetometer did not adversely affect the AUV maneuverability and when at rest at the surface the neutrally buoyant magnetometer simply floated in position at the surface until the AUV began towing (Fig. 3). Slack in the cable was taken gradually and with no observable difficulty to the AUV, since the drag force exerted by the magnetometer was small. The survey block contained 30 lines of roughly 570m, spaced at 10m, and four 300 m tie lines, totaling about 18 line- km (Fig. 2). The survey grid was broken up into six individual missions, which were calculated to require up to an hour each at the AUV s programmed speed of 2.0 kts. This was done to limit the AUV s untended time so that in the event of a problem, it would be easier to locate and retrieve, and that no more than one hour s data was at risk of being lost. This survey design was in fact very conservative; the Iver2 has an endurance of roughly 8 hours, and could easily have conducted the entire survey in one mission. At the end of each hour, the AUV was programmed to return to a rendezvous point, where it was 9
17 approached by the deployment vessel, and the data downloaded wirelessly. The AUV was then sent immediately on its next mission with a wireless command. No physical contact with the AUV was required between missions. The Iver2 can be programmed to maintain a fixed altitude from the sea floor, tracking bottom changes with a single- beam acoustic altimeter. For this survey, because the bottom was known to be irregular and unpredictable, we chose to keep the AUV at a fixed 3m depth below the water surface. The AUV s altitude then varied between 2m to 5 m over the span of the entire area. While the AUV was executing its one- hour long missions, the deployment vessel spent the time docked safely in the nearby marina, rather than endure the choppy rolling weather. When the time came for a rendezvous, the vessel was brought to within approximately 20m of the checkpoint. The Iver2 s navigation lights were always clearly visible up to one kilometer away, so there was no fear of impacting it. A Wi- Fi connection was used to communicate with the AUV, downloading the previous dataset in its entirety, and instructing the AUV to continue on its next mission. This process required seconds. The ability to do this quickly and with no physical contact was a great benefit to the equipment s safety under the rough conditions that were experienced. The fourth mission was completed by 1:30am on September 8 th, at which point wave heights were approaching 2 metres, winds had strengthened, and frequent nearby lightning flashes were being observed. It was decided to cease operations for the evening, even though the Iver2 was not affected by the surface conditions and could have continued the survey. The remaining two mission blocks were collected after the storm had passed, on September 9 th, after an approximately 30- hour gap. Winds were calm and there was no significant wave activity (Fig. 3). In these conditions, the vessel remained on- site while the AUV collected data. 10


18 Figure 3: Deployment of AUV-magnetometer system at Lake Ontario test site 11
19 4 Statement on Authorship Chapter Two will be submitted for publication in the Journal of Applied Geophysics. This section outlines the contributions of the authors to the research and manuscript preparation as required by the School of Graduate Studies policy. D. Hrvoic was responsible for design of the AUV- magnetometer integration and the collection, analysis and interpretation of magnetic survey data. J. Boyce was responsible for thesis supervision and assisted in the preparation of the manuscript and interpretation of the research results. J. Aiello (OceanServer) assisted with the operation of the AUV and collection of the AUV dataset. Philip Suttak (McMaster) assisted with the collection of the boat- towed dataset. Michael Daffern (Marine Magnetics) assisted with static and field testing of the AUV- magnetometer system. Shawn Kovacs (McMaster) assisted with diver survey and ground- truthing of ferrometallic targets at the Lake Ontario study site. 12
20 Chapter Two: High- resolution near- shore geophysical survey using an Autonomous Underwater Vehicle (AUV) with integrated magnetometer and side- scan sonar Doug Hrvoic and Joe Boyce School of Geography and Earth Sciences McMaster University, Hamilton ON L8S 4K1 Canada 13
21 Abstract Autonomous underwater vehicles (AUVs) provide ideal platforms for shallow water geophysical survey, as they are capable of unmanned navigation and can be programmed to acquire grid surveys at constant water depth or altitude above the seabed. AUVs can be deployed under most sea states and are unaffected by vessel motions that can degrade sonar and magnetometer data quality. Integration of magnetometer sensors on AUVs has been problematic due to the magnetic interference produced by the AUV thrusters and electronics. In this study, we evaluated an AUV- deployed magnetic survey system consisting of an Overhauser magnetometer (Marine Magnetics Explorer) mated to a portable AUV (OceanServer Iver2) using a tow cable. To eliminate magnetic interference from the AUV, the magnetometer was tethered to the AUV with a 5 m tow cable, as determined by static and dynamic instrument testing, which indicated no detectable magnetic influence at this distance. An AUV- magnetometer survey was collected across a shallow water test area (17 ha) in Lake Ontario near Toronto, Canada and compared directly with the results of a conventional boat- towed magnetic survey. The AUV magnetic data have equivalent long- wavelength accuracy to the boat- towed data as determined by tie- line error analysis. The AUV data were shown to have less high frequency noise, and were able to identify a number of small ferromagnetic targets that were undetected in the boat- towed magnetic data. The resulting high- resolution total magnetic intensity (TMI) and analytic signal amplitude (ASA) maps clearly identify several buried and surface ferrometallic targets that were verified in 500 khz side- scan sonar imaging. Two targets were verified by divers, and their surveyed locations compared with positions calculated from ASA anomalies. The positional errors in the estimated and true target locations were 2.2 m and 0.9 m, and were acceptable for the 10 m survey line spacing. 14
22 Keywords: Autonomous underwater vehicle (AUV), Overhauser magnetometer, magnetic survey, side- scan sonar, ferrometallic target detection 1 Introduction Shallow water geophysical surveys can be a challenge using towed sensors deployed from small vessels, particularly under rough sea states or heavy surf conditions. Vessel accelerations produced by surface waves are transmitted to the sensor via the tow cable and can significantly degrade the quality of sonar and magnetic data. The use of tethered sensors in the shallow littoral zone is also problematic where the presence of rocky shoals and other seabed obstacles present a navigation hazard for small vessels and a risk of sensor bottom strike or cable entanglement. Autonomous underwater vehicles (AUVs) provide an attractive alternative to boat- towed surveys, as they are immune to surface conditions and can be programmed to acquire survey grids at constant altitude or depth above the seabed. Because of their stability and positional accuracy, AUVs are ideal platforms for acquisition of side- scan and multi- beam sonar data and can yield very high quality sonar imagery (Sibenac et al., 2004; Warren et al., 2007). The first AUVs developed in the 1950 s (e.g. University of Washington s SPURV) were large, specialized underwater vehicles designed for deep oceanographic survey and military applications (Sibenac et al., 2004). In the 1980 s and 1990 s AUV systems (e.g. Kongsberg Hugin, ISE Thesius) were adapted for a range of commercial applications, including oil and gas exploration, pipeline surveys and laying of fiber optic cable. (Warren et al., 2007, Ferguson, 2009). These large AUVs required specialized heavy equipment for deployment and retrieval and were logistically difficult to maintain and operate. These factors, together with high acquisition and operating costs, made these AUVs prohibitively expensive for most shallow water and inshore survey applications. In the last decade, the advent of compact, low- cost AUVs (e.g. Hydroid Remus, Teledyne Gavia and OceanServer Iver2) has provided new platforms that are well suited to shallow water littoral and 15
23 near shore surveys. These new lightweight AUVs are multi- purpose platforms that can be configured to carry a range of sensors tailored to the mission specifications. Common AUV sensor payloads include various types of imaging sonars (e.g. multi- beam, side- scan sonars) sub- bottom seismic profilers and specialized sensors for oceanographic survey and environmental monitoring applications (e.g. conductivity, temperature, depth - CTD). These AUV systems are manually portable and designed to be deployed from small boats or from the shore by hand. The integration of magnetometer sensors within compact AUVs presents a number of technical challenges that have limited the use of AUVs as magnetic survey platforms. All AUVs employ electric thruster motors for propulsion, which together with electronic and ferrometallic components, produce strong magnetic and electromagnetic eddy currents within the towbody (Miller, 2010). AUVs must also be cleansed, where possible, of all ferrometallic components, as these can produce strong permanent and induced magnetizations. Previous attempts to integrate total- field magnetometers within AUVs have employed sensors carried inside the vehicle (e.g. Steigerwalt et al., 2013) rather than a towed sensor, as a towed sensor can introduce hydrodynamic effects that can alter the AUV maneuverability in the water column and degrade positional accuracy (Miller, 2010). Instead, various attempts have been made to integrate three- axis fluxgate vector magnetometers into AUVs but with limited success. Fluxgate sensors are convenient because the static permanent and induced fields generated by the AUV can be compensated in software (Munschy et al. 2005). Even with software compensation, significant efforts are required to reduce the electromagnetic emissions from the AUV electronics and motors, as noise levels generated by thruster motors can be hundreds of nt. Armstrong et al. (2009) reported a compensated sensor noise floor of 21 nt for a fluxgate magnetometer housed in an AUV, still three orders of magnitude higher than the sensor noise of a survey- grade Overhauser magnetometer. Pei et al. (2009) did not report a numerical noise floor, but show plots that indicate a compensated noise level of approximately 10 nt for a fluxgate magnetometer. Walker et al. (2011) reported lower compensated error levels 16
24 ranging between 3.5nT and 7.24nT, which was achieved by extending the length of the AUV and the distance between the magnetometer and the offending components. Few previous studies have attempted to evaluate AUV- magnetometer systems for practical target detection. Steigerwalt et al. (2013) used a total field magnetic sensor with a fluxgate magnetic compensator in the same principle as systems employed for airborne magnetic survey. They produced field results over a seeded ferromagnetic survey grid, but acknowledged there were significant issues with platform noise and data quality. Sulzberger et al. (2009) described the operation of an AUV- mounted fluxgate gradiometer in field conditions, but with 5-10 nt of estimated background noise it was not sensitive enough to be competitive with boat- towed geophysical survey using a total field magnetometer. Total field sensors (e.g. Overhauser magnetometers) although more sensitive to static magnetic effects from the AUV, have the advantage of greater stability and accuracy when compared to fluxgate sensors, and this is the primary reason they are commonly used for geophysical survey. In this study, we report on the development of a portable AUV- magnetometer system for high- resolution inshore shallow water (< 100 m) geophysical survey applications. A small, commercially available AUV and Overhauser magnetometer were integrated using a cable tether system (Fig. 1), allowing simultaneous collection of sonar and total field magnetic data. Here we summarize the results of static and dynamic testing of the AUV- magnetometer system and provide a case study demonstrating its application to shallow water (< 10 m) geophysical mapping of ferrous targets in Lake Ontario, Canada. The results show that the towed sensor does not adversely affect AUV navigation and that magnetic interference from the AUV motors can be avoided with a properly designed tow- cable system. The AUV- magnetometer results were compared with a magnetic survey collected over the same area with a conventional boat- towed sensor using an identical survey grid. The AUV- magnetometer data provided 17
25 improved small target resolution due to the superior vehicle positioning and the near constant velocity and altitude of the AUV- magnetometer system when compared to the towed magnetometer survey. The AUV magnetic maps were data- fused with high- resolution (500 khz) side- scan swath imagery to assist in identification of surface and buried ferrometallic targets. Our results show that the AUV- magnetometer system provides an efficient method for rapid, high- resolution geophysical mapping of the littoral zone for a range of geological, archaeologic and engineering applications. The co- registered sonar and magnetic data also provide increased confidence in the identification of and interpretation of lakebed magnetic targets. 18
26 Figure 1: Schematic showing integrated Iver2 AUV and Explorer Overhauser magnetometer system. The Iver2 was equipped with a GPS, Doppler Velocity Log (DVL) and Klein 500 khz side-scan sonar. The Explorer magnetometer was mated to the AUV with a 5m towcable and trimmed to neutral buoyancy with brass collars. 19
27 2 Methods 2.1 AUV- magnetometer integration For the AUV- magnetometer integration, we employed a small commercially available AUV (OceanServer Iver2) and Overhauser magnetometer (Marine Magnetics Explorer). The magnetometer was mated to the AUV using a 5 m long cable tether system (Fig. 1) designed to limit magnetic interference while minimizing fluid drag and hydrodynamic effects on the AUV. The Iver2 is a lightweight (19 kg) AUV designed specifically for shallow- water coastal survey applications. The Iver2 can be configured with a range of sensor payloads, including side- scan and multi- beam sonars and conductivity, temperature and depth (CTD) sensors (Fig. 1). The vehicle is one of the smallest AUVs (1.73 m length) currently available and is easily deployed from a small vessel or from shore by hand. The Iver2 has a standard depth rating of 100 m and endurance of 8-14 hours, depending on payloads and battery configuration. The Iver2 in this study was equipped with a Klein 500 khz side- scan sonar, and employs a global positioning system (GPS) for surface navigation and a magnetoresistive compass and a Teledyne Doppler Velocity Log (DVL) for underwater positioning by dead- reckoning. The DVL has both upward- and downward- looking acoustic transducers that record the vehicle s vertical position in the water column. The Explorer Overhauser magnetometer was selected for its high accuracy (0.1 nt absolute), low noise level (0.02 nt- RMS) and low power consumption (2 W) required for AUV operations. The Explorer s compact size (86 cm length, 6 cm diameter) and low weight (3.8 kg) make it suitable for towing by the Iver2 and facilitate deployment of the system from small boats. The 5 m tow cable provided power for magnetometer and digital data transfer to the AUV using the RS232 serial protocol. To limit drag on the AUV, the magnetometer was made neutrally buoyant by fabricating many of its parts with lighter materials. Brass weight collars are attached to the towfish housing to achieve neutral buoyancy and adjust its trim in waters of differing salinities. 20
28 2.2 Static testing Several static magnetic tests were performed to evaluate the AUV electromagnetic interference and permanent and induced static magnetic effects on the magnetometer. The AUV and magnetometer were placed on non- magnetic stands at a test site in Markham, Ontario ( o N and o W) with low magnetic gradients and free from cultural magnetic noise. A single total- field Overhauser magnetometer was used as the test sensor while a second base station magnetometer, synchronized and placed 35 m away was used to record the temporal variations in the Earth s field during the test period (Fig. 3). Both magnetometers were cycled at a constant 1 Hz sampling rate. Unpowered tests were performed first to test the static magnetic fields produced by the AUV housing and internal components. The test magnetometer was placed in a fixed position 10 m from the stern of the Iver2 and the AUV was moved toward the sensor in 1 m increments (Fig. 4). Five minutes of magnetic measurements were recorded at each step, and averaged to determine the offset in the static field offset at that point. The distance increments were shortened to 0.25 m as the sensor came very close to the AUV, and a magnetic effect from the vehicle began to be observed. The same test was repeated with the magnetometer positioned to the north, east, south, and west of the AUV to determine the effects of induced magnetism in the AUV components, which would vary depending on the relative direction of the Earth s field to the AUV. Powered tests were conducted to measure the dynamic magnetic effects of the AUV s electronics, actuators and thruster. The AUV was placed in a 1 m deep freshwater pool and fixed to a heavy non- magnetic stand. The test magnetometer was placed 10 m astern of the AUV, and moved toward it in 1 m increments, as with the static tests (Fig. 5). Thrust was applied gradually to the AUV until it reached full power, and then gradually reduced during the 5- minute test period. 21
29 Kingston Road Scarborough Pumping Station water pipelines Scarborough Toronto Hamilton STUDY AREA Niagara Falls Lake Ontario Canada USA Rochester Lake Ontario AUV survey track Figure 2: Lake Ontario test site showing survey track lines (18 line-km) and location of submerged steel pipelines. The pipelines supply a water pumping station and reservoir located onshore. 22
30 2.3 Inshore geophysical survey A survey was conducted to evaluate the AUV- magnetometer system performance at a shallow water test site (17 ha) in Lake Ontario, in September 2012 (Fig. 2). The test site has a low regional magnetic gradient and contained a number of known ferrometallic targets, including two 1m diameter steel pipelines that supply the City of Toronto s Scarborough Water Pumping Station. The water intake pipes extend about 1 km from the shoreline and lie in water depths of 6-9 m within the survey area (Fig. 2). The survey block consisted of 30 lines of 570 m length spaced at 10 m and four perpendicular tie lines ( 300 m), totaling about 18 line- km (Fig. 2). In order to limit the AUV s submerged runtime and risk of loss, the survey grid was divided into six individual missions of one- hour duration with a programmed AUV speed of 2kts. Individual survey lines were acquired in about 10 minutes, with 8 minutes of submerged runtime and two minute surface intervals for completion of turns (Fig. 2). Underwater navigation between the survey waypoints was obtained with the AUV s DVL and magnetic compass and using a GPS fix during surface intervals. This survey design was conservative; the Iver2 has an endurance of roughly 8 hours, and could easily have conducted the entire survey in single 6 hour mission. At the end of each hour, the AUV was programmed to return to a rendezvous point, where it was approached by the deployment vessel and the data downloaded wirelessly. The AUV was then sent immediately on its next mission with a wireless command. No physical contact with the AUV was required between missions. The Iver2 can be programmed to maintain a fixed altitude from the sea floor, tracking bottom changes with its DVL, which also functions as an altimeter by averaging the return times of its four bottom- tracking acoustic beams. For this survey, because the bottom was known to be irregular and unpredictable, it was decided to keep the AUV at a fixed 3 m depth below the water surface. The AUV s altitude above the lakebed then varied between 2 m to 5 m over the span of the entire area. 23
31 The Explorer magnetometer sampled at 1 Hz, providing an inline sample interval of about 1 m. Side- scan sonar swaths were acquired simultaneously with magnetics at 500kHz and with a 30 m range setting. With the 10 m survey line spacing, this resulted in significant side- scan swath overlap. A conventional boat- towed total field magnetometer survey was conducted in July 2013 at the Lake Ontario test site using the AUV trackline pattern (Fig. 2) in order to replicate the AUV survey as closely as possible. An Explorer Overhauser magnetometer was towed at a distance of 30 m behind an 8.5 m powerboat at an average depth of 2.5 m below surface. The survey was completed in about 4 hours at an average speed of 4 kts. The magnetometer was continuously sampled at 2 Hz, providing an inline sample spacing of 1 m, comparable with the AUV acquired dataset. Survey navigation was provided by survey- grade Hemisphere L1+WAAS D- GPS located on the boat and the magnetometer position determined by layback correction. Weather conditions during the survey were fair with moderate 10 kt northerly winds and 0.5 m waves. 2.4 Data Processing The magnetic data were downloaded from the Iver2 as an ASCII flat file and imported into Geosoft Oasis Montaj TM for post- survey processing. The general processing flow included corrections for magnetometer sensor layback (5.54 m), diurnal variations and tine- line leveling (Green, 1983; Luyendyk, 1997). A spline- based algorithm was used to calculate the lag- corrected position for each magnetic field reading. Diurnal corrections were performed using magnetic basestation files downloaded from the GSC Magnetic Observatory in Ottawa, located approximately 350 km to the northeast of the survey test area. The leveling was performed in two steps. The first step involved statistical leveling of the four tie lines as a group to best match the survey lines using a zeroth order trend. In a second step, the survey lines were leveled individually to tie lines using iterative leveling with least squares minimization of the error residuals. 24
32 Finally, the data were gridded and visualized as two- dimensional surface plots. Grids were created using the minimum curvature algorithm, with a grid resolution of 2m (Briggs 1974). In order to compare the relative error in the AUV and boat- towed data sets a statistical analysis was conducted of the line intersection residuals obtained from the leveling step. Significant mismatch in the total field measurements at the intersections between tie lines and survey lines results from both systematic and random error. Histograms were generated for the line intersection residuals before and after leveling and standard descriptive statistics calculated. Processing of side- scan data in Hypack TM included corrections for DVL positional errors, slant- range and radiosity corrections to account for the across- track variations in backscatter intensity. Slant range corrections remove distortions in the images by mapping the sonar sample pixels to their correct horizontal range (Cervenka and de Moustier, 1993). Following corrections, the swaths were mosaicked to a georeferenced raster image by overlaying overlapping scans. Due to significant overlap in the side- scan swaths, and to create consistent sonar shadows, only the starboard channel was employed from every second line in creation of the mosaic. The resulting sonar mosaic had a pixel resolution of 5 cm. Processing of bathymetry data included corrections for DVL positioning and grid interpolation using minimum curvature with 5 m grid cells. 25
33 3 Results 3.1 Static tests The results of static testing are shown in Figure 4. The static unpowered tests showed that the induced and permanent magnetization of the ferrous components in the Iver2 created a consistent magnetic anomaly, regardless of ambient magnetic field direction. In all directions, the static influence of the AUV was detectable only at distances less than 4 m. Overall, the static magnetic anomaly generated by the AUV is small (< 1 nt at 2 m) and was of lower magnitude than expected. As expected, the amplitude of the magnetic anomaly shows some variation with orientation. If the static field produced by the AUV was purely induced by the ambient magnetic field, one would expect to see a larger anomaly in the north and south directions, and less in the east and west directions, since a single static dipole is elliptical and stronger at its poles than around its equator. The strong east and south responses, and weaker north and west responses are due to a permanent magnetic dipole in the AUV, oriented forward, and at a significant angle to starboard, perhaps as much as 45 degrees. Since a significant portion of the AUV s static magnetic effect is permanent magnetism in the AUV components, it may be theoretically possible to reduce it by demagnetizing individual components, excluding of course the components that require a permanent magnetic field to function. Potential further work would investigate the AUV components, and identify the individual sources of magnetism. 26
34 !"#$%&'#()*%#+#(,(-.(/&01+23(!2!"#$%&(45+0%&#+$6(!"#$%&'()'*+,"-./'0.#1&2"-'3"$%1./'4.%".2"51'3$%"1#'.',5%2"51'56'72.2"-'2&728' K^(
35 !"#$%&'#()*%#+#(,(-.(/&01+23(!2!"#$%&(45+0%&#+$6(!"#$%&'()'*+,+"-'+&.+'%&.$/+.'.012"3#'4,#3&+14&+&%'%&.513.&'+1'$3512&%&6'!"#$%&,+'7,%8"3#' 6".+,3-&.',36'-145,..'1%"&3+,+"13.9'.012"3#'31'.+,+"-',314,/8',+':4; KZ(
36 3.2 Powered tests The results of the powered tests are shown in Figures 5 and 6. Operation of the thruster was expected to produce a more or less constant offset due to rectification of an alternating magnetic field by the ambient Earth s field. No sign of such an offset was detected. Instead, thruster operation appeared to produce random, or at least AC noise in the magnetic signal, with no detectable DC component (Fig. 5). Figure 5 shows the results of powering the AUV motor at a distance of 3 m, where the static magnetic influence was almost undetectable. At the test location, the magnetic noise floor, as determined prior to the test, was about nt/ Hz (Fig. 5). Thrust was gradually increased from zero to maximum, then back to zero again during the course of the test. The increased noise is clearly visible in the time series, but even more apparent in the power spectrum in Figure 6. The noise appears spread through the spectrum, but is concentrated most at low frequencies (<0.05 Hz) where it is more than 10 times the normal noise level of the sensor. The same test at a distance of 5 m showed that powered interference dropped to undetectable levels. The spectrum of the test at 5 m in Figure 6 shows a flat noise spectrum with a noise levels similar to the unpowered AUV. 29
37 !"#$%&'#()*%#+#(,(-.(/&01+23(!2!"#$%&(45+0%&#+$6(!"#$%&'()'*+#,&-./&-&%'%&01.,0&'-.'1.2&%",#'.3'-4&'56&%7'-4%$0-&%0'+-'+'8"0-+,9&'.3':/; YL(
38 !"#$%&'#()*%#+#(,(-.(/&01+23(!2!"#$%&(45+0%&#+$6(!"#$%&'()'*+",&',-&./%01'2&3,"/4'-1+/,'5+%'-+6&%&2'/&,/,'0/'78'032'98:'';/'98',&-0%0/"+3<'/=&' 80#3&/".'"3/&%5&%&3.&'032'&224'.$%%&3/'&55&./,'+5'/=&'/=%$,/&%'8+/+%,'0%&'3"#">1&: YM(
39 3.3 Bathymetry and side- scan sonar Figure 7A shows the bathymetric map of the survey area obtained from the AUV s acoustic altitude and depth sensors. The bathymetry map shows a low relief lakebed topography with water depths ranging from 5 to > 9 m. The side- scan mosaic (Fig. 7B) shows the bathymetric relief is made up of northwest- east trending mounds and ridges formed in the lakebed clays and scattered large boulders. The more reflective areas of higher backscatter between the ridges indicate sandy deposits with ripples and sandwaves. Both water intake pipelines are clearly visible in the side- scan mosaic but were not discernable in the bathymetric data, which is too low- resolution to image these features. The western pipeline is exposed at the surface and supported on closely spaced cement anchor blocks. The eastern pipeline is broken into a number of sections, and buried by sandy deposits at its southern end. A linear ridge of sediment paralleling the eastern pipe likely represents dredge spoils produced by emplacement of the pipes. The most obvious feature of the AUV survey (Fig. 7A) is the straightness and consistent spacing of the tracklines. Human pilots, even experienced ones, tend to oscillate their track back and forth across the planned survey line. The AUV, in contrast, is capable of maintaining straight tracks with a more constant line separation than could be obtained with a boat survey. Another advantage is that the AUV, unlike a piloted boat, is able to maintain a relatively constant speed, and is capable of lower velocity than a surface vessel, which is usually limited by minimum engine speed and steerage constraints. While on- line, the AUV maintained a constant speed of about 2.0 kts, which provided increased data resolution at no extra cost. Even lower survey speeds are achievable with the Iver2, and would extend the vehicle s survey time and range on a single battery charge. 32
40 Figure 7: A) Bathymetry map with AUV tracklines. B) 500 khz side-scan sonar mosaic of survey area. Mosaic produced using the starboard channel of NE-bound survey tracks to provide consistent shading. 33
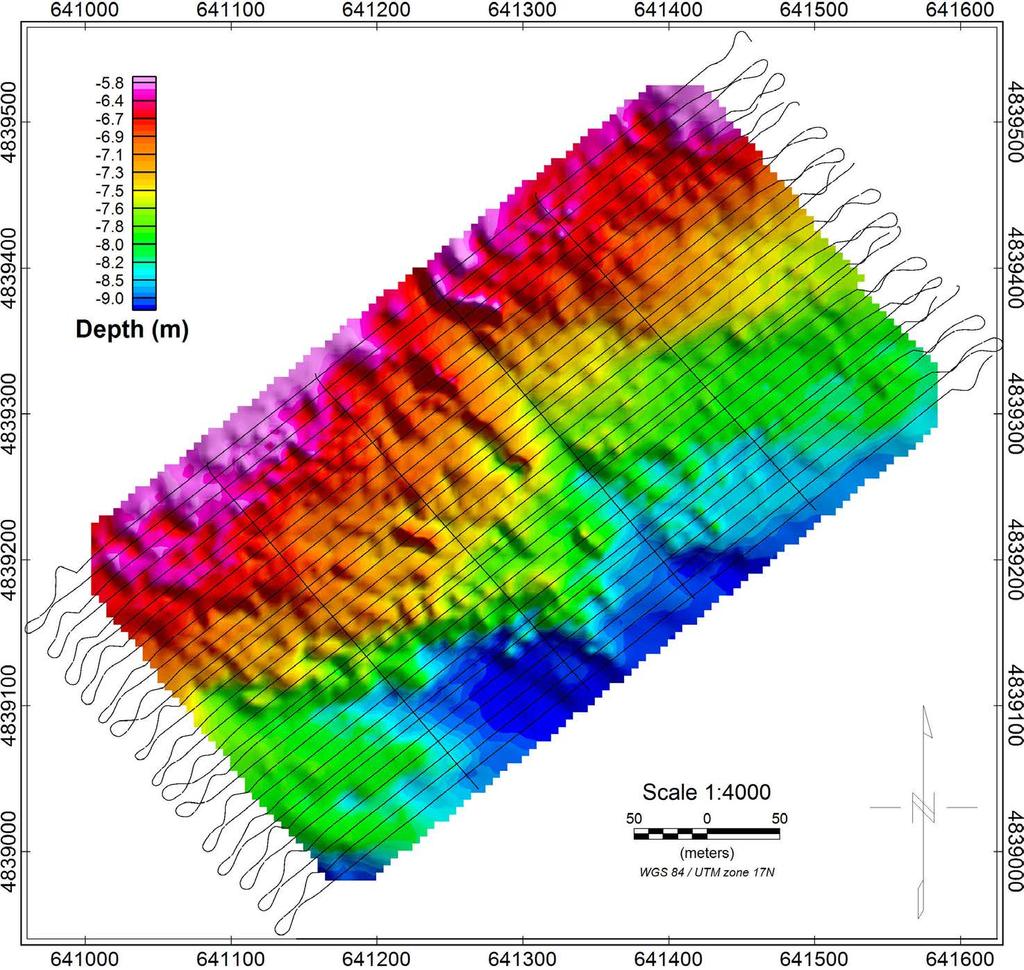
41 A B B 34
42 3.4 Magnetic survey Figure 8A shows the total magnetic intensity (TMI) map with corrections for sensor lag and diurnal variation and Figure 8B the leveled TMI. The leveling effectively eliminated the line corrugations present in the lag- corrected dataset (Fig. 9A), enhancing the resolution of the TMI image. The change in background magnetic intensity across the study site is about 180 nt and decreasing gradually from northwest to southeast. The twin pipelines are the most prominent feature in the center of the map, as indicated by two high amplitude (> 450 nt) linear magnetic anomalies (Fig 8B). The magnetic anomalies have a characteristic dipole shape in profile (Fig. 8C) and are unequal in amplitude; the western pipeline has maximum TMI anomaly of about 200 nt, while the eastern pipeline is >450 nt. The pipeline anomalies in the TMI maps have a beaded appearance, which may indicate the presence of either variable component remanent magnetization of the individual pipe segments, or aliasing of long wavelength anomalies in the cross line direction. A number of smaller magnetic anomalies are also visible in the leveled TMI image, as indicated by the presence of small dipoles and point magnetic sources, representing a scatter of ferrometallic objects. The largest of these targets is a 50 nt anomaly located about 120 m to the west of the westernmost pipeline (Figure 8B, C). Figure 8D shows the 1- D analytic signal amplitude (ASA), which is the vector sum of the along- track and vertical magnetic gradients (Roest et al., 1992). The ASA is insensitive to the ambient field direction and remnant magnetization of the sources. The ASA is employed widely as an interpretative tool, as it produces maxima which are centered over the magnetic source bodies regardless of the direction of magnetization (Fig. 8D), and is useful for locating magnetic source bodies (Nabighian 1972; Roest et al., 1992; MacLeod et al., 1993). 35
)*94*B+C5)+:2'+23B+B&()32:+72)&24&53;+\"<+=?@+:*7*:*B+(6&3'+&4*)24&7*+4&*0:&3*+:*7*:&3'+;+#<+=?")
43 !"#$%&'#()*%#+#(,(-.(/&01+23(!2!"#$%&(45+0%&#+$6(! " # $ %&'()*+,-+!./012'3*451*4*)+6()7*8+12'3*4&9+)*6(:46;+!<+=542:+12'3*4&9+&34*36&48+>=?@<+12A+ 95))*94*B+C5)+:2'+23B+B&()32:+72)&24&53;+"<+=?@+:*7*:*B+(6&3'+&4*)24&7*+4&*0:&3*+:*7*:&3'+;+#<+=?@+ A)5C&:*+5C+:&3*+D+>B26E*B+:&3*+&3+"<;+$<+=E*+232:84&9+6&'32:+21A:&4(B*+>!F!<+A)5C&:*+C5)+:&3*+D; Y[(
44 !"#$%&'#()*%#+#(,(-.(/&01+23(!2!"#$%&(45+0%&#+$6(! " # $ %&'()*+,-+"./010.2*3+4()5*6+7/'8*0&9+)*4(:04;+!<+=.0/:+7/'8*0&9+&80*84&06+>=?@<+7/A+9.))*90*3+ B.)+0.2B&4C+:/'+/83+3&()8/:+5/)&/0&.8;+D()5* )/9E:&8*4+/:4.+4C.28;++"<+=?@+:*5*:*3+(4&8'+ &0*)/0&5*+0&*1:&8*+:*5*:&8';++#<+=?@+A).B&:*+B.)+:&8*+F+>3/4C*3+:&8*+&8+"<+;+$<+=C*+/8/:60&9+4&'8/:+ /7A:&0(3*+>!D!<+A).B&:*+B.)+:&8*+F; Y^(
45 Figure 9 shows the results of the total field survey acquired with the boat- towed sensor. The boat tracklines are shown as an overlay on the leveled TMI map in Figure 9B. Despite relatively calm weather conditions and low wave height on the day of the survey, the boat- towed survey track is significantly less straight and regular than the AUV track. There are numerous areas where the boat- towed survey lines overlap and or leave gaps larger than the planned 10 m spacing. As a result of the gaps in coverage some areas of the survey block are under- sampled, which implies that the spatial resolution of the boat- towed data is likely to be inferior when compared to the AUV data. The overall appearance of the TMI map (Fig. 9A, B) is similar to the AUV survey data. The pipeline anomalies are similar, and the larger point anomalies were detected in the same positions. The magnetic profile shows a similar regional gradient change (approximately 180 nt) with similar anomalies. The pipe anomalies are of lower amplitude than the AUV data, which may be a result of the slightly greater survey altitude for the boat- towed data. The AUV maintained its depth at a constant 3 m, while the magnetometer depth for the boat towed survey was about 2.5 m. Also, it is apparent that the boat- towed data contains higher levels of high frequency noise than the AUV data. Close inspection of the pipe anomalies reveals that they appear less smooth (Fig. 9C). Furthermore, the 1- D analytic signal transformation resulted in a much nosier signal envelope, which is contaminated with high frequency noise. The ASA transform, because it employs calculated gradients, is very sensitive to high frequency noise in the total field input signal. The resulting profile is not satisfactory for locating the pipe source body, unlike the AUV ASA profile (compare Fig. 8D and 9D). The noise in the boat- towed TMI data may have resulted from erratic sensor motion due to surface waves acting on the towing vessel. 38
46 before leveling mean: -1.25nT : 2.50nT after leveling mean: 0.0nT : 1.29nT Frequency Frequency A Intersection Mismatch (nt) 0 B Intersection Mismatch (nt) before leveling mean: -0.10nT : 2.16nT after leveling mean: -0.07nT : 1.17nT Frequency Frequency C Intersection Mismatch (nt) 0 D Intersection Mismatch (nt) Figure 10: Histograms showing residual cross-over errors before and after iterative tie-line leveling. A) and B) AUV-magnetometer survey. C) and D) Boat-towed magnetometer survey. 39
47 Figures 10A and 11A show histograms of the tie- line intersection errors for the AUV and boat- towed unlevelled TMI data respectively. In both cases, the leveling error is less than 7 nt, and the distribution of error is roughly equivalent, with sigma slightly larger for the AUV- towed dataset, but not significantly. The most notable difference is the non- zero mean of the AUV dataset, although the value is not large. After tie line leveling (Figures 10B, 11B), both distributions look extremely similar, with mean mismatch at 0, and similar standard deviations. The possible sources of tie- line leveling errors include: i) Positioning error, including altitude variation. Clearly, the measurement of mismatch between tie lines and survey lines depends on the crossover point being accurate. Errors in the crossover point position will result in a mismatch error proportional to the local magnetic gradient. This concept extends to all three dimensions, meaning the vertical position of the sensor is also a factor. ii) Error due to diurnal drift. This is minimized by correction with a base station magnetometer. Ideally, the base station should be as close as possible to the survey area to maximize correlation between diurnal variation in the mobile and base station data. In this case, data from a magnetic observatory was used. The distance to the observatory (approximately 350km) reduces the effectiveness of the base station correction by an unknown amount. One difference between the two datasets was that the boat- towed data were all collected within a short four- hour span. The AUV data were collected with a 30 hour gap between the northern ¾ of the survey, and the southern ¼ plus the four tie lines. It is likely that a significant portion of the random mismatch error is due to the distance of the base station from the survey area, and that the nonzero mean of the AUV data is due to the large time gap between collection of the survey data and the tie lines, resulting in a constant shift that was not fully compensated for because of the distance of the magnetic observatory. 40
48 iii) Sensor error, including interference from other instrumentation. The most common type of magnetic sensor error is heading shift, which is a dependence of the sensor output on the orientation of the sensor within the Earth s ambient magnetic field. Some magnetic sensors exhibit an inherent heading error. The Overhauser sensor used in this study does not. But heading shifts can occur due to the presence of magnetic material (in this case the AUV) close to the sensor. A heading shift would appear as alternating positive and negative tie line offsets, on successive survey lines. This was not observed, and together with the results of the static tests, this can eliminate the possibility of the AUV causing error that would affect tie line mismatch. 4 Discussion 4.1 AUV positioning errors The AUV s positioning, both at the surface and underwater, is a critical component of the technology and subject to a number of sources of error. AUVs do not have access to GPS signals while submerged, and must therefore rely on other methods. While submerged, the Iver2 switches to an internal navigation system, using a magnetic compass to sense absolute direction of travel, and an acoustic Doppler Velocity Log (DVL) to track its velocity. This system, also known as dead reckoning, has a cumulative error, since it relies on integrating a directional velocity to calculate position. This is a known error source, and it has a manufacturer s specification of 1% of distance travelled. The AUV surfaces at the conclusion of each survey line to obtain a GPS position, which resets its accumulated position error to the uncertainty of the GPS. The end of each line, therefore, logs a distinct position jump, which is a transition from the AUV s internally calculated position to its true GPS position. Figure 11 shows a number of positional jumps, taking place at the ends of several survey lines. 41
49 Each arrow shows an apparent jump in the AUV s position as it surfaces and switches from internal to GPS positioning. Each of these jumps was identified, measured and plotted in Figure 12. From this plot is clear that there are both random and systematic components to the accumulated position error. There seems to be on average 5-6 m of error accumulated in the direction of the survey track, in the opposite direction. Since the errors are opposite and dependent on line direction, this is most likely due to a small calibration error in the magnetic compass. There is also a random spread of approximately 5m to each of the two groupings. This random spread corresponds to the specified 1% of distance travelled positioning accuracy. Position error of this sort is a well- known issue in AUV surveying. A common method of mitigating this error is to measure the magnitude of each GPS- lock position jump, as has been done here, and to use this value to recompute the positions for each data point along the survey line. The assumption is that the position error starts at zero when the AUV submerges, and accumulates linearly until it again surfaces. This correction was applied to the side scan sonar data, line- by- line, and the uncorrected and corrected data were compared in their ability to be combined into an accurate mosaic. The corrected data showed a significant accuracy improvement over the uncorrected data. The side scan mosaic displayed in this paper contains the position correction described above. 42
50 Easting (m) Northing (m) Figure 11: Example of DVL positional errors indicated by jumps in AUV end-of-line positions (northwestern portion of survey area). The jumps (up to 12 m) are produced when the AUV surfaces, obtains D-GPS lock and corrects the dead reckoning error accumulated while the AUV is submerged. 43
51 !"#$%&'#()*%#+#(,(-.(/&01+23(!2!"#$%&(45+0%&#+$6(!"#$%&'()*'+,-..&%/01.'12'& "3&'-,,$6$0-.&4'/17"."13'&%%1%78'"00$7.%-."3#'91.:'%-3416'-34' NN(
52 4.2 Target detection and diver inspection While tie line analysis is effective at determining systematic shifts in the dataset (i.e. low- frequency fidelity), the best way to characterize high frequency, or broad- spectrum performance is by analyzing small spatial wavelength magnetic anomalies within the dataset. The signals of shortest spatial wavelength are created by small, near- surface ferrous targets. Numerous small targets were observed in the raw TMI data but the large amplitude of the pipeline anomalies obscured many of the smaller anomalies. To solve this problem, the leveled TMI grids were transformed to analytic signal amplitude (ASA). This is the vector sum of the three independent spatial gradients of the total field, which are computed by Fourier transformation of the grid (Roest et al. 1992). Since the ASA is a derivative, it tends to suppress long- wavelengths such as the regional gradient, and is almost insensitive to remnant magnetization of magnetic sources. The ASA represents magnetic signal power and the end result is that small ferrous targets produce a single peak above a predictable background, making them easier to detect and interpret (Nabighian 1972). Figure 13 shows the ASA transformations of both the AUV and boat- towed datasets. In order to prevent the very large pipeline anomalies from overwhelming the small targets, the dynamic range of both colour scales was limited to a maximum of 20nT/m. This is impossible to do with raw total field data because of the background level s wide absolute variation. This is just one more benefit to working with analytic signal for this application. 45
53 Figure 13: Analytic signal amplitude plots, calculated from the leveled total field grids, showing distribution of small near-surface magnetic targets. A) AUV survey. B) Boat-towed survey. 46
54 A B 47
55 The AUV data in figure 13A shows numerous small targets over a relatively quiet background. The boat towed data in figure 13B shows the larger targets visible in figure 13A, but appears to be missing many of the smaller targets. Additionally, the background noise level is visibly higher in the boat- towed dataset, in part because the grid shading vertical gain parameter is slightly increased to compensate for the lower signal- to- noise ratio generated by the targets in the boat- towed data. The higher noise level and lower anomaly amplitude in the boat- towed dataset are likely due to wave motion, irregularity in survey line spacing, and in the sensor altitude. These factors did not impede the operation of the AUV. 4.3 Integration of magnetic and side- scan sonar data One of the benefits of the AUV platform is the simultaneous operation of several different, complementary sensors. This is also possible with boat- towed survey methods, but again superior stability and position holding give the AUV a data quality advantage. Figure 14 shows the analytic signal grid in Figure 13A overlaid over the side scan mosaic. The analytic signal was set to a transparency of 50% so that the detail of the mosaic becomes clearly visible. The ASA grid is ideal for this purpose; since it represents local magnetic signal power, the colour scale can be adjusted to highlight anomalies only, and leave the background invisible. In Figure 14, the colour scale was set to span from white to red, a highly contrasting colour to the mosaic s bronze. Magnetic targets were picked using the analytic signal grid, and selecting signals greater than 1nT/m. The target positions are plotted and shown in Figure 14, and their positions listed in Table 1. 48
56 Figure 14: AUV analytic signal amplitude overlaid on side-scan sonar mosaic with interpreted ferrometallic targets (Table 1). Targets were selected based on an ASA threshold of approximately 1nT/m. Two of the targets were identified in the side-scan sonar mosaic while the rest appear to be buried and not visible in the side-scan data. The water intake pipelines are clearly visible in both datasets. 49
57 Table 1: List of magnetic targets shown in Figure 14 and their calculated positions. Targets 1 and 14 were verified by diver survey and their true positions measured using a D-GPS. 50
58 The end result is a highly useful summary of the survey area. Bottom texture is preserved and visible everywhere, including features as fine as sand ripples. The magnetic target picks can be analyzed in the side scan mosaic for surface features that may have sourced the anomalies. Many of the magnetic targets do not have a corresponding visible feature in the mosaic, at least not one that is immediately identifiable. This indicates that the targets were either buried, or obscured by other surface features. Without magnetic data (i.e. in a side scan sonar only survey), these targets would have been missed. The co- registration and data fusion of these two complementary datasets makes a large amount of information quickly accessible and very useful for further investigation such as target retrieval. Two of the largest targets (1 and 14; Fig. 14) were selected for visual inspection by SCUBA divers. Both targets were visible in the side scan sonar and magnetic mapping. The purpose of inspection was to determine if the calculated positions of the targets matched their true positions, and how closely. Diving inspections took place on October 23, Target 1 was investigated first, followed by Target 14. The dive vessel, the same vessel as was used for AUV deployment and boat- towed survey, was driven slowly over the calculated target position as shown in Figure 14. When the position was crossed, a weight attached to a buoy was thrown over the side. The boat was then anchored some 25m from the buoy, so that the divers could enter the water. The divers swam to the buoy and followed the buoy line to the bottom. Video was collected with a GoPro camera. Visibility was not more than 5m, but Target 1 was found quickly. The marker weight had fallen very close to the object, which was a large ship anchor approximately 2m in length and partially buried. Divers deployed a Surface Marker Buoy (SMB), attaching the end of the buoy to the object under tension. 51
59 The divers then surfaced and held a GPS receiver directly over the SMB for a time span of two minutes. The GPS receiver was the same unit used for the boat- towed survey, with approximately 1m accuracy, and wireless connection to the logging PC. Two minutes worth of data yielded probably an order of magnitude improvement in accuracy. The process was repeated for target 14 with equivalent results. The actual target positions are summarized in Table 1. Both targets are positioned to well within the expected resolution of the magnetic dataset, about ½ the line spacing. Figures 15 and 16 show close- ups of the two targets, illustrating the high resolution obtained by the side scan mosaic. The magnetic total- field grid was transparently overlaid over the mosaic. Each target s position is shown with a circle, and the target s verified position is shown with a X. In both cases, the target is clearly visible in the side scan record. The magnetic target picks and side scan images of each object correlate well with the verified positions in both cases. Figure 17A shows the same total- field / side scan mosaic overlay as in Figures 15 and 16, over the water intake pipelines, showing the close positional correlation between the anomalies and the side scan image. 52
.")

60 A B Figure 15: A) Magnetic total field overlaid on side-scan sonar mosaic for Target #1 (steel anchor). Circle marks the target position calculated from the ASA peak. The cross marks the target s true position as measured by divers. B) Underwater photo of 2 m-long steel anchor and chain. 53
. Circle marks the target position calculated from the ASA peak.")
 Underwater photo of two 1 cu-m concrete blocks and heavy steel cable seen protruding")
61 A B Figure 16: A) Magnetic total field overlaid on side-scan sonar mosaic for Target #14 (concrete blocks). Circle marks the target position calculated from the ASA peak. The cross marks the target s true position as measured by divers. B) Underwater photo of two 1 cu-m concrete blocks and heavy steel cable seen protruding between the blocks and extending to the right. 54


62 A B Figure 17: A) Total magnetic intensity map for a portion of pipelines overlaid on the side scan mosaic. While the eastern pipeline is only sporadically visible in the mosaic, it is clearly identified by the magnetic high. The western pipeline is clearly visible in the mosaic, and was photographed by divers B) Underwater photo of 1m diameter steel pipeline and concrete anchor. 55
3.6 Magnetic surveys. Sampling Time variations Gradiometers Processing. Sampling
 3.6 Magnetic surveys Sampling Time variations Gradiometers Processing Sampling Magnetic surveys can be taken along profiles or, more often, on a grid. The data for a grid is usually taken with fairly frequent
Recommended operating guidelines (ROG) for sidescan Sidescan sonar ROG in wrapper.doc English Number of pages: 9 Summary:
 for sidescan Sidescan sonar ROG in wrapper.doc English Number of pages: 9 Summary:") Title: Author(s): Document owner: Recommended operating guidelines (ROG) for sidescan sonar Dave Long (BGS) Dave Long (BGS) Reviewed by: Janine Guinan (MI) 07/09/07 Workgroup: MESH action: 2.1 Version:
Title: Author(s): Document owner: Recommended operating guidelines (ROG) for sidescan sonar Dave Long (BGS) Dave Long (BGS) Reviewed by: Janine Guinan (MI) 07/09/07 Workgroup: MESH action: 2.1 Version:
14/10/2013' Bathymetric Survey. egm502 seafloor mapping
 egm502 seafloor mapping lecture 10 single-beam echo-sounders Bathymetric Survey Bathymetry is the measurement of water depths - bathymetry is the underwater equivalent of terrestrial topography. A transect
Robin J. Beaman. School of Earth and Environmental Sciences, James Cook University, Cairns, Qld 4870, Australia.
 Robin J. Beaman School of Earth and Environmental Sciences, James Cook University, Cairns, Qld 4870, Australia. Email: robin.beaman@jcu.edu.au Seminar to SSSI Qld Hydrography Coping with Nature, Brisbane,
Emerging Subsea Networks
 THE FUTURE OF MARINE SURVEY APPLICATIONS FOR SUBMARINE CABLES Ryan Wopschall (Fugro) Email: rwopschall@fugro.com Fugro Pelagos, Inc. - 3574 Ruffin Road, San Diego, California 92123 USA Abstract: New advances
Vieques Underwater Demonstration Project
 Vieques Underwater Demonstration Project NOAA Office of Response and Restoration National Ocean Service 2006-2007 2007 University of New Hampshire Joint Hydrographic Center 2006 Science Application International
Sontek RiverSurveyor Test Plan Prepared by David S. Mueller, OSW February 20, 2004
 Sontek RiverSurveyor Test Plan Prepared by David S. Mueller, OSW February 20, 2004 INTRODUCTION Sontek/YSI has introduced new firmware and software for their RiverSurveyor product line. Firmware changes
NEED FOR SUPPLEMENTAL BATHYMETRIC SURVEY DATA COLLECTION
 305 West Grand Avenue, Suite 300 Montvale, New Jersey 07645 Phone 201.930.9890 Fax 201.930.9805 www.anchorqea.com M EMORANDUM To: Caroline Kwan and Nica Klaber U.S. Environmental Protection Agency Region
Potential applications of AUVs and Gliders in Offshore Windfarm Site Surveys
 Potential applications of AUVs and Gliders in Offshore Windfarm Site Surveys Dr James Hunt (National Oceanography Centre, Southampton) MREKE Internship in partnership with MARS at NOCS Introduction to
An Integrated Marine Gradiometer Array System (MGA)
") An Integrated Marine Gradiometer Array System (MGA) For Detection and Location of Chemical and Conventional UXO/MEC in Shallow to Deep Marine and Freshwater Environments Introduction Tetra Tech EC, Inc.
An Integrated Marine Gradiometer Array System (MGA) For Detection and Location of Chemical and Conventional UXO/MEC in Shallow to Deep Marine and Freshwater Environments Introduction Tetra Tech EC, Inc.
Acoustic Pipeline Inspection Mind The Gap
 Acoustic Pipeline Inspection Mind The Gap Mike Liddell Chief Surveyor, Fugro Survey Limited UUVS @ Oceanology 2012 13 th March 2012 Contents Menu Introduction to Pipeline Inspection The Current Toolkit
Advanced PMA Capabilities for MCM
 Advanced PMA Capabilities for MCM Shorten the sensor-to-shooter timeline New sensor technology deployed on off-board underwater systems provides navies with improved imagery and data for the purposes of
High Frequency Acoustical Propagation and Scattering in Coastal Waters
 High Frequency Acoustical Propagation and Scattering in Coastal Waters David M. Farmer Graduate School of Oceanography (educational) University of Rhode Island Narragansett, RI 02882 phone: (401) 874-6222
ROV Development ROV Function. ROV Crew Navigation IRATECH SUB SYSTEMS 2010
 IR AT EC H SU B SY ST EM S 20 10 Remotely Operated Vehicle ROV INTRODUCTORY 2008 2008 1 KEY POINTS ROV Introductory ROV Development ROV Function Types of ROV ROV Crew Navigation ROV Components 2 ROV Development
Specifications for Synchronized Sensor Pipe Condition Assessment (AS PROVIDED BY REDZONE ROBOTICS)
") Specifications for Synchronized Sensor Pipe Condition Assessment (AS PROVIDED BY REDZONE ROBOTICS) A. Scope of Work The work covered by these specifications consists of furnishing all materials, labor,
Specifications for Synchronized Sensor Pipe Condition Assessment (AS PROVIDED BY REDZONE ROBOTICS) A. Scope of Work The work covered by these specifications consists of furnishing all materials, labor,
Utilizing Vessel Based Mobile LiDAR & Bathymetry Survey Techniques for Survey of Four Southern California Breakwaters
 Utilizing Vessel Based Mobile LiDAR & Bathymetry Survey Techniques for Survey of Four Southern California Breakwaters Western Dredging Association: Pacific Chapter September 2012 Insert: Pipe Location
from ocean to cloud PARAMETRIC SUB-BOTTOM PROFILER, A NEW APPROACH FOR AN OLD PROBLEM
 PARAMETRIC SUB-BOTTOM PROFILER, A NEW APPROACH FOR AN OLD PROBLEM Geoff Holland, Alcatel-Lucent Submarine Networks Geoff.holland@alcatel-lucent.com Alcatel-Lucent Submarine Networks Ltd, Christchurch Way,
Body Search and Recovery Using Sonar
 Body Search and Recovery Using Sonar Photos Mark W. Atherton Mark W. Atherton, Echoes and Images Image courtesy FBI Dive Team Images not for distribution. All photographs and drawings courtesy and Mark
Advantages of Using Combined Bathymetry and Side Scan Data in Survey Processing T.M. Hiller, L.N. Brisson
 Advantages of Using Combined Bathymetry and Side Scan Data in Survey Processing T.M. Hiller, L.N. Brisson EdgeTech, West WareHam MA, USA EdgeTech 6205 Combined Bathymetric and Side Scan Sonar EdgeTech
NOAA s Underwater UXO Demonstration Projects Vieques Island, Puerto Rico
 NOAA s Underwater UXO Demonstration Projects Vieques Island, Puerto Rico Vieques Restoration Advisory Board Meeting May 7, 2008 Jason Rolfe NOAA s Office of Response & Restoration NOAA s Underwater UXO
TRIAXYS Acoustic Doppler Current Profiler Comparison Study
 TRIAXYS Acoustic Doppler Current Profiler Comparison Study By Randolph Kashino, Axys Technologies Inc. Tony Ethier, Axys Technologies Inc. Reo Phillips, Axys Technologies Inc. February 2 Figure 1. Nortek
Copicut Reservoir Sidescan Sonar. Fall River, MA May 7, 2013
 Copicut Reservoir Sidescan Sonar Fall River, MA May 7, 2013 1 Table of Contents Section 1: Mission Overview... 3 Background... 3 Vehicle General Information... 3 Vehicle Mission Details... 4 Area of Operation...
Increased streamer depth for dual-sensor acquisition Challenges and solutions Marina Lesnes*, Anthony Day, Martin Widmaier, PGS
 Increased streamer depth for dual-sensor acquisition Challenges and solutions Marina Lesnes*, Anthony Day, Martin Widmaier, PGS Summary The towing depth applicable to dual-sensor streamer acquisition has
Challenges in determining water surface in airborne LiDAR topobathymetry. Amar Nayegandhi, Dewberry 15 th Annual JALBTCX Workshop, June 11 th 2014
 Challenges in determining water surface in airborne LiDAR topobathymetry Amar Nayegandhi, Dewberry 15 th Annual JALBTCX Workshop, June 11 th 2014 Why topobathy LiDAR? Complements acoustic (multi-beam sonar)
BACKGROUND TO STUDY CASE
 BACKGROUND TO STUDY CASE German Aerospace Center (DLR) is using Andøya Rocket Range for a sounding rocket campaign. On 27th October 2005 a 300 kg payload (SHEFEX) was launched Due do a technical problems
Cooperative Navigation for Autonomous Underwater Vehicles. Navigare 2011, 4 May 2011, Bern
 Cooperative Navigation for Autonomous Underwater Vehicles Navigare 2011, 4 May 2011, Bern Distributed Intelligent Systems and Algorithms Laboratory disal.epfl.ch Alexander Bahr Land, atmosphere and sea
Evaluation of the Klein HydroChart 3500 Interferometric Bathymetry Sonar for NOAA Sea Floor Mapping
 Evaluation of the Klein HydroChart 3500 Interferometric Bathymetry Sonar for NOAA Sea Floor Mapping Yuhui Ai, Straud Armstrong and Dean Fleury L-3 Communications Klein Associates, Inc. 11 Klein Dr. Salem,
ScanFish Katria. Intelligent wide-sweep ROTV for magnetometer surveys
 ScanFish Katria Intelligent wide-sweep ROTV for magnetometer surveys User-friendly control and monitoring software solution The ScanFish Katria comes with the ScanFish III Flight software, which is an
Interim Operating Procedures for SonTek RiverSurveyor M9/S5
 Hydroacoustics Technical Working Group: Task 2.3 Fully operationalize auto-adapting ADCPs Interim Operating Procedures for SonTek RiverSurveyor M9/S5 P Campbell, E. Jamieson, F Rainville, A Du Cap, 2014
MISSION PLANNING AND DATA ACQUISITION SOFTWARE
 MISSION PLANNING AND DATA ACQUISITION SOFTWARE INTENTIONALLY BLANK Introduction to Divelog Shark Marine s Divelog software was created to integrate data collected from an array of sensors, real-time with
UTEC Survey Pipeline Inspection Using Low Logistic AUV June 2016
 SUCCESS YOU CAN MEASURE UTEC Survey Pipeline Inspection Using Low Logistic AUV June 2016 Chris Erni Product Line Manager E T H I C S P E R F O R M A N C E E X C E L L E N C E P E O P L E GLOBAL FOOTPRINT
BOTTOM MAPPING WITH EM1002 /EM300 /TOPAS Calibration of the Simrad EM300 and EM1002 Multibeam Echo Sounders in the Langryggene calibration area.
 BOTTOM MAPPING WITH EM1002 /EM300 /TOPAS Calibration of the Simrad EM300 and EM1002 Multibeam Echo Sounders in the Langryggene calibration area. by Igor Kazantsev Haflidi Haflidason Asgeir Steinsland Introduction
I. Monitoring and Adaptive Management Approach. Potential Effects, Monitoring Studies & Mitigation
 I. Monitoring and Adaptive Management Approach Define the problem or management objective. Determine potential effects of the project on indicator species. Emphasis on examining potentially negative, rather
STOPPING THE UNDERWATER DIVER THREAT
 STOPPING THE UNDERWATER DIVER THREAT Dr. Robert F. De La Croix and Mr. Juergen G. Keil A non-lethal, scalable deterrent solution Updated from original article published in Maritime Technology Reporter,
Survey design and acquisition of a 4-C ocean-bottom seismometer survey over the White Rose oilfield, offshore Newfoundland
 White Rose OBS, 2002 Survey design and acquisition of a 4-C ocean-bottom seismometer survey over the White Rose oilfield, offshore Newfoundland Kevin W. Hall and Robert R. Stewart ABSTRACT CREWES, in conjunction
Autosub6000. Results of its Engineering Trials and First Science Missions
 Autosub6000 Results of its Engineering Trials and First Science Missions Stephen McPhail, Maaten Furlong, Veerle Huvenne, Peter Stevenson, Miles Pebody, James Perrett NOC, Southampton, UK Objectives of
DUALEM EM EQUIPMENT. Geostudi Astier srl Via Nicolodi, Livorno Italy
 DUALEM EM EQUIPMENT DUALEM instruments (e.g. the DUALEM-1) incorporate a DUALEM sensor as well as an internal WAAS-enabled GPS receiver, a hand-held weatherproof display/keypad/power-supply, a carrying
Geostrophic and Tidal Currents in the South China Sea, Area III: West Philippines
 Southeast Asian Fisheries Development Center Geostrophic and Tidal Currents in the South China Sea, Area III: West Philippines Anond Snidvongs Department od Marine Science, Chulalongkorn University, Bangkok
Digiquartz Water-Balanced Pressure Sensors for AUV, ROV, and other Moving Underwater Applications
 Digiquartz Water-Balanced Pressure Sensors for AUV, ROV, and other Moving Underwater Applications Dr. Theo Schaad Principal Scientist Paroscientific, Inc. 2002 Paroscientific, Inc. Page 1 of 6 Digiquartz
Deploying the TCM-1 Tilt Current Meter in an Inverted (Hanging) Orientation By: Nick Lowell, Founder & President
 Orientation By: Nick Lowell, Founder & President") Lowell Instruments Application Note #TCMA Deploying the TCM-1 Tilt Current Meter in an Inverted (Hanging) Orientation By: Nick Lowell, Founder & President 1 Introduction The TCM-1 Tilt Current Meter (TCM)
Lowell Instruments Application Note #TCMA Deploying the TCM-1 Tilt Current Meter in an Inverted (Hanging) Orientation By: Nick Lowell, Founder & President 1 Introduction The TCM-1 Tilt Current Meter (TCM)
High Definition Laser Scanning (HDS) Underwater Acoustic Imaging and Profiling
 Underwater Acoustic Imaging and Profiling") High Definition Laser Scanning (HDS) Underwater Acoustic Imaging and Profiling Images at Depth: The Use of Acoustic Imaging on Large River Crossings A Case Study AGENDA Background of project Review of
High Definition Laser Scanning (HDS) Underwater Acoustic Imaging and Profiling Images at Depth: The Use of Acoustic Imaging on Large River Crossings A Case Study AGENDA Background of project Review of
Wade Reynolds 1 Frank Young 1,2 Peter Gibbings 1,2. University of Southern Queensland Toowoomba 4350 AUSTRALIA
 A Comparison of Methods for Mapping Golf Greens Wade Reynolds 1 Frank Young 1,2 Peter Gibbings 1,2 1 Faculty of Engineering and Surveying 2 Australian Centre for Sustainable Catchments University of Southern
Scanning Sonar and ROV Operations. For Underwater SAR Imaging Applications
 Scanning Sonar and ROV Operations For Underwater SAR Imaging Applications This training module provides information specific to integrating scanning sonar onto an ROV platform and fundamentals in using
Products and Services HR3D, AUV3D
 Products and Services HR3D, AUV3D Multi-streamer Short Offset High Resolution 3D Seismic Acquisition Peter Sack Tor Haugland Sound Oceanics, LLC Houston, Texas USA 15 March 2012 Background Petromar V West
RAMSTM. 360 Riser and Anchor-Chain Integrity Monitoring for FPSOs
 RAMS 360 Riser and Anchor-Chain Integrity Monitoring for FPSOs Introduction to RAMS Tritech s RAMS is a 360 anchor-chain and riser integrity monitoring system for Floating Production Storage and Offloading
Currents measurements in the coast of Montevideo, Uruguay
 Currents measurements in the coast of Montevideo, Uruguay M. Fossati, D. Bellón, E. Lorenzo & I. Piedra-Cueva Fluid Mechanics and Environmental Engineering Institute (IMFIA), School of Engineering, Research
DETRMINATION OF A PLUNGER TYPE WAVE MAKER CHARACTERISTICE IN A TOWING TANK
 The 9 th International Conference on Coasts, Ports and Marine Structures (ICOPMAS 2010) 29 Nov.-1 Dec. 2010 (Tehran) DETRMINATION OF A PLUNGER TYPE WAVE MAKER CHARACTERISTICE IN A TOWING TANK sayed mohammad
EXPERIMENTAL RESULTS OF GUIDED WAVE TRAVEL TIME TOMOGRAPHY
 18 th World Conference on Non destructive Testing, 16-20 April 2012, Durban, South Africa EXPERIMENTAL RESULTS OF GUIDED WAVE TRAVEL TIME TOMOGRAPHY Arno VOLKER 1 and Hendrik VOS 1 TNO, Stieltjesweg 1,
Nortek Technical Note No.: TN-021. Chesapeake Bay AWAC Evaluation
 Nortek Technical Note No.: TN-021 Title: Chesapeake Bay AWAC Evaluation Last Edited: October 5, 2004 Authors: Eric Siegel-NortekUSA, Chris Malzone-NortekUSA, Torstein Pedersen- Number of Pages: 12 Chesapeake
DQM Annual Hopper QA Checks
 DQM Annual Hopper QA Checks The following document is intended to be a guide for conducting annual Dredge Quality Management quality assurance checks on hopper dredges. The procedures should provide general
LEADER SEARCH RADAR LIFE LOCATOR
 INTRODUCTION OF: Ultra Wide Band Victims detector & Locator V30.09.13.00 Product Concept i. The is designed to be simplistic in use whilst producing reliable and accurate information in the search for
Background Paper: Surveys. Nord Stream 2 AG Sep-17
 Nord Stream 2 AG Sep-17 Table of Contents Introduction... 3 Advanced Technology... 4 Survey Stages... 4 2 Introduction Survey operations are the cornerstone of massive international infrastructure projects
COMPARISON OF DEEP-WATER ADCP AND NDBC BUOY MEASUREMENTS TO HINDCAST PARAMETERS. William R. Dally and Daniel A. Osiecki
 COMPARISON OF DEEP-WATER ADCP AND NDBC BUOY MEASUREMENTS TO HINDCAST PARAMETERS William R. Dally and Daniel A. Osiecki Surfbreak Engineering Sciences, Inc. 207 Surf Road Melbourne Beach, Florida, 32951
Focus on Operational Efficiency and Crew Safety - Introducing Advanced ROV Technology in Marine Towed Streamer Seismic
 Focus on Operational Efficiency and Crew Safety - Introducing Advanced ROV Technology in Marine Towed Streamer Seismic R. Tonnessen* (Petroleum Geo-Services) & T. Skadberg (Petroleum Geo- Services) SUMMARY
The Performance of Vertical Tunnel Thrusters on an Autonomous Underwater Vehicle Operating Near the Free Surface in Waves
 Second International Symposium on Marine Propulsors smp 11, Hamburg, Germany, June 2011 The Performance of Vertical Tunnel Thrusters on an Autonomous Underwater Vehicle Operating Near the Free Surface
BERNOULLI EFFECTS ON PRESSURE.ACTIVATED W ATER LEVEL GAUGES
 International Hydrographic R eview, Monaco, LV (2), July 1978. BERNOULLI EFFECTS ON PRESSURE.ACTIVATED W ATER LEVEL GAUGES by Langley R. MUIR Ocean and Aquatic Sciences, Central Region, Burlington, Ontario,
East Isa Airborne Electromagnetic Survey, QLD, 2016 Contractor supplied data and conductivity models
 East Isa Airborne Electromagnetic Survey, QLD, 2016 Contractor supplied data and conductivity models Geoscience Australia & Geological Survey of Queensland, Versatile Time Domain Electromagnetic (VTEM
Hydrographic Surveying Methods, Applications and Uses
 Definition: Hydrographic Surveying Methods, Applications and Uses It is the branch of surveying which deals with any body of still or running water such as a lake, harbor, stream or river. Hydrographic
MAPCO2 Buoy Metadata Report Project Title:
 MAPCO2 Buoy Metadata Report Project Title: Autonomous Multi-parameter Measurements from a Drifting Buoy During the SO GasEx Experiment Funding Agency: NOAA Global Carbon Cycle program PI(s): Christopher
Temperature, salinity, density, and the oceanic pressure field
 Chapter 2 Temperature, salinity, density, and the oceanic pressure field The ratios of the many components which make up the salt in the ocean are remarkably constant, and salinity, the total salt content
Marine Renewables Industry Association. Marine Renewables Industry: Requirements for Oceanographic Measurements, Data Processing and Modelling
 Marine Renewables Industry Association Marine Renewables Industry: Requirements for Oceanographic Measurements, Data Processing and Modelling October 2009 Table of Contents 1. Introduction... 1 2. Measurements
Lecture 8. Sound Waves Superposition and Standing Waves
 Lecture 8 Sound Waves Superposition and Standing Waves Sound Waves Speed of Sound Waves Intensity of Periodic Sound Waves The Doppler Effect Sound Waves are the most common example of longitudinal waves.
Data Collection and Processing: Elwha Estuary Survey, February 2013
 Data Collection and Processing: Elwha Estuary Survey, February 2013 Ian Miller, WA Sea Grant Olympic Peninsula Field Office, 1502 E. Lauridsen Blvd #82, Port Angeles, WA 98362 immiller@u.washington.edu
Tutorial for the. Total Vertical Uncertainty Analysis Tool in NaviModel3
 Tutorial for the Total Vertical Uncertainty Analysis Tool in NaviModel3 May, 2011 1. Introduction The Total Vertical Uncertainty Analysis Tool in NaviModel3 has been designed to facilitate a determination
DEPARTMENT OF THE NAVY DIVISION NEWPORT OFFICE OF COUNSEL PHONE: FAX: DSN:
 IMAVSBA WARFARE CENTERS NEWPORT DEPARTMENT OF THE NAVY NAVAL UNDERSEA WARFARE CENTER DIVISION NEWPORT OFFICE OF COUNSEL PHONE: 401 832-3653 FAX: 401 832-4432 DSN: 432-3653 Attorney Docket No. 85031 Date:
APPLICATION OF SOUND PROPAGATION (IN THE PERSIAN GULF AND OMAN SEA)
") APPLICATION OF SOUND PROPAGATION (IN THE PERSIAN GULF AND OMAN SEA) Seyed Majid Mosaddad Department of Physics, Shoushtar Branch, Islamic Azad University, Shoushtar, Iran Email: mosaddad5@gmail.com Abstract
APPLICATION OF SOUND PROPAGATION (IN THE PERSIAN GULF AND OMAN SEA) Seyed Majid Mosaddad Department of Physics, Shoushtar Branch, Islamic Azad University, Shoushtar, Iran Email: mosaddad5@gmail.com Abstract
Air-Sea Interaction Spar Buoy Systems
 DISTRIBUTION STATEMENT A: Distribution approved for public release; distribution is unlimited Air-Sea Interaction Spar Buoy Systems Hans C. Graber CSTARS - University of Miami 11811 SW 168 th Street, Miami,
Figure 4, Photo mosaic taken on February 14 about an hour before sunset near low tide.
 The Impact on Great South Bay of the Breach at Old Inlet Charles N. Flagg and Roger Flood School of Marine and Atmospheric Sciences, Stony Brook University Since the last report was issued on January 31
Level MEASUREMENT 1/2016
 Level MEASUREMENT 1/2016 AGENDA 2 A. Introduction B. Float method C. Displacer method D. Hydrostatic pressure method E. Capacitance method G. Ultrasonic method H. Radar method I. Laser method J. Level
The MEDUSA Deep Sea and FUSION AUVs:
 1 The MEDUSA Deep Sea and FUSION AUVs: When Research and business get together EMRA 2017, Girona, Spain 15 May 2017 Bruno Cardeira/IST Deep Ocean Exploration -Why the effort? Portugal Exclusive Economic
IFREMER, Department of Underwater Systems, Toulon, France. L u c i e Somaglino, P a t r i c k J a u s s a u d, R o main P i a s co, E w e n Raugel
 F i r s t s e a t r i a l s w i t h E M 2 0 4 0 m u l t i b e a m s o u n d e r i n n o v a t i v e i n t e g r a t i o n o n H y b r i d R O V A r i a n e IFREMER, Department of Underwater Systems, Toulon,
Acoustic Focusing in Shallow Water and Bubble Radiation Effects
 Acoustic Focusing in Shallow Water and Bubble Radiation Effects Grant B. Deane Marine Physical Laboratory, Scripps Institution of Oceanography UCSD, La Jolla, CA 92093-0238 Phone: (858) 534-0536 fax: (858)
Ship Resistance and Propulsion Prof. Dr. P. Krishnankutty Ocean Department Indian Institute of Technology, Madras
 Ship Resistance and Propulsion Prof. Dr. P. Krishnankutty Ocean Department Indian Institute of Technology, Madras Lecture - 6 Bulbous Bow on Ship Resistance Welcome back to the class we have been discussing
Aspects of gravimeter calibration by time domain comparison of gravity records
 1 of 8 2/18/2011 3:51 PM Aspects of gravimeter calibration by time domain comparison of gravity records Bruno Meurers Institute for Meteorology and Geophysics University of Vienna bruno.meurers@univie.ac.at
ZIPWAKE DYNAMIC TRIM CONTROL SYSTEM OUTLINE OF OPERATING PRINCIPLES BEHIND THE AUTOMATIC MOTION CONTROL FEATURES
 ZIPWAKE DYNAMIC TRIM CONTROL SYSTEM OUTLINE OF OPERATING PRINCIPLES BEHIND THE AUTOMATIC MOTION CONTROL FEATURES TABLE OF CONTENTS 1 INTRODUCTION 3 2 SYSTEM COMPONENTS 3 3 PITCH AND ROLL ANGLES 4 4 AUTOMATIC
Fail Operational Controls for an Independent Metering Valve
 Group 14 - System Intergration and Safety Paper 14-3 465 Fail Operational Controls for an Independent Metering Valve Michael Rannow Eaton Corporation, 7945 Wallace Rd., Eden Prairie, MN, 55347, email:
Saab Seaeye Cougar XT Compact
 The Seaeye Cougar-XT Compact is a highly flexible and extremely powerful electric ROV with working depths of 300 metres. This system comes with almost all of the specifications of the very reliable Couger-XT
The Baltic Diver ROV-Services
 The Baltic Diver ROV-Services Comanche ROV The Baltic Diver Comanche ROV is the ideal choice when seeking a Work Class Solution in a small package. Baltic Taucherei- und Bergungsbetrieb Rostock GmbH Main
SeaSmart. Jonathan Evans
 SeaSmart A new approach for rapid, on-site resource assessment at potential tidal stream energy array sites using MAS Marine Solutions for the Deep Data World Jonathan Evans Presentation Outline Marine
Overview: Underwater sensing
 Overview: Underwater sensing Vasilescu, I., Kotay, K., Rus, D., Dunbabin, M., and Corke, P. Data collection, storage, and retrieval with an underwater sensor network. In SenSys '05 Experimental results
THE CHALLENGES OF A LARGE-AREA BATHYMETRIC SURVEY
 THE CHALLENGES OF A LARGE-AREA BATHYMETRIC SURVEY Agenda: - Introduction - Tender - Project Planning - Survey - Processing - Delivery - Conclusion 2 Introduction We know less of the oceans at our feet,
IMPACTS OF COASTAL PROTECTION STRATEGIES ON THE COASTS OF CRETE: NUMERICAL EXPERIMENTS
 IMPACTS OF COASTAL PROTECTION STRATEGIES ON THE COASTS OF CRETE: NUMERICAL EXPERIMENTS Tsanis, I.K., Saied, U.M., Valavanis V. Department of Environmental Engineering, Technical University of Crete, Chania,
Using AUVs in Under-Ice Scientific Missions
 Using AUVs in Under-Ice Scientific Missions James Ferguson, International Submarine Engineering Ltd. Presented at Arctic Change 08 11 Decenber 2008- Quebec City, Canada 1/16 ISE s s Experience in Arctic
An Assessment of Quality in Underwater Archaeological Surveys Using Tape Measurements
 An Assessment of Quality in Underwater Archaeological Surveys Using Tape Measurements Peter Holt 3H Consulting Ltd, 6 Honcray, Oreston, Plymouth, Devon, PL9 9XB The quality of a typical underwater archaeological
High Frequency Acoustical Propagation and Scattering in Coastal Waters
 High Frequency Acoustical Propagation and Scattering in Coastal Waters David M. Farmer Graduate School of Oceanography (educational) University of Rhode Island Narragansett, RI 02882 Phone: (401) 874-6222
CoastaZ Engineering. Technical Note AIRBORNE COASTAL CURRENT EVALUATION SURVEY SYSTEM
 CETN VI-25 (Dee 92) CoastaZ Engineering Technical Note AIRBORNE COASTAL CURRENT EVALUATION SURVEY SYSTEM PURPOSE: This Technical Note introduces a new method for collecting current measurements at multiple
A STUDY OF THE LOSSES AND INTERACTIONS BETWEEN ONE OR MORE BOW THRUSTERS AND A CATAMARAN HULL
 A STUDY OF THE LOSSES AND INTERACTIONS BETWEEN ONE OR MORE BOW THRUSTERS AND A CATAMARAN HULL L Boddy and T Clarke, Austal Ships, Australia SUMMARY CFD analysis has been conducted on a 100m catamaran hull
Malta Survey activities
 Malta Survey activities Malta 19 September 2016 L. Facchin OGS National Institute of Oceanography and Experimental Geophysics Offshore Multibeam (MBES) Sub bottom profiling (SBP: Chirp or Boomer) Multichannel
Product highlights Variable frequency and thrust
 Innovative engineering for extreme global environments FT550 - VIBROCORER The 3rd generation FT550 lightweight variable frequency high power vibrocorer leads the market in its technical innovation and
MEASUREMENT COMMUNICATION INSIGHT
 Temperature & Depth MEASUREMENT COMMUNICATION INSIGHT CONTENTS Introduction to Aquatec Measuring Temperature and Depth 2 3 Aquatec s Temperature and Depth Loggers AQUAlogger 520 AQUAlogger 530 AQUAlogger
Undertow - Zonation of Flow in Broken Wave Bores
 Nearshore Circulation Undertow and Rip Cells Undertow - Zonation of Flow in Broken Wave Bores In the wave breaking process, the landward transfer of water, associated with bore and surface roller decay
SAND BOTTOM EROSION AND CHANGES OF AN ACTIVE LAYER THICKNESS IN THE SURF ZONE OF THE NORDERNEY ISLAND
 SAND BOTTOM EROSION AND CHANGES OF AN ACTIVE LAYER THICKNESS IN THE SURF ZONE OF THE NORDERNEY ISLAND Kos'yan R. 1, Kunz H. 2, Podymov l. 3 1 Prof.Dr.,The Southern Branch of the P.P.Shirshov Institute
ENVIRONMENTALLY ADAPTIVE SONAR
 ENVIRONMENTALLY ADAPTIVE SONAR Ole J. Lorentzen a, Stig A. V. Synnes a, Martin S. Wiig a, Kyrre Glette b a Norwegian Defence Research Establishment (FFI), P.O. box 25, NO-2027 KJELLER, Norway b University
General Dynamics Canada Whitepaper. Abstract
 Advanced Robotics for Next generation Mine Countermeasures Abstract Maritime mines are one of the most cost effective weapons in the naval arsenal. They deny access to coastal zones, thereby seriously
Seismic Survey Designs for Converted Waves
 Seismic Survey Designs for Converted Waves James A. Musser* GMG/AXIS Inc., Denver, CO 1720 Red Cloud Road, Longmont, CO, 80501, USA jmusser@gmg.com ABSTRACT Designing converted wave 3D surveys is considerably
NOTICE. The above identified patent application is available for licensing. Requests for information should be addressed to:
 Serial Number 09/113.010 Filing Date 26 June 1998 Inventor Daniel M. Glenning Michael Visich NOTICE The above identified patent application is available for licensing. Requests for information should be
TLP Minimum tendon tension design and tendon down-stroke investigation
 Published by International Association of Ocean Engineers Journal of Offshore Engineering and Technology Available online at www.iaoejoet.org TLP Minimum tendon tension design and tendon down-stroke investigation
BUYER S GUIDE AQUAlogger 530WTD
 OCEAN & ENVIRONMENTAL BUYER S GUIDE AQUAlogger 530WTD Wireless Temperature and Depth Logger AQUAlogger 530WTD The AQUAlogger 530WTD has an innovative design that includes the ability to transfer stored
Shallow Water Bathymetry using the REMUS 100 Autonomous Underwater Vehicle
 Shallow Water Bathymetry using the REMUS 100 Autonomous Underwater Vehicle Michael Bell Maritime Division Defence Science and Technology Organisation DSTO-TR-2916 ABSTRACT This report describes assessments
Dynamic Positioning: Method for Disaster Prevention and Risk Management
 Available online at www.sciencedirect.com ScienceDirect Procedia Earth and Planetary Science 11 ( 2015 ) 216 223 Global Challenges, Policy Framework & Sustainable Development for Mining of Mineral and