Guidelines for Real Time Sampling & Analyses
|
|
|
- Brianna Simon
- 6 years ago
- Views:
Transcription


1 Guidelines for the Measurement of Ambient Air Pollutants VOLUME-II Guidelines for Real Time Sampling & Analyses CENTRAL POLLUTION CONTROL BOARD (Ministry of Environment & Forests, Govt. of India) Parivesh Bhawan, East Arjun Nagar Delhi Website: May, 2011
2 Contribution Overall Guidance & Supervision Sh. J. S. Kamyotra Dr. D. Saha Laboratory experiments & Drafting of Guidelines Sh. D. C. Jakhwal Sh. Rajinder Singh Sh. Vedparkash Sh. L. K Kapila Sh. Rattanlal Sh. Subhash Chand Editing, Charts & Computer Setting Dr. D. Saha Sh. D. C. Jakhwal Sh. Fasiur Rehman Ms. Shaveta Kohli i
3 Background Guidelines for Sampling and Measurement of notified Ambient Air Quality Parameters (NAAQS 2009) Under the provisions of the Air (Prevention & Control of Pollution) Act, 1981, the CPCB has notified fourth version of National Ambient Air Quality Standards (NAAQS) in This revised national standard aims to provide uniform air quality for all, irrespective of land use pattern, across the country. There are 12 identified health based parameters, which are to measure at the national level and with a view to have data comparison, need for uniform guidelines for monitoring, sampling, analyses, sample flow chart, data sheet based on standard method has been felt. The methods prescribed in the notification for respective parameters are the combination of physical method, wet-chemical method and continuous online method. Therefore, to meet the NAAQS requirement, a combination of both manual and continuous method is invariably required at each monitoring location, besides good laboratory set up and infrastructure. In addition to the above, an in house exercise for applicability of all prescribed / recommended analytical methods was also felt necessary. After review and demonstration in the Central Laboratory, Delhi, guidelines are being prepared and documented, as under: 1. Volume I: Guidelines for manual sampling and analyses (along with sample flow chart and data sheets); 2. Volume-II: Guidelines for real time sampling and analyses 3. Volume-III: Reference methods for manual sampling and analyses (compilation) 4. Volume-IV: Reference methods for continuous sampling and real time analyses (compilation) Note: Guidelines are laboratory and infrastructure specific thus may not be applicable uniformly and need to develop based on infrastructure and expertise ii
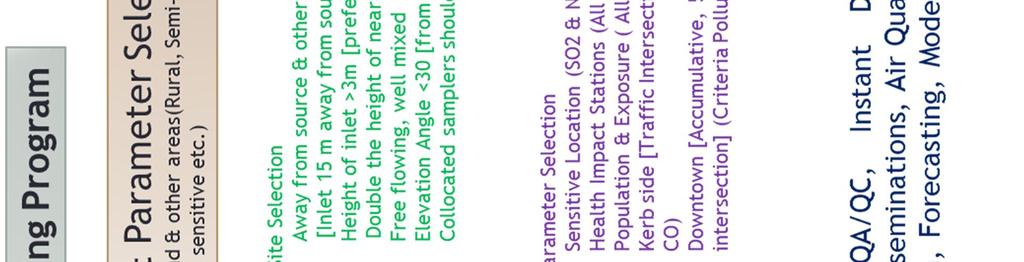
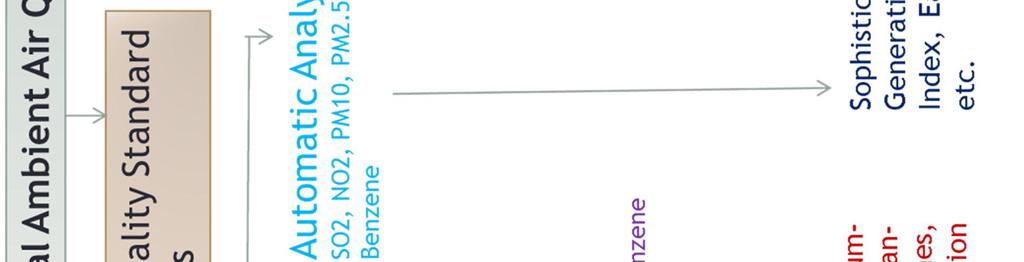
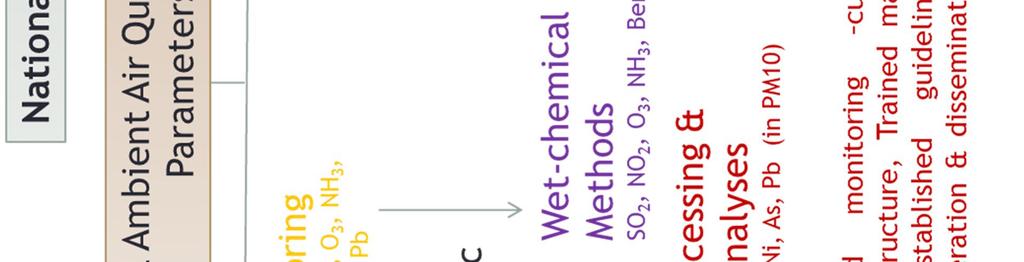
4 Pollutants Sulphur Dioxide (SO2), µg/m 3 Nitrogen Dioxide (NO 2), µg/m 3 Particulate Matter (Size less than 10µm) or PM 10, µg/m 3 Particulate Matter (Size less than 2.5µm) or PM 2.5, µg/m 3 Ozone (O 3) µg/m 3 Lead (Pb) µg/m 3 Carbon Monoxide (CO), mg/m 3 Ammonia (NH3), µg/m 3 Benzene (C 6H 6), µg/m 3 Benzo(a)Pyrene (BaP) Particulate phase only, ng/m 3 Arsenic (As), ng/m 3 Nickel (Ni), ng/m 3 NATIONAL AMBIENT AIR QUALITY STANDARDS (2009) Time Weighted Average Concentration in Ambient Air Industrial, Ecologically Residential, Sensitive Area Rural and (Notified by other Areas Central Government) Methods of Measurement Annual * 24 Hours ** -Improved West and Gaeke Method -Ultraviolet Fluorescence Annual * Jacob & Hochheiser modified 24 Hours ** (NaOH-NaAsO 2) Method -Gas Phase Chemiluminescence Annual * Gravimetric 24 Hours ** TEOM -Beta attenuation Annual * Gravimetric 24 Hours ** TEOM -Beta attenuation 8 Hours * UV Photometric 1 Hour ** Chemiluminescence -Chemical Method Annual * AAS/ICP Method after sampling on 24 Hours ** EPM 2000 or equivalent filter paper -ED-XRF using Teflon filter 8 Hours ** Non dispersive Infrared (NDIR) 1 Hour ** Spectroscopy Annual * Chemiluminescence 24 Hours ** Indophenol blue method Annual * Gas Chromatography (GC) based continuous analyzer -Adsorption and desorption followed by GC analysis Annual * Solvent extraction followed by HPLC/GC analysis Annual * AAS/ICP Method after sampling on EPM 2000 or equivalent filter paper Annual * AAS/ICP Method after sampling on EPM 2000 or equivalent filter paper * Annual Arithmetic mean of minimum 104 measurements in a year at a particular site taken twice a week 24 hourly at uniform intervals. ** 24 hourly or 8 hourly or 1 hourly monitored values, as applicable, shall be complied with 98% of the time in a year. 2% of the time, they may exceed the limits but not on two consecutive days of monitoring. NOTE: Whenever and wherever monitoring results on two consecutive days of monitoring exceed the limits specified above for the respective category, it shall be considered adequate reason to institute regular or continuous monitoring and further investigations. iii


5 iv


6 v
7 Contents S. No. Page 1. Guidelines for Automatic Measurement of Sulphur Dioxide in ambient air (UV Fluorescence Method) 2. Guidelines for Automatic Measurement of Particulate Matter (PM 2.5 and PM 10) in ambient air (Beta Attenuation Method) 3. Guidelines for Automatic Measurement of Carbon Monoxide (CO) in ambient air (Non-Dispersive Infrared Method) 4. Guidelines for Automatic Measurement of Oxides of Nitrogen (NO NO 2 - NO x) and Ammonia (NH 3) in ambient air (Chemiluminescence Method) 5. Guidelines for Automatic Measurement of Ozone (O3) in ambient air (UV Photometric Method) Guidelines for Automatic Measurement of benzene (BTX) in ambient air (Gas Chromatography based Continuous Method) vi
8 Guidelines for Automatic Measurement of Sulphur Dioxide in ambient air (UV fluorescence method) 1.0 Purpose The purpose of this protocol is to provide guidelines for monitoring of Sulphur Dioxide (SO 2) in ambient air. 2.0 Principle The UV fluorescence method is based on the fluorescence emission of light by SO 2 molecules previously excited by UV radiation. The first reaction step is: SO 2 + hυ 1 (UV) SO 2 * Then in the second step, the excited SO 2 * molecule returns to the original ground state, emitting an energy Hυ 1 according to the reaction: SO 2* SO 2 + hυ 1 (UV) The intensity of the fluorescent radiation is proportional to the number of SO 2 molecules in the detection volume and is therefore proportional to the concentration of SO 2. Therefore: F = k [SO 2] Where: F = is the intensity of fluorescence radiation; K = is the factor of proportionality; [SO 2] = concentration of SO 2 The air sample flows into the inlet of the analyser where it is scrubbed to remove any interference by aromatic hydrocarbons that may be present. A hydrocarbon scrubber device usually accomplishes this. Then the air sample flows into a reaction chamber, where it is irradiated by UV radiation with a wavelength range of ( ) nm. The UV fluorescence light, in the wavelength range of ( ) nm, is optically filtered and then converted to an electrical signal by a UV detector, for example, a photomultiplier tube. The response of the analyser is proportional to the number of SO 2 molecules in the reaction chamber. Therefore, either temperature or pressure has to be kept constant, or if variation of these parameters is expected, the measured values 1 P a g e
9 have to be corrected. For this UV fluorescence method to yield accurate concentration measurements, it must be calibrated against some primary standard (see clause 5.4). 3.0 Instrument/Equipment 3.1 UV fluorescence Analyser - for measurement of Sulphur Dioxide in air The analyser should be complete with analyser section, sample pump, detector amplifier/control section, meter, and recording system. The UV fluorescence analyser shall meet the performance specifications as prescribed. The main components are described below. 3.2 Selective Traps for Interfering Agents One or more selective traps should be used before the reaction chamber to remove interfering gases such as aromatic hydrocarbons. These selective traps shall not retain any SO 2 and shall be changed in accordance with manufacturer s instruction manual. If high concentrations of H 2S are expected in the ambient air, a selective scrubber should be used. 3.3 Optical Assembly and Fluorescence Cell The UV lamp emission may be pulsed electronically or mechanically for synchronous detection and amplification of the signal. The lamp shall have a stabilised power supply to ensure a stable emission of light. An optical filter is used to restrict the wavelengths to a range, which allows excitation of the SO2 molecule and yet minimise the interference of water vapour, aromatic hydrocarbons or nitric oxide. The UV detector, for example, the photomultiplier tube, detects the fluorescence light emitted by the SO 2 molecules in the reaction chamber. A selective optical filter placed in front of the UV detector, reduces the signal due to scattering of the incident light. The reaction chamber shall be made of material inert to SO2 and UV radiation. The cell should be heated above the dew point to avoid water condensation, and temperature fluctuations. The optical trap of the chamber prevents reflection of the exciting UV radiation. The optical assembly should be placed in a heated enclosure. 3.4 Pressure Regulator The output signal of the analyser depends on the pressure in the reaction chamber and is therefore proportional to the density of SO 2 (number of SO 2 molecules) present in the reaction chamber. Variations of internal pressure shall be measured and the signal corrected or controlled by means of a regulator. The 2 P a g e
10 signal may have to be corrected also for external pressure and temperature fluctuations. Significant pressure corrections are due to synoptic meteorological changes (up to + 3%) or by the attitude of the measurement site (about 10% decrease in pressure for an 800 m rise in attitude). Note: One of the main causes of a reduced pressure in the reaction chamber is a pressure drop in the sample line. 3.5 Flow Rate Controller and Indicator It is recommended that the flow rate be kept constant by means of a flow controller. A flow rate indicator should be included in the instrument. 3.6 Air Pump A pump, which draws air through the analyser, is placed at the end of the sample flow path. If the use of UV lamp produces ozone, it is recommended to vent this ozone outside the room and far away from the sampling inlet, or a suitable charcoal filter may trap it. 4.0 SO 2 Calibration Gas Mixtures 4.1 Primary Calibration Method - Several equivalent methods for primary calibration can be used: - static volumetric dilution - permeation tube sources - TCM Tetra-chloromercurate method - gravimetric preparation of gas mixture in combination with various dilution systems Several methods for generating SO 2 calibration gas standard mixtures are proposed below. Whatever method is chosen, it is recommended that it be compared periodically against another independent traceable calibration method. The range of SO2 calibration concentrations selected shall be in between 10% to 90% of the SO 2 concentration range in use. 4.2 Transfer Standard Calibration Method Other methods to prepare calibration standard gases may also is used, if they are compared to one or more of the above mentioned methods. Even though any of the primary calibration methods may be used as transfer standards, in practice, it is easier to use a laboratory calibrated permeation source or cylinder of SO 2. The 3 P a g e
11 latter may be used either directly (with cylinders containing 0.1 mg/m 3 to 10.0 mg/m 3 (0.03 ppm to 5 ppm) of SO 2 in air), or with appropriate quantitative dilution (using cylinders containing ten to several hundred µg/m 3 of SO2 in air). Note: Gas cylinders shall be made of an inert material or have been passivized to ensure stability of +/-3% for the period of use expected. Low concentration cylinder must be checked regularly against primary standards. 4.3 Operational (Field) Span Check To aid in the quality control of the routine operation of the analyser on-site, span checks may be performed regularly (e.g. daily or weekly). For example, an internal permeation device may form an integral part of the apparatus, or an external calibrated cylinder, with appropriate dilution if necessary, may be used. The described span check system is suitable for quality control in routine operation to verify that the analyser is operating correctly, but may not be suitable for proper calibration as described in 5.1. The span check system should regularly be compared to a laboratory-based calibration system as described in Zero Gas Zero air used in the calibration of the analyser should not contain a concentration of SO 2 detectable by the analyser under calibration. The concentration of O 2 in the zero air shall be within +/-2% of the normal composition of air (20.9%). 4.5 Span Gas (Calibration Gas) The span gas must be capable of providing an accurate, stable and reliable concentration of measured gas. 4.6 Multipoint Calibration Multipoint calibration consists of three or more test concentrations including zero concentration. A concentration between 80% and 90% of the full-scale range of the analyzer under calibration, and one or more intermediate concentrations spaced approximately equally over the scale range are required. Multipoint calibrations are used to establish or verify the linearity of analyzer on initial installation and after any major repair. If a non-linear analyzer is being calibrated, additional calibration points should be included to adequately define the calibration relationship, which should be a smooth drive. Multipoint calibrations are likely to be more accurate than two point s calibration because of the averaging effect of the multiple points. 4 P a g e
12 The analyzers have zero and span adjustment controls, which should be adjusted based on the zero and highest test concentration to provide the desired scale range within the analyzer s specifications. Zero and span controls adjustment often affect the zero/span value, so the adjustments may have to be repeated several times to obtain consistent values i.e. zero or span concentrations. 5.0 Physical Zero and Span adjustments All ambient monitoring analyzer have provision for zero and span adjustments. These adjustments are used to obtain the desired nominal scale range, to provide convenient scale units, and to periodically adjust the analyzer response to correct for calibration drift. Zero and span adjustments must always be followed by a calibration. Allow sufficient time between the adjustments and the calibration for the analyzer to stabilize. 1.0 Quality Control There should be a quality control plan, which allows for modification of the frequency and number of points required for calibration. Such a quality control program assures the accuracy and reliability of the air quality data collected. The calibration program must include information of dates of calibration, atmospheric conditions, control setting and other pertinent data. The analyzer should be calibrated or re-calibrated: (a) (b) (c) (d) (e) on its initial installation; following its relocation; after every repair or service; if an interruption in operation of more than a few days; and on detection of malfunction or changing of the analyzer in calibration. In routine operation calibration of analyzer should be checked periodically defining period (once a week) to maintain close agreement between the calibration values used to convert analyzer responses to concentration measurements and the actual response of the analyzer. The frequency of routine periodic calibration is a matter of judgment and is a trade-off among several considerations, including: (i) (ii) (iii) the inherent stability of the analyzer under the prevailing conditions of temperature, pressure, line voltage, etc. at the monitoring site; the quality of the ambient measurement needed; the risk of collecting invalid data because of a malfunction or invalid data or response problem with the analyzer that would not be discovered until the calibration is carried out. When a new monitoring instrument is installed, zero and span calibration should be very frequent, may be daily. After obtaining enough data on the drift 5 P a g e
13 performance of the analyzer, the calibration frequency can be adjusted to provide a suitable compromise among the various considerations mentioned above. To facilitate the process of determining calibration frequency, it is strongly recommended that control charts should be used to monitor the zero and span drift performance of each analyzer. If the drift becomes excessive, then the corrective action has to be taken. 7.0 Precautions a) Operate the analyser in air- conditioned and dust proof room b) Follow standard safety practices for the handling and storage of calibration gas cylinders & the installation and use of the analyser. c) Do not expose calibration cylinders to direct sunlight or excessive heat. d) Maintain the same sample cell flow rate during sampling and calibration. Use the same sample pump. 8.0 Sampling When sampling the outside ambient from an enclosure, utilize a sampling line or probe extending at least 1 metre from the enclosure, and protected against the entry of precipitation. Place the analyser in an enclosure with atmospheric control so the temperature remains constant within + 5 o C. Record the temperature and pressure of the atmosphere sample. 9.0 Operation of the analyzer Install the instrument in a suitable location. Follow the manufacturer's operating instructions to set the various parameters correctly, including UV source lamp intensity, sample flow rate, and (if applicable) the activation of the electronic temperature/pressure compensation. Check to ensure that the manufacturer's performance specifications are met or exceeded. If necessary, the location shall also be temperature controlled to minimise the effect of the temperature dependence of the instrument. Sample air through the instrument and record the SO 2 concentration by means of a suitable recording device (for example, chart recorder, electronic data acquisition system, etc.). During continuous operation of the instrument, checks of the instrument zero, span, and operational parameters shall be made at least one a week. In order to ensure optimum analyser performance, follow the maintenance schedule as detailed in the manufacturer s instruction manual. It is recommended that the analyser be fully either serviced every 6 month or annually as appropriate based on the performance of the analyser. A full calibration of the instrument should be carried out before and after this service. 6 P a g e
14 10.0 Calibration System and Equipment 10.1 Requirements Prior to Calibration or Zero/Span Check a) The analyzer under calibration should be in operation for at least overnight so that it is fully warmed up and stabilized. b) Allow the analyzer to sample test atmosphere with known concentration of pollutants. c) During calibration, the analyzer should be operating in its normal sampling mode and it should sample the test atmosphere through all filters, scrubbers, conditioners, and other components used during normal ambient sampling and through as much of the ambient air inlet system as is practicable. d) Complete all operational adjustments of the analyzer Preparation of Primary Test Gases 10.3 Static Injection System Static calibration mixtures are prepared by introducing a known volume of pure gas into a given volume of dilution gas. The use of static injection system greatly reduces the possibilities of error. The only disadvantage with this system is availability of a small quantity of air for analysis. The availability of air quality depends on the size of the container and the maximum permissible excessive pressure. Generally, glass bottles and flasks are used for static injection system. The exact determination of volume of the container is a basic prerequisite for static injection. The exact volume of glass bottle can be determined by filling the bottle with distilled water and then measure the volume of water by taking out from the bottle. The bottle volume is again determined by increasing the glass bottle pressure by 1.0 bar. The excess pressure allows the water to pass through a calibrated wet gas meter. The volume of gas obtained from glass bottle should be corrected to normal conditions (25 o C at 1013 hpa). A precision measuring manometer with a tolerance of 0.1% or an electronic pressure calibration standard may be used to ascertain the exact pressure of the container. The glass bottle is evacuated and filled with dilution gas (zero gas) and a measured quantity of pure gas (100%) is injected by calibrated syringe (micro syringes) directly into the glass bottle through the septum. The gases (pure and dilution) are mixed inside the glass bottle by an externally controlled stirrer. This gas mixture is now used for calibration of analyzers. 7 P a g e
15 10.5 Calculation The concentration by volume of a pure gas can be calculated from the following equation: Volume of Injection Calibration concentration = Concentration of pure gas Volume of Dilution Gas 10.6 Permeation System A permeation device is a gas source, which permanently emits a constant known quantity of a pure gas. It consists of a small container with a permeable wall, typically consisting entirely of PTFE (Teflon) or of stainless steel with a small PTFE wafer. The gases to be used (SO2, NO2, H2S etc.) to generate standard gas mixture of variable concentration, is kept pure in liquid form. Since the compound is liquid, it will always have a constant vapour pressure, if temperature is constant. Gravimetric method is used for calibrating the permeation tube at different flow rate. The pre-weighted permeation tube (SO 2, NO 2, H 2S etc.) are kept in permeation oven for constant temperature. After an interval of about 10 days, the tubes are taken out and weighed. The permeation rate of tubes is calculated by dividing the weight loss by time period Calculation Permeation Rate (PR) = Difference in Weight (µg) Time Period (Min) Concentration (C) = Permeation Rate (µg / min) Dilution Gas Flow (m 3 / min) C =µg / m Procedure for Calibration with Permeation Tube i) Take a new permeation tube and put it into permeation oven of a calibration unit for stabilisation at least for 48 hours. ii) After the stabilisation take the initial weight (w 1) of permeation tube in a balance, which can measure up to 5 decimal value and record date & time (t 1). Put back the tube again in permeation oven in same condition as earlier. 8 P a g e
16 iii) Take out the permeation tube from oven approximately after 10 days and weight it again (w 2) and note down the date & time (t 2) and put back the tube into permeation oven. iv) Calculations: Permeation Rate (PR) = Difference in Weight (w 1 w 2) gms Difference in Time (t 2 t 1) min SO 2 Concentration = Permeation Rate (PR) (µg / min.) S* x Dilution Flow (m 3 / min) S* = SO 2 Concentration at 25 Degree Centigrade, 1.0 ppb = µg / m Example Let us take the permeation tube of Sulphur dioxide for calibration: Date = , Time = 11 a.m. (t 1) Weight of permeation tube = gms. (w 1) Date = , Time = a.m. (t 2) Weight of permeation tube = gms. (w2) Difference in weights (w 1 - w 2) = gms Time Difference (t 2 - t 1) 10 days, 23 hrs., 30 minutes = minutes Permeation Rate = gms minutes = µg / min. Sulphur Dioxide concentration at different flow rates: 50 liters / hr. = µg / min x10-3 m 3 / min x µg / m 3 = ppb 100 litres / hr. = ppb 150 litres / hr. = ppb 200 litres / hr. = ppb 9 P a g e
17 11.0 Calibration of the Ambient SO 2 Analyser 11.1 Principle - During this procedure, the ambient SO 2 analyser shall be operated at its normal flow rate and temperature. The calibration includes measurements of zero air, span gas and at least five SO 2 concentrations (using a primary calibration gas standard described in section 11.3 & 11.6) which shall be spaced to cover the ambient range. For all calibrations, flow of calibration gases to the manifold shall exceed, by at least 20%, the total flow required by the instrument attached to the manifold, with the excess appropriately vented at atmospheric pressure Calibration Procedure 11.3 Zero Calibration Switch on the analyzer at ZERO mode and zero gas from internal source will be measured by the analyzer. After the reading has stabilized, check the display of the zero value. In case of derivation, adjust the zero value Span Calibration After the ZERO calibration has been done, switch the analyzer at SPAN mode. SO 2 span gas (pre-determined concentration) from permeation tube, kept in permeation oven, would be measured by the analyzer. In case of any deviation in the displayed value and the span gas concentration adjust the reading of analyzer to the span value. Repeat ZERO and SPAN calibration for atleast three times or till stable and true values are indicated. After ZERO and SPAN calibration, switch the analyzer at SAMPLE mode. Now, analyzer will measure SO 2 present in the ambient air Field Calibration Procedure with a Transfer Standard - A two-point calibration of the analyser with a transfer standard calibrated previously against a reference calibration system is acceptable in field conditions OPERATIONAL CHECKS 12.1 Zero and Span Settings If the required zero and span corrections performed in accordance with calibration procedure are greater than 80% of the range, have the analyser serviced Sample Flow Rate If the sample flow rate has changed by more than + 20% of the initial value, check the particulate filter for blockage, and the sample pump for proper operation. Check the filter monthly by measuring the flow rate with and without the filter in place. Replace the filter if the drop is more than 5%. 10 P a g e
18 12.3 Temperature Control Check the temperature of the shelter or room in which the analyser is located. If, it has changed by more than + 5 o C, have the heating-cooling system serviced Record The calibration record of analyzer with details like calibration data, calibration equation, analyzer identification, analyzer location, calibration standards used and their traceability, identity of calibration equipment used shall be maintained by the concerned laboratory staff References 1. ISO Ambient Air - Determination of Sulphur Dioxide - Ultraviolet Fluorescence method. 2. CPCB DOC: CB/CL/SOP/5.6/8, Issue No. 01, Issue date: , Procedure for calibration of ambient air quality monitoring analyzers Schematic Flow Diagram of Sulphur Dioxide Analyser 11 P a g e
19 Guidelines for Automatic Measurement of Particulate Matter (PM 2.5 and PM 10) in ambient air (Beta Attenuation Method) 1.0 Purpose The purpose of this protocol is to provide guidelines for monitoring of particulate matter (PM 2.5 and PM 10) in ambient air. 2.0 Principle The Dust monitor automatically measures and records airborne particulate concentration levels (in milligrams or micrograms per cubic meter) using the principle of beta ray attenuation. Each hour, a small C 14 (Carbon-14 or Krypton 85) element emits a constant source of high-energy electrons (known as beta rays) through a spot of clean filter tape. These beta rays are detected and counted by a sensitive scintillation detector to determine a zero reading. The Monitor automatically advances this spot of tape to the sample nozzle, where a vacuum pump then pulls a measured and controlled amount of dust-laden air through the filter tape, loading it with ambient dust (PM 2.5 or PM 10, depending upon the sampling head). At the end of the hour, this dirty spot is placed back between the beta source and the detector thereby causing an attenuation of the beta ray signal which is used to determine the mass of the particulate matter on the filter tape and the volumetric concentration of particulate matter in ambient air. 3.0 Instrument/Equipment 3.1 Beta Ray Attenuation - for measurement of particulate matter (PM 2.5 and PM10) in air The monitor consists of three basic components: the detector / logger, the pump and a sampling inlet (PM2.5 or PM10). Each of these components is self contained and may be easily disconnected for servicing or replacement. The Beta Ray Attenuation monitor shall meet the performance specifications as prescribed. 4.0 Calibration 4.1 Factory Calibration Method The entire particulate matter monitor is tested to traceable standards and then operated in a chamber with dust laden atmosphere. The results of this testing provide data points that are used in the data regression and final calibration. The built in membrane calibrator is tested to assure conformity during test period. 4.2 Automatic Calibration Method The monitor has a built in Mass Membrane Calibrator. The membrane is automatically moved into the beta Pathway to determine the mass of the 12 P a g e
20 membrane each hour or when the filter tape advances. Each membrane has a factory verified mass and that value is stored in the monitor. When the hourly membrane calibration is made, the computed value is compared to the stored factory value to determine proper operation. 4.3 Zero testing Zero testing of blank filter paper is performed at the beginning and end of each sample period to insure the stability of the measurement system. Zero testing is based on the ability of the monitor to hold a constant output when measuring blank filter paper. If the difference between the two values exceeds a preset limit a data error message is logged in the error log and the digital value is marked. 5.0 Operation of the Particulate Matter Monitor 5.1 Normal Operation Mode Every cycle of the normal operation mode consists of three main parts, automatic calibration, sampling, counting and calculation. Logging of data collected occurs after each calculation. 5.2 Operation Cycle The particulate matter monitor uses a sampling algorithm that optimizes the total time required to complete a cycle. The basic cycle always includes an automatic calibration that is performed during the sampling period, but at a different point on the filter, as the data is being sampled. The process is as follows: i) The initial measurement of clean filter tape (I0) is performed at the beginning of the cycle for a period of four minutes. ii) iii) The filter tape is advanced 50 mm approximately and the sampling (depends upon the sampling head PM 2.5 or PM 10) begins on the spot in which I 0 was just measured. Air is drawn through this spot on the filter tape for 50 minutes. At the same time the second measurement (I 1) occurs (at a point on the tape 50 mm back) for a period of four minutes. The purpose for this measurement is to perform verification for instrument drift caused by varying external parameters such as temperature and relative humidity. A third measurement (I 2) occurs with the reference membrane extended over the same place on the tape. The sample time should be chosen greater than or equal to 5 minutes, so as allow for overlapping Auto calibration time. The purpose of this measurement is to verify that the instrument is operational. 13 P a g e
21 iv) The tape is moved back app. 50 mm to measure the beta ray absorption through the section that has collected dust (I 3). Finally the concentration calculation is performed to complete the cycle. v) A new measurement cycle then begins. 5.3 Sampling During the sampling period incoming dust laden air may be pumped through an optional external PM 10 (or PM 2.5) inlet head to remove particles greater than 10 (or 2.5) µm in diameter. The air then goes through the filter tape, where particles less than or equal to 10 (or 2.5) µm in diameter are deposited. First the filter tape is advanced 50 mm approximately from the counting station to the sampling nozzle. Next the nozzle is lowered to the tape surface and the vacuum pump is turned ON. At the end of the sampling period the pump is tuned OFF, the nozzle is raised and the tape is moved backward the same distance of 50 mm approximately. 5.4 Counting and Calculation The final part of the operation mode is the counting of the beta particles through the dusty section of tape and then the calculation and logging of the dust concentration. The tape is then advanced 12.5 mm approximately to begin the next cycle. 5.5 Logging Data that is computed every sample period is logged in the local memory for the current day. Normal measurement mode starts immediately after the operation mode of the meter is set ON by the operator, cycling indefinitely until the mode is set OFF. 5.6 Software Description Setup Mode The monitor saves various setup parameters needed to perform the desired calculations. These includes date, time, Average reference membrane mass density (ABS), Background concentration (BKGD), Regression factor (K), Absorption coefficient (µ sw), Pressure flow proportionality (C V), Flow offset (Q O) and the sample period t S. Once stored these numbers do not need to be reloaded. ABS, BKGD, K, µsw, CV and QO are constants established at the factory by extensive test and calibration. 5.7 Calculations The software uses the constant and the input variables available with each monitor to calculate the output data. The output data is used for to calculate 14 P a g e
22 daily statistics. The monitor measures the beta ray attenuation at several times during the sampling cycle. 6.0 Record The time to time calibration record of each particulate matter monitor with details like calibration data, calibration equation, monitor identification number, location, calibration foil used and their traceability used shall be maintained by the concerned laboratory staff. 7.0 References 1. Designated as an Automated Equivalent Methods: EQPM for PM 2.5 and EQPM for PM 10 by USEPA Schematic Flow Diagram of Particulate Matter (PM 2.5 or PM 10) Monitor 15 P a g e
23 Guidelines for Automatic Measurement of Carbon Monoxide (CO) in ambient air (Non-Dispersive Infrared Method) 1.0 Purpose The purpose of this protocol is to provide guidelines for monitoring of carbon monoxide (CO) in ambient air. 2.0 Principle Non Dispersive Infra-Red (NDIR) photometry provides a method of utilising the integrated absorption of infra-red energy over most of the spectrum for a given compound to provide a quantitative determination of the concentration of Carbon Monoxide (CO) in ambient air. The spectrometer measures the absorption by CO at 4.7 µm using two parallel infrared beams through a sample cell, a reference cell and a selective detector. The detector signal is led to an amplifier control section and the analyser output measured on a meter and recording system. Some instruments use gas filter correlation to compare the IR absorption spectrum between the measured gas and other gases present in the sample, in a single sample cell. These instruments utilize a highly concentrated sample of CO as a filter for the IR transmitted through the sample cell, to yield a beam that cannot be further attenuated by the CO in the sample and thus acts as a reference beam. The board-band radiation that passes through the sample cell and the CO filter is filtered again by a narrow-band-pass filter that allows only the CO-sensitive portion of the band to pass to the detector. The removal of wavelength sensitive to other gases reduces interferences. 3.0 Instrument/Equipment 3.1 NDIR Analyser - for measurement of carbon monoxide in air The analyser should be complete with analyser section, sample pump, amplifier/control section, meter, and recording system. The NDIR analyser shall meet the performance specifications as prescribed. 3.2 Calibration Standards and Equipment The calibration of ambient air quality measuring carbon monoxide analyzer require a stable, homogeneous gas mixture having the concentration suitable for measuring range of the analyzer to be calibrated. All such test concentrations must be derived from local or working standards that are certified and traceable to primary standards. 16 P a g e
24 3.2.1 Zero Gas Zero gas is defined as gas, which does not contain the parameters to be monitored (any impurity). The concentration of zero gas must be zero in respect of pollutant being calibrated Span Gas (Calibration Gas) The span gas must be capable of providing an accurate, stable and reliable concentration of measured gas Multipoint Calibration Multipoint calibration consists of three or more test concentrations including zero concentration. A concentration between 80% and 90% of the full-scale range of the analyzer under calibration, and one or more intermediate concentrations spaced approximately equally over the scale range are required. Multipoint calibrations are used to establish or verify the linearity of analyzer on initial installation and after any major repair. If a non-linear analyzer is being calibrated, additional calibration points should be included to adequately define the calibration relationship, which should be a smooth drive. Multipoint calibrations are likely to be more accurate than two point s calibration because of the averaging effect of the multiple points. The analyzers have zero and span adjustment controls, which should be adjusted based on the zero and highest test concentration to provide the desired scale range within the analyzer s specifications. Zero and span controls adjustment often affect the zero/span value, so the adjustments may have to be repeated several times to obtain consistent values i.e. zero or span concentrations Pressure Regulators for the CO Cylinders A two-stage regulator with inlet and delivery pressure gauges will be required for the CO calibration standard cylinder. Procure regulators for each cylinder if individual cylinders are to be used for individual calibration points. Ensure the cylinders have a non-reactive diaphragm and suitable delivery pressure. Consult the supplier from whom the CO cylinders are to be obtained for the correct cylinder fitting size required for the regulator Flow Controller The flow controller can be any device (valve) capable of adjusting and regulating the flow from the calibration standard. If the dilution method is to be used for calibration, a second device is required for the zero-air. For dilution, the controllers shall be capable of regulating the flow + 1%. 17 P a g e
25 3.2.6 Flow Meter A calibrated flow meter capable of measuring and monitoring the calibration standard flow rate. If, the dilution method is used, a second flow meter is required for the zero-air flow. For dilution, the flow meters shall be capable of measuring the flow with an accuracy of + 2% Output Manifold The output manifold should be of sufficient diameter to ensure an insignificant pressure drop at the analyser connection. The system shall have a vent designated to ensure atmospheric pressure at the manifold and to prevent ambient air from entering the manifold. 4.0 Physical Zero and Span adjustments All ambient monitoring analyzer have provision for zero and span adjustments. These adjustments are used to obtain the desired nominal scale range, to provide convenient scale units, and to periodically adjust the analyzer response to correct for calibration drift. Zero and span adjustments must always be followed by a calibration. Allow sufficient time between the adjustments and the calibration for the analyzer to stabilize. 5.0 Quality Control There should be a quality control plan, which allows for modification of the frequency and number of points required for calibration. Such a quality control programme assures the accuracy and reliability of the air quality data collected. The calibration programme must include information of dates of calibration, atmospheric conditions, control setting and other pertinent data. The analyzer should be calibrated or re-calibrated: (a) (b) (c) (d) (e) on its initial installation; following its relocation; after every repair or service; if an interruption in operation of more than a few days; and on detection of malfunction or changing of the analyzer in calibration. In routine operation calibration of analyzer should be checked periodically defining period (once a week) to maintain close agreement between the calibration values used to convert analyzer responses to concentration measurements and the actual response of the analyzer. The frequency of routine periodic calibration is a matter of judgment and is a trade-off among several considerations, including: 18 P a g e
26 (i) (ii) (iii) the inherent stability of the analyzer under the prevailing conditions of temperature, pressure, line voltage, etc. at the monitoring site; the quality of the ambient measurement needed; the risk of collecting invalid data because of a malfunction or invalid data or response problem with the analyzer that would not be discovered until the calibration is carried out. When a new monitoring instrument is installed, zero and span calibration should be very frequent, may be daily. After obtaining enough data on the drift performance of the analyzer, the calibration frequency can be adjusted to provide a suitable compromise among the various considerations mentioned above. To facilitate the process of determining calibration frequency, it is strongly recommended that control charts should be used to monitor the zero and span drift performance of each analyzer. If the drift becomes excessive, then the corrective action has to be taken. 6.0 Precautions a) Operate the analyser in air- conditioned and dust proof room b) Follow standard safety practices for the handling and storage of calibration gas cylinders & the installation and use of the analyser. c) Do not expose calibration cylinders to direct sunlight or excessive heat. d) Maintain the same sample cell flow rate during sampling and calibration. Use the same sample pump. 7.0 Sampling When sampling the outside ambient from an enclosure, utilize a sampling line or probe extending at least 1 metre from the enclosure, and protected against the entry of precipitation. Place the analyser in an enclosure with atmospheric control so the temperature remains constant within + 5 o C. Record the temperature and pressure of the atmosphere sample. 8.0 Operation of the analyser (i) (ii) (iii) (iv) (v) Press ON/OFF switch of the analyzer to ON; Check that the sampling tube is connected with sampling glass manifold and the suction pump is in operation; Let the analyzer warm up and stabilize for atleast 30 minutes or as specified in the manual; Do not change the programme or configuration of the analyzer as they are preset; and After the warm up period, put the analyzer on SAMPLE mode by pressing the sample key. 19 P a g e
27 9.0 Procedure of Calibration 9.1 Calibration of Working Standard (i) (ii) (iii) (iv) (v) The working standard should be calibrated with Certified Reference Material (CRM); Established the concentration of the working standard relative to the primary standard; Primary standard should be traceable to NIST / BIS primary standard; and Confirm the stability of the working standard over a minimum period of one week. Flow or volume measuring instruments like, bubble flow meter or gas meter shall be calibrated and certified at regular intervals against NPL, New Delhi / FCRI, Palghat standards. 9.2 Requirements Prior to Calibration or Zero/Span Check a) The analyzer under calibration should be in operation for at least overnight so that it is fully warmed up and stabilized. b) Allow the analyzer to sample test atmosphere with known concentration of pollutants. c) During calibration, the analyzer should be operating in its normal sampling mode and it should sample the test atmosphere through all filters, scrubbers, conditioners, and other components used during normal ambient sampling and through as much of the ambient air inlet system as is practicable. d) Complete all operational adjustments of the analyzer. 9.3 Zero and Span Calibration Procedures (i) Zero Calibration Switch the analyzer at ZERO mode and zero gas (N 2) from external source is measured by the analyzer. After the reading has stabilized, check the display of zero value. In case of derivation, adjust the ZERO value. (ii) Span Calibration After the ZERO calibration has been done, connect the span gas cylinder, of known concentration of CO. Switch on the analyzer of SPAN mode. Open the regulator valve of the cylinder and the analyzer will start measuring the span gas concentration. In case of any variation in the measured value and SPAN gas concentration, adjust the reading of the analyzer to the SPAN gas concentration value. Repeat ZERO and SPAN calibration for atleast three times till stable and 20 P a g e
28 true value are indicated. After ZERO and SPAN calibration, switch the analyzer at SAMPLE mode. Now, analyzer will measure the carbon monoxide present in the ambient air Calculation To convert ppm volume fraction to milligrams per cubic metre, use the following equation: Where: ρ2 x mr x 298ρ ρ1 = x T x ρ1 = is the CO mass concentration, in milligrams per cubic metre ρ 2 = is the CO mass concentration, ppm volume fraction m r = is the molar mass of carbon monoxide, (28 g/mol) 298 = is the standard absolute temperature, in Kelvin ρ = is the measured gas pressure, in kilopascals = is the molecular volume of 1 mole, in millilitres T = is the measured absolute gas temperature, in Kelvin = is the standard gas pressure, in kilopascals 11.0 OPERATIONAL CHECKS 11.1 Zero and Span Settings If the required zero and span corrections performed in accordance with calibration procedure are greater than 80% of the range, have the analyser serviced Sample Flow Rate If the sample flow rate has changed by more than + 20% of the initial value, check the particulate filter for blockage, and the sample pump for proper operation. Check the filter monthly by measuring the flow rate with and without the filter in place. Replace the filter if the drop is more than 5% Temperature Control Check the temperature of the shelter or room in which the analyser is located. If, it has changed by more than + 5 o C, have the heating-cooling system serviced. 21 P a g e
29 12.0 Record The calibration record of each analyzer with details like calibration data, calibration equation, analyzer identification, analyzer location, calibration standards used and their traceability, identity of calibration equipment used shall be maintained by the concerned laboratory staff References 1. ISO Method No. 4224, CPCB DOC: CB/CL/SOP/5.6/8, Issue No. 01, Issue date: , Procedure for calibration of ambient air quality monitoring analyzers Schematic Flow Diagram of Carbon Monoxide Analyser 22 P a g e
30 Guidelines for Automatic Measurement of Oxides of Nitrogen (NO NO 2 - NOx) and Ammonia (NH3) in ambient air (Chemiluminescence Method) 1.0 Purpose The purpose of this protocol is to provide guidelines for monitoring of oxides of nitrogen (NO NO 2 NO x) and Ammonia (NH 3) in ambient air. 2.0 Principle The measurement method is based upon the chemiluminescent reaction between Nitric oxide (NO) with Ozone (O3) in a reaction chamber. NO + O 3 = NO 2* + O 2 A portion of the resultant Nitrogen dioxide (NO2) is produced in a highly excited energy state (NO 2*) and subsequently decay to the ground level state emitting light in broad frequency band with a peak of 1200 nm. NO 2* = NO 2 + Photons (hv) The intensity of the light emitted is linearly proportion to the NO concentration and is measured by a photo-multiplier tube. The instrument is designed for the measurement of total Oxides of Nitrogen (NOx), Nitric Oxide (NO) and indirect determination of Nitrogen Dioxide (NO 2) and Ammonia (NH 3). The NO 2 and NH 3 calculated by subtraction of NO from NOx and NOx from NOy. NOx = NO + NO 2 NO 2 = NOx NO (1) NOY = NO + NO2 + NH3 NH3 = NOY NOx (2) 3.0 Instrument/Equipment 3.1 Chemiluminescence Analyser - for measurement of oxides of nitrogen and ammonia in air The Chemiluminescence analyzer is a combination of NH 3 converter and an NO-NO 2-NOx analyzer. Ammonia in the air sample is oxidized to nitric oxide (NO) with a converter. Sample air is drawn at a flow rate of 0.6 L/min from the converter into the NH 3 analyzer through a particulate filter, a glass capillary, and a solenoid valve. The solenoid valve routes the sample either directly into the reaction chamber (NO mode), through the molybdenum converter and the reaction chamber (NOx mode), or through the ammonia converter and the reaction chamber (Nt mode). 23 P a g e
31 3.2 Converters - For the accurate determination of nitrogen dioxide it is essential that the instrument converters have a high degree of efficiency (95 %+) for the conversion of NO2 to NO. The converters employed in commercially available instruments are of two basic types. Thermal Converters are made of a high grade stainless steel and operate at elevated temperatures, o C. At these temperatures the breakdown of NO 2 into NO and O 2 occurs readily. These converters, though adequate for the breakdown of NO 2 to NO, have the obvious disadvantage of converting ammonia into NO. Chemical converters are to be found in the majority of Chemiluminescence instruments used for ambient monitoring. These converters have the advantage of a much lower operating temperature, o C, with efficient NO2 conversion. Molybdenum and carbon converters have been in general use and are available in commercial instruments. NH 3 NO Converter consists of a ceramic cylinder bearing a heating resistor. This cylinder is surrounded by glass wool. It contains the quartz tube filled with quartz wool in order to improve the efficiency of NH 3 to NO conversion. The temperature range of these tubes is in between o C. 3.3 Air Inlet Filter - A Teflon filter capable of removing all particulate matter greater than 5 µm in diameter. 3.4 Sample Lines The sample lines and all parts of the instrument that come in contact with the sample stream should be made of glass, Teflon or stainless steel. 3.5 Vacuum Pump - A pump capable of a minimum vacuum of 78 kpa. 4.0 Calibration Standards The nitric oxide (NO) in N 2 and NH 3 in air is used to calibrate the Analyser. These standard gases should be traceable to a National or International Standard. Selection of the NO and NH3 standards concentration are dependent on the operating range of the analyzer to be calibrated and on the dilution capability of the calibration system. NO cylinders normally used are in the % ppm v/v range in N 2. The NO calibration cylinder must be free of any nitrogen dioxide, and should be re analysed on a regular basis, preferably every six months. 4.1 Zero Gas The air supply must be free of contaminants that would cause a detectable analyzer response, or react independently with NO. 24 P a g e
32 4.2 Span Gas (Calibration Gas) The span gas must be capable of providing an accurate, stable and reliable concentration of measured gas. 4.3 Multipoint Calibration Multipoint calibration consists of three or more test concentrations including zero concentration. A concentration between 80% and 90% of the full-scale range of the analyzer under calibration, and one or more intermediate concentrations spaced approximately equally over the scale range are required. Multipoint calibrations are used to establish or verify the linearity of analyzer on initial installation and after any major repair. If a non-linear analyzer is being calibrated, additional calibration points should be included to adequately define the calibration relationship, which should be a smooth drive. Multipoint calibrations are likely to be more accurate than two point s calibration because of the averaging effect of the multiple points. The analyzers have zero and span adjustment controls, which should be adjusted based on the zero and highest test concentration to provide the desired scale range within the analyzer s specifications. Zero and span controls adjustment often affect the zero/span value, so the adjustments may have to be repeated several times to obtain consistent values i.e. zero or span concentrations. 5.0 Physical Zero and Span adjustments All ambient monitoring analyzer have provision for zero and span adjustments. These adjustments are used to obtain the desired nominal scale range, to provide convenient scale units, and to periodically adjust the analyzer response to correct for calibration drift. Zero and span adjustments must always be followed by a calibration. Allow sufficient time between the adjustments and the calibration for the analyzer to stabilize. 6.0 Quality Control There should be a quality control plan, which allows for modification of the frequency and number of points required for calibration. Such a quality control programme assures the accuracy and reliability of the air quality data collected. The calibration programme must include information of dates of calibration, atmospheric conditions, control setting and other pertinent data. The analyzer should be calibrated or re-calibrated: a. on its initial installation; b. following its relocation; c. after every repair or service; 25 P a g e
33 d. if an interruption in operation of more than a few days; and e. on detection of malfunction or changing of the analyzer in calibration. In routine operation calibration of analyzer should be checked periodically defining period (once a week) to maintain close agreement between the calibration values used to convert analyzer responses to concentration measurements and the actual response of the analyzer. The frequency of routine periodic calibration is a matter of judgment and is a trade-off among several considerations, including: the inherent stability of the analyzer under the prevailing conditions of temperature, pressure, line voltage, etc. at the monitoring site; the quality of the ambient measurement needed; the risk of collecting invalid data because of a malfunction or invalid data or response problem with the analyzer that would not be discovered until the calibration is carried out. When a new monitoring instrument is installed, zero and span calibration should be very frequent, may be daily. After obtaining enough data on the drift performance of the analyzer, the calibration frequency can be adjusted to provide a suitable compromise among the various considerations mentioned above. To facilitate the process of determining calibration frequency, it is strongly recommended that control charts should be used to monitor the zero and span drift performance of each analyzer. If the drift becomes excessive, then the corrective action has to be taken. Precautions (a) (b) (c) (d) Operate the analyser in air- conditioned and dust proof room Follow standard safety practices for the handling and storage of calibration gas cylinders & the installation and use of the analyser. Do not expose calibration cylinders to direct sunlight or excessive heat. Maintain the same sample cell flow rate during sampling and calibration. Use the same sample pump. 7.0 Sampling When sampling the outside ambient from an enclosure, utilize a sampling line or probe extending at least 1 metre from the enclosure, and protected against the entry of precipitation. Place the analyser in an enclosure with atmospheric control so the temperature remains constant within + 5o C. Record the temperature and pressure of the atmosphere sample. 8.0 Operation of the analyser Press ON/OFF switch of the analyzer to ON; 26 P a g e
34 Check that the sampling tube is connected with sampling glass manifold and the suction pump is in operation; Let the analyzer warm up and stabilize for atleast 30 minutes or as specified in the manual; Do not change the programme or configuration of the analyzer as they are preset; and After the warm up period, put the analyzer on SAMPLE mode by pressing the sample key. 9.1 Requirements Prior to Calibration or Zero/Span Check The analyzer under calibration should be in operation for at least overnight so that it is fully warmed up and stabilized. Allow the analyzer to sample test atmosphere with known concentration of pollutants. During calibration, the analyzer should be operating in its normal sampling mode and it should sample the test atmosphere through all filters, scrubbers, conditioners, and other components used during normal ambient sampling and through as much of the ambient air inlet system as is practicable. Complete all operational adjustments of the analyzer Calibration System and Equipment In the procedure that follows, NH3, NO and NO2 calibrations are performed using a dynamic dilution system. Ammonia and Nitric oxide calibrations are performed by dynamic flow dilution of a NH 3 & NO standard with a clean air stream. Nitrogen dioxide calibrations are performed by the rapid gas phase reaction between NO and O3 to provide a stoichiometric quantity of NO2, equal to the decrease in the NO concentration. The reaction is the same as shown as Section 3.0, except that the NO remains in excess rather than the ozone as described in 3.0. This reaction is commonly referred to as Gas Phase Titration (GPT). An alternative NO 2 calibration is the generation of known test atmospheres by means of a NO 2 permeation device Calibration System- All components in the calibration system should be made of glass, Teflon or stainless steel. The system is designed to provide dynamic dilution for NO, NH 3 and GPT for NO 2. The dilution section comprises two independent flow controls that can be varied individually to provide a dilution ration of up to 1,000 to 1. The GPT section comprises a current-regulated ozone generator through which a portion of the dilution air flows even when the ozonator is not in operation. For dynamic dilution, the metered NO combines with this portion of the dilution air and passes through the reaction chamber. It then combines with the balance of the dilution air and passes through the sampling manifold. For GPT the flow path is the same except that a portion of the oxygen in the air passing through the ozone generator is converted to ozone. 27 P a g e
35 10.2 Air Flow Controller - A device capable of maintaining constant clean-air flow up to 5 L/min within + 2% of the required flow rate Air Flowmeter - A calibrated flowmeter capable of measuring air flow rates within + 2% Nitric Oxide Flow Controller - A device capable of maintaining constant NO flow within + 2% of the required flow rate Nitric Oxide Flowmeter - A calibrated flowmeter capable of measuring NO flow rates within + 2% Two-Stage Regulator - The two-stage pressure regulator for the standard NO and NH3 cylinders must be of stainless steel to prevent any reaction of the external gas Ozone Generator - The generator must be capable of generating stable levels of O 3 for the GPT of NO to provide NO 2 concentrations throughout the calibration range Reaction Chamber - The chamber used for the reaction of O3 with excess NO should be of sufficient volume that the residence time is not less than 2 minutes (11) Mixing Chamber - A chamber used to allow thorough mixing of reaction products and dilution air Procedure of Calibration Prior to start of calibration, for safety purposes, insure proper venting of the analyzer exhaust and the calibration system have excess flow. Insure that the analyzer and the calibration system have been on for a time sufficient to provide stable operation Flow Conditions - Insure that the air and gas flow systems are calibrated under the conditions of use against an authoritative standard. Different output calibration gas concentrations are obtained simply by changing the ratios of flow rates between the NO & NH 3 and dilution air channels. It is preferable to maintain a constant dilution air-flow and to vary the NO and NH3 flow. The total flow required at the sampling manifold should equal the analyzer demand plus at least 50% excess. The following equations can be used to pre-calculate the specific gas dilution air-flow rates required for the desired calibration points, usually 20, 40, 60 and 80% of the instrument range. 28 P a g e
36 Where : STD FS S = (1) FS + FD S = desired output concentrations of NO in ppm STD = NO standard cylinder concentration in ppm FS = NO standard cylinder flow rate FD = dilution air flow rate in cm 3 /min. Solving equation (1) for the NO or NH3 standard flow rate (FS) that will produce the desired concentration for a given dilution flow rate (FD) gives: S FD FS = (2) STD - S 11.2 Zero Calibration - Activate the zero air source and allow the analyzer to sample the zero air until a stable zero response is obtained. Adjust the analyzer NH 3, NOx, NO and NO 2 zero controls as described in the instrument manual. It is good practice to recheck the zero at the end of the multipoint calibration, especially if large span adjustments were made Preparation for the NO and NOx Calibration - Set the zero air and NO standard flow rates as determined in 12.1 for generating a NO concentration at 80% of the instrument range setting. Sample this NO concentration for a minimum of 15 minutes or until the NO and NOx responses are stable NO and NOx Span Adjustment - Adjust as necessary the analyzer NO and NOx span controls to obtain recorder responses equal to the NO (NOx in this case as well) concentration generated Preparation for the NO2 Calibration - Set the dilution air and NO standard flow rates as determined in 12.1 for generating a NO concentration of about 80% of the instrument range setting. Sample this NO concentration for a minimum of 15 minutes or until the NO, NOx and NO 2 recorder responses are stable. Record the readings. Note: The NO 2 calibration is conveniently performed by re-establishing the 80% of scale NO-NOx calibration point, using the same dilution air and NO standard flow rates used in Gas Phase Titration - Activate the ozone generator and adjust the ozone output so as to decrease the NO concentration by approximately 80%. The decrease must not exceed 90% of the NO concentration being sampled prior to the GPT. Sample this NO-NO 2 mixture for a minimum of 15 minutes or until the 29 P a g e
37 NO, NOx and NO 2 recorder responses are stable. Record the readings. Calculate the indicated NO 2 concentration as per Section Nitrogen Dioxide Span Adjustment - Adjust as necessary the analyzer NO 2 span control to obtain a recorder response equal to the calculated NO 2 concentration. Generate at least two additional calibration points evenly spaced across the remainder of the instrument operating scale by decreasing the O 3 output while maintaining the dilute air and NO standard flow rates constant. For each calibration point generated, calculate the NO 2 concentration, and insure that the NO 2 recorder responses are correct Determination of Converter Efficiency of NO2 - Calculate the analyzer converter efficiency as per Section 13.2 for the NO 2 concentration generated in Section The converter efficiency must be 95% or greater to be acceptable 11.8 Preparation for the NH 3 Calibration - Set the zero air and NH 3 standard flow rates as determined in 12.1 for generating a NH 3 concentration at 80% of the instrument range setting. Sample this NH 3 concentration for a minimum of 15 minutes or until the NH3 response is stable. Adjust as necessary the analyzer NH3 span control to obtain recorder responses equal to the NH 3 concentration generated Determination of Converter Efficiency of NH3 It is necessary to check the efficiency of the NH 3 converter every 6 months at least. In this case it is necessary to inject NH 3 gas and to check the read value with the known (span) concentration Calculations 12.1 Calculation of NO 2 concentration NOx = NO + NO 2 NO2 = NOx NO (1) NO Y = NO + NO 2 + NH 3 NH 3 = NO Y NO x (2) 12.2 Calculation of NO 2 Converter Efficiency (CE) [NO x] Converter Efficiency = [NO x] GPT 30 P a g e
38 12.3 Calculation of NH 3 Converter Efficiency (CE) [NH 3] measured Converter Efficiency = [NH 3] target 13.0 Calibration with Permeation System A permeation device is a gas source, which permanently emits a constant known quantity of a pure gas. It consists of a small container with a permeable wall, typically consisting entirely of PTFE (Teflon) or of stainless steel with a small PTFE wafer. The gases to be used (SO 2, NO 2, NH 3, H 2S etc.) to generate standard gas mixture of variable concentration, is kept pure in liquid form. Since the compound is liquid, it will always have a constant vapour pressure, if temperature is constant. Gravimetric method is used for calibrating the permeation tube at different flow rate. The pre-weighted permeation tube (SO2, NO2, H2S etc.) are kept in permeation oven for constant temperature. After an interval of about 10 days, the tubes are taken out and weighed. The permeation rate of tubes is calculated by dividing the weight loss by time period Calculation Permeation Rate (PR) = Concentration (C) = Difference in Weight (µg) Time Period (Min) Permeation Rate (µg / min) Dilution Gas Flow (m 3 / min) C = µg / m Procedure for Calibration with Permeation Tube Take a new permeation tube and put it into permeation oven of a calibration unit for stabilisation at least for 48 hours. After the stabilisation take the initial weight (w1) of permeation tube in a balance, which can measure up to 5 decimal value and record date & time (t1). Put back the tube again in permeation oven in same condition as earlier. Take out the permeation tube from oven approximately after 10 days and weight it again (w2) and note down the date & time (t2) and put back the tube into permeation oven. 31 P a g e
39 Calculations: Permeation Rate (PR) = Difference in Weight (w1 w2) g Difference in Time (t2 t1) min NO 2 Concentration = Permeation Rate (PR) (µg / min.) N* x Dilution Flow (m3 / min) N* = NO2 Concentration at 25 ºC, 1.0 ppb = 1.88 µg / m 3 or NH 3 Concentration at 25 ºC, 1.0 ppb = µg / m Example Let us take the permeation tube of Nitrogen Dioxide for calibration: Date = , Time = 11 a.m. (t 1) Weight of permeation tube = gms. (w 1) Date = , Time = a.m. (t 2) Weight of permeation tube = gms. (w2) Difference in weights (w 1 - w 2) = g Time Difference (t2 - t1) 10 days, 23 hrs. 30 minutes = minutes Permeation Rate = g minutes = µg / min. Nitrogen Dioxide concentration at different flow rates: 50 liters / hr. = µg / min x10-3 m3 / min x 1.88 µg / m 3 = 127 ppb 100 litres / hr. = 63.5 ppb 150 litres / hr. = 42.3 ppb 200 litres / hr. = 31.6 ppb 32 P a g e
40 Ammonia concentration at different flow rates: 50 liters / hr. = µg / min x10-3 m3 / min x µg / m3 = 315 ppb 100 litres / hr. = ppb 150 litres / hr. = 105 ppb 200 litres / hr. = 78 ppb 14.0 OPERATIONAL CHECKS 14.1 Zero and Span Settings If the required zero and span corrections performed in accordance with calibration procedure are greater than 80% of the range, have the analyser serviced Sample Flow Rate If the sample flow rate has changed by more than + 20% of the initial value, check the particulate filter for blockage, and the sample pump for proper operation. Check the filter monthly by measuring the flow rate with and without the filter in place. Replace the filter if the drop is more than 5% Temperature Control Check the temperature of the shelter or room in which the analyser is located. If, it has changed by more than + 5o C, have the heating-cooling system serviced Record The calibration record of each analyzer with details like calibration data, calibration equation, analyzer identification, analyzer location, calibration standards used and their traceability, identity of calibration equipment used shall be maintained by the concerned laboratory staff References 1. ISC Method No. 416, 3 rd Edition, USEPA Environmental Technology Verification (ETV) Programme 3. CPCB DOC: CB/CL/SOP/5.6/8, Issue No. 01, Issue date: , Procedure for calibration of ambient air quality monitoring analyzers 33 P a g e
41 Flow Diagram of Oxides of Nitrogen and Ammonia Analyser 34 P a g e
42 Guidelines for Automatic Measurement of Ozone (O 3) in ambient air (UV Photometric Method) 1.0 Purpose The purpose of this protocol is to provide guidelines for monitoring of ozone (O3) in ambient air. 2.0 Principle The method is based on the photometric assay of ozone (O 3) concentrations in a dynamic flow system. The concentration of O 3 is determined in an absorption cell from the measurement of the amount of light absorbed at a wavelength of 254 nm. The method is based on the absorption coefficient of O 3 at 254 nm, the optical path length through the sample, and the transmittance, temperature and pressure of the sample. The quantities above are related by the Beer-Lambert absorption law. Ι Transmittance = = e -α cl Ιo Where: α = absorption coefficient of O 3 at 254 nm = 310 atm -1 c m -1 at 0 o C and kpa e = O3 concentration in units of atmosphere l = optical path of absorption cell length in cm I = intensity of light passing through cell with an ozone sample Io = intensity of light passing through cell with zero air Typically, an air sample is first directed through a scrubber that removes any O 3 present, but otherwise does not affect the sample. The ozone-free sample then flows through the absorption cell, and its transmittance is measured. This constitutes the zero cycle. At a present time, solenoid switches and another air sample flows directly into the absorption cell, bypassing the scrubber and its transmittance is measured. This constitutes the ozone measurement cycle. The difference in transmittance between the two cycles is a measure of the O3 concentration. The complete measurement cycle takes about 20 to 30 seconds. Microprocessor-controlled electronics perform timing functions, condition the signal and perform arithmetic operations in commercially available analyzers. 3.0 Instrument/Equipment 3.1 Ozone Photometric Analyzer Commercially available, complete with sample pump and sample flow meter. All connections to the ozone and analyzer must be constructed of glass, Teflon or other inert materials. 35 P a g e
43 3.2 Air Inlet Filter A Teflon filter capable of removing all particulate matter greater than 5 µm in diameter. 3.3 Recorder Capable of full-scale display of voltages from the instrument DC amplifier. These are commonly found in full-scale ranges of 10 mv to 1V. 3.4 Calibration Apparatus Ultraviolet Photometer (UV Photometer) commercially available. The UV photometers are primary standards for determinations of ozone in air. The units differ from the ozone photometric analyzer is that the UV photometers do not contain an ozone scrubber, and are designed to make pressure and temperature corrections for the measured ozone to standard conditions (25 o C and kpa). 4.0 Quality Control There should be a quality control plan, which allows for modification of the frequency and number of points required for calibration. Such a quality control programme assures the accuracy and reliability of the air quality data collected. The calibration programme must include information of dates of calibration, atmospheric conditions, control setting and other pertinent data. The analyzer should be calibrated or re-calibrated: (a) (b) (c) (d) (e) on its initial installation; following its relocation; after every repair or service; if an interruption in operation of more than a few days; and on detection of malfunction or changing of the analyzer in calibration. In routine operation calibration of analyzer should be checked periodically defining period (once a week) to maintain close agreement between the calibration values used to convert analyzer responses to concentration measurements and the actual response of the analyzer. The frequency of routine periodic calibration is a matter of judgment and is a trade-off among several considerations, including: a) the inherent stability of the analyzer under the prevailing conditions of temperature, pressure, line voltage, etc. at the monitoring site; b) the quality of the ambient measurement needed; 36 P a g e
44 c) the risk of collecting invalid data because of a malfunction or invalid data or response problem with the analyzer that would not be discovered until the calibration is carried out. When a new monitoring instrument is installed, zero and span calibration should be very frequent, may be daily. After obtaining enough data on the drift performance of the analyzer, the calibration frequency can be adjusted to provide a suitable compromise among the various considerations mentioned above. To facilitate the process of determining calibration frequency, it is strongly recommended that control charts should be used to monitor the zero and span drift performance of each analyzer. If the drift becomes excessive, then the corrective action has to be taken. 5.0 Precautions a) Operate the analyser in air- conditioned and dust proof room b) Follow standard safety practices for the handling and storage of calibration gas cylinders & the installation and use of the analyser. c) Do not expose calibration cylinders to direct sunlight or excessive heat. d) Maintain the same sample cell flow rate during sampling and calibration. Use the same sample pump. 6.0 Sampling When sampling the outside ambient from an enclosure, utilize a sampling line or probe extending at least 1 metre from the enclosure, and protected against the entry of precipitation. Place the analyser in an enclosure with atmospheric control so the temperature remains constant within + 5 o C. Record the temperature and pressure of the atmosphere sample. 7.0 Operation of the analyser (a) (b) (c) (d) (e) Press ON/OFF switch of the analyzer to ON; Check that the sampling tube is connected with sampling glass manifold and the suction pump is in operation; Let the analyzer warm up and stabilize for atleast 30 minutes or as specified in the manual; Do not change the programme or configuration of the analyzer as they are preset; and After the warm up period, put the analyzer on SAMPLE mode by pressing the sample key. 8.0 Requirements Prior to Calibration or Zero/Span Check a) The analyzer under calibration should be in operation for at least overnight so that it is fully warmed up and stabilized. 37 P a g e
45 b) Allow the analyzer to sample test atmosphere with known concentration of pollutants. c) During calibration, the analyzer should be operating in its normal sampling mode and it should sample the test atmosphere through all filters, scrubbers, conditioners, and other components used during normal ambient sampling and through as much of the ambient air inlet system as is practicable. d) Complete all operational adjustments of the analyzer. 9.0 Zero and Span Calibration Procedures (i) Zero Calibration Switch the analyzer at ZERO mode and zero gas from internal source will be measured by the analyzer. After the reading has stabilized, check the display of the zero value. In case of any deviation, adjust the ZERO value. (ii) Span Calibration (internal) After the ZERO calibration has been done, switch the analyzer at SPAN mode. The analyzer has internal UV span source for providing O 3 of known concentration. The span value is pre-determined. The analyzer would measure the span value. In case of any deviation in the displayed value and the actual span concentration, adjust the voltage of the UV source corresponding to the span value. Repeat ZERO and SPAN calibration for atleast three times or till stable and true values are indicated. After ZERO and SPAN calibration, switch the analyzer at SAMPLE mode. Now, analyzer will measure the O3 gas present in the ambient air. (iii) Span Calibration (External) Connect the ozone analyzer to the output manifold of the calibration system. Check to insure proper operating parameters according to the instrument manual. The ozone source consists of a quartz tube into which purified air is introduced and then irradiated with a stable low-pressure mercury lamp. The level of irradiation is controlled by an adjustable metal sleeve that fits around the lamp. At a fixed level of irradiation and at a constant temperature and humidity, ozone is produced at a uniform rate. By careful control of the flow of air through the quartz tube, and/or adjustment of the irradiation level, test atmospheres can be generated that contain stable but variable concentrations of ozone. An output manifold with a vent is attached to the Ozonator. Ozone outputs must be available to cover the complete analyzer operating range, typically 0.00 to 1.00 ppm. The dilution system should have a total flow capability of a least 5 L/min. Any alternative system capable of these outputs is acceptable. 38 P a g e
46 1.0 Calculation If a UV photometer was used in the calibration, the ozone readings are the true ozone concentrations already corrected to standard conditions (25 o C and kpa). True Ozone (ppm) = Ozone Reading - Zero Reading Where: Ozone Reading Zero Reading = The UV photometer ozone readout for each calibration point test atmosphere = The UV photometer ozone readout for the zero air stream 11.0 OPERATIONAL CHECKS 11.1 Zero and Span Settings If the required zero and span corrections performed in accordance with calibration procedure are greater than 80% of the range, have the analyser serviced Sample Flow Rate If the sample flow rate has changed by more than + 20% of the initial value, check the particulate filter for blockage, and the sample pump for proper operation. Check the filter monthly by measuring the flow rate with and without the filter in place. Replace the filter if the drop is more than 5% Temperature Control Check the temperature of the shelter or room in which the analyser is located. If, it has changed by more than + 5 o C, have the heating-cooling system serviced Record The calibration record of each analyzer with details like calibration data, calibration equation, analyzer identification, analyzer location, calibration standards used and their traceability, identity of calibration equipment used shall be maintained by the concerned laboratory staff References 1. ISC, Method No. 417, 3 rd Edition, P a g e
47 Schematic Flow Diagram of Dual Cell Ozone Analyser 40 P a g e
48 Guidelines for Automatic Measurement of benzene (BTX) in ambient air (Gas Chromatography based Continuous Method) 1.0 Purpose The purpose of this protocol is to provide guidelines for monitoring of Benzene (Benzene, toluene, Ethyl benzene M+P xylene and O-Xylene) in ambient air by online real time monitoring instruments. 2.0 Principle The principal of operation of volatile organic compound is based on chromatographic separation in the gaseous phase of measured compound, coupled with a photo ionization detector for detection of these compounds. The sampling gas is drawn into a sampling tube at regulated flow. This is heated and ventilated by carrier gas, this way desorption is done. Transfer of adsorbed compound from sampling tube to pre concentration tube is carried out with a carrier gas. The sampled VOC are re adsorbed in very small volume of adsorbent, which is known as pre concentrator. A strong and fast increase in temperature of graphitized carbon at 350 c together with ventilation of carbon with carrier gas enables desorption of the compounds, which are injected into column. The nitrogen is introduced at inlet of pre concentration tube, which causes displacement of sample in the column. The separation of each compound takes place in this column. The output is measured by a PID detector and the concentrations are displayed on the instrument. 3.0 Instrument/Equipment VOC Analyser - for measurement of Benzene in the ambient air is used for the measurement of this compound. The analyser should be complete with analyser section, sample pump, amplifier/control section, meter, and recording system. The analyser shall meet the performance specifications as prescribed. 4.0 Sampling When sampling the outside ambient from an enclosure, utilize a sampling line or probe extending at least 1 metre from the enclosure, and protected against the entry of precipitation. Place the analyser in an enclosure with atmospheric control so the temperature remains constant at 25 o C + 3 o C. Record the temperature and pressure of the atmosphere sample. 4.1 Operation of the Analyser Connect the analyser with sampling line. Check if dust filter is required to be replaced. Put on the power supply. Analyser is pre programmed or can be re-configured in configuration mode where range, date time, language, measuring cycle etc can be programmed. Return to main menu. Put the analyser 41 P a g e
49 in instantaneous mode and let the instrument to come out of warm up mode. Put the instrument on sample mode it will start the measurement of VOC present in the ambient air. The instrument will monitor Benzene, toluene, Ethyl benzene M+P xylene. Data will log in station computer. 5.0 Calibration 5.1 Requirements Prior to Calibration or Zero/Span Check a) The analyzer under calibration should be in operation for at least overnight so that it is fully warmed up and stabilized. b) Allow the analyzer to sample test atmosphere with known concentration of pollutants. c) During calibration, the analyzer should be operating in its normal sampling mode and it should sample the test atmosphere through all filters, scrubbers, conditioners, and other components used during normal ambient sampling and through as much of the ambient air inlet system as is practicable. d) Complete all operational adjustments of the analyzer. 5.2 Standards and Equipment The calibration of ambient air quality measuring BTX analyzer require a stable, homogeneous gas mixture having the concentration suitable for measuring range of the analyzer to be calibrated. All such test concentrations must be derived from local or working standards that are certified and traceable to primary standards. Built in bench or dilution system is used for calibration. 5.3 Pressure Regulators for the BTX Cylinders A two-stage regulator with inlet and delivery pressure gauges will be required for the Benzene calibration standard cylinder. Procure regulators for each cylinder if individual cylinders are to be used for individual calibration points. Ensure the cylinders have a non-reactive diaphragm and suitable delivery pressure. Consult the supplier from whom the BTX cylinders are to be obtained for the correct cylinder fitting size required for the regulator. 5.4 Flow Controller/calibrator The flow controller can be any device (valve) capable of adjusting and regulating the flow from the calibration standard. If the dilution method is to be used for calibration, a second device is required for the zero-air. For dilution, the controllers shall be capable of regulating the flow + 1%. All the modern dilution system/calibrators have the high precision and accuracy in maintaining the critical flows. The calibrator has the facility to calibrate the instrument with gas cylinder or permeation bench. Out put of the calibrator is connected with the span port of the analyzer. 42 P a g e
50 5.5 Zero Gas Zero gas is defined as gas, which does not contain the parameters to be monitored (any impurity). The concentration of zero gas must be zero in respect of pollutant being calibrated. 5.5 Span Gas (Calibration Gas) The span gas must be capable of providing an accurate, stable and reliable concentration of measured gas. Span gas can be gas mixtures or permeation tubes. What so ever may the span source it must be certified and traceable to NIST. The working standard should also be verified with CRM. 5.6 Zero and Span Calibration Procedures a) Zero Calibration Switch the analyzer at ZERO mode and connect zero gas of (N 2 of % purity) from external source. After the reading has stabilized, check the display of zero value. In case of deviation, adjust the ZERO value. b) Span Calibration After the ZERO calibration has been done, connect the span gas cylinder or permeation bench, of known concentration of Benzene. Switch on the analyzer to SPAN mode. Open the regulator valve of the cylinder and the analyzer will start measuring the span gas concentration. Let the instrument run for three to four cycles for stabilization of results. Observe the chromatogram of the analyzer, and in case there is any variation in the measured value and SPAN gas concentration, adjust the reading of the analyzer to the SPAN gas concentration value. Let it be stabilized again for at least three cycles. On obtaining a desired stable SPAN concentration the instrument should be flushed out with zero air for one or two cycles. After ZERO and SPAN calibration, switch the analyzer to SAMPLE mode. Now, analyzer will measure the benzene and its compounds as per its configuration in the ambient air. c) Multipoint Calibration Multipoint calibration consists of three or more test concentrations including zero concentration. A concentration between 80% and 90% of the full-scale range of the analyzer under calibration, and one or more intermediate concentrations spaced approximately equally over the scale range are required. Multipoint calibrations are used to establish or verify the linearity of analyzer on initial installation and after any major repair. The analyzers have zero and span adjustment controls, which should be adjusted based on the zero and highest test concentration to provide the desired scale range within the analyzer s specifications. Zero and span controls adjustment often affect the zero/span 43 P a g e
51 value, so the adjustments may have to be repeated several times to obtain consistent values i.e. zero or span concentrations. 6.0 Calculation To convert ppb volume fraction to micrograms per cubic metre, use the following equation: ρ 2 x m r x 298ρ ρ 1 = x T x Where: ρ 1 = is the Benzene mass concentration, in microgram /m 3 ρ2 = the Benzene mass concentration, ppb volume fraction m r = is the molar mass of Benzene, (78 g/mol) 298 = is the standard absolute temperature, in Kelvin ρ = is the measured gas pressure, in kilopascals = is the molecular volume of 1 mole, in millilitres T = is the measured absolute gas temperature, in Kelvin = is the standard gas pressure, in kilopascals 7.0 Precautions Operate the analyser in air- conditioned and dust proof room. The temperature should be between degree Celsius Follow standard safety practices for the handling and storage of calibration gas cylinders & the installation and use of the analyser. Do not expose calibration cylinders to direct sunlight or excessive heat. Maintain the same sample cell flow rate during sampling and calibration. Use the same sample pump. 8.0 Quality control There should be a quality control plan, which allows for modification of the frequency and number of points required for calibration. Such a quality control programme assures the accuracy and reliability of the air quality data collected. The calibration programme must include information of dates of calibration, atmospheric conditions, control setting and other pertinent data. The analyzer should be calibrated or re-calibrated: (a) (b) (c) (d) on its initial installation; following its relocation; after every repair or service; if an interruption in operation of more than a few days; and 44 P a g e
52 (e) on detection of malfunction or changing of the analyzer in calibration. In routine operation calibration of analyzer should be checked periodically defining period (once a week) to maintain close agreement between the calibration values used to convert analyzer responses to concentration measurements and the actual response of the analyzer. The frequency of routine periodic calibration is a matter of judgment and is a trade-off among several considerations, including: (a) (b) (c) the inherent stability of the analyzer under the prevailing conditions of temperature, pressure, line voltage, etc. at the monitoring site; the quality of the ambient measurement needed; the risk of collecting invalid data because of a malfunction or invalid data or response problem with the analyzer that would not be discovered until the calibration is carried out. When a new monitoring instrument is installed, zero and span calibration should be very frequent, may be daily. After obtaining enough data on the drift performance of the analyzer, the calibration frequency can be adjusted to provide a suitable compromise among the various considerations mentioned above. To facilitate the process of determining calibration frequency, it is strongly recommended that control charts should be used to monitor the zero and span drift performance of each analyzer. If the drift becomes excessive, then the corrective action has to be taken. 9.0 Record The calibration record of analyzer with details like calibration data, calibration equation, analyzer identification, analyzer location, calibration standards used and their traceability, identity of calibration equipment used shall be maintained by the concerned laboratory staff References 1. Quantitation by Portable Gas Chromatography: Mass Spectrometry of VOCs Associated with Vapor Intrusion by Justin D. Fair, William F. Bailey, Robert A. Felty, Amy E. Gifford, Benjamin Shultes, and Leslie H. Volles 45 P a g e

53 FLOW DIAGRAM OF BTX ANALYSER 46 P a g e
Title: Standard Operating Procedure for Measurement of Ethylene (C 2 H 4 ) in Ambient Air by Reduced Gas Detection (RGD)
 in Ambient Air by Reduced Gas Detection (RGD)") Procedure No: SOP-026 Revision No: 1.0 January 24, 2011 Page No.: 1 of 10 1. INTRODUCTION AND SCOPE To obtain timely data for the purpose of air quality assessment, air quality trend reporting and to meet
Procedure No: SOP-026 Revision No: 1.0 January 24, 2011 Page No.: 1 of 10 1. INTRODUCTION AND SCOPE To obtain timely data for the purpose of air quality assessment, air quality trend reporting and to meet
Title: Standard Operating Procedure for Dasibi Model 5008 Gas Dilution Calibrator
 Procedure No: SOP-034 Revision No: 1.0 Revised Dec. 29, 2010 Page No.: 1 of 10 1. INTRODUCTION AND SCOPE This procedure is intended to describe the operations of the Dasibi model 5008 calibrator. The Dasibi
Title: Standard Operating Procedure for Elemental and Organic Carbon (EC and OC) using Non-Dispersive Infrared Detection (NDIR)
 using Non-Dispersive Infrared Detection (NDIR)") Procedure No: SOP-025 Revision No: 1.0 (January 21, 2011) Page No.: 1 of 8 1. INTRODUCTION AND SCOPE To obtain timely data for the purpose of air quality assessment, air quality trend reporting and to
Procedure No: SOP-025 Revision No: 1.0 (January 21, 2011) Page No.: 1 of 8 1. INTRODUCTION AND SCOPE To obtain timely data for the purpose of air quality assessment, air quality trend reporting and to
METHOD 25A - DETERMINATION OF TOTAL GASEOUS ORGANIC CONCENTRATION USING A FLAME IONIZATION ANALYZER
 1250 METHOD 25A - DETERMINATION OF TOTAL GASEOUS ORGANIC CONCENTRATION USING A FLAME IONIZATION ANALYZER 1.0 Scope and Application. 1.1 Analytes. Analyte CAS No. Sensitivity Total Organic Compounds N/A
Thermo Scientific Model 146i Principle of Operation
 Thermo Scientific Model 146i Principle of Operation The Model 146i Multi-gas Calibrator dilutes calibration gases to precise concentrations. The diluted gases are used to perform zero, precision and Level
Generating Calibration Gas Standards
 Technical Note 1001 Metronics Inc. Generating Calibration Gas Standards with Dynacal Permeation Devices Permeation devices provide an excellent method of producing known gas concentrations in the PPM and
This test shall be carried out on all vehicles equipped with open type traction batteries.
 5.4. Determination of hydrogen emissions page 1 RESS-6-15 5.4.1. This test shall be carried out on all vehicles equipped with open type traction batteries. 5.4.2. The test shall be conducted following
Appendix D: SOP of INNOVA 1412 Photoacoustic Multi-Gas Monitor. Description and Principle of Operation
 Page 1 of 19 : SOP of INNOVA 1412 Photoacoustic Multi-Gas Monitor Description and Principle of Operation The photoacoustic multi-gas monitor (INNOVA 1412, Innova AirTech Instruments, Denmark) is a highly
Title: Standard Operating Procedure for Sabio 2010 and 4010 Dilution Calibrator
 Procedure No: SOP-012 Revision No: 1.2, January 27, 2011 Page No.: 1 of 7 1. INTRODUCTION AND SCOPE This procedure is intended to describe the operations of the Sabio model 2010 and 4010 dilution calibrators.
Laboratory Hardware. Custom Gas Chromatography Solutions WASSON - ECE INSTRUMENTATION. Engineered Solutions, Guaranteed Results.
 Laboratory Hardware Custom Gas Chromatography Solutions Engineered Solutions, Guaranteed Results. WASSON - ECE INSTRUMENTATION Laboratory Hardware Wasson-ECE Instrumentation offers hardware-only solutions
White Paper. Chemical Sensor vs NDIR - Overview: NDIR Technology:
 Title: Comparison of Chemical Sensor and NDIR Technologies TSN Number: 25 File:\\MII- SRV1\Metron\Bridge_Analyzers\Customer_Service_Documentation\White_Papers\25_G en EGA NDIR vs Chemical Sensor.docx Created
Laboratory Hardware. Custom Gas Chromatography Solutions WASSON - ECE INSTRUMENTATION. Custom solutions for your analytical needs.
 Laboratory Hardware Custom Gas Chromatography Solutions Custom solutions for your analytical needs. Laboratory Hardware Wasson-ECE Instrumentation offers hardware-only solutions for advanced chromatography
CHAPTER 16 %UHDWKLQJ*DV0L[LQJ3URFHGXUHV
 CHAPTER 16 %UHDWKLQJ*DV0L[LQJ3URFHGXUHV 16-1 INTRODUCTION 16-1.1 Purpose. The purpose of this chapter is to familiarize divers with the techniques used to mix divers breathing gas. 16-1.2 Scope. This chapter
Application Note AN-107
 SPEC Sensor TM Characterization & Calibration Considerations Scope This document is provided to describe the considerations needed to characterize, calibrate, verify and validate the measurement performance
Title: Standard Operating Procedure for R&R Environmental Devices Model MFC201 Gas Dilution Calibrator
 Procedure No: SOP-029 Revision No: 1.1 (December 29, 2010) Page No.: 1 of 7 1. INTRODUCTION AND SCOPE To obtain timely data for the purpose of air quality assessment, air quality trend reporting, air quality
EN ISO/IEC Technical Requirements
 EN ISO/IEC 17025 - Technical Requirements Wolfgang Garche Environmental Protection Agency Department Air Quality Monitoring, Information, Assessment 1 What means accreditation in accordance to EN ISO/IEC
Air Monitoring Directive Chapter 7: Calibration
 Air Monitoring Directive Chapter 7: Calibration Version Dec 16, 2016 Amends the original Air Monitoring Directive published June, 1989 Title: Air Monitoring Directive Chapter 7: Calibration Number: Program
LUMAZOTE T ECHNICAL BRO CHU RE
 by Chemiluminescence Standards AST D4629 / ASTM D6069 / ASTM D 5176 / ASTM D 5762 / NF EN 12260 / NF M 07-058 Licence TOTAL LUMAZOTE T ECHNICAL BRO CHU RE ERALY & Associés Phone: +33 (0) 1 77 04 80 97
Standard Operating Procedure for H 2 S and SO 2 Converter
 Procedure No: SOP-001 Revision No: 1.0 January 24, 2011 Page No.: 1 of 6 1. INTRODUCTION AND SCOPE This procedure describes the operation and configuration of heated converters used in continuous ambient
CORESTA RECOMMENDED METHOD N 6
 CORESTA RECOMMENDED METHOD N 6 DETERMINATION OF VENTILATION DEFINITIONS AND MEASUREMENT PRINCIPLES (2015 Revision September 2016) 1. SCOPE This CORESTA Recommended Method specifies a method for the determination
Environmental Protection Division
 Operational Policy Manual Section Subsection Environmental Protection Division 6.0 6.01.02 Name of Policy: Replaces: Standard Auditing Procedure for Continuous Emission Monitors and Ambient Air Monitoring
MMS Mercury Monitoring System for Natural Gas
 MMS Mercury Monitoring System for Natural Gas Natural gas often contains mercury at concentrations that vary from below 1 to above 10000 µg/m 3. Mercury is both toxic and potentially damaging: it can corrode
METHOD 3C - DETERMINATION OF CARBON DIOXIDE, METHANE, NITROGEN, AND OXYGEN FROM STATIONARY SOURCES
 METHOD 3C - DETERMINATION OF CARBON DIOXIDE, METHANE, NITROGEN, AND OXYGEN FROM STATIONARY SOURCES 1. Applicability and Principle 1.1 Applicability. This method applies to the analysis of carbon dioxide
APPENDIX C. 40 CFR PART 60 App. B SPEC. 1-4, 6
 APPENDIX C 40 CFR PART 60 App. B SPEC. 1-4, 6 Part 60, Appendix B - Performance Specification 2 Specifications and Test Procedures for SO2 and NOx Continuous Emission Monitoring Systems in Stationary Sources
Columbus Instruments
 0215-003M Portable O 2 /CO 2 /CH 4 Meter User s Manual Columbus Instruments 950 NORTH HAGUE AVENUE TEL:(614) 276-0861 COLUMBUS, OHIO 43204, USA FAX:(614) 276-0529 1 www.colinst.com TOLL FREE 1-800-669-5011
Laser Spectrometers for Online Moisture Measurement in Natural Gas. Ken Soleyn GE M&C
 Laser Spectrometers for Online Moisture Measurement in Natural Gas Ken Soleyn GE M&C ken.soleyn@ge.com Introduction TDLAS (Tunable Diode Lase Absorption Spectroscopy) Moisture Analyzers have become the
APPLICATION NOTE. GC Integrated Permeation Device
 GC Integrated Permeation Device GC-integrated Design PPB to PPM Level Calibration No Cylinders or Regulators Required Option for Dual Ovens Cost Effective, Safe, Clean, Flexible, NIST Traceable Keywords:
Technical Data Sheet MF010-O-LC
 Technical Data Sheet MF010-O-LC - 1 - 1. Properties The oxygen measuring system MF010-O-LC determines the oxygen content in gas mixtures up to a temperature of 250 C. It is particularly suitable for the
CALIBRATION. empanelled laboratories following standard procedures and using certified reference standards.
 CALIBRATION A. Calibration of Air Analysers Gaseous Parameter a. The instruments/ analysers for real time monitoring of gaseous emissions shall be calibrated with respect to their functioning, drift, linearity
Best Practice Guide, Servomex 2700
 For full installations details refer to the. Best Practice Guide, Servomex 2700 Mounting: General Guidelines: Servomex 2700 Control Units and air supplies (utilities units) should, ideally, be mounted
11/22/ (4) Harmonization: <846> SPECIFIC SURFACE AREA
 Harmonization: <846> SPECIFIC SURFACE AREA") BRIEFING 846 Specific Surface Area, USP 27 page 2385. The European Pharmacopoeia is the coordinating pharmacopeia for the international harmonization of the Specific Surface Area General Chapter, as part
BRIEFING 846 Specific Surface Area, USP 27 page 2385. The European Pharmacopoeia is the coordinating pharmacopeia for the international harmonization of the Specific Surface Area General Chapter, as part
HIGH ACCURACY MULTI-GAS MONITORING USING AUTOMATED SELF- CALIBRATION
 HIGH ACCURACY MULTI-GAS MONITORING USING AUTOMATED SELF- CALIBRATION SCENTROID is the global leader in sensory technology providing intelligent environmental solutions across a wide range of industries
METHOD 21 - DETERMINATION OF VOLATILE ORGANIC COMPOUND LEAKS. 1.2 Scope. This method is applicable for the
 1151 METHOD 21 - DETERMINATION OF VOLATILE ORGANIC COMPOUND LEAKS 1.0 Scope and Application. 1.1 Analytes. Analyte Volatile Organic Compounds (VOC) CAS No. No CAS number assigned 1.2 Scope. This method
Gaseous oxygen technical grade Specification
 CDC 09 (5010) P3 Rev. TZS 217:1984 FINALIZED TANZANIA STANDARD Gaseous oxygen technical grade Specification TANZANIA BUREAU OF STANDARDS. 2 nd edition TBS 2017 0. FOREWORD 0.1. This Tanzania Draft Standard
SOUTH COAST AIR QUALITY MANAGEMENT DISTRICT METHOD INSTRUMENTAL ANALYZER PROCEDURES FOR CONTINUOUS GASEOUS EMISSION SAMPLING
 SOUTH COAST AIR QUALITY MANAGEMENT DISTRICT METHOD 100.1 INSTRUMENTAL ANALYZER PROCEDURES FOR CONTINUOUS GASEOUS EMISSION SAMPLING OFFICE OF OPERATIONS TECHNICAL SERVICES DIVISION MARCH 1989 METHOD 100.1
APTI 464. Analytical Methods for Air Quality Standards. Laboratory Exercise Manual. March 2010
 APTI 464 Analytical Methods for Air Quality Standards Laboratory Exercise Manual March 2010 Table of Contents Course Goals and Objectives X Chapter 1: Laboratory A, Measurement Principle and Calibration
Certification of AMS acc. EN 15267, Part 3 - Overview and First Experience -
 Certification of AMS acc. EN 15267, Part 3 - Overview and First Experience - Dr. Wolfgang Jockel, Martin Schneider, TÜV Rheinland Group, D-51105 Cologne / Germany 1. Introduction A new basis for the certification
Vehicle-mounted meters, pump supplied
 Purpose This inspection procedure outline (IPO) defines the minimum tests which must be performed to ensure that basic volumetric measuring devices comply with the legislation. Application Vehicle-mounted
CORESTA RECOMMENDED METHOD Nº 67
 CORESTA RECOMMENDED METHOD Nº 67 DETERMINATION OF WATER IN THE MAINSTREAM SMOKE OF CIGARS BY GAS CHROMATOGRAPHIC ANALYSIS (November 2005) 1. FIELD OF APPLICATION The method is applicable to the particulate
WBEA Standard Operating Procedure
 Page 1 WBEA Standard Operating Procedure SOP Title Temperature and Relative Humidity Author Gary Cross Implementation date March 2, 2013 Revision History Revision # Date Description Author Page 2 Table
RADIATION PROCEDURES MANUAL Procedure Cover Sheet
 RADIATION PROCEDURES MANUAL Procedure Cover Sheet Procedure Title: Calibration of Eberline Portable Particulate Noble Gas Monitor Procedure Number: TSO-08-13-REV 1 Effective Date: July 1, 2008 Approved
Svensk läkemedelsstandard
 Svensk läkemedelsstandard 2019.0 Carbon dioxide Postadress/Postal address: P.O. Box 26, SE-751 03 Uppsala, SWEDEN Besöksadress/Visiting address: Dag Hammarskjölds väg 42, Uppsala Telefon/Phone: +46 (0)18
EMISSION SURVEY FOR SONAE NOVOBORD: WHITE RIVER. Report No. 565/12 FR.1. March 2013 C & M CONSULTING ENGINEERS PO BOX LYNNWOOD RIDGE 0040
 EMISSION SURVEY FOR SONAE NOVOBORD: WHITE RIVER Report No. 565/12 FR.1 BY C & M CONSULTING ENGINEERS PO BOX 74936 LYNNWOOD RIDGE 0040 PRETORIA SOUTH AFRICA SONAE NOVOBORD 1 SUMMARY C&M Consulting Engineers
973-SF 6 Analyzer. Precise and Stable SF 6 Gas Analyzer REFLECTING YOUR STANDARDS
 Precise and Stable SF 6 Gas Analyzer Simultaneous measurement of humidity, SF 6 purity and SO 2 concentration Integrated gas recovery system with automatic pump back Fully automated SF 6 gas testing Fundamental
HCL MONITORING. ICAC MARAMA WORKSHOP May 18-19th, Presented by: Ty Smith. CEMTEK
 HCL MONITORING ICAC MARAMA WORKSHOP May 18-19th, 2011 Presented by: Ty Smith. CEMTEK 1 HCL MONITORING Applications Existing Measurement Technologies New Technologies Calibration and issues 2 APPLICATION
Gas mixtures. Individual solutions specifically for your application
 Gas mixtures Individual solutions specifically for your application For many applications besides pure gases also defined gas mixtures are required. For many routine applications, from operating gases
UNITY 2 TM. Air Server Series 2 Operators Manual. Version 1.0. February 2008
 UNITY 2 TM Air Server Series 2 Operators Manual Version 1.0 February 2008 1. Introduction to the Air Server Accessory for UNITY 2...2 1.1. Summary of Operation...2 2. Developing a UNITY 2-Air Server method
LOW PRESSURE EFFUSION OF GASES revised by Igor Bolotin 03/05/12
 LOW PRESSURE EFFUSION OF GASES revised by Igor Bolotin 03/05/ This experiment will introduce you to the kinetic properties of low-pressure gases. You will make observations on the rates with which selected
Detector Carrier Gas Comments Detector anode purge or reference gas. Electron Capture Nitrogen Maximum sensitivity Nitrogen Argon/Methane
 Gas requirements Gases for packed columns The carrier gas you use depends upon the type of detector and the performance requirements. Table 520-1 lists gas recommendations for packed column use. In general,
Major Design Features
 Major Design Features 3Flex Features Design Benefits Discussion 316 SS fittings and pneumatically actuated, hard-seal valves Provides virtually leak-free gas management with the lowest outgassing rate
ISO INTERNATIONAL STANDARD
 INTERNATIONAL STANDARD ISO 16017-1 First edition 2000-11-15 Indoor, ambient and workplace air Sampling and analysis of volatile organic compounds by sorbent tube/thermal desorption/capillary gas chromatography
Compiled by: B Beard. Approved by: SH Carstens. Description of requirements and procedures for compact provers to be used as verification standards.
 1. Scope Description of requirements and procedures for compact provers to be used as verification standards. 2. Reference documents Trade Metrology Act SANS1698 3. Policy A. BASIC REQUIREMENTS Compact
TG GUIDELINES CONCERNING CALIBRATION INTERVALS AND RECALIBRATION
 GUIDELINES CONCERNING CALIBRATION INTERVALS AND RECALIBRATION Approved By: Senior Manager: Mpho Phaloane Revised By: Field Manager: Neville Tayler Date of Approval: 2015-08-26 Date of Implementation: 2015-08-26
Chapter 5. Sulfur Dioxide Measurement Principles and Calibration Procedures. Introduction
 Chapter 5 Sulfur Dioxide Measurement Principles and Calibration Procedures Introduction In this chapter, the discussion will begin with the reference and equivalent methods for the measurement of sulfur
FLUORESCENCE DETERMINATION OF OXYGEN
 FLUORESCENCE DETERMINATION OF OXYGEN Objectives This experiment will familiarize the students with the principles of fluorescence quenching as well as the Ocean Optics FOXY Fiber Optic Sensor System. Spectra
LINEAR TRANSFORMATION APPLIED TO THE CALIBRATION OF ANALYTES IN VARIOUS MATRICES USING A TOTAL HYDROCARBON (THC) ANALYZER
 ANALYZER") LINEAR TRANSFORMATION APPLIED TO THE CALIBRATION OF ANALYTES IN VARIOUS MATRICES USING A TOTAL HYDROCARBON (THC) ANALYZER Michael T Tang, Ph.D. Grace Feng Greg Merideth Rui Huang Matheson Gas Applied Lab
LINEAR TRANSFORMATION APPLIED TO THE CALIBRATION OF ANALYTES IN VARIOUS MATRICES USING A TOTAL HYDROCARBON (THC) ANALYZER Michael T Tang, Ph.D. Grace Feng Greg Merideth Rui Huang Matheson Gas Applied Lab
Model of a Standard Operating Procedure (SOP) for SO 2 measurements with a UV fluorescence analyzer
 for SO 2 measurements with a UV fluorescence analyzer") Model of a Standard Operating Procedure (SOP) for SO 2 measurements with a UV fluorescence analyzer How to use this specimen SOP This model SOP aims at giving support to network operators in setting-up
Model of a Standard Operating Procedure (SOP) for SO 2 measurements with a UV fluorescence analyzer How to use this specimen SOP This model SOP aims at giving support to network operators in setting-up
Predicted Dispense Volume vs. Gravimetric Measurement for the MICROLAB 600. November 2010
 Predicted Dispense Volume vs. Gravimetric Measurement for the MICROLAB 600 November 2010 Table of Contents ``Abstract...3 ``Introduction...4 ``Methods & Results...6 ``Data Analysis...9 ``Conclusion...12
The HumiSys. RH Generator. Operation. Applications. Designed, built, and supported by InstruQuest Inc.
 The HumiSys RH Generator Designed, built, and supported by InstruQuest Inc. Versatile Relative Humidity Generation and Multi-Sensor System The new HumiSys with single or dual RH probes capabilities is
Modulating Valves for Atmospheric, Infrared, and Direct Fired Burners
 BULLETIN MT2035-07/05 Modulating Valves for Atmospheric, Infrared, and Direct Fired Burners M/MR Series M411, M511, M611 M420, M520, M620, MR410, MR510, MR610 MR212D, MR212E, MR212G and MR212J (Flanged),
Protective Atmospheres, Measurement Technologies and Troubleshooting Tools
 Protective Atmospheres, Measurement Technologies and Troubleshooting Tools Furnace atmospheres are critical to meet metallurgical specifications defined by control processes. The makeup of a furnace s
UT 3000 Mercury Ultratracer
 MERCURY INSTRUMENTS ANALYTICAL TECHNOLOGIES UT 3000 Mercury Ultratracer Measuring of Total Gaseous Mercury (TGM) in Air and other Gases at Ultra Trace Levels. Applications: Air quality studies Monitoring
DEVICES FOR FIELD DETERMINATION OF WATER VAPOR IN NATURAL GAS Betsy Murphy MNM Enterprises 801 N. Riverside Drive Fort Worth, Texas 76111
 INTRODUCTION Water vapor in natural gas has more than a substantial effect on the quality of the gas stream. Without quality measurement of water vapor the gas is basically not saleable. Contracts are
General Accreditation Guidance. User checks and maintenance of laboratory balances
 General Accreditation Guidance User checks and maintenance of laboratory balances January 2018 Copyright National Association of Testing Authorities, Australia 2010 All intellectual property rights in
Plasma. Argon Production Helium Liquefaction Truck Loading Pure Gas Bottling
 SERVOPRO Plasma The SERVOPRO Plasma is a Plasma Emission Detector based analyser designed to continuously measure Nitrogen in pure Argon for process and quality control in Argon production within Cryogenic
INTERNATIONAL STANDARD
 INTERNATIONAL STANDARD ISO 8655-4 First edition 2002-09-15 Piston-operated volumetric apparatus Part 4: Dilutors Appareils volumétriques à piston Partie 4: Diluteurs Reference number ISO 8655-4:2002(E)
STD-3-V1M4_1.7.1_AND_ /15/2015 page 1 of 6. TNI Standard. EL-V1M4 Sections and September 2015
 page 1 of 6 TNI Standard EL-V1M4 Sections 1.7.1 and 1.7.2 September 2015 Description This TNI Standard has been taken through all of the voting stages and has received consensus approval by the TNI membership.
Vehicle- or rack-mounted liquefied gas meters, pump supplied
 Purpose This inspection procedure outline (IPO) defines the minimum tests which must be performed to ensure that basic volumetric measuring devices comply with the legislation. Application Rack/fixed metering
Dust Measurement & SIBATA Products. Sibata Scientific Technology Ltd.
 Dust Measurement & SIBATA Products Sibata Scientific Technology Ltd. Content Conditions of Dust Measurement in Japan Mass Concentration Method & SIBATA Products Relative Concentration Method & SIBATA Products
LOW PRESSURE EFFUSION OF GASES adapted by Luke Hanley and Mike Trenary
 ADH 1/7/014 LOW PRESSURE EFFUSION OF GASES adapted by Luke Hanley and Mike Trenary This experiment will introduce you to the kinetic properties of low-pressure gases. You will make observations on the
Gases&Technology. Measurement of Impurities in Helium Using the Dielectric Barrier Discharge Helium Ionization Detector. FEATURE.
 Gases&Technology FEATURE Measurement of Impurities in Helium Using the Dielectric Barrier Discharge Helium Ionization Detector. B Y M A T T H E W M O N A G L E Abstract Bulk gases are often delivered to
STANDARD OPERATING PROCEDURES
 PAGE: 1 of 14 CONTENTS 1.0 SCOPE AND APPLICATION 2.0 METHOD SUMMARY 3.0 SAMPLE PRESERVATION, CONTAINERS, HANDLING, AND STORAGE 4.0 INTERFERENCES AND POTENTIAL PROBLEMS 5.0 EQUIPMENT/APPARATUS 5.1 Subatmospheric
LFE OEM TCD - Thermal Conductivity Detector
 LFE OEM TCD - Thermal Conductivity Detector Key features Quick response - T90 3 sec Extremely suppressed ranges High corrosion resistance High temperature capability up to 180 C Infallible containment
Development of DMS and Acetonitrile, and Formaldehyde gas standards. Gwi Suk Heo, Yong Doo Kim, Mi-Eon Kim, and Hyunjin Jin
 Development of DMS and Acetonitrile, and Formaldehyde gas standards Gwi Suk Heo, Yong Doo Kim, Mi-Eon Kim, and Hyunjin Jin The amount of chemical substances in cylinder container Purity uncertainty Gravimetry
Calibration of a GC955
 Calibration of a GC955 1 Contents of the power point instructions Standard calibration Automatic validation methods and calibration of multi component mixes Autolinearisation: test of the linearity of
Flare Gas Composition Analysis and QA/QC Lessons Learned and Lessons Lost SPECTRUM ENVIRONMENTAL SOLUTIONS, LLC 1
 Flare Gas Composition Analysis and QA/QC Lessons Learned and Lessons Lost HERMAN HOLM SPECTRUM ENVIRONMENTAL SOLUTIONS, LLC 4C CONFERENCE APRIL 2018 SAN ANTONIO, TX SPECTRUM ENVIRONMENTAL SOLUTIONS, LLC
Elimination of Percent Level H 2 S Calibration Gas from Flare Gas Monitoring Systems Measuring Total Sulfur, H 2 S and BTU.
 Elimination of Percent Level H 2 S Calibration Gas from Flare Gas Monitoring Systems Measuring Total Sulfur, H 2 S and BTU. Control Analytics, Inc 6017 Enterprise Dr Export, PA 15632 (724) 387 CEMS (2367)
STANDARDS FOR COMPRESSED GAS TESTING
 STANDARDS FOR COMPRESSED GAS TESTING APPLICATION NOTE HPD-002 (US) Introduction This publication provides excerpts from some of the many guidelines and standards that pertain to compressed gases in cleanrooms.
PQAO Training 2017 Karl Tupper, San Luis Obispo APCD
 PQAO Training 2017 Karl Tupper, San Luis Obispo APCD 1 Right now: Introduction, Big Picture This afternoon: Demo: Ozone Analyzer Calibration Some additional slides (nitty gritty) More time for Q&A Session:
GasSense NDIR User Manual
 INDEX INDEX... 1 1. OVERVIEW... 2 2. TECHNICAL DATA... 3 3. SPECIFICATIONS... 4 4. PRODUCT DESCRIPTION... 5 4.1 Mechanical details... 5 4.2 Piping... 7 4.3 Connections... 7 5. INSTALLATION... 10 6. CALIBRATION
Met One E-BAM Particulate Monitor
 STANDARD OPERATING PROCEDURES Met One E-BAM Particulate Monitor AMBIENT AIR MONITORING PROGRAM for the 130 LIBERTY STREET DECONSTRUCTION PROJECT LOWER MANHATTAN DEVELOPMENT CORPORATION 1 Liberty Plaza
HiQ laboratory gas generators.
 Product information HiQ laboratory gas generators. The convenient alternative for laboratory environments. 02 HiQ laboratory gas generators HiQ laboratory gas generators. Designed with safety and convenience
AUK Environmental Sensor. Determining the refractive index of the air. AUK Environmental Sensor
 AUK Environmental Sensor Environmental influences can be compensated in two ways: 1. "Manual" input of the current data for air temperature, humidity and pressure and the material temperature of the testpiece
METHOD 204F--VOLATILE ORGANIC COMPOUNDS CONTENT IN LIQUID INPUT STREAM (DISTILLATION APPROACH) 1.1 Applicability. This procedure is applicable for
 1.1 Applicability. This procedure is applicable for") METHOD 204F--VOLATILE ORGANIC COMPOUNDS CONTENT IN LIQUID INPUT STREAM (DISTILLATION APPROACH) 1. INTRODUCTION 1.1 Applicability. This procedure is applicable for determining the input of volatile organic
METHOD 204F--VOLATILE ORGANIC COMPOUNDS CONTENT IN LIQUID INPUT STREAM (DISTILLATION APPROACH) 1. INTRODUCTION 1.1 Applicability. This procedure is applicable for determining the input of volatile organic
Iowa Exceedances of the National Ambient Air Quality Standards, 2013 (Reported Through October 8 th ) Iowa DNR Ambient Air Monitoring Group
 Iowa DNR Ambient Air Monitoring Group") Iowa Exceedances of the National Ambient Air Quality Standards, 2013 (Reported Through October 8 th ) Iowa DNR Ambient Air Monitoring Group What Are the NAAQS? The Clean Air Act requires EPA to set National
Iowa Exceedances of the National Ambient Air Quality Standards, 2013 (Reported Through October 8 th ) Iowa DNR Ambient Air Monitoring Group What Are the NAAQS? The Clean Air Act requires EPA to set National
VIC offers a variety of Calibrated Gas Leaks
 CALIBRATED GAS LEAKS VIC offers a high quality line of calibrated gas leaks traceable to National Institute of Standards Technology (NIST). Calibrated gas leaks are used to provide a controlled delivery
Drilling Efficiency Utilizing Coriolis Flow Technology
 Session 12: Drilling Efficiency Utilizing Coriolis Flow Technology Clement Cabanayan Emerson Process Management Abstract Continuous, accurate and reliable measurement of drilling fluid volumes and densities
Thermo Environmental 48C Carbon Monoxide QA Plan Section I Electronic Calibration Branch Responsibilities
 Page 1 of 12 Thermo Environmental 48C Carbon Monoxide QA Plan Section I Electronic Calibration Branch Responsibilities Page 2 of 12 Table of Contents 2.9.1 SAMPLE EQUIPMENT...3 2.9.1.1 Selection and Procurement...3
OMCL Network of the Council of Europe QUALITY ASSURANCE DOCUMENT
 OMCL Network of the Council of Europe QUALITY ASSURANCE DOCUMENT PA/PH/OMCL (16) 17 R QUALIFICATION OF EQUIPMENT ANNEX 2: QUALIFICATION OF GC EQUIPMENT Full document title and reference Document type Legislative
21700 Nordhoff St. Chatsworth, CA Phone
 21700 Nordhoff St. Chatsworth, CA. 91311 Phone 818.882.2331 DILUTION SYSTEM DILUTION SYSTEM ~ 1 ~ 09 21 07 TABLE OF CONTENTS DEFINITIONS.. 3 INTRODUCTION.. 4 INSTALLATION & SETUP 5 CONVERSION TO PRESSURE
Three Columns Gas Chromatograph Analysis Using Correlation between Component's Molecular Weight and Its Response Factor
 Three Columns Gas Chromatograph Analysis Using Correlation between Component's Molecular Weight and Its Response Factor Anwar Sutan, Metco Services Ltd. Charles Johnson, Metco Services Ltd. Jason Laidlaw,
Specific Accreditation Criteria Calibration ISO IEC Annex. Mass and related quantities
 Specific Accreditation Criteria Calibration ISO IEC 17025 Annex Mass and related quantities January 2018 Copyright National Association of Testing Authorities, Australia 2014 This publication is protected
Automatic Isokinetic Sampler. ST5 Evo
 Automatic Isokinetic Sampler ST5 Evo Automatic Isokinetic Sampler ST5 Evo Moreover, in case of pump failure, the CU can work with a spare Dado PU unit or with any pump capable to supply the needed flowrate,
Model GFC 7000T CO 2 Analyzer (Addendum to GFC 7000TA Manual, PN 07272)
") Manual Addendum Model GFC 7000T CO 2 Analyzer (Addendum to GFC 7000TA Manual, PN 07272) P/N M07273 DATE 06/11/13 TELEDYNE ELECTRONIC TECHNOLOGIES Analytical Instruments 16830 Chestnut Street City of Industry,
Manual Addendum Model GFC 7000T CO 2 Analyzer (Addendum to GFC 7000TA Manual, PN 07272) P/N M07273 DATE 06/11/13 TELEDYNE ELECTRONIC TECHNOLOGIES Analytical Instruments 16830 Chestnut Street City of Industry,
ENVIRONMENTAL LABORATORY APPROVAL PROGRAM CERTIFICATION MANUAL
 1 of 7 The quality assurance plan as presented in the Quality Manual should assure that constant and consistent test conditions are met and verified and should be tailored to the laboratory s activities.
Mr Roger Wood Measurement & Process Group (M&P) Network Strategy National Grid Gas plc Brick Kiln Street Hinckley Leicestershire LE10 0NA
 Network Strategy National Grid Gas plc Brick Kiln Street Hinckley Leicestershire LE10 0NA") Mr Roger Wood Measurement & Process Group (M&P) Network Strategy National Grid Gas plc Brick Kiln Street Hinckley Leicestershire LE10 0NA Dear Roger, Your Ref: Our Ref: Direct Dial: 020 7901 7468 Email:
Mr Roger Wood Measurement & Process Group (M&P) Network Strategy National Grid Gas plc Brick Kiln Street Hinckley Leicestershire LE10 0NA Dear Roger, Your Ref: Our Ref: Direct Dial: 020 7901 7468 Email:
Commercial Practice Test Method Internal Vapor Analysis of Hermetic Devices
 Commercial Practice Test Method Internal Vapor Analysis of Hermetic Devices Oneida Research Services, Inc. 8282 Halsey Road Whitesboro, NY 13492 Phone: (315) 736-5480 FAX: (315) 736-9321 1.0 Purpose The
MODEL 400 CLD INSTRUCTION MANUAL
 MODEL 400 CLD INSTRUCTION MANUAL This manual describes installation, calibration and operation of oxides of nitrogen gas analyzer. To assure correct operation and accurate results, it is recommended that
Impact of imperfect sealing on the flow measurement of natural gas by orifice plates
 Impact of imperfect sealing on the flow measurement of natural gas by orifice plates Rubens Silva Telles 1, Kazuto Kawakita 2 1 IPT Instituto de Pesquisas Tecnológicas, São Paulo, Brazil, rtelles@ipt.br
HumiSys HF High Flow RH Generator
 HumiSys HF High Flow RH Generator Designed, built, and supported by InstruQuest Inc. Versatile Relative Humidity Generation and Multi-Sensor System The HumiSys HF is a high flow version of the previously