Totalflow Web Interface (TWI) software Help notes v1.0 Oct. 3, 2014
|
|
|
- Felicity Anthony
- 6 years ago
- Views:
Transcription
 software Help notes v1.")
1 Technical reference Totalflow products Totalflow Web Interface (TWI) software Help notes v1.0 Oct. 3, 2014 File name: Totalflow products MNAA.docx Document name: Document status: Totalflow products Totalflow Web Interface (TWI) software Help notes v1.0, Technical reference Released Issued by department: User Documentation Distribution: External public Author Document No: User ID: USMIBEN2 Revision: AA Contact: or Pages: 365 Language: EN Proprietary information Copyright 2014 ABB, All rights reserved.
2 Intellectual property and copyright notice 2014 by ABB Inc., Totalflow ( Owner ), Bartlesville, Oklahoma 74006, U.S.A. All rights reserved. Any and all derivatives of, including translations thereof, shall remain the sole property of the Owner, regardless of any circumstances. The original US English version of this manual shall be deemed the only valid version. Translated versions, in any other language, shall be maintained as accurately as possible. Should any discrepancies exist, the US English version will be considered final. Notice: This publication is for information only. The contents are subject to change without notice and should not be construed as a commitment, representation, warranty, or guarantee of any method, product, or device by Owner. Inquiries regarding this manual should be addressed to ABB Inc., Totalflow Products, Technical Communications, 7051 Industrial Blvd., Bartlesville, Oklahoma 74006, U.S.A.
3 Table of Contents Get Connected... 5 Login Administration Facility Dashboard Sub-Facility Dashboard Station Dashboard Configuration Introduction Shutdown Tanks Data Points Alarms Events PID Control Valve Control Pulse Accumulator Plunger Lift Plunger SU Trend System Analysis Trend File Coriolis Interface AGA AGA SUAGA SUAGA SU Coriolis SU Liquid SU V-Cone Therms Master Therms Slave V-Cone rev. AA Page 3
4 Calibration Report XMV Interface I/O Sub-System Gas Lift Selectable Units Tree View Facility Management Page rev. AA

5 Get Connected Overview ABB Totalflow Web Interface (TWI) is developed to enable users to browse, monitor, and update various configuration and statistical values of the Totalflow devices, using a web browser. The TWI design is a system-wide solution. What this means to the user is that the capability exists to handle an operation in its entirety; from the overall facility to the individual components that comprise the facility. ABB Totalflow has adopted a three-tiered design approach to enable users to gain both a system-wide perspective of their operations, and also a component-wide perspective that looks at individual segments of the operations as a whole. The three-tiered design approach starts at the facility level. The facility is the entirety of the operation and all that the facility encompasses. From this high-level view, the TWI enables users to further examine the facility by showing all sub-facilities that make up the facility whole. A sub-facility can be viewed as similar components, such as separators, plunger lifts, etc., that have been grouped together. The TWI gives users the ability to view, monitor, and manage these subfacilities as individual components. Using this method, users can affect certain items without impacting the facility as a whole. From the sub-facility view, users can drill down further to view the stations that individually comprise the sub-facility. These stations can be wells, tanks, or other individual components that are gathered in the sub-facility. The TWI provides the user with monitoring and management capabilities from a facility view, a subfacility view, and/or an individual station view. In this way, the scope of the TWI allows the user to view every facet of the operation rev. AA Page 5

6 This instruction will assist the user familiar with PCCU Software and Totalflow Devices, how to set up and operate the TWI. These basic steps are required to initially set up the TWI and connect to a Totalflow Device. Additional resources Additional publications for TWI are available for free download from TWI Help file technical reference ML/ TWI: The next generation user interface sales sheet SS TWI Additionally, TWI Help files are available via: Customer Document Index DVD shipped with some orders: Insert the DVD into the laptop's drive. Select 'Installation & Operation Manuals' from the main screen and locate the appropriate material in PDF format. PCCU software: PCCU > Help > TWI Help TWI Operator CD: Click on TWI Help button to install help files on your local PC/Laptop The following is assumed in preparation for its setup and operation: Device needs TFWeb Server application and Web-enabled Flash installed. Page rev. AA
7 Device needs "Facility Management" application instantiated. Device has connectivity using PCCU. Device s Ethernet / network interface is configured. Device has a valid IP address. Device applications are configured. Prerequisite requirements are identified as follows: Use PCCU version 7.28 or later. Use the applicable supported browser version (see table below): Browser Internet Explorer (IE) Firefox Chrome Safari Version 9.0, 10 or later 5.0 or later 14.0 or later 5.0 or later For the XFC G4 (XSeries Flow Computer) and XRC G4 (X Series Remote Controller), there will be two different file installation packages provided. One package includes the flash and web pages and the other the web pages only. For this initial startup both the flash and web package are required to be installed. Ensure to download the software package that is specific for the device type, and also note that the 32 MB Engine Card is installed and is the proper version. Device Type Board Part # Flash Version Engine Card Version XFC US or later XFC SU or later XRC US or later XRC SU or later TFWeb Server application Application description (principle of operation) The following block diagram shows the main components of the application: rev. AA Page 7
 Configure Browser and ensure Browser is a supported version.")
8 Procedure Overview Device (PCCU) Connect to Totalflow with PCCU. Load appropriate web-enabled flash. Install applications in Totalflow. Setup IP Address. NOTE: It should be noted that the user is not able to add applications while using the TWI system. Client (Browser) Configure Browser and ensure Browser is a supported version. Test / verify connectivity from web server to device. Add webpage package (using web interface) to upload web packages onto the device. NOTE: Web package contains screens operator will see when connecting via the browser. Webpage functionality (screens) The following lists the many applications and screens supported by the TWI. For information about each of these screens go to the Help files tab, once connected to the Totalflow device. Screen/Application About AGA3 AGA7 AGA3 SU AGA7 SU Screen/Application PID Plunger Plunger SU Pulse Accumulator Shutdown Page rev. AA
9 Screen/Application Alarm Analysis Trend API Liquid SU Coriolis Interface Coriolis SU Data Points Deployment Events Facility and Station Configuration Facility Dashboard Facility Management Gas Lift I/O App Login Screen/Application Station App Station Dashboard Sub-facility Dashboard Tanks Therms Master Therms Slave Trends Unsupported Browser User Management Valve Controller VCONE VCONE SU Web Server Configuration XMV Installation and Configuration of Web Application on the XFC Verify PCCU connection and setup in Expert view. Connect to the XFC local port or via the network. Start PCCU. Click on Entry button. If connection is successful (PCCU main screen shows), click on View on the top menu. Change view to Expert from the dropdown menu. A warning dialog box will request that you answer Yes to continue to Expert mode. Click Yes. Backup Configuration (Station) files If the device has been operational or the initial file configuration has been completed, back up the configuration by using "Save and Restore" configuration. Upgrade Device Flash with PCCU. The unit will need the proper version of Flash software. Follow this procedure to update the Flash. Since this a first-time installation, the Totalflow device must be configured first before attempting connection by the TWI. PCCU is also further needed for configuration changes or additions required to each application setup. The TWI's main function is that of an interface for operations. Any configuration changes made while performing this setup must be backed up using normal save/restore procedures rev. AA Page 9

10 Connect to the Totalflow Device. Load the correct Flash for device used. (See table below.) Download the required software version onto the laptop or the system used to connect to the unit. Use the following chart to ensure the proper version of Flash is loaded on the device. Device Type Flash Package XFC US EX.xfc or later XFC SU EX.xfc or later XRC US EX.xrc or later XRC SU EX.xrc or later If connected to the unit with PCCU, disconnect. The 32-bit loader option is not available while connected to the unit. Once disconnected from the unit, on the tool bar, click on the 32-bit loader button. Select the device type radio button in PCCU32 window. Click the Browse button (...) to locateand select the software files. Check the Shutdown Flash checkbox (Totalflow.exe). Check the Download Flash checkbox (Totalflow.exe). Check the Start Flash checkbox (Totalflow.exe). Go to the connection and select the interface used for the update. Page rev. AA

11 If using the network connection, insert the IP address or DNS name of the device next to the connection. Upgrade is faster if using Ethernet. Click Start and observe the status messages to verify PCCU connects to the device and able to begin the upgrade. If the update is successfully completed the message "Operation Complete displays. Click the close button to exit 32-bit loader. Restart communication with Totalflow device. Go to (Station ID)>Registry tab in the Tree View and verify that the Flash software P/N has been updated to the correct version. Configure IP Address for Device The Totalflow G4 allows connections through the Internet. This type of connectivity can be performed one of two ways: direct connection from the PC or through a network using a DCHP server and a network ID. A specific IP address will need to be configured using the following procedure: Connect to the Totalflow Device. Proceed to the station (ID node)>communications>network in the tree view. In the Enable DHCP field enter Yes or No depending on your IP Network configuration. In the IP Address field, type in the address for the device and select the Send command. Push the RESET button on the device OR remove power from the device in order to perform a Warm Boot. This will set the new IP address in the device. Add the Web Application Go to the station (ID node)> Applications tab. Click the Add Application button. Click the Application to Add to display the drop down list. Locate and choose the TFWeb Server application from the dropdown list. The application will automatically be assigned to the next application number rev. AA Page 11

 > Applications tab. Click the Add Application button.")
12 Click the OK button to commit changes. Click re-read to verify the application has been added and it now appears in the application list associated with the correct application number. The application is also added to the configuration tree view on the left and should be added under the System applications. Repeat the previous steps to add the Facility Management application. Go to station (ID node) > Applications tab. Click the Add Application button. Click the Application to Add to display the drop down list. Locate and select Facility Management App from the dropdown list. The application maybe assigned to any slot. In this instance we have used application number 76. Page rev. AA

.")
13 Click the OK button to commit the changes. Click re-read to verify the application has been added and it now appears in the application list associated with the correct application number. The application is also added to the configuration tree view on the left and should be added under System applications Verify browser initial access to the web server. Choose any of the browsers supported. If the browser installed in your system is not the correct version, download and install a browser that is. Start the browser. Configure "Cookies" to be "Turned On". Please refer to your browser's Help for information to get cookies as this is browser specific. Enter the following URL IP> (ENTER). A web page displays asking the user to login. If the login screen displays, the browser is able to connect to the web server rev. AA Page 13

14 Enter the default user credentials (Username: admin, and Password: admin). Upon login user will be redirected to IP>/pages/admin.html. Upload webpage (package). Upon successful login, proceed to Operator>Administration>Upgrade tab, and select Upgrade. Click on the Upgrade button and choose either of the provided packages (e.g Web1.0.xfc, if using the XFC board). Device Type XFC US XFC SU XRC US XRC SU Flash & Web Package _TF_ _Web1.0.xfc32 or later _TF_ _Web1.0.xfc32 or later _TF_ _Web1.0.xrc32 or later _TF_ _Web1.0.xrc32 or later Web Page Package _Web1.0.xfc32 or later _Web1.0.xfc32 or later _Web1.0.xrc32 or later _Web1.0.xrc32 or later Click the Browse button to locate the web page package. Select the correct web page package from Table 5 for your device. Ensure that file extension (*.xrc32 or *.xfc32) coincides with the device type. Note: XRC and XFC packages will be different and clearly identified in the file name. Select the Upload button. Page rev. AA
15 Note: The upload process may take a few minutes to complete. After file upload completes, the file extraction occurs. Verify File Upload Status, which indicates the upload completion percentage during the upload process. Verify extraction completes successfully and the device restarts rev. AA Page 15


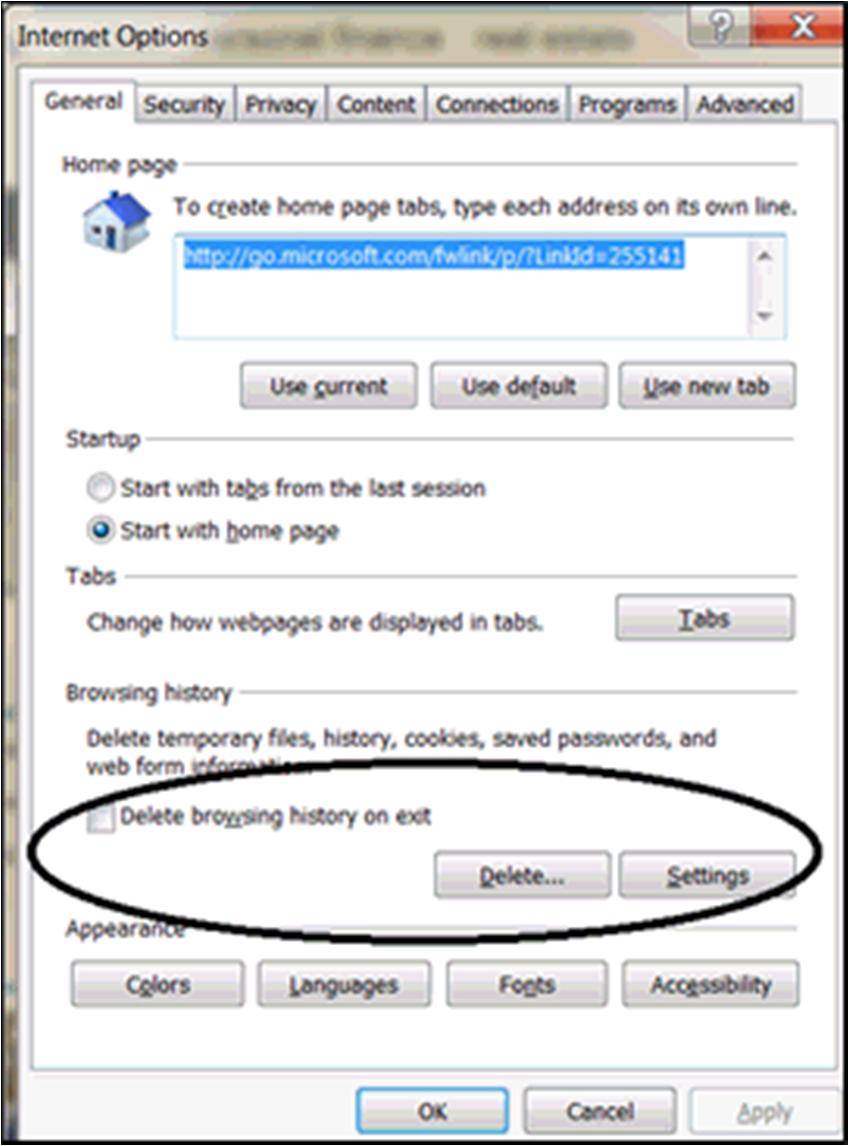
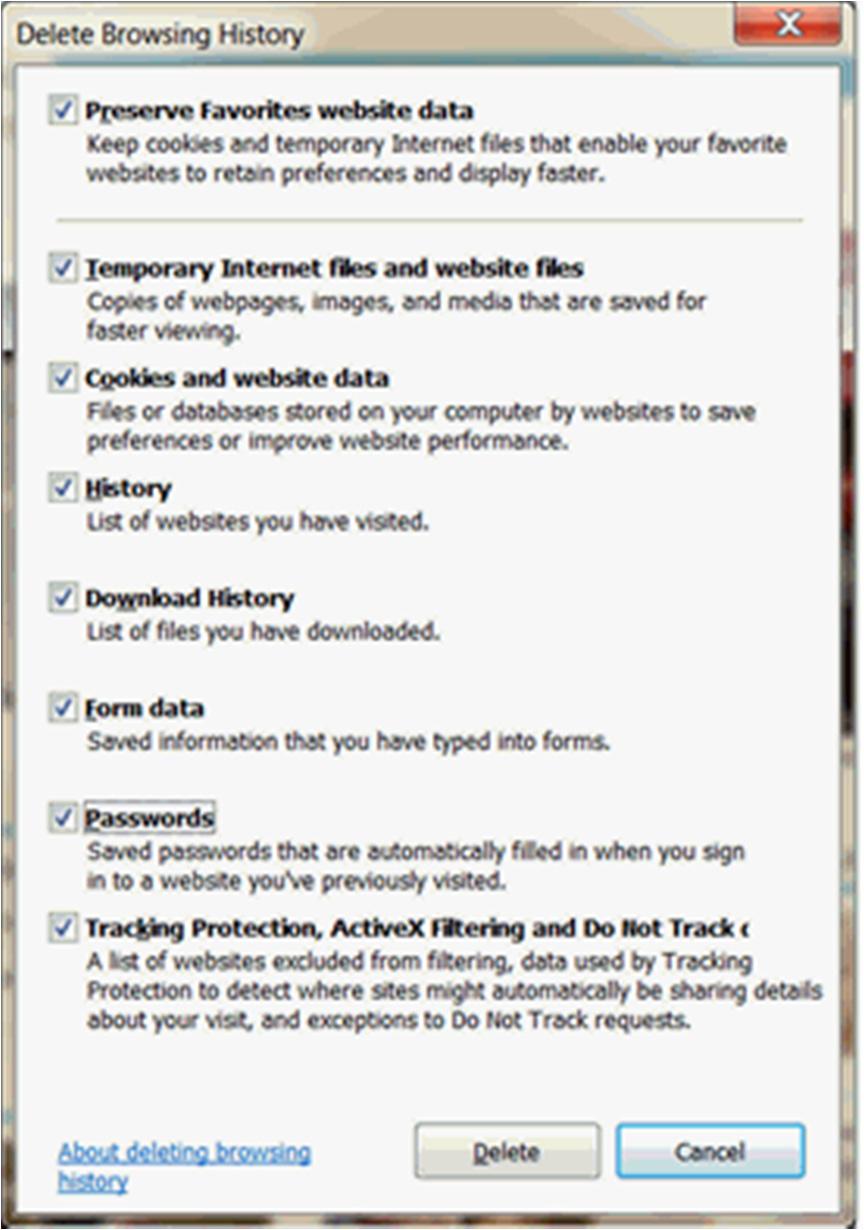
16 Upon successful restart, the browser redirects to a page with a message to clear the cache. This enables access to the just uploaded web pages. Clear the Internet Explorer browser cache when using Internet Explorer. Select Tools > Internet Options from Internet Explorer main menu to display Internet Options popup box Select Delete button under Browsing history to display Delete Browsing History popup box. Check all checkboxes as shown and select Delete button. Page rev. AA
17 rev. AA Page 17


18 Clear Firefox browsing history when using Mozilla Firefox. Click Menu button at top-right corner of Firefox window to display menu. Select History > Clear Recent History to display Clear All History popup box. Select Clear Recent History from menu. Clear All History popup box displays. Page rev. AA
 to ensure normal operations.")
19 Select Time range to clear to Everything. Click appropriate boxes and select Clear Now button. Verify browser access to the web server. Once the web application is added and enabled in the device, and the web page package added, verify access to the web pages (screens) to ensure normal operations. After cache has been cleared, re-insert the device URL again: IP>(ENTER) The URL request is redirected to IP>/pages/login.html. Enter default credentials at the login prompt (admin, admin). Verify the default home screen displayed is the Facility Dashboard rev. AA Page 19

20 Login Overview In order to use the TWI, the user must log in using the appropriate screen as displayed below. The Username and Password must be entered in the appropriate fields as identified by the Administrator, then clicking on the Sign In button. If the user has problems logging in, the Administrator must be contacted to assist the user in resetting the Username/Password. It's important to remember the Username is not case-sensitive but the Password is. Page rev. AA


21 Administration Overview The Administration window serves as a multi-functional area where the user can establish multiple components from one centralized location. Upon entering the Administration window, the user notices that there are several sections available to them: Users, Upgrade and WebServer Configuration. Based on the user's preference, they can then click on the corresponding tabs or edit fields to change the individual parameters contained within each section rev. AA Page 21

22 The following details these individual sections and the parameters that are contained therein. Click on the preferred link to view the information regarding that particular section. WebServer Configuration The WebServer Configuration section is in place as a means for the system administrator to manage the various individuals using the TWI. The system administrator can select User Authentication, Secure Mode and/or Idle Timeout (Min). Each of these sections can be edited by clicking on the Pencil icon. This brings up a corresponding dialog box where changes can be made to that particular section. The sections and their purposes are described below as follows: User Authentication The User Authentication section enables the administrator to set login requirements for individuals that are using the TWI. After the administrator has elected to modify this section by clicking the Pencil icon, a User Authentication dialog box displays. It is here that the administrator can either establish user name/password requirements for the system (Enable) or decline password requirements for entry into the TWI (Disable). Upon making a change to the User Authentication section, click the Save button to ensure the changes are implemented. Note the message in red indicating that the action (Enable or Save) is effective from the next session. Secure Mode The Secure Mode section enables the administrator to set the security methodology for the TWI. After the administrator has elected to modify this section by clicking the Pencil icon, the Secure Mode dialog box displays. The Secure Mode section operates using two different methods. If the administrator selects Enable, the TWI site transitions to HTTPS. This transition signifies that Secure Mode has been established. If the administrator elects to Disable Secure Mode, this transitions the site to HTTP. Upon making a change to the Secure Mode section, click the Save button to ensure the changes are implemented. Note the message that any change to the status of the Secure Mode will log the user off the current session. Idle Timeout (Min) The Idle Timeout (Min) section enables the administrator to set the amount of idle time that the TWI remains active before closing (a range from 2-30 minutes)selecting any value outside of the range will cause a range error to display. After the administrator has elected to modify this section by clicking the Pencil icon, the Idle Timeout dialog box displays. The administrator can then use the available text box to enter the desired Timeout value (in minutes) for the TWI to remain active. Upon making a change to the Idle Timeout section, click the Save button to ensure the changes are implemented. Page rev. AA

23 When the user is within one minute from the end of the duration selected a message does display as follows in an orange box: "Session is about to expire. Do you want to continue the session? No Yes." Users Tab The Users section enables a system administrator to create users and their corresponding password and system privileges, update and/or change the settings on pre-existing users and delete users out of the TWI system. Currently, there are two (2) user types: Administrator and User. Administrators are granted the ability to create, modify and delete users. Users do not have this functionality. Additionally, if an individual is assigned the User designation, the Administration section is completely closed to them. NOTE: Passwords are per device not per individual PC. In other words, multiple devices can be reached by an individual PC, but the user is only allowed to view those devices that they have been assigned access (passwords) to. Add User The following information details the steps necessary for creating a new user and assigning them a password and privileges: Step 1 Step 2 Step 3 Step 4 Within the Users tab, click the Add User button. The Add User dialog box displays. Within the dialog box, the administrator needs to assign a user name and password for the new user being created. Upon completion, the administrator needs to re-type the password for system verification. Next, the administrator needs to assign a Privilege level for the new user being created. Click the down arrow in the corresponding parameter field. From the drop-down menu, select the Privilege type. Upon completion, click the Add User button to save the newly created user into the system. This takes the administrator back to the Users tab. The user that was just created will display in the Users column. Update Profile In the event that certain parameters need to be changed for an individual user, the following instructions walk the administrator through the steps for completing this task. Within the Users tab, click the Update Profile button. The Update Profile dialog box Step 1 displays rev. AA Page 23

24 Step 2 Step 3 Step 4 Within the dialog box, the administrator can select the user being modified from the corresponding parameter field's drop-down menu. Once the user has been selected, the administrator can move to the Attribute field. From the drop-down menu, the administrator can select either Privilege or Password. If the administrator has elected to change the password, the dialog box expands to allow for a new password to be entered. If the administrator has elected to change the user's privilege, the dialog box expands to allow for a new privilege to be assigned to the selected user. Upon completion of the preferred action, click the Update button. This takes the administrator back to the Users tab. The changes are then reflected in the Users column. Delete User The following are the steps necessary to delete a user form the system. Step 1 Step 2 Step 3 Within the Users tab, click the Delete User button. The Delete User dialog box displays. In the dialog box, select the user that is to be deleted from the corresponding parameter field's drop-down menu. Upon selection, click the Delete User button. The user is then deleted out of the system. The administrator is automatically taken back to the Users tab. The user that was deleted is no longer displayed in the Users column. Upgrade Tab Upgrade Tab The following information details the steps necessary to upgrade the existing TWI software: The Upgrade section enables an administrator to browse to a corresponding file on their local machine and then upload that particular file to a device. The file type will have an.xfc32 or.xrc32 extension. If a different file type other than.xfc is selected, a dialog box displays and informs the administrator that they need the.xfc file type before they can proceed. Additionally, there should be enough disk space to facilitate the uploading of the.xfc file. Traditionally, the space required is three times the size of the.xfc file being uploaded. A valid.xfc file is comprised of one of the following: Web pages + part number (If this is selected to be uploaded, the device reboots once. After the reboot has occurred, the uploaded pages are automatically used) Page rev. AA
25 Web pages + part number + totalflow.exe + TfExeInfo (If this is selected to be uploaded, the device will reboot once. After these reboots occur, the uploaded web pages and the totalflow.exe are automatically used) NOTE: In cases where the web pages are not already present in the device, the administrator is automatically taken to the Upgrade section after logging into the system. After the administrator has moved to the Upgrade section, click the Upgrade button. Step 1 The Upgrade dialog box displays. Step 2 Step 3 Step 4 In the dialog box, click the Browse button. A File Upload dialog box displays. Navigate to where the corresponding file is located. Once the file is located, select the file. Upon selection, click the Open button. With the file path displayed in the Browse parameter field, click the Upload File button. The selected file is then uploaded to the device. Facility Dashboard Overview The production hierarchy manifests itself on three levels: Facility, Sub-Facility and Station. Here on the Facility Dashboard screen displays key information needed to generate reports and produce accurate information from the Facility. With this information, the user is able to monitor data from production (total and selected sub-facility) for the production cycle selected. Tank levels including Height Remaining data as well as more general information regarding quick task status are displayed on the right side of the screen. Underneath the Production display is information relating to the selected tab. At the top of the screen are navigational icons common to all screens. There is an Operator pulldown menu with four screen options: Facility Management Application, Configuration, Administration and SU Setup. These are shortcuts to those selected screens. To the right of that menu is a Help pulldown menu which gives access to the Help screens and About (System Information). Continuing further to the right is Refresh Now which is a selectable link to refresh the screen. Last to the right is the Monitoring Off pulldown menu to identify the monitoring frequency (in seconds) or turn monitoring off. Above this button is a pulldown menu identified with the user's name (in this instance "Admin") which allows the user to log out of the system rev. AA Page 25

26 Application Carousel Below the Facility path and above the Production section is the Application Carousel with up to eight application icons (boxes) with individual information displayed. Selecting any icon itself will take the user to the individual page for that application. There is no limit to the number of apps able to be displayed in the Application Carousel. Note the same applications listed horizontally across the top of the page in the colored square icons are the same listed under the Tree View. From this screen, there are two ways available to access the same application page: (1) from the Tree View list or (2) from the individual icons. If there is not enough space to display all the application icons, clicking on the right-facing triangle at the end of the carousel will cause them to slide to the left and be replaced by the remaining application icons. Then clicking on the left-facing triangle at the opposite end of the carousel will cause the newly displayed icons to slide to the right and be replaced by the original application icons. Production The Production chart displayed is for a selected sub-facility for Today's and Yesterday's production. If the Site Map is loaded in the device, it will be displayed automatically instead of the production display in all Dashboard screens (Facility, Sub-Facility and Station) as pictured below. By selecting the Tree View icon, the user can call up the production display. If the Site Map is not loaded in the device, the regular production data is displayed including the graph and tank information. In the upper left corner of the production display is the SVG icon. Using this icon, the user will receive an error message if trying to call up the production display (graph). If the Site Map is loaded, selecting the SVG icon will display the UI Editor. Page rev. AA
27 Moving to the right, one will note the Volume and Energy icons. Either display can be selected for the graph. Volume displays the gas, oil hydrocarbon and/or water. Energy displays gas only. The graph can be set up for a 14-day or 7-day cycle by clicking on the desired option in the upper right corner of the production graph. The color-coded graph shows Total Volume/Energy for last 14/7 days in orange for all the sub-facility and stations under them and in gray for the current sub-facility. The user can hover the mouse over the colors of each bar of the graph and the applicable display will indicate the date with production value. Also displayed on the chart area is the numerical value of yesterday's total production per measured element. The arrow below labelled SubFacility 1 will take the user directly to that screen (and hierarchy level). Below the chart are five tabs with related information as follows: Alarms Any Alarms with the applications associated with the facility, sub-facilities or wells are displayed here. Critical (Fault and System Fault Severity) alarms have a filled red triangle, while General and Warning alarms have an unfilled orange triangle. Clicking on any individual alarm will take the user to the Alarms screen for facility. Events Any events associated with the applications of the facility/sub-facility/wells are listed here along with their date/time information. Clicking on the Events tab will take the user to the Events screen for Facility. Data Points Any data points with their measured values are displayed. Clicking on any of the values displayed will take the user to the dedicated Data Points screen. System Apps Selecting any of the applications displayed from the System Apps tab will take the user directly to the related screen. Unassociated Apps Selecting any of the applications displayed from the Unassociated Apps tab will take the user directly to the related screen. Tanks Storage tanks of this facility are displayed in iconic form to the right of the chart. A maximum of fifteen tank icons can be displayed here at one time. Below these icons is the selectable Tank icon. Clicking here will take the user directly to the Tanks screen under LevelMaster. Note below the link the oil and water levels (in blue) are represented along with the height remaining. Facility Apps Note the applications available and displayed for this facility (from the Application Carousel): AGA3-1 Station SUAGA7-1 PID Control Valve Control Shutdown LevelMaster Therms Master Therms Slave rev. AA Page 27
28 Coriolis Interface Pulse Accumulator Plunger Plunger SU Trends Events Data Points If there is a Trends or Alarms occurrence running in PCCU, there will be an app in all the associated Facility, Sub-Facility and Station (Well) Dashboards. Quick Tasks Below the Tanks display is a Quick Tasks status of the following: Facility Shutdown If needed, the user may shut down the entire facility by selecting the Choose icon. A red triangle shows the facility would be in shutdown mode. By selecting the Choose icon again, the user may restart the facility and the red triangle would be replaced with a green icon indicating the change of status back to the Facility in running mode. Sub-Facility Dashboard Overview The production hierarchy manifests itself on three levels: Facility, Sub-Facility and Station. Here on the Sub-Facility Dashboard screen displays key information needed to generate reports and produce accurate information from the Sub-Facility. With this information, the user is able to monitor data from production (Sub-Facility and selected Station) for the production cycle selected. At the top of the screen are navigational icons common to all screens. There is an Operator pulldown menu with four screen options: Facility Management Application, Configuration, Administration and SU Setup. These are shortcuts to those selected screens. To the right of that menu is a Help pulldown menu which gives access to the Help screens and About (System Information). Continuing further to the right is Refresh Now which is a selectable link to refresh the screen. Last to the right is the Monitoring Off pulldown menu to identify the monitoring frequency (in seconds) or to turn monitoring off. Above this button is a pulldown menu identified with the user's name (in this instance "Admin") which allows the user to log out of the system. Page rev. AA

29 Application Carousel Below the Facility path and above the Production section is the Application Carousel with up to eight application icons (boxes) with individual information displayed. Selecting any icon itself will take the user to the individual page for that application. There is no limit to the number of apps able to be displayed in the Application Carousel. Note the same applications listed horizontally across the top of the page in the colored square icons are the same listed under the Tree View. From this screen, there are two ways available to access the same application page: (1) from the Tree View list or (2) from the individual icons. If there is not enough space to display all the application icons, clicking on the right-facing triangle at the end of the carousel will cause them to slide to the left and be replaced by the remaining application icons. Then clicking on the left-facing triangle at the opposite end of the carousel will cause the newly displayed icons to slide to the right and be replaced by the original application icons. Production The Production chart displayed is for a selected sub-facility for Today's and Yesterday's production. If the Site Map is loaded in the device, it will be displayed automatically instead of the production display in all Dashboard screens (Facility, Sub-Facility and Station) as pictured below. By selecting the Tree View icon, the user can the call up the production display. If the Site Map is not loaded in the device, the regular production data is displayed including the graph and tank information. In the upper left corner of the production display is the SVG icon. Using rev. AA Page 29
30 this icon, the user will receive an error message if trying to call up the production display (graph). If the Site Map is loaded, selecting the SVG icon will display the UI Editor. Either the Volume or Energy display can be selected for the graph. Volume displays the gas, oil hydrocarbon and/or water. Energy displays gas only. The color-coded graph shows Total Volume/Energy for last 14/7 days in orange for selected station and in gray for the current sub-facility. The user can hover the mouse over the colors of each bar of the graph and the applicable display will indicate the date with production value. Also displayed on the chart area is the numerical value of yesterday's total production. Below the Yesterday's Total Volume is displayed parameters for volume or energy depending on what has been displayed to the right of the graph. The arrow labeled Station 1 will take the user directly to that Station Dashboard screen (and hierarchy level). And below that the value of the total production is displayed. Below the chart are three tabs with related information as follows: Alarms Any alarm history for any tank or well is displayed here. Critical (Fault and System Fault Severity) alarms have a filled red triangle, while General and Warning alarms have an unfilled orange triangle. Clicking on any individual alarm will take the user to the Alarms screen. Events Any events tied to Well 1 are listed here along with their date/time information. Clicking on the Events tab will take the user to the Events screen. Data Points Any data points with their measured values are displayed. Clicking on any of the values displayed will take the user to the dedicated Data Points screen. Measurement Tubes Here is displayed the default application for the Sub-Facility. These would be the measurement tubes and would be instantiated in the following order of preference: AGA3, AGA7, SUAGA3 and SUAGA7. The four values associated with measurement are displayed to the right of the Production display as follows with a graphic history of the individual value to its side. Parameters are SP, DP, Temp,Today s Volume for Orifice type tubes and SP, Pulse Count, Temp, Today s Volume for Turbine type tubes and Flowing Pressure, Pulse Count, Flowing Temp, Today s Indicated Volume for Liquid Tube Type along with their respective sparklines. Static Pressure Differential Pressure Temperature Today's Volume Displays the static pressure (PSIG). Displays the differential pressure (PSIG or PSIA). Displays temperature (Degrees F.). Displays today's volume (MCF/day). Page rev. AA
31 Sub-Facility Apps Note the applications available and displayed for this sub-facility (from the Application Carousel): PID Control AGA3-3 SUAPILIQ-1 Trends Events Data Points If there is a Trends or Alarms occurrence running in PCCU, there will be an app in all the associated Facility, Sub-Facility and Station (Well) Dashboards. Quick Tasks The user may select the following Quick Task displayed below the tube parameter display: Sub-Facility Shutdown The user may shut down as needed the entire sub-facility by selecting the Choose icon. A red triangle shows the sub-facility would be in shutdown mode. By selecting the Choose icon again, the user may restart the sub-facility and the red triangle would be replaced with a green icon indicating the change of status back to running mode. Selecting Choose again would change it back in shutdown. Station Dashboard Overview The purpose of the Station Dashboard is to display information pertinent to a selected individual well and its production. The selected well from the Facility Dashboard is Station 1. At the top of the screen are navigational icons common to all screens. There is an Operator pulldown menu with four screen options: Facility Management Application, Configuration, Administration and SU Setup. These are shortcuts to those selected screens. To the right of that menu is a Help pulldown menu which gives access to the Help screens and About (System Information). Continuing further to the right is Refresh Now which is a selectable link to refresh the screen. Last to the right is the Monitoring Off pulldown menu to identify the monitoring frequency (in seconds) or to turn monitoring off. Above this button is a pulldown menu identified with the user's name (in this instance "Admin") which allows the user to log out of the system rev. AA Page 31

32 Application Carousel Below the Facility path and above the Production section is the Application Carousel with up to eight application icons (boxes) with individual information displayed. Selecting any icon itself will take the user to the individual page for that application. There is no limit to the number of apps able to be displayed in the Application Carousel. Note the same applications listed horizontally across the top of the page in the colored square icons are the same listed under the Tree View. From this screen, there are two ways available to access the same application page: (1) from the Tree View list or (2) from the individual icons. If there is not enough space to display all the application icons, clicking on the right-facing triangle at the end of the carousel will cause them to slide to the left and be replaced by the remaining application icons. Then clicking on the left-facing triangle at the opposite end of the carousel will cause the newly displayed icons to slide to the right and be replaced by the original application icons. Production The Production chart displayed is for a selected sub-facility for Today's and Yesterday's production. If the Site Map is loaded in the device, it will be displayed automatically instead of the production display in all Dashboard screens (Facility, Sub-Facility and Station) as pictured below. By selecting the Tree View icon, the user can the call up the production display. Page rev. AA
. If the Site Map is loaded, selecting the SVG icon will display the UI Editor.")
.")
33 If the Site Map is not loaded in the device, the regular production data is displayed including the graph and tank information. In the upper left corner of the production display is the SVG icon. Using this icon, the user will receive an error message if trying to call up the production display (graph). If the Site Map is loaded, selecting the SVG icon will display the UI Editor. Either the Volume or Energy display can be selected for the graph. Volume displays the gas, oil hydrocarbon and/or water. Energy displays gas only. The color-coded bar graph shows the selected well's production for all sampled days in the cycle (either 7 or 14 days as selected by the user). Since at the station level, the production only comes from the assigned well (station), there is no other production displayed and thus no gray portion of the bars on the graph. The user can hover the mouse over any bar of the graph and the applicable display will indicate the date with production value. Below the Yesterday's Total Volume is displayed parameters for volume or energy depending on what has been displayed to the right of the graph rev. AA Page 33
34 Below the chart are three tabs with related information as follows: Alarms Events Data Points Alarms if any associated with the applications of the current well is displayed here. Selecting the arrow will call up the Alarms page for the current well. (Not available from this page) Any events tied to the current well are listed here along with their date/time information and description. Hovering over any of the entries will display an arrow. Selecting the arrow will call up the Events page. (Not available from this page) Data points with their standards of measurement are displayed here. (Not available from this page) Measurement Tubes Here is displayed the default application for the default well (Station 1). These would be the measurement tubes and would be instantiated in the following order of preference: AGA3, AGA7, SUAGA3 and SUAGA7. The four values associated with measurement are displayed to the right of the Production display as follows with a graphic history of the individual value to its side. Parameters are SP, DP, Temp, Today s Volume for Orifice type tubes and SP, Pulse Count, Temp, Today s Volume for Turbine type tubes and Flowing Pressure, Pulse Count, Flowing Temp, Today s Indicated Volume for Liquid Tube Type along with their respective sparklines. Static Pressure Differential Pressure Temperature Today's Volume Displays the static pressure (PSIG). Displays the differential pressure (PSIG or PSIA). Displays temperature (Degrees F.). Displays today's volume (MCF/hr). Station Apps Note the applications available and displayed for this station (from the Application Carousel): AGA3-2 Gas Lift Trends Events Data Points Quick Tasks The user may select the following Quick Task displayed below the tube parameter display: Well Shutdown If needed, the user may shut down a designated well by selecting the Choose icon. A red triangle shows the facility would be in shutdown mode. By selecting the Choose icon again, the user may restart the well and the red triangle would be replaced with a green icon indicating the change of status back to the well in running mode. Selecting Choose again would place the well back in shutdown. Page rev. AA

35 Configuration Overview Configuration enables the user to associate/disassociate the applications that have been assigned to the various stations and the facility itself within the TWI system. Configuration works in concert with PCCU32. By selecting the Facility Dashboard's Operator pulldown menu, the Configuration option can be selected to display this screen. Upon entering Configuration, the user will see the Configuration screen for the facility. For navigating to the Configuration screen for either the Sub- Facility or Station, the user needs to navigate to the respective screen and then click on the Configuration option available from the Operator pulldown menu. On opening the well sections and/or the facility section, there are three tabs that the user can select from: Apps, Trend Files, and Data Points. Apps The Apps list is the area where the user can view all of the application station groups that were established in PCCU32 along with a list of all the available applications that are associated with the well/facility that the user is connected to. For example, the user can have a group (G1) that contains Well 1. Well 1 can then have applications associated with it such as LevelMaster. NOTE: Although the user will see every application that is available on the device, not all of the applications are available for use with the TWI. NOTE: A disassociated application is available across the facility and all the stations for association. Once the application is associated with the station, it is removed from the facility and other stations. Application grouping takes place within PCCU32. Once the applications have been assigned to a station, the user can move to the TWI and see the station and the applications that are specifically tied to them. Select Edit All to select or deselect. Assigned applications are indicated by a check mark rev. AA Page 35
36 Those applications that are supported by the TWI but have not been assigned a group are placed under the Facility section. Within each station section is an Edit button. When selected, this allows the user to activate the applications within the corresponding section. The user can then associate or disassociate applications within that individual section. Selecting an application will associate an application within the TWI. Deselecting an application will turn it off within the TWI. After the user has performed the preferred actions, click the Save button to save the changes to the system. Trend Files The Trend Files area enables the user to assign specific trend files or de-select them to run for an established application group. The trend files are first established in PCCU32. Once they have been created, the user can move to the TWI and view the trend files. The user will need to click the Edit All button to activate all of the trend files. It is then just a matter of selecting the trend files to attach to the specific station group. Upon completion, the user would click the Save button to save the action. NOTE: The trend file is visible to all stations and is available to be associated with them. The user will then need to move to the Facility Dashboard, and click on the station group that the trend file(s) were attached to. This takes the user to the Station Group information window. Click on the Trends tab to see the trend file(s) information, based off of the type of trend file(s) that were selected by the user previously. Data Points The Data Points area within the Station Configuration enables the user to establish data points for either the facility or the station groups. The following details the steps for performing this action: In the Data Points tab, click the Edit All button. This will initialize the Data Points section. Step 1 Upon initialization, click the Add button. Step 2 In the Description field, enter in a description for the data point. Step 3 Next, move to the register field. The user will need to enter in the app/array/register. Step 4 Based on the units that the user wants the data point to be measured in, type the engineering units in the corresponding Units parameter field. Step 5 Upon completion, click the Save button. This will save the newly created data point. Step 6 The user can create further data points for the station group or facility by repeating steps 1-5. To delete a data point, click the x icon next to the desired Data Point(s). This will delete the data point from the station or facility. Introduction The Totalflow Web UI (TWI) represents a leap forward for ABB in our continuing efforts to provide the right information to our customers when they need it. Using the latest technology, the TWI is geared as the perfect solution for oil and gas operations and equipment management. The modern user interface design is tightly integrated with unique hardware capabilities and powerful embedded algorithms that enable the user to perform many functions right from their laptop. With the continuing evolution of technology, users have become accustomed to highly intuitive software on a multitude of different devices and platforms. With the vision to see that this trend will continue, ABB has created a user-centric software experience that takes into account all human factors, interaction designs, information modeling and more to create the best user experience possible. Page rev. AA
37 Overview The TWI is designed as a system-wide solution. What this means to the user is that the TWI is geared to handle an operation in its entirety, from the overall facility to the individual components that comprise the facility. ABB Totalflow has adopted a three-tiered design approach to enable users to gain both a system-wide perspective of their operations and also a component-wide perspective that looks at individual segments of the operations as a whole. The three-tiered design approach starts at the facility level. The facility is the entirety of the operation and all that it encompasses. From this high-level view, the TWI enables users to further examine the facility by showing all sub-facilities that make up the whole of the facility. A sub-facility can be viewed as similar components, such as separators, Plunger Lifts, etc., that have been grouped together. The TWI gives users the ability to view, monitor and manage these sub-facilities as individual components. Using this method, users can affect certain items without impacting the whole of the facility. From the sub-facility view, users can then drill down further to view the stations that individually comprise the sub-facility. These stations can be wells, tanks or other individual components that are gathered in the sub-facility. The TWI provides the user with monitoring and management capabilities from a facility view, a subfacility view and/or an individual station view. In this way, the Totalflow Web UI's scope allows the user to view every facet of their operation. Additionally, the user can also find various default applications that come bundled with the TWI. These applications (Pad Controller, Shutdown System, LevelMaster, etc.) allow the user to establish certain parameters that will affect the corresponding components within the facility. NOTE: It should be noted that the user is not able to turn on any application within the TWI system. Hopefully this be of help to you in your use of the TWI. Shutdown Overview The Pad Shutdown System is an application that is designed to enable the user to perform a shutdown of various components within a pad. A pad (facility) can be viewed as a physical plot of land where various equipment ( wells, tanks, separators, etc.) resides. The user can perform a shutdown of these components on the pad, whether it is a single component, a group of components or the whole facility. The TWI Local Access component is designed to work in concert with PCCU32. What this means is that the user establishes the parameters for the Pad Shutdown System within PCCU32, and the TWI provides the user with an overview of the parameter readings gathered from those parameters established in PCCU rev. AA Page 37
38 Status and Control From the Facility Dashboard, the user can view standard information regarding Status and Control after selecting the Facility Shutdown Quick Task. Status Under the Status section the user sees the following: System Status This System Status parameter field displays the current state of the system. The statuses that can be listed are as follows: Disabled - When displayed, this informs the user that the Pad Shutdown System application has been disabled. Manual - During the initial application setup in PCCU32, the system will read the various inputs and will inform the user that an alarm condition exists without performing an actual pad shutdown. Running - Informs the user that the system is functioning normally with no alarms present. Startup - Indicates the very beginning of the Run state. Various, noncritical alarms are ignored until the system stabilizes. Shutdown - Indicates that the pad is in a Shutdown state. Page rev. AA
39 DO Status This is a standard DO that is set to On when the system is in operation. The field will continue to display On when the system is in a Run state; however, if there is a power loss, a shutdown will occur. Last Shutdown Reason Shows the reason for the last shutdown that occurred within the system. Last Shutdown Time Shows the date/time for the last shutdown that occurred within the system. Manual Timer Startup Timer Prevents the system from inadvertently staying in the Manual state. The system will switch from Manual to Enabled when the timer expires. Starts counting down from the value entered in the Startup Value parameter when the system is reset. The timer will not start counting down if any DI or AI that has Startup Holding selected is in alarm. Control Under the Control section the user sees and may select the following: Control Mode Enables the user to establish the shutdown mode. The available options are as follows: ON OFF Manual - When selected by the user, this option enables the user to view the current inputs but does not allow for a shutdown to occur. Reset System Shutdown System Startup Delay The Reset System option is selected when the system needs to be reenabled after a Shutdown System was initiated. This essentially restarts the system unless there is an alarm that is in a critical state. When selected by the user, the system will begin the shutdown sequence. This establishes how long to wait between well openings. Enable Manual Delay When selected by the user, the Manual Delay Timer/Limit (secs) parameter field displays. Within this field, the user can set the time limit before there is a switch from Manual to Enabled. This is a check system for instances where the system has been placed in Manual mode (for example, if the user is servicing the equipment and does not want to disable the system completely) and has inadvertently not been re-enabled. The system will then wait for the designated time frame and then re-enable the Pad Shutdown System. Manual Delay This configurable field enables the user to set the time limit before there is a switch from Manual to Enabled rev. AA Page 39
40 Digital Inputs The Digital Inputs tab displays the established parameters for the Pad Shutdown System. Name Displays the unique name for the corresponding digital input that was established within PCCU32. Value Displays the current value of the digital input and is set as either 0 or 1. State Enabled Displays the current state that the digital input is in. If an alarm is active the text color will be red, if there is no alarm, the text color will be green. Allows the user to set whether the corresponding digital input is enabled or disabled. Polarity Shows the state of the digital input that will cause an alarm (0/1). Ignore Reset Enables the user to establish that the system cannot be reset until the alarm is cleared and a reset is selected; otherwise, the digital input is not checked until the Threshold has expired. Threshold Allows the user to establish a time delay wherein the alarm has to remain on for the corresponding amount of time (in seconds) before a shutdown occurs. Analog Inputs The Analog Inputs tab displays the established parameters for the Pad Shutdown System. The analog inputs have limit settings: Low Limit and High Limit. A trip timer is available; the value has to be outside the limit for a certain period of time (Threshold) before the alarm occurs. Name Value Units State Enabled Low Limit Hi Limit Ignore Reset Displays the unique name for the corresponding analog input that was established within PCCU32. Displays the current value of the analog input. Displays the character string that the user established in PCCU32 from which to label the unit type. Displays the current state that the analog input is in. If an alarm is active the text color will be red, if there is no alarm, the text color will be green. Specify whether the corresponding analog input is enabled or disabled. Enter a value that will cause a low limit alarm if the current value goes below this value. Enter a value that will cause a high limit alarm if the current value goes above this value. Enables the user to establish that the system cannot be reset until the alarm is cleared and a reset is selected; otherwise, the digital input is not checked until the Threshold has expired. Page rev. AA
41 Threshold Allows the user to establish a timed delay wherein the alarm has to remain on for the corresponding amount of time (in seconds) before a shutdown occurs. Digital Outputs The Digital Outputs section displays the established parameters for the Pad Shutdown System. Within PCCU32, the digital outputs can be configured to trigger off of three different states of shutdown: Shutdown - The system is shut down. Only a reset will bring it out. Startup - The system has been reset and is running but may not be stable. Run - The system is running, stable and not in an alarm state. Name Value Displays the unique name for the corresponding digital output that was established within PCCU32. The Value field displays the current value of the digital output. Tanks Overview The LevelMaster Model 7100 Digital Level Sensor is designed to address the unique custodymeasurement and operational needs of tank-level management. Using a combination of innovative software and hardware features, the LevelMaster provides both an accurate level gauge and measurement for components ranging from oil, gas, water, wastewater, flood warning and chemical applications. Once installed, the LevelMaster can then help to ensure accurate sales, prevent spills, increase safety and reduce operating expense. The LevelMaster consists of a sensor tube, 1.95 inches (48.25 mm) in diameter, that sits on the bottom and extends through the top of the container. One or two floats are used to sense the levels by sliding up or down the sensor tube. Each float accurately measures the level of the respective fluids over the full vertical range of the sensor tube. The standard accuracy of the reading is to the nearest +/- 0.1 inch, the high accuracy is to the nearest +/ Additionally, the temperature is also provided along with the fluid level readings. The TWI component is designed to work in concert with PCCU32. This means that the user defines the setup parameters for the LevelMaster within PCCU32, and the TWI provides the user with an overview of the parameter readings gathered from the various tanks. This screen is accessible from the Facility Dashboard by selecting the Levelmaster icon from the display of large square icons at the top of the screen. Selecting any tank icon from the Facility Dashboard will accomplish the same purpose rev. AA Page 41

42 Depending on the number of tanks that the user has established in PCCU32, the user sees up to 15 tanks displayed within the Tanks section on the Facility Dashboard. Here on the Tanks application screen all the tanks can be displayed. Each tank is treated as its own individual unit, and the user can see composite information regarding that individual tank. This also includes alarm indications (note tanks 1-0, 3-0 and 4-0). The information displayed is as follows: Name Oil Water Height Remaining This is the name that the user has established for the specific tank. This value displayed in feet and inches represents the oil level present in the tank. This value displayed in feet and inches represents the water level present in the tank. This reading displays the unused volume that exists within the tank. To gain further information regarding tank readings, the user can click on the tank's name. This is a link that takes the user to the LevelMaster tab. Within this tab, the user can view information regarding each of the specific tanks. Only one LevelMaster application is supported. The information columns are as follows: Tank ID Name Temp This is the LevelMaster's numerical ID, as specified in the LevelMaster Request Block file within PCCU32. This is the name that the user has established for the specific tank. This reading represents the temperature value of the fluids within the tank. Page rev. AA
43 C. Hour This field represents the contract hour in military time (0-23). The contract hour is the start of the day for daily volumes. This field displays the status of the last poll. The available status types are: Success - Data was retrieved successfully. Poll Status Time-out - The program timed-out without retrieving data. Invalid ID - There was no tank ID that matched the specific one being polled. CRC Error - The data was corrupted. Poll Time This represents the time of the last successful poll. Alarm Codes The Alarm Codes field displays any alarms that are occurring with the specific tank. An orange unfilled triangle icon indicates a General or Warning fault. A red filled icon indicates a Fault and System fault severity. Oil Water Height Remaining This value displayed in feet and inches represents the oil level present in the tank and is displayed in the blue fill of the tank. This value displayed in feet and inches represents the water level present in the tank and is displayed in the blue fill of the tank icon. This reading displays the unused volume that exists within the tank and is displayed in black in the icon. Data Points Overview The Data Points page will have a list of name/value items. These names will be listed in the.xml file along with the registers to read for their value. Auto-populated fields display the names with their values. In order to access this screen from the Facility screen, click the right arrow on the far right of the display of all application box icons twice. Select the last icon from the left (Data Points) rev. AA Page 43

 represents a critical alarm. The Alarms page is divided under three tabs.")
44 The user will see the following fields within the Data Points page: Description Value This is the name assigned to the Data Point. This is the value assigned to the Data Point. Alarms Overview The Alarms/Events tab is the area where the user can view information about alarm conditions or events that have happened within the system. The majority of the fields that the user encounters are for informational purposes only. Alarms are established within PCCU32 and can then be viewed within the TWI. A triangular icon displays for alarms. An unfilled triangle represents a general alarm. A filled triangle (in red) represents a critical alarm. The Alarms page is divided under three tabs. They are as follows: Current Alarms The following parameters are displayed with their descriptions: Severity This field displays the severity of the alarm. The Severity types are as follows: General - Indicates that an alarm exists but is not critical to the operation. Warning - This indicates that an alarm exists but is not critical; however, unexpected results may occur. Page rev. AA
45 Fault - Fault indicates that a problem exists that will affect the outcome of the results and may only be on a single stream. Typical issues include Calculation Error, Unnormalized Totals, etc. The results will not be updated on affected streams. Application Name This describes the application where the alarm occurred. Date/Time Date and time that the alarm was logged. Description This is a short description of the alarm. This displays the application number where the alarm system was instantiated App: Alarm No. in PCCU32. The value displayed in this field represents the variable that caused the alarm. Value The value is based on the input register in reference to the threshold that was assigned in PCCU32. Alarm Codes The following represents the alarm codes that the user may see within the Alarm column: Code AH AL DH UH DL UL ZF BF RS AC TE AE Description Absolute Pressure High Operational Limit Violation for at least one second during the log period. Absolute Pressure Low Operational Limit Violation for at least one second during the log period. Differential Pressure High Operational Limit Violation for at least one second during the log period. Uncorrected Volume High Operational Limit Violation for at least one second during the log period. Differential Pressure Low Operational Limit Violation for at least one second during the log period. Uncorrected Volume Low Operational Limit Violation for at least one second during the log period Zero Flow for at least one second during the log period. Back Flow for at least one second during the log period. Occurs when differential pressure is at least three (3) inches below zero. Remote Sense for at least one second during the log period. Auxiliary Contact tripped sometime during the log period. Temperature Error - The temperature measurement is out of the A/D convertor range. The A/D convertor was not able to digitally represent the measured signal from the specified temperature input. This occurs when the temperature reaches 10% below or 10% above the FCU's degree scale for some part of this log period. When the A/D reaches its limit, it uses its default temperature range. The flow computer comes from the factory pre-programmed to a 60 degree default temperature but can be re-programmed to another value with PCCU32. Absolute Pressure Error - The absolute pressure signal from the transducer is out of the conversion range of the A/D convertor. The A/D convertor converts the analog voltage from the transducer to a digital signal that accurately represents the measured value by the transducer. The alarm occurs when the absolute pressure is > approximately 115% full scale (FS) for some part of the log period. These percentages are approximate only due to temperature effects. The transducer has a built-in stop at 15% above FS. Everything above this point is seen as an FS value rev. AA Page 45

46 DE LC LL AN MG CE TH TL FH FL Differential Pressure Error - The differential pressure signal from the transducer is out of the conversion range of the A/D convertor. The A/D convertor converts the analog voltage from the transducer to a digital signal that accurately represents the measured value by the transducer. The alarm occurs when the differential pressure is > approximately 115% full scale (FS) for some part of the log period. These percentages are approximate only due to temperature effects. The transducer has a built-in stop at 15% above FS. Everything above this point is seen as an FS value. Low Charger - Charge voltage is less than (+) 0.4 Vdc above the battery voltage. The lithium battery on the flow computer is below minimum capacity for maintaining RAM memory in the event that power is disconnected. Alternate Fixed Analysis - Live analysis data is being used, and the Live Analysis Period (seconds) has been exceeded since the last live analysis data has been received. The flow computer must be attached to a stream for this alarm to display. Methane Gravity Method of Supercompressibility calculation was used for the log period indicated. The flow computer must be attached to a stream for this alarm to display. Calculation Error - The CE alarm bit is set when a calculation function stops due to an unexpected result. This can occur when the flow computer calculates Cd: the iterative steps fail to converge on a solution. It can occur in calculating Fpv when the iterative density calculation fails to converge on a density for the given composition inputs. The calculated value will be used even though the alarm bit is set. The alarm should alert the user to view any input values that affect the calculation. High Temperature Operational Limit Violation for at least one second during the Log Period. Low Temperature Operational Limit Violation for at least one second during the Log Period. High Flow Rate Operational Limit Violation for at least one second during the Log Period. Low Flow Rate Operational Limit Violation for at least one second during the Log Period. Alarms Not Acknowledged (displayed as Unacknowledged) Page rev. AA

47 Severity This field displays the severity of the alarm. The Severity types are as follows: General - Indicates that an alarm exists but is not critical to the operation. Warning - This indicates that an alarm exists but is not critical; however, unexpected results may occur. Fault - Indicates that a problem exists that will affect the outcome of the results and may only be on a single stream. Typical issues include Calculation Error, Unnormalized Totals, etc. The results will not be updated on affected streams. Application Name Date/Time Description App: Alarm No. Value This describes the application where the alarm occurred. Date and time that the alarm was logged. This is a short description of the alarm. This displays the application number where the alarm system was instantiated in PCCU32. The value displayed in this field represents the variable that caused the alarm. The value is based on the input register in reference to the threshold that was assigned in PCCU32. Alarm Log The following parameters are displayed with their descriptions: rev. AA Page 47
48 Application Name This describes the application where the alarm occurred. Date/Time Date and time that the alarm was logged. This field displays the severity of the alarm. The Severity types are as follows: General - Indicates that an alarm exists but is not critical to the operation. Warning - This indicates that an alarm exists but is not critical; however, unexpected results may occur. Severity Fault - Fault indicates that a problem exists that will affect the outcome of the results and may only be on a single stream. Typical issues include Calculation Error, Unnormalized Totals, etc. The results will not be updated on affected streams. System Fault - This indicates that a potential maintenance problem exists. Typical system faults can include Low or High Carrier or Sample Pressure, Low or High Oven Temperature, etc. The alarm will typically affect calculations; therefore, results will not be updated while this condition exists. Description App: Alarm No. Value State Seq Num This is a short description of the alarm. This displays the application number where the alarm system was instantiated in PCCU32. The value displayed in this field represents the variable that caused the alarm. The value is based on the input register in reference to the threshold that was assigned in PCCU32. This field displays whether the alarm is Active or Inactive. This parameter's field represents a number that is then incremented for each additional alarm logged. Events Overview The Events section enables the user to view events that have occurred within the selected device. Page rev. AA
49 The information displayed includes: App Name Date/Time Description Old Value New Value Seq Nr This describes the application that caused the event. Date and time of the event. Provides a description of the event. This is the value or condition prior to the event change. For AP or DP check, the actual reading (manually entered by the technician) when a test pressure is applied. Value or condition entered by the technician. For AP or DP check, the test pressure applied on the transducer. -1 or n/a if not available; otherwise, the number sequence from the oldest to the newest event. PID Control Overview The PID Control is a calculation-driven application that involves three (3) parameters: the Proportional, the Integral and the Derivative. These three parameters combine to form the PID calculation. The proportional value determines the reaction to the current error. The integral value determines the reaction based on the sum of recent errors. The derivative determines the reaction based on the rate at which the error has been changing. The weighted sum of these three actions is used to adjust the process via a control element such as the position of a control valve or the power supply of a heating element. By tuning these three constants in the PID algorithm, the controller can provide control actions designed for specific process requirements. The response of the controller can be described in terms of the responsiveness of the controller to an error, the degree to which the controller overshoots the set point and the degree of system oscillation. NOTE: The use of the PID algorithm for control does not guarantee optimal control of the system or system stability. Some applications may require using only one or two of the parameters to provide the appropriate system control. This is achieved by setting the gain of the undesired control outputs to zero. A PID controller is called a PI, PD, P or I controller in the absence of the respective control actions. PI controllers are particularly common, since derivative actions are very sensitive to measurement noise. Additionally, the absence of an integral value may prevent the system from reaching its target value due to a control action. The TWI system is designed to enable users to affect certain parameters that work in conjunction with the PID Control application. In order to access this screen from the Facility screen, click the right arrow on the far right of the display of all application box icons. Select the first icon from the left (PID Control) rev. AA Page 49
 must be built in the Trend application's Trend File Editor including file naming and including all selected variables to trend with their App/Array/Registers.")
50 In this control application, there is no inherent capability to trend from its webpage. The association of this app and its trended file(s) must be done in PCCU32. These file(s) must be built in the Trend application's Trend File Editor including file naming and including all selected variables to trend with their App/Array/Registers. The user can then associate the trend file built and named with the control app by going under the app's Setup tab and assigning it the same trend file name. Thus from the webpage it uses the same name to call up the correct file from the Trend System application and display as required the data in graph or grid format. The choice is available to the user in what format to view the data. The user has the choice to display data in Real Time or Historical mode. If electing to display in Historical mode, the following variables must be included: 1 Primary-PV 2 Units [Optional] 3 Primary-SetPoint 4 Primary-DeadBand 5 Override-PV 6 Units [Optional] 7 Override-SetPoint 8 Override-DeadBand 9 Primary-Override-Flag Page rev. AA
51 The PID Control screen has two main sections: the Controller and Setup sections. Both of these sections are discussed in detail below. Controller Primary Parameter Description Setpoint This field enables the user to enter a setpoint value for the process variable. Creates a "band" above and below the setpoint. A value of 5 will create a band that is 2.5 units above and 2.5 units below the setpoint. As long as the process Deadband variable is within this deadband, typically no PID controller output changes are made. However if the Deadband Factor specified on the Advanced tab is used, the controller will continue to exercise control even within the deadband. Displays the Output value. This value is the signal controlling the controlled Output Value process. Control / Mode Parameter Control Mode Description Select either Manual or Auto. In Manual mode, the user can set the PID output manually, using the Output scale slider. To achieve a smooth transfer between Auto and Manual mode, the setpoint is equal to the measured value (PV). The error (SP - m) would be zero. As such, there would be no interruption. Displays the parameter value that is being controlled. The process value (e.g., flow rate) is controlled by opening and closing a valve. Override Parameter Description The Deadband creates a "window" in which the PID Controller maintains the system output. Generally, as long as the process variable is within this deadband window, no corrective measures are undertaken by the PID Controller. However, if Setpoint the deadband factor is initiated, the Controller will continue to exercise control over the process variable while in the deadband window. The deadband defaults to 0 and the deadband gain defaults to 1. These default values are equivalent to not having a deadband. Setting the Deadband Factor to a value of 0.0 is the same as not changing the output while operating inside of the deadband. Use a value of 0 and 1 to reduce the change effect but still limit valve changes. Setting this factor to a valve greater Deadband than 1 will increase the total gain and make output response larger than normal (high gain preset action). This factor only affects the controller output when the process variable is within the user specified deadband. This read-only field details the Output Value. This value is the signal controlling the Output Value controlled process rev. AA Page 51
52 Advanced Loop Interval Minimum Control Time This variable represents the frequency at which the PID controller calculates an output. Although this parameter can be changed, it is highly recommended that the default value of 1 second be used. Changing the Loop Interval affects the Proportional, Integral, Derivative and Primary/Override Derivative Filter parameters. It also affects the Primary/Override Output Scale Factor when using digital control. This parameter represents the minimum amount of time that one of the PID controllers (Primary/Override) will have exclusive rights to the output value. The time is restarted each time that the output switches selection. No output switches can take place until the timer expires. The default and recommended time is 1 second. Controller Reset Mode Defines the operating mode that will be entered after a power fail/restart, cold start or warm start of the PID controller. Auto - Controllers will resume control after reset. Manual - Controllers are placed in manual mode and no changes are made to the controller output after reset. Setup The Setup section enables the user to establish additional parameters for the PID Controller. The Setup section is divided into Primary and Override. The parameters within these sections will only affect those components. Primary Parameter Description The Primary Process Variable displays the parameter value that is being Primary PV controlled. The process variable, (e.g. flow rate) is controlled by opening and closing a valve. The value is stored in App/Array/Register Primary PV These units are expressed in MCF/Day Units Setpoint Low Limit Enter a low limit value for the setpoint range of the Override PID Controller. Setpoint High Limit Ramp Rate Enter a high limit value for the setpoint range of the Override PID Controller. Enter the setpoint ramp rate which limits the amount the Override PID Controller can ramp the setpoint from one value to the next. Derivative Filter Deadband Factor The Derivative Filter is used to filter out noise within the process variable. This allows for better derivative control and reduces the effects of system noise. The default for this value is set to 1.0. This user-defined field is the gain factor to be used within the deadband of the controller. A value of 1.0 is equivalent to not having a deadband. Setting the value to 0.0 is equivalent to turning the feature off. A value between 0 and 1 reduces the overall gain and limits process (i.e., valve) changes. Setting this to Page rev. AA
53 a factor greater than 1 increases the total gain and output response. This factor only effects the controller output when the process variable is within the user-specified deadband. Proportional, sometimes referred to as Gain, makes a change to the output that is proportional to the current error value. The larger the error signal (PV - Proportional SP) the larger the correction that will be made to the manipulated variable. Large gains can cause a system to become unstable. Low gains can cause the system to respond too slowly to system disturbances. Integral Derivative Scale Factor The Integral (Reset) accumulates the instantaneous error value over a defined period of time and provides correction based on this accumulated error. The amount of correction is based on the Integral value. When used in conjunction with the Gain factor, the Integral value helps to drive toward the set point, eliminating steady-state error. Since the Integral value is based on past error values, it can cause overshoot of the preset value. The rate of change error signal is the basis of the Derivative (Rate) factor. The Derivative factor tends to slow the rate of change of the process variable. The behavior tends to reduce the possibility of overshoot, due to the Integral factor. Enter the setpoint ramp rate which limits the amount the Override Controller can ramp the setpoint from one value to the next. A positive value of Scale Factor results in "direct" action. A negative value results in "reverse" action. Override Parameter Description Override PV Override PV Units Setpoint Low Limit Setpoint High Limit Ramp Rate Derivative Filter Deadband Factor Override Threshold Enter the register used for the Override Process Variable used by the Override PID Controller. Enter the engineering units for the Override Process Variable. Enter a low limit value for the setpoint range of the Override PID Controller. Enter a high limit value for the setpoint range of the Override PID Controller. Enter the setpoint ramp rate which limits the amount the Override PID Controller can ramp the setpoint from one value to the next. The Derivative Filter is used to filter out noise within the process variable. This allows for better derivative control and reduces the effects of system noise. The default for this value is set to 1.0. This user-defined field is the gain factor to be used within the deadband of the controller. A value of 1.0 is equivalent to not having a deadband. Setting the value to 0.0 is equivalent to not having gain control within the deadband. A value between 0 and 1 reduces the overall gain and limits process (i.e., valve) changes. Setting this to a factor greater than 1 increases the total gain and output response. This factor only effects the controller output when the process variable is within the user-specified deadband. Override Threshold is an override setpoint adjustment that allows for early detection of the output select. Also, this setting allows the Override PID Controller to stay in control longer before switching back to the Primary PID control. This parameter is only used during Override Control of the Primary PID rev. AA Page 53
54 Type The user has two selections that can be made: High - After both PIDs have calculated the next value and presented that value to the selector, the selector will pass the higher value to the X-out and the process being controlled (i.e., a valve). Low - After both PIDs have calculated their next value and presented that value to the selector, the selector will pass the lower value to the X-out and the process being controlled (i.e., a valve). Proportional, sometimes referred to as Gain, makes a change to the output that is proportional to the current error value. The larger the error signal (PV - Proportional SP) the larger the correction that will be made to the manipulated variable. Large gains can cause a system to become unstable. Low gains can cause the system to respond too slowly to system disturbances. Integral Derivative Scale Factor The Integral (Reset) accumulates the instantaneous error value over a defined period of time and provides correction based on this accumulated error. The amount of correction is based on the Integral value. When used in conjunction with the Gain factor, the Integral value helps to drive toward the set point, eliminating steady-state error. Since the Integral value is based on past error values, it can cause overshoot of the preset value. The rate of change error signal is the basis of the Derivative (Rate) factor. The Derivative factor tends to slow the rate of change of the process variable. The behavior tends to reduce the possibility of overshoot, due to the Integral factor. Enter the setpoint ramp rate which limits the amount the Override Controller can ramp the setpoint from one value to the next. A positive value of Scale Factor results in "direct" action. A negative value results in "reverse" action. Valve Control Overview Valve Control is an application-specific, input/output feature offered by ABB Totalflow for use in the ABB Totalflow-line of flow computers. The Valve Control application provides automatic feedback control of differential pressure (DP), static pressure (SP) and flow rate. This serves the purpose of the user being able to position a flow valve to maintain a preferred value of DP, SP or flow rate. The TWI system is designed to enable users to affect certain parameters that work in conjunction with the Valve Control application. Page rev. AA

55 Valve Control Overview In regards to the Valve Control, it can be helpful to look at the entire Valve Control cycle in order to receive a well-rounded idea of what occurs. Once this is established, the user can better understand how the overall system works and how the Valve Control application works in conjunction with the system components to create a seamless control system. The cycle starts with a look at the overall process plant. A process plant can contain a variety of different control loops that are all associated with one another. These control loops then work in conjunction with one another to create a product that is offered for sale. Since the sale of the product often relies on its DP Plots the Differential Pressure (InH2O) Associated PCCU Register: VC.2.19 DP - Set Point DP - Deadband SP SP - Set Point SP - Dead Band Flow Rate Flow Rate - Setpoint Plots the exact point at which the Differential Pressure is to maintained by the controller Associated PCCU Register: VC.2.10 (InH2O) Specifies a range around the DP SetPoint Associated PCCU Register: VC.2.11 within which the controller will take no action. Plots the raw line (static or absolute) pressure Associated PCCU Register: VC.2.18 values (PSIA). Plots the exact point at which the static/absolute pressure is to be maintained by Associated PCCU Register: VC.2.3 the controller (PSIA) Specifies a range around the SP SetPoint Associated PCCU Register: VC.2.4 within which the controller will take no action. Plots the single point for each cycle (if an Associated PCCU Register: VC.2.33 arrival has occurred) in minutes. (MCF/Day). Plots the exact point at which the FlowRate is Associated PCCU Register: VC.2.14 to be maintained by the controller (MCF/Day) rev. AA Page 55
56 Flow Rate - Dead Band Specifies a range around the FlowRate SetPoint within which the controller will take no Associated PCCU Register: VC.2.15 action. NOTE: It should be noted that, while the help files use the term "actuator", this component can go by many different names to include "stepper motor" or "digitally controlled pressure regulator". Navigation The Valve Control window is laid out in a similar fashion to other windows found within the TWI. Upon first entering the Valve Control screen, the user is within the Mode tab. There are two other tabs that are available: Controller and Setup. Clicking on any of the available tabs takes the user to that particular area. Within each of the tabs resides certain parameter fields that the user can manipulate based on their specific needs. When the user hovers their cursor over a particular field and a Pencil icon displays, this signifies that this is a field that can be changed. If there is no Pencil icon displayed, this represents a read-only field. If the user wishes to save time instead of searching for those fields that can or cannot be edited, they can click the Edit All button. This opens a dialog box that has all of the fields that the user can affect. The following details the individual tabs that the user encounters within the Valve Control screen and the various parameters that are contained within each. Click on the preferred link below to view the information regarding that particular tab or item. Overview Upon first entering the Valve Control window, the user will see the Overview section. The Overview section is comprised of three graphs that represent the reading for differential pressure (DP), static pressure (SP) and flow rate. Using the vertical scroll bar, the user can look at the graphical representations of each of these components. There is a highlighted horizontal line in each of the graphs. This represents the Deadband for the corresponding Setpoint (SP). Additionally, the user can hover their cursor over any portion of the graph line to see a popup indicator giving the date/time and reading for the particular point that was selected. The user can also hover their cursor over the Deadband line to see the established date/time and setting for the Deadband. The user is also given an option to view the information for DP, SP or flow rate in a table format. The user can click on the Table button to initiate this view; otherwise, the default view remains as a graphical format. The choice is available to the user in what format to view the data. One can choose to display in Graph or Grid with Graph being the default. The user also has the choice to display data in Real Time or Historical mode. If electing to display in Historical mode, the following variables must be included: 1 DP 2 Units [Optional] 3 DP- SetPoint 4 DP- DeadBand 5 SP 6 Units [Optional] 7 SP- SetPoint Page rev. AA
![8 SP- DeadBand 9 Flow Rate 10 Units [Optional] 11 Flow Rate - SetPoint 12 Flow Rate - DeadBand Mode Tab The Mode tab is the area within the Totalflow Web UI system that enables the user to establish](/docs-images/79/79864909/images/57-0.jpg "parameters that affect the overall control mode of the Valve Control system.")
57 8 SP- DeadBand 9 Flow Rate 10 Units [Optional] 11 Flow Rate - SetPoint 12 Flow Rate - DeadBand Mode Tab The Mode tab is the area within the Totalflow Web UI system that enables the user to establish parameters that affect the overall control mode of the Valve Control system. Additionally, the Mode tab also includes a Current Alarms section that allows the user to view any alarms that might be occurring within the system. All of the available parameters are displayed in a column format. When the user hovers their cursor over a particular parameter field and a Pencil icon displays, this signifies that this is a field that can be changed. If there is no Pencil icon displayed, this represents a read-only field. If the user wishes to rev. AA Page 57

58 save time instead of searching for those fields that can or cannot be edited, they can click the Edit All button. This opens a dialog box that has all of the fields that the user can affect. If the user elects to change singular parameters and clicks the Pencil icon, a parameter dialog box displays. Within that dialog box, the user can change the parameter to a preferred value. Upon completion, click the Save button to initiate the change. The following will detail the parameter fields that the user can expect to encounter within the Mode tab: Control Mode The Control Mode parameter field enables the user to establish the control mode that is to be monitored by the process variable. The modes available to the user are as follows: None - No control. Page rev. AA
59 DP - When selected, this signifies that the controller is turned on and the automatic feedback control action is in progress and controlling on the DP set point. SP - When selected, this signifies that the controller is turned on and the automatic feedback control action is in progress and controlling on the SP set point. Flow Rate - Flow rate means that the controller is turned on and the automatic feedback control action is in progress and is controlling on the flow rate set point. Shut-In Left (mins.) Ctl Output (msecs) The Shut-In Left parameter field displays the amount of time (in minutes) that is left due to a shut-in condition. Once the timer is activated by a DP Low Shut-In condition, the display shows the time remaining before a restart command is issued. This read-only field displays the controller output (in milliseconds - digital mode only). Controller Tab As discussed earlier, the controller component is responsible for taking the information regarding the process variable and then making adjustments to the system to return the process variable to where it needs to be, following a disturbance. The Valve Control, in turn, is used to control conditions such as SP, DP or flow rate by partially opening or closing in response to the signals received from the Controller tab. It is within the Controller tab that the user establishes the signal parameters that enable the Valve Control to function properly. All of the available parameters are displayed in a column format. A vertical navigation bar enables the user to quickly move up or down the column to locate the parameter field that they happen to be looking for. When the user hovers their cursor over a particular parameter field and a Pencil icon displays, this signifies that this is a field that can be changed. If there is no Pencil icon displayed, this represents a read-only field. If the user wishes to save time instead of searching for those fields that can or cannot be edited, they can click the Edit All button. This opens a dialog box that has all of the fields that the user can affect. If the user elects to change singular parameters and clicks the Pencil icon, a parameter dialog box displays. Within that dialog box, the user can change the parameter to a preferred value. Upon completion, click the Save button to initiate the change rev. AA Page 59
, the parameter fields are the same, regardless of which Control method is selected.")
60 The following will detail the parameter fields that the user can expect to encounter within the Controller tab. Depending on what the user elects to use as the Control method (DP, SP or Flow Rate), the parameter fields are the same, regardless of which Control method is selected. Set Point High Limit Low Limit Dead Band The Set Point represents the value at which the process variable is to be maintained by the controller. The Set Point has the same engineering units as the process variable. The High Limit represents the process variable's upper limit for control. This is the highest value at which the process variable can be controlled. The High Limit has the same engineering units as the process variable. The Low Limit represents the process variable's lower limit for control. This is the lowest value at which the process variable can be controlled. The Low Limit has the same engineering units as the process variable. The Dead Band specifies the range around the set point within which the controller will take no action. The Dead Band has the same engineering units as the process variable. For example, if the set point is 50 and the dead band is set to 5, the controller will take no action when the process variable is between 45 and Page rev. AA
.")
61 55. The dead band is important for maintaining the integrity of the system's battery capacity. The Gain is the maximum allowable controller output for any one control action. As a general rule, use 1/2 the control valve's travel time from a full Gain open to a full closed state. Gain has the same engineering units in milliseconds (digital mode). Setup Tab The Setup tab is the area where the user can establish parameters that affect the Valve Control. All of the available parameters are displayed in a column format. A vertical navigation bar enables the user to quickly move up or down the column to locate the parameter field that they happen to be looking for. When the user hovers their cursor over a particular parameter field and a Pencil icon displays, this signifies that this is a field that can be changed. If there is no Pencil icon displayed, this represents a read-only field. If the user wishes to save time instead of searching for those fields that can or cannot be edited, they can click the Edit All button. This opens a dialog box that has all of the fields that the user can affect. If the user elects to change singular parameters and clicks the Pencil icon, a parameter dialog box displays. Within that dialog box, the user can change the parameter to a preferred value. Upon completion, click the Save button to initiate the change. The following will detail the parameter fields that the user can expect to encounter within the Setup tab: Control Mode Select the appropriate Contol Mode from the drop down list. None - No Control. DP - Controller is turned on, automatic feedback control action is in progress controlling the DP setpoint. SP - Controller is turned on, automatic feedback control action is in progress controlling the SP setpoint. Flowrate - Controller is turned on, automatic feedback control action is in progress controlling the Flowrate setpoint rev. AA Page 61
62 Nominations - Controller is turned on, automatic feedback control action is in progress controlling the Flowrate setpoint. If set to Enable High the SP controller will override when the pressure SP Override exceeds this value. If set to Enable Low the SP controller will override when the pressure drops below this value. Shut-in Left Displays the amount of time left due to a shut in condition. Shut-in Override Checks for DP and SP override shutin. Selects the Timer Override option. Acts as an on/off timer using the Timer Override Open/Close times on the Parameters screen. Can be overridden by other Override conditions. Control Method Displays the current Control Method. None - No control method in progress. Direct - DP, SP or Flow Rate. Nominations - Nominations. Valve Location External Event Mode SP Override Limit (psia) SP Restart Limit DP Shut-In Step Time (msec) Control Output The Valve Location parameter field enables the user to establish the location of the valve, in relation to the flow computer. The options available are either Upstream or Downstream. The External Event Mode parameter field is designed to give the user the ability to select the externally applied signal that causes the valve to either Fail Closed or Restart Controller. These occur within a Fail Closed Shut-In condition. Within this parameter field, the user can set the pressure value that causes the SP controller to move into an override state. This field works in conjunction with the SP Override field located in the Mode tab. Based on what the user has selected (High/Low) within the Mode tab, the SP Override Limit value moves into the override state if the pressure value is either exceeded or drops below the established value. Expressed as SPRST value, when the Static Pressure falls below this value, the selected process variable's output will be used and the controller is restarted. The DP Shut-in parameter field allows the user to select the method used to generate a restart command if the controller is in a Fail Closed Shut-In condition. If the user selects Reactive on SP High, this enables a restart command to occur when the SP reaches a high limit, timer or external event. The Step Time represents a period, in milliseconds, used when a Step Open or Step Closed command is processed. This period is also used when a valve is initially opened from a full closed position. The default value is set to zero (0.00). the range is milliseconds (digital mode). This parameter field represents the controller output value. The Open Time/Open Time Remaining parameter fields represent the setup parameters for the timer function. These parameters are observed when the Open Time Timer Controller mode is activated. The valve opens or closes, as (Min.)/Open determined by the associated times. During the open time, the active Time Remaining controller is determining the valve position. During the close time, the valve is closed until either the close timer has elapsed or the controller is turned off. The Valve Action parameter field allows the user to either set the valve Valve Action action to Direct or Reverse. If Reverse is selected, the valve is driven in the opposite direction than what would be encountered had the user selected Page rev. AA
63 Analog Valve Enable DP Shut-In Period DP Low Time Shut-In Timer Unit Low Battery Valve Action Battery Low Limit (Volts) Pipe ID (in.) Pipe Length (ft.) Close Time Close Time Remaining Analog Valve Delay Analog Valve Integrator Direct. For example, if the valve is set to Direct, the valve is opening. It would then be closing in Reverse mode. Within the Analog Valve Enable parameter field, if the user is driving the valve actuator using an analog output, they would need to set the field to Enable; otherwise, leave the parameter field at Disabled. The DP Shut-In Period parameter field enables the user to establish a timer setting that is used with the DP Low Shut-In mode. This can be set from 0 to 255 minutes or hours. The time units that the user prefers (in hours) are selected in the Shut-In Timer Unit parameter. This field represents the duration, in minutes, used by the controller logic to determine if a DP Shut-In condition exists. If the DP is below the established low limit for the time specified, the DP Shut-In condition exists, and the valve is ramped closed. The controller checks for the condition when in Auto/Shut- In mode. The default is set to zero (0) minutes. The range is minutes. The Shut-In Timer Unit parameter field enables the user to program the shut-in units to either hours or minutes. This is used to determine the amount of time to leave the controller off after a shut-in due to low DP. This parameter field allows the user to determine the valve action after a low battery value is reached. There are two (2) available options that the user can select. Close forces the valve closed. Freeze holds the valve in the last position. The Battery Low Limit parameter field is a user-configurable field that represents the low voltage threshold used by the controller's logic to detect a Low Battery condition. The Pipe ID parameter field represents the internal diameter, in inches, of the pipe run between the wellhead and the metering point. The Pipe Length parameter field represents the distance, in feet, between the wellhead and the metering point. Close Time is observed by the controller when the Timer Controller mode is activated. The Close Time Remaining represents the amount of Close Time remaining. Close Time is observed by the controller when the Timer Controller mode is activated. The valve opens or closes and is determined by the valve position. The Analog Valve Delay parameter field represents a value, in milliseconds, that specifies a delay between the time a valve output action is completed and the time that the control algorithm is allowed to run again. This delay is required to ensure that the control algorithm has updated input data as a result of its last output action. The delay is defaulted to a value specified by the device's configuration files. Under no circumstances should the value be below 1000 milliseconds (1 second). This is due to the fact that there is no advantage for the value to be any smaller. Additionally, it is feasible that, if there is little or no delay, the outputs on the TFIO Valve Control module could be damaged. This scenario would happen if the Valve control motor is still coasting to a stop from the previous control output and the next output action drove it in the opposite direction. This causes a spike in the current. The Process Variable updates once per second within G3 and G4 devices. The Analog Valve Integrator represents the value that is either added to or subtracted from the 4-20 ma range to ensure that it moves closer to the established Set Point rev. AA Page 63

64 Pulse Accumulator Overview The Pulse Accumulator application is designed to count pulses and then return an instantaneous volume calculation, based on the number of pulses that were accumulated. Within the TWI, the user can view these pulse counts along with the calculated volume. Additionally, the user can also establish the K-Factor, Pulse Window and Contract Hour. Navigation The Pulse Accumulator window is laid out in a similar fashion to other windows found within the TWI. Upon first entering the Pulse Accumulator screen, the user is can see the Current Values section and the Configure section. The Configure section contains parameter fields that the user can manipulate based on their specific needs. When the user hovers their cursor over a particular field and a Pencil icon displays, this signifies that this is a field that can be changed. If there is no Pencil icon displayed, this represents a read-only field. If the user wishes to save time instead of searching for those fields that can or cannot be edited, they can click the Edit All button. This opens a dialog box that has all of the fields that the user can affect. The following details the individual sections that the user encounters within the Pulse Accumulator screen and the various parameters that are contained within each section. Click on the preferred link below to view the information regarding that particular section. Current Values Section The Current Values section displays the pulse accumulator values that pertain to specific parameters. The values displayed are read-only. The values are displayed in column format. Page rev. AA
 second.")
65 The values that the user can view are as follows: Last Second Pulse Count Last Second Calculated Volume Current Rate/Hour Current Rate/Day Current Contract Day Volume Current Long Term Accumulated Volume This parameter field displays the accumulated pulse count that was amassed over the last one (1) second. This field displays the volume (pulses x K-Factor) that was accumulated over the last second. The Current Rate/Hour parameter field displays the calculated rate per hour and uses the previous window period (previous window value x 3600/seconds of Pulse window). This field displays the calculated rate per day and uses the previous window period (previous window value x 86400/seconds of Pulse window). This parameter field displays the current volume accumulated since the start of the contract day. This field displays the accumulated volume since the last accumulator reset. Previous Contract Day Volume The Previous Contract Day Volume parameter field displays the updated information from the Current Contract Day Volume parameter field when the contract day ends or when the Reset All Accumulators is initiated. Previous Long Term Accumulated Volume This field displays the updated information from the Current Long Term Accumulated Volume parameter field at the time of the last Reset Long Term Accumulator, Reset All Accumulators or an accumulator rollover was initiated rev. AA Page 65
66 Configure Section The Configure section within the Pulse Accumulator tab enables the user to establish certain parameters that directly affect the Pulse Accumulator application. All of the available parameters are displayed in a column format. When the user hovers their cursor over a particular parameter field and a Pencil icon displays, this signifies that this is a field that can be changed. If there is no Pencil icon displayed, this represents a read-only field. If the user wishes to save time instead of searching for those fields that can or cannot be edited, they can click the Edit All button. This opens a dialog box that has all of the fields that the user can affect. If the user elects to change singular parameters and clicks the Pencil icon, a parameter dialog box displays. Within that dialog box, the user can change the parameter to a preferred value. Upon completion, click the Save button to initiate the change. These parameters are as follows: K-Factor (Vol/Pulse) The K-Factor is a correction factor for pulse meters. It helps to determine the value of the pulse, based on the turbine that the user happens to be utilizing. Please see the manufacturing specifications to determine the K- Factor. Upon determination, place the number in the corresponding parameter field. The K-Factor for the Totalflow Web UI component measures the volume per pulse. Each second, the accumulated pulses are multiplied by the K-Factor to produce a scaled value. Pulse Window (Secs) The Pulse Window parameter field enables the user to establish the amount of time (in seconds) in which to count pulses before applying the K- Factor. The accumulated value (pulses per second multiplied by the K- Factor) is then totaled and displayed for the user. Contract Hour Reset Long Term Accumulator This parameter field enables the user to enter in the Contract Hour in military time (0-23). The Contract Hour represents the start of the day for daily volumes. When selected by the user, this updates the Previous Long Term Accumulators from the Current Long Term Accumulators and zeroes out the Current Long Term Accumulators. Page rev. AA
67 Reset All Accumulators When selected by the user, this resets all accumulators. All previous values are updated from associated current values. Additionally, all times are updated to the new reset time. Plunger Lift Overview The Plunger Lift application works in a manner similar to a pneumatic piston, wherein it is caused by gravity to fall to the bottom of the well. Acting as a seal between the liquid and the gas, the plunger settles to the bottom of the production tubing and allows liquid to accumulate above it. This accumulation of liquid restricts the flow of gas and slows it down. The production valve is closed to allow down-hole pressure to build in the casing. After the pressure has built up, the production valve is opened and the casing pressure lifts the plunger and accumulated liquids to the surface. At the surface, separators remove the liquids from the gas. Once the flowing gas drops, it becomes necessary to choose a time or method of closing the production valve. Once closed, the plunger drops to the bottom of the production tube. With the plunger deployed and the well shut-in, the downhole pressure builds, causing the cycle to repeat. Read-only fields display values for Casing/Tubing/Line pressures, Flow Rate and Yesterday's/Today's volumes. The TWI system is designed to enable users to affect certain parameters that work in conjunction with the Plunger Lift application. Navigation The Plunger Lift window is laid out in a similar fashion to other windows found within the TWI. Upon first entering the Plunger Lift screen, the user is within the Trend tab. There are five other tabs that are available: Trend, Setup, Closed, Open and Statistics. Clicking on any of the available tabs takes rev. AA Page 67
68 the user to that particular area. Within each of the tabs resides information and/or certain parameter fields that the user can manipulate, based on their specific needs. When the user hovers their cursor over a particular field and a Pencil icon displays, this signifies that this is a field that can be changed. If there is no Pencil icon displayed, this represents a read-only field. If the user wishes to save time instead of searching for those fields that can or cannot be edited, they can click the Edit All button. This opens a dialog box that has all of the fields that the user can affect. The following details the individual tabs that the user encounters within the Plunger Lift screen and the various parameters that are contained within each. Click on the preferred link below to view the information regarding that particular tab or item. Overview Casing Plots the raw casing pressure values (PSIA). Associated PCCU Register (5.5) Tubing Plots the raw tubing pressure value. Associated PCCU Register (5.6) Line Pressure Plots the raw line (static) pressure values (PSIA). Associated PCCU Register (5.7) Flow Rate Plots the single point for each cycle (if an arrival has occurred) in minutes (SCF/Hr). Associated PCCU Register (5.8) Yesterday's Displays yesterday s contract day volume. Volume Today's Volume Displays the Volume from the start of the Contract Day. Shutdown Status Displays as either OK or in Shutdown. Fail Reason Value Fail Reason Date Timer Max Timer The top row displays the current state of the controller in the Description column followed by the current timer time for the current state followed by the time limit for the current state. Controller states: Fail Indicates that plunger has failed to arrive. Closing Valve Indicates that the production valve is closing, and the system is waiting for the plunger fall delay to expire. Valve Closed Indicates the plunger fall delay has expired, and the system is waiting for an open valve condition to be initiated. Plunger Arriving Indicates that the production valve has opened, and the system is waiting for the plunger to arrive. Blow Valve Indicates that the plunger has not yet arrived, blow valve conditions have been met and a secondary valve has been opened. Plunger Arrived This is an instantaneous state that indicates that the plunger has arrived. AfterFlow Indicates that the production valve is open, the plunger has arrived, gas is flowing and close conditions are waiting to be met. Provides the date/time of the last Fail Reason. Displays the elapsed time since the valve was last commanded open and the plunger arriving. Displays the maximum amount of time to wait for the plunger to arrive. Page rev. AA
69 Trend In this control application, there is no inherent capability to trend from its webpage. The association of this app and its trended file(s) must be done in PCCU32. These file(s) must be built in the Trend application's Trend File Editor including file naming and including all selected variables to trend with their App/Array/Registers. The user can then associate the trend file built and named with the control app by going under the app's Setup tab and assigning it the same trend file name. Thus from the webpage it uses the same name to call up the correct file from the Trend System application and display as required the data in graph or grid format. The Trend tab gives the user a graphical representation of the measurements and trends for the valve. The user may select the Poll Type button to display either Historical or Real Time data. One may also use the View button to select either the Grid or Graph view. The user may click on any of the check marks to the left of the variables along the bottom of the view to either display or hide the individual variable(s). The user also may use a mouse rollover on any of the displayed trends (must be in Graph view and polling Historical Data) to show the individual reading for selected times. Finally the display itself may be collapsed or expanded by selecting the corresponding button function in the upper right corner of the screen. If electing to display in Historical mode, the following variables must be included: 1 Casing 2 Units [Optional] 3 Tubing 4 Units [Optional] 5 Line 6 Units [Optional] 7 Flow Rate 8 Units [Optional] The individual parameters can be displayed with or without measurement scales. To add the scales to the background, the Scales icon to the lower right of the parameter legend would need to be selected. Selecting it again would hide the scales. Setup General Common Setup Plunger Control Allows for the plunger control types to be set. The types are as follows: Off This control type prevents the logic from running. Resets the controller. Manual This setting allows for the manual operation of both the production and blow valves. Additionally, it also allows for the input valves to be read. On This control type initializes the logic from Startup mode and begins operation rev. AA Page 69
70 Cycle Start Trend File Name Within this field the user can add time to off-time (shut-in period) to ensure the Plunger Lift runs according to the time cycles. Enter a name here and setup a trend file in the Trend System application. Using the same name will allow the web user interface to display the trend information when viewing the Plunger application information. Tuning Optimization Plunger Fail Tune Enables and disables the continuous adjustment of all setpoints. Options are either Disabled or Enabled. If Optimization has not been enabled, it will be the sole option under Tuning. Once optimized, the Plunger Fail Tune option will display. If Optimization is de-selected, the Plunger Fail Tune option will disappear. If a plunger happens to fail, this field allows the user to set this factor which is then consequently multiplied against the next tuning. Reset OptionsStartup Mode Safety Reset Mode Select the startup state after a controller reset. 1 Closing Valve - Startup in the Closing Valve state (State 1). 6 AfterFlow - Startup in the AfterFlow state (State 6). Previous State - Startup in the state at the time of the reset occurred. In this field if the plunger is disabled by the safety system or disabled due to max arrivals allowed being exceeded. This control is used to reset plunger controls. Well Geometry Tubing Length Tubing Inner Diameter Fluid Gradient Log Size Event Log Size This is a user configurable field that enables the establishment of the length of the tubing from the stop to the arrival sensor. This is subsequently used to calculate the lift velocity. This is a user configurable field that establishes the inner diameter of the well tubing. This is then used to calculate the Turner Flow Rate. Within this user-defined field the user can set the constant that is utilized to calculate slug size. This is a user configurable field that establishes the number of cycle, blow and fail logs that are kept. Enter the number of event logs for the system to keep. Valve On/Off Control Valve Position User-defined as Upstream or Downstream depending on direction in relation to the valve. Page rev. AA
71 Valve Time Limit This is the amount of time to manually energize the open and close DOs to either open or close the production, blow and capture valves. This is not to be confused with valve control. Enter time in seconds. Main Valve Setup Valve Type Open DO Close DO Valve Fail State Manual Valve Open Now Manual Valve Close Now Select the type of valve used for the production valve. Latch-One output - Only one digital output is used to both open and close the valve. Latch signifies that the DO remains closed when energized until told to open. Latch-Two output - Two digital outputs are used, one to open the valve and one to close the valve. Latch signifies that the DOs remain closed when energized until told to open. Pulse-Two output - Two digital outputs are used, one to open the valve and one to close the valve. Pulse signifies that the DO is only energized for a short duration as specified by the "Valve Time Limit" above. User-defined with the app/array/register for Open DO. User-defined with the app/array/register for Close DO. User-defined as None, Close, or Open. Select either Auto or Force Open. Select either Auto or Force Close. Blow Valve Setup BV Type Specify the number and type of outputs that are used by the blow valve. The selected options are set to Pulse-Two Output, Latch-One Output or Latch- Two Output. Capture Valve Setup Capture Valve Type This is simply an Enable or Disable function with no setup required other than if you have a Capture Valve, it needs to be set up in Valve Setup under the Setup tree-view item. When enabled, Catch Mode will put the well in a permanent Closed Hold mode after it completes its flow cycle. If a Capture Valve is used, the plunger is kept captured during this time. When the Plunger Catch Mode is disabled, the plunger is released and normal cycle operation resumes. Userdefined with a selection of Pulse-Two output, Latch-One output, Latch-Two output, or Disable. Valve Control VC Option Decide whether or not to use the valve control during flow cycle (plunger arriving and AfterFlow). Available options are set to Enabled or Disabled. Tube Tube rev. AA Page 71
72 Value Registers Tube App AP Register DP Register Flow Rate Register Volume Accumulator Register Volume Today Register Volume Yesterday Register Tf Register (Temperature) Z Factor Barometer Pressure Register Contract Hour Update Register Setting will auto-set the Tube Register Address Establishes the address of the absolute pressure analog input. Normal = AGA Specifies the address of the differential pressure analog input. Normal = AGA Can set the address of the flow rate. Normal = AGA Can set the address of the accumulated volume. Normal = AGA User-defined with the Volume Today app/array/register. User-defined with the Volume Yesterday app/array/register. Specify the address of the temperature. Normal = AGA Specifies the address of gas compressibility. Normal = AGA Can set the address of the barometer pressure that is used to adjust FCU pressure to PSIG. Normal = AGA Specifies the address of the last contract hour update. Normal = AGA Input Input Value Registers Casing Pressure AI External Pressure AI Can set the address of the casing pressure analog input. Normal = IOS.3.4 (A15). Can set the address of the external pressure analog input. This is then used for either tubing or line pressure depending on the valve location. Hold Pressure Specifies the address of the hold pressure analog input. Open 1 Can set the address of open 1. Open 2 Can set the address of open 2. Close 1 Can set the address of close 1 (in1). Close 2 Can set the address of close 2 (in2). Hold External Can set the address of the hold external. Misc Registers Detection Type Plunger Arrival Pulse Input Restart Button Open Button Close Button Select whether a plunger is used or if the logic acts as an intermitter. The available options are set to either I/O or Intermit. Can set the address of plunger arrival pulse input. Can set the address of the restart plunger digital input. Can set the address for the valve open push button digital input. Can set the address for the valve close push button digital input. Page rev. AA
73 Closed Falling Valve Close Check Enable VC Check Enable the VC Check by selecting the empty box. Otherwise, selecting the checked box will disable the VC Check. Plunger Fall Delay Fall Timer Fall Delay Limit The Fall Timer will display the days/hours/minutes/seconds. Set the Fall Timer display with the days/hours/minutes/seconds. This is the time to wait when closing the valve before going to state 2. Closed Setup Closed Setup Open On Tube Line Case Line Case Tube Load Ratio Foss Gaul Tube Pressure Casing Pressure SP Open1 The primary reason for this screen is to provide optional ways to open the closed production valve using one of the following parameters (to open on): This option uses the tubing-line pressure differential to open the production valve. The User can select the Open on Tube Line box to cause a new tab (Tube-Line) to appear for setting up this option. This option uses the casing-line pressure differential to open the production valve. The User can select the Open on Case Line box to cause a new tab (Case-Line) to appear for setting up this option. This option uses the casing-tubing pressure differential to open the production valve. This option uses the casing-tube pressure differential to open the production valve. The User can select the Open on Case Tube box to cause a new tab (Case-Tube) to appear for setting up this option. This option uses the Load Ratio to open the production valve. The User can select the Open on Load Ratio box to cause a new tab (Load Ratio) to appear for setting up this option. This option uses the Foss Gaul equation to open the production valve. The User can select the Open on Foss Gaul box to cause a new tab (Foss Gaul) to appear for setting up this option. This option uses the tubing pressure to open the production valve. The User can select the Open on Tube Pressure box to cause a new tab (Tube Pressure) to appear for setting up this option. This option uses the casing pressure to open the production valve. The User can select the Open on Casing Pressure box to cause a new tab (Casing Pressure) to appear for setting up this option. This option uses the static pressure to open the production valve. The User can select the Open on SP box to cause a new tab (SP) to appear for setting up this option. This option uses a timer and a register that can be pointed to any variable to open the production valve. The user sets a limit for the variable and the amount of time the rev. AA Page 73
74 value of the variable can be above or below the variable limit. The User can select the Open on Open 1 box to cause a new tab (Open 1) to appear for setting up this option. This option can be used in conjunction with Open 2 and have 2 different sets of criteria to open the valve on whichever criteria is met first. Open2 Close Timer This option uses a timer and a register that can be pointed to any variable to open the production valve. The user sets a limit for the variable and the amount of time the value of the variable can be above or below the variable limit. The User can select the Open on Open 2 box to cause a new tab (Open 2) to appear for setting up this option. This option can be used in conjunction with Open 1 and have 2 different sets of criteria to open the valve on whichever criteria is met first. This option uses a timer to open the production valve. The User can select the Open on Closed Timer box to cause a new tab (Closed Timer) to appear for setting up this option. Plunger Fall Delay Hold Reason Open Reason The Value column displays reasons the plunger is in Hold (valve closed). The Limit column displays the last reason the valve was opened. Closed Hold Closed Hold Hold Plunger Fall Mandatory Recovery This option is basically the same as the Fall Timer used in State 1 (Closing Valve) with the exception that this option is in State 2 (Closed). This option will keep the production valve closed for the Limit time entered even if conditions have been met to open the valve. This option would replace the Fall Timer in State 1 and not be used in conjunction. The User enables this option by selecting the Enable Mandatory Recovery Time box. When enabled, it will run after a plunger non-arrival and keep the well in a closed state to allow the pressure time to recover. The User selects whether to use 1 Cycle, 2 Cycle or 3 Cycle times or Fixed to enter a fixed amount of time. Option of using an amount of time between valve open to valve open to operate the well. Fixed - The user enters a time in the Total Cycle Timer Limit column for the desired total cycle time. The close time is adjusted automatically each cycle to make up the difference between the open time and the total cycle time. Open time can be the result of any option and thus not restricted to a timer. Total Cycle Hold Once Hold External Hold Schedule Hold Pressure Auto - Uses the Flow Timer Close option found under "Open \ Open Setup" for the open time and the Closed Timer option found under "2:Closed \ Closed Setup" for the close time. The limit value of each option is added together to get the Total Cycle Time which will be displayed as the Total Cycle Timer Limit value. Each option has to be enabled of course and a Limit time entered. Option of delaying the well operation once for a single amount of time. Options are 1 Cycle, 2 Cycle, 3 Cycle, or Fixed for a fixed amount of time. Selecting Enable and Send will display the "2:Hold Once" tab for setup. Option to hold the valve closed until enabled by an external input such as a digital input. Selecting the Hold External box will display the "Hold External" tab for setup. Option to hold the valve closed until enabled by a schedule. Selecting the Hold Schedule (Hold on Pad Controller) box will display the "Hold Schedule" tab for setup. The User selects whether to hold when the Hold Value pressure is lower (Hold Low) than the Hold Value Limit or hold when it is higher (Hold High). Page rev. AA
75 Hold Close 1 Hold Close 2 Hold High Line Time of Day Plunger Catch Mode Hold Reason Open Reason This option supports an input called "Close 1" which would typically be a pressure but could be a digital input. The setup options are split into two functions, close the production valve when it's open and hold it closed for some period. The input value is tested to see if it is above or below a specified value and the value must be above or below the specified value for a user specified amount of time. "Close 1" and "Close 2" can both be used at the same time and whichever has its criteria met first will drive or hold the valve. This option supports and input called "Close 2" which would typically be a pressure but could be a digital input. The setup options are split into two functions, close the production valve when its open and hold it closed for some period. The input value is tested to see if it is above or below a specified value and the value must be above or below the specified value for a user specified amount of time. "Close 1" and "Close 2" can both be used at the same time and whichever has its criteria met first will drive or hold the valve. This option uses high line pressure to close the production valve and either keep closed or re-open. Enable/Disable in the Value column. This option allows the user to set up to four different time spans each day to put the well into Hold mode. Enable/Disable in the Value column. The Limit column indicates Yes or No whether in Hold mode or not. This option when enabled will keep the production valve closed until the option is disabled. This typically allows for closing in the well after a plunger catch. The Value column displays reasons the plunger is in Hold (valve closed). The Limit column displays the last reason the valve was opened. Open Open Setup Open Setup Plunger catch mode This is simply an Enable or Disable function with no setup required other than if you have a Capture Valve; it needs to be setup in Valve Setup under the Setup tree-view item. When enabled, Catch Mode will put the well in a permanent Closed Hold mode after it completes its flow cycle. If a Capture Valve is used, the plunger is kept captured during this time. When the Plunger Catch Mode is disabled, the plunger is released and normal cycle operation resumes. Flow Timer Close 1 This is a timer option that allows the well to flow for specified period of time each cycle before closing the production valve. Close 1 Hold option: Value Column - Displays the Close 1 input current value. Limit Column - The Close 1 value must be below/above this Close 1 Limit value for the Close 1 timer Limit time. Time Limit Column - Displays the Hold Close 1 Time Limit. Misc Column - Displays the Close 1 Open Action. This is how Close 1 will release hold rev. AA Page 75
76 Close 2 Blow Cushion Close 1 Hold option: Value Column - Displays the Close 2 input current value. Limit Column - The Close 2 value must be below/above this Close 2 Limit value for the Close 2 timer Limit time. Time Limit Column - Displays the Hold Close 2 Time Limit. Misc Column - Displays the Close 2 Open Action. This is how Close 2 will release hold. Value Column - Displays the Blow Valve Cushion Timer which is the elapsed time since the plunger arrived while in Blow Valve state. Time Limit Column - Displays the Blow Valve Cushion Time Limit which is the time to wait after the plunger arrives while in Blow Valve state. After this time limit, open the production valve and close the blow valve. Waiting Close Valve Enables Flow Timer Close Option of using a timer as the means of closing the production valve. The time begins when the production valve is opened and ends when the Flow Cycle Time Limit Limit time has elapsed. This will include arrival time for the plunger and AfterFlow time which is after the plunger arrives. This option which uses the Close 1 input provides two primary uses. It can be used to hold the production valve closed and/or release it when in the Closed Close 1 state (State 2). It can also be use to Close the production valve when in the Waiting/Arrival (State 3) or AfterFlow (State 6). Close 1 Close Limit Close 2 Close 2 Open Limit Arrival Timer Last Plunger Arrival Non-Arrivals Count Max Non-Arrivals Count Displays the current Close 1 value and the Close Limit value. Value column - Current Close 1 Value. Limit column - Hold closed if Close 1 Value is below/above (Close Action) this Limit for Close 1 Timer Limit. This option which uses the Close 2 input provides two primary uses. It can be used to hold the production valve closed and/or release it when in the Closed state (State 2). It can also be use to Close the production valve when in the Waiting/Arrival (State 3) or AfterFlow (State 6). Displays the current Close 2 value and the Open Limit value. Value column - Current Close 2 Value. - Limit column - Close 2 value must be above/below this Limit value based on Close 2 Action for Close 2 Timer Limit to close valve. The Value column displays the elapsed time since the production valve was commanded open and until the plunger arrives. Then the timer will reset. Displays the time of the last plunger arrival. The value is set in the following format: dd:hh:mm:ss. Displays the elapsed time since the valve was commanded open and the plunger is arriving. Counts the consecutive number of arrival times that were greater than the Max Arrival Time. The value is automatically reset if the plunger arrival time is less than the Max Arrival Time. Page rev. AA
77 Arrival Time Limits Max Arrival Time Slow Arrival Time Fast Arrival Time Min Arrival Time The Value column displays the number of consecutive times the arrival time exceeded the maximum arrival time. The count will reset if the arrival time is less than the maximum time. The Value column displays the number of counts where the arrival time fell below the Slow Arrival Time Limit. The count will reset if an arrival time is greater than the Slow Limit Time. Also, tuning will occur if the plunger arrival is slower than the Slow Arrival Time Limit. The Value column displays the number of counts where the arrival time exceeded the Fast Arrival Time Limit. The count will reset if an arrival time is slower than the Fast Arrival Limit Time. Also, tuning will occur if the plunger arrival is faster than the Fast Arrival Time Limit. The Value column displays the number of consecutive arrival counts where the arrival time fell below the minimum arrival time. The count will reset if the arrival time is greater than the minimum time. High Line High Line Option to use high line pressure as a way to close the production valve and adjust the close time. Arrived Plunger Swab Plunger Swab (Option) Swab Runs Completed Swab Runs Setpoint Swab Now Total Cycles Total Cycles Left Till Maintenance The Swabbing section's Enable first field is optional and user-defined from which the user can enable the use of the plunger to swab. When set to Enable, the plunger will begin tripping on the next cycle, repeating the drop phase on the next arrival. Options are either Yes or No. The Swab Run Count is the read-only field that displays the number of swab runs completed to date. When the user enables the Swabbing option, this user-defined field allows the user to set the number of swab runs that need to be completed. To swab now, select Yes and Send. At the start of or during AfterFlow, the production valve will close immediately and stay closed through its normal close time and then commence swabbing. The number of swabs is as specified in the Limit column for Total Runs. Cycles left until maintenance The Value column will display the total number of cycles ran until the Plunger Counter Reset. When the Total Cycles equals the number specified by the user in the Limit column, the Cycle Status on the Summary screen will display the word Maintenance. Plunger Arrived rev. AA Page 77
78 First Run Count First Run Limit Displays the Value column counts up to the Limit value entered by the user in the Limit column. On each plunger arrival, the count will increment and the production valve will close, not allowing the Plunger application to go into the AfterFlow state. After the Value column count reaches the Limit value, AfterFlow and normal operation commences on the next cycle. The User defines the Limit value by entering it here. On each plunger arrival, the count will increment and the production valve will close, not allowing the Plunger application to go into the AfterFlow state. After the Value column count reaches the Limit value, AfterFlow and normal operation commences on the next cycle. After Flow After Flow Setup After Flow Timer Turner Flow Rate Load Ratio This option uses a timer during After Flow to close the production valve. This option uses the Turner flow rate to close the production valve. This option uses the Load Ratio which must be below a specified value for a specified amount of time to close the production valve. DP This option uses the differential pressure which must be below a specified value for a specified amount of time to close the production valve. Flow Rate This option uses the flow rate which must be below a specified value for a specified amount of time to close the production valve. Casing Rise This option closes the production valve when the Casing Delta Value (current casing pressure average minus previous casing pressure average) is above the user specified Casing Delta Limit at the end of the user specified Casing Rise Timer Limit. Tube Line This option will close the production valve when the tubing pressure minus the line pressure is less than the user specified limit value. Casing Pressure This option uses low casing pressure to close the production valve if it is below a user specified value. SP This option uses the static pressure to close the production valve if is above or below a user specified limit for a specified amount of time. Tubing Pressure This option uses the tubing pressure to close the production valve if is above or below a user specified limit for a specified amount of time. Page rev. AA
79 Casing Slope This option closes the production valve when the Casing Slope value is above the specified Casing Slope Limit at the end of the specified Casing Slope Timer Limit. Case Tube This option will close the production valve when the casing pressure minus the tubing pressure is less than the user specified pressure differential limit. Blow Valve (if Tab Displayed) BV Plunger Arriving BV Plunger Arrival Timer Option Option to use plunger arrival time to open the blow valve. This is not the Blow Valve state (state 4). BV Plunger Arrival Time Limit Enter the time to wait for the plunger arrival before opening the blow valve (not state 4). Flow Rate BV Option Option to use flow rate to open the blow valve. Flow Rate Flow Rate BV Limit Flow Rate BV Low Timer Case BV Option Casing Case BV Open Limit DP BV Option DP DP BV Limit Displays the flow rate as measured by the flow computer. Enter the flow rate limit that will initiate the blow valve opening once the flow rate falls below the entered amount. Displays the elapsed time since the flow rate has been below the Flow Rate Blow Valve Limit. Option to use the casing pressure to open the blow valve. Displays the current casing pressure. Enter a value to open the blow valve when the casing pressure falls below this set amount. Option to use differential pressure to open the blow valve. Displays the current differential pressure. Enter a low limit for the differential pressure which will open the blow valve when the pressure falls below this value. SETUP BLOW VALVE Fail BV State Returns the production valve state from valve control, or the last command sent to the valve when not using valve control rev. AA Page 79
80 BV During Wait for Arrival BV Plunger Arrival Timer Option Option to use plunger arrival time to open the blow valve. Flow Rate BV Option Option to use flow rate to open the blow valve. Case BV Option DP BV Option Option to use casing pressure to open the blow valve. Option to use differential pressure to open the blow valve. Blow Valve BV State Option BV Curtail Option BV Cushion Option Option of enabling the blow valve state when the plunger arrival fails. Option to disable venting of the wells during certain hours of the day. Option of enabling the blow valve cushion timer, plus closes the production valve when in the Blow Valve state (State 4). Blow Valve Statistics (if Tab Displayed) Blow Count Blow Count This screen displays a table of time stamps and cycle times of the blow valve occurrences. Time Stamp Time Stamp Cycle Time Displays the Date/Time of each blow valve occurrence Displays the Cycle Time of each blow valve occurrence Blow Valve Help (if Tab Displayed) Blow Valve Help BLOW VALVE State Displays the last command sent to the blow valve. BV - Plunger Arrival Time BV Plunger Arrival Timer Option Option to open the blow valve when the plunger arrival time is later than normal. BV Plunger Arrival Time Limit Enter a time that is longer than the normal arrival time but not as long as the maximum arrival time which would be considered a failure. If the arrival timer reaches this Limit time before the plunger arrives, the blow valve will open. Page rev. AA
81 BV DP Low DP Blow Valve Option DP DP BV Limit Option to use differential pressure to open the blow valve Displays the current differential pressure. Enter a DP value that would open the blow valve when the differential pressure falls below this value. BV Casing Pressure Low Case Blow Valve Casing Open Limit Option to use casing pressure as a condition to open the blow valve. Displays the current casing pressure. Enter a casing pressure which will open the blow valve when the pressure falls below this set amount. BV Flow Rate Low Time Flow Rate BV Option Option to use flow rate to open the blow valve. Flow Rate Flow Rate BV Limit Low Time Limit Low Timer Displays the current flow rate. Enter a flow rate limit that will initiate the blow valve opening once the flow rate falls below the entered amount for the amount of time specified by the Low Time Limit. Enter a time frame that the flow rate must remain below before opening the blow valve. Displays the elapsed time since the flow rate was below the established limit. Timer will reset if flow rate goes above Flow Rate BV Limit before reaching the Flow Rate BV Low Time Limit. Statistics Inputs/Strings Inputs - Measurement Plunger Arrival Value Displays the number of elapsed seconds for the plunger arrival. Cal Hold? Displays Yes or No. Inputs - Pressures AP (AP at APvcb) DP Line Pressure Tube (Tubing) Case (Casing) User-defined field for Absolute Pressure User-defined field for Differential Pressure User-defined field for Line Pressure User-defined field for Tubing Pressure User-defined field for Casing Pressure rev. AA Page 81
82 Barometer Pressure User-defined field for Barometric Pressure (PSIG) Inputs - Derived Values Tube Line Case Line Case - Tube Load Ratio Current Value Foss Gaul Multiplied Turner Flow Rate Multiplied Hold Input Value Open 1 Value Open 2 Value Close 1 Value Close 2 Value Current tubing minus line pressure differential. The Value column displays the casing minus line pressure. Current casing minus tubing pressure differential. Current load ratio value. (Case-tube)/(Case-Line) The Value column is the Foss Gaul multiplier which is used for tuning. The Limit column displays the Foss Gaul multiplied value which is the FG Raw Value times FG Multiplier. The Value column displays the multiplier that is multiplied against the calculated Turner unloading rate to determine the flow rate at which the valve will be closed. The Limit column displays the raw Turner calculated flow rate which is the flow rate that will carry fluids to the surface. Value used to determine if valve should be held closed. User defines the Open 1 value (app/array/register) used for plunger. User defines the Open 2 value (app/array/register) used for plunger. User defines the Close 1 value (app/array/register) used for plunger. User defines the Close 2 value (app/array/register) used for plunger. Inputs Valve Controller VC Cmd VC Features Displays the values for Valve Control Controller as set up in PCCU (VCI Cmd1) Displays the parameter settings for Valve Control as set up in PCCU (Features1) Strings Page rev. AA
83 Current State Displays the current state of the controller. Controller current states are as follows: Fail Indicates that plunger has failed to arrive. Closing Valve Indicates that the production valve is closing, and the system is waiting for the plunger fall delay to expire. Valve Closed Indicates the plunger fall delay has expired, and the system is waiting for an open valve condition to be initiated. Plunger Arriving Indicates that the production valve has opened, and the system is waiting for the plunger to arrive. Blow Valve Indicates that the plunger has not yet arrived, blow valve conditions have been met and a secondary valve has been opened. Plunger Arrived This is an instantaneous state that indicates that the plunger has arrived. AfterFlow Indicates that the production valve is open, the plunger has arrived and close conditions are waiting to be met. Max. State Timer State Timer Displays the maximum timer time for the current state. Displays the current timer time for the current state followed by the time limit for the current state. Max. O/C Timer (max open/close timer) Displays the Open/Close maximum time limit. O/C Timer (current open/close timer) Displays the Open/Close time counter. In Tube/In Plunger In Tube - Tube Values Temperature Flow rate Volume - Accum Today's Volume Yesterday's Volume Z factor Enter temperature value. Enter flow rate value. Enter accumulated volume value. Enter today's volume value. Enter yesterday's volume value. Enter z factor value. In Tube - Contract Hour Last Contract Hr Update Tube Last Contract Time Log Time Day End Flag Displays the date/time stamp of the update. Displays the date/time stamp of the last contract time. Displays the Log Time (dd: hh:mm:ss). Enter the value for the Day End Flag (Wait or Log) rev. AA Page 83
84 In Plunger Total Cycles Total Plunger Travel Plunger Arrivals Today Last Lift Velocity Reset Date/Time Reset Plunger Counters Displays the total cycles. Displays the total plunger travel. Displays the plunger arrivals today. Displays the last lift velocity. Displays the reset date/time. User defined as No or Reset. Events Time Stamp Reason Value Displays the Time Stamp of the Event. Displays the Reason that caused the Event. Displays the app/array/register associated with the event. Total Cycles Averages Average Close Time Displays the average closing time of the last ten plunger arrivals. Average Close Case Displays the average closing casing pressure of the last ten plunger arrivals. Average Close Tube Displays the average closing tubing pressure of the last ten plunger arrivals. Average Close Line Average Close FR Average Close Vol Displays the average closing line pressure of the last ten plunger arrivals. Displays the average closing flow rate of the last ten plunger arrivals. Displays the average closing volume of the last ten plunger arrivals. Average Open Time Displays the average opening time of the last ten plunger arrivals. Average Open Case Displays the average opening casing pressure of the last ten plunger arrivals. Average Open Tube Displays the average opening tubing pressure of the last ten plunger arrivals. Average Open Line Average Open Vol AR Time Displays the average opening line pressure of the last ten plunger arrivals. Displays the average opening volume of the last ten plunger arrivals. Displays the time it takes for the plunger to arrive. Total CC Close Stamp Close Reason Close Time Close Case Close Tube Displays the Date/Time Stamp at the time of valve closure. Displays the reason for valve closure. Displays the time at valve closure. Displays the closing casing pressure. Displays the closing tubing pressure. Page rev. AA
85 Close Line Close Flow Rate Close Volume Open Stamp Open Reason Open Time Open Case Open Tube Open Line Open Volume AR Stamp AR Status AR Time Displays the closing line pressure. Displays the closing flow rate. Displays the closing volume. Displays the Date/Time Stamp at the time of valve opening. Displays the reason for valve opening. Displays the time at valve opening. Displays the casing pressure at valve opening. Displays the tubing pressure at valve opening. Displays the line pressure at valve opening. Displays the volume at valve opening. Displays the Date/Time Stamp of the valve arrival. Displays the Status of the valve arrival. Displays the Time of the valve arrival. Total OO (if displayed) Open Stamp Open Reason Open Time Open Case Open Tube Open Line Open Flow Rate Open Volume Close Stamp Close Reason Close Time Close Case Close Tube Close Line Close Volume AR Stamp AR Status AR Time Displays the Date/Time Stamp at the time of valve opening. Displays the reason for valve opening. Displays the time at valve opening. Displays the open casing pressure. Displays the open tubing pressure. Displays the open line pressure. Displays the opening flow rate. Displays the opening volume. Displays the Date/Time Stamp at the time of valve closure. Displays the reason for valve closure. Displays the time at valve closure. Displays the casing pressure at valve closure. Displays the tubing pressure at valve closure. Displays the line pressure at valve closure. Displays the volume at valve closure. Displays the Date/Time Stamp of the valve arrival. Displays the Status of the valve arrival. Displays the Time of the valve arrival. Current/Daily Cycles Current Cycles - Open Valve Open Stamp Open Reason Open Time Open Case Displays Date/Time Stamp at time of valve opening. Displays reason for opening valve. Displays time of valve opening. Displays casing pressure value at time of valve opening rev. AA Page 85
86 Open Tube Open Line Open Volume Displays tube pressure value at time of valve opening. Displays line pressure value at time of valve opening. Displays volume value at time of valve opening. Current Cycles - Plunger Arrival AR Stamp AR Status Average Case Average Tube Average Line Average FR Displays the date/time stamp of the plunger arrival. Displays the status of the plunger arrival (i.e. Normal) Displays the average casing pressure for the last ten plunger arrivals. Displays the average tubing pressure for the last ten plunger arrivals. Displays the average line pressure for the last ten plunger arrivals. Displays the average flow rate for last ten plunger arrivals. Current Cycles - Close Valve Close Stamp Close Reason Close Time Close Case Close Tube Close Line Close Flow Rate Close Volume Displays Date/Time Stamp at time of valve closure. Displays reason for closing valve. Displays time of valve closure. Displays casing pressure value at time of valve closure. Displays tube pressure value at time of valve closure. Displays line pressure value at time of valve closure. Displays flow rate value at time of valve closure. Displays volume value at time of valve closure. Current Cycles - Open Valve Open Stamp Open Reason Displays the Date/Time stamp at the time of valve opening. Displays the Reason for valve opening. Daily Cycles Today's Volume Yesterday's Volume Displays volume value since contract hour. Displays volume value during previous contract day. Total Cycles Since Reset Plunger Arrivals Today Plunger Arrivals Yesterday Closed Today Displays number of total cycles since last reset. Displays the total count of plunger arrivals that occurred since the contract hour. Displays the total count of plunger arrivals that occurred on the previous contract day. Displays time closed during the contract day. Closed Yesterday Open Today Displays time closed during the previous contract day. Displays time open during the contract day. Page rev. AA
87 Open Yesterday Open Time Today Open Time Yesterday Close Time Today Close Time Yesterday Displays time open during the previous contract day. Displays % of available time open during the contract day. Displays % of available time open during the previous contract day. Displays % of available time closed during the contract day. Displays % of available time closed during the previous contract day. Plunger Plunger Counts Plunger Normal Count Consecutive Normal Arrivals Fast Count Slow Count Late Count Fail Reason Date Plunger Arrivals Today Keeps count of the number of times the plunger arrived within the Slow and Fast Arrival times. The count will increment until cleared by the Clear Plunger Counters. The Value column displays the number of consecutive arrival counts where the arrival time is between the Slow Arrival Time Limit and the Fast Arrival Time Limit. The count will reset if an arrival is outside this limit. Keeps count of the number of times the plunger exceeded its Fast Arrival time. The count will increment until cleared by the Clear Plunger Counters. Keeps count of the number of times the plunger arrived below its Slow Arrival Time. The count will increment until cleared by the Clear Plunger Counters. Displays the total number of late arrivals since the last reset plunger counter command was executed. Displays the Date/Time Stamp of the Fail Reason Date. Displays the count of Plunger Arrivals since the Contract Hour. Plunger Arrivals Yesterday Displays the count of Plunger Arrivals for the previous Contract Day. Plunger Arrivals Average Time Displays the average arrival times for the last ten plunger arrivals. Plunger Arrivals Log AR Stamp Log AR Status Log AR Time Log # Displays the Date/Time Stamp of the plunger arrival for the individual log entry. Displays the Status of the plunger arrival (i.e. Normal) for the individual log entry. Displays the Time (elapsed seconds) of the plunger arrival for the individual log entry. Displays the number of the Log entry rev. AA Page 87
88 Fail Fail Log Fail Stamp Fail Log Fail Reason Log # Displays the Date/Time Stamp of the failed action. Displays the Reason for the failed action. Displays the number of the Log entry. Page rev. AA
89 Flt Pt Time LimitsStatus Max State Timer State Timer Max OC Timer OC State Timer Displays the state's maximum time limit. Displays the state's time counter. Displays the Open/Close maximum time limit. Displays the Open/Close time counter. Open Limits The Value field displays the timer value as it counts up toward the Limit Flow Cycle Time Limit value in the Limit field. Displays the AfterFlow Timer Limit which will close the production valve After Flow Time Limit when the AfterFlow Timer reaches this limit. The Value column displays the time that has elapsed since plunger arrival. Evaluation Time Limit When this value becomes equal to the Evaluation Time entered in the Limit field by the user, the Evaluation Flag is set to On. The Value column displays the amount of time that the current flow rate has been below Turner Flow Rate x Turner Rate multiplier. The timer is reset if Turner Low Time Limit the flow rate goes above the threshold. The flow rate has to be below for the amount of time entered in the Limit column. Displays the Casing Delta Value Limit. The delta value must be above the Casing Rise Time Limit Casing Delta Value Limit for the amount of time specified in the Casing Rise Timer Limit, before the valve is closed. The Value column displays a timer that commences counting after the Casing Evaluation Time Evaluation Limit time has expired and if the Casing Delta Value is above the Limit Casing Delta Limit. If at any time before reaching the Casing Rise Timer rev. AA Page 89
90 Casing Slope Time Limit Load Ratio Time Limit DP Low Time Limit Flow Rate Time Limit Tubing Close Time Limit SP Close Time Limit Close1 Time Limit Limit, the Casing Average falls below the Casing Delta Limit, the timer is reset and commences counting again. If the counter reaches the Casing Rise Timer Limit and the Casing Average is above the Casing Delta Limit, the production valve will close. Displays the Casing Slope Timer Limit. The Casing Slope Value must be above the Casing Slope Value Limit for the time specified by the Casing Slope Timer Limit before closing the production valve. Displays the Load Ratio Timer Limit. The Load Ratio must be below the Load Ratio Limit value for this limit time before the production valve is closed. Displays the DP Low Timer Limit. The current differential pressure must be above/below the DP Limit value for this DP Low Timer Limit amount of time before the production valve will close. The Value column displays the current flow rate. If the flow rate remains below the user specified Flow Rate Time Limit in the Limit column for the Flow Rate Timer Limit amount of time, the production valve will close. Displays the Tubing Close Timer Limit. The current tubing pressure must be above/below the Tubing Limit value for this Tubing Close Timer Limit time before the production valve will close. Displays the SP Close Timer Limit. The SP Current Value must be above/below the SP Limit value for the SP Timer Limit time before the production valve will close. Time that Close 1 must be above/below the Close 1 Limit before the valve is closed. Close1 Hold Time Limit Time that Close 1 will DELAY a Hold or Force Open (not Hold Value). Time that Close 2 must be above/below the Close 2 Limit before the valve is Close2 Time Limit closed. Close2 Hold Time Limit Time that Close 2 will cause a HOLD. Close Limits Plunger Fall Limit Valve Close Check Time Hold Timer Limit Hold Once Time Limit Close Cycle Limit SP Open Time Limit Mandatory Close Time Limit Load Ratio Open Time Limit Time Limit field displays time limit for the fall time. The Limit data is for setting the amount of time the flow rate has to stay above the Valve Close Check Setpoint before a valve close failure is declared. May replace Plunger Fall Delay. The Limit data allows for the entry of the time if Fixed will be used. The fixed time needs to be entered before enabling the Fixed option. The Limit column will also display the computed hold time if the 1 Cycle, 2 Cycle or 3 Cycle option is used. Enter the delay time in the Limit field to keep the valve closed after being closed. The Limit field is for entering the SP Limit time. The SP Current Value must be above/below the SP Limit value for the SP Limit time before the production valve will open. The Limit field will either display the time computed when the 1, 2, or 3 Cycle is selected or allow the user to enter a time when Fixed is selected. The Limit field displays the user entered amount of time that the Load Ratio must be below the Load Ratio Limit value to open the valve. However, even Page rev. AA
91 Tubing Open Time Limit Casing Open Time Limit Foss Gaul Time Limit Open1 Open Time Limit Open2 Time Limit Total Cycle Time Limit High Line Close Time Limit if the timer reaches this Limit time, the casing pressure must be greater than the line pressure x Casing-Line Multiplier to open the valve. The Limit field is the time the tubing pressure must be above or below the Tube Open Limit pressure before the valve is opened. The Limit field which is the time the casing pressure must be above or below the Casing Open Limit pressure before the valve is opened. Time Limit field - Displays the Limit Time. The production valve will open if the casing minus line pressure is less than the Foss Gaul Multiplied Value for this Limit Time. The Limit field displays and allows user entry of the Open 1 Limit time which is the time the Open 1 Current value must be above/below the Open 1 Limit value before opening the valve. The Limit field displays and allows user entry of the Open 2 Limit time which is the time the Open 2 Current value must be above/below the Open 2 Limit value before opening the valve. The Limit field displays the total cycle time which is the total of the Flow Timer time and the Closed Timer time for the Auto mode or displays and allows for the user entered total cycle time for the Fixed mode. The Value field displays the elapsed time since the valve closed. The Limit field is for entering the time or delay since the valve closed before initiating the High Line Open Action parameter. High Line Open Time Limit Close1 Time Limit The Value column displays the elapsed time since the production valve opened. The Limit field is for entering a time to wait after the production valve opens before checking the high line pressure and taking any actions. Time that Close 1 must be above/below the Close 1 Limit before the valve is closed. Close1 Hold Time Limit Time that Close 1 will DELAY a Hold or Force Open (not Hold Value). Time that Close 2 must be above/below the Close 2 Limit before the valve Close2 Time Limit is closed. Close2 Hold Time Limit Time that Close 2 will cause a HOLD. Flt Pt Timers Arrival Times Arrival Timer Max Arrival Limit Slow Arrival Limit Fast Arrival Limit Min Arrival Limit Displays the elapsed time since the valve was last commanded open. The User will select a time format and enter the time in the Value field. The Limit field is for the user entry of the Max Arrival Time Limit. The Limit field is for the user entry of the Slow Arrival Time Limit. The Limit field is for the user entry of the Fast Arrival Time Limit. The Limit field is for the user entry of the Minimum Arrival Time Limit rev. AA Page 91
92 Open Timers Flow Cycle Time Timer After Flow Timer Evaluation Timer Turner Low Timer Casing Rise Timer Casing Slope Timer Load Ratio Close Timer DP Low Timer Flow Rate Timer The Value column displays the timer value as it counts up toward the Limit value in the Limit field. The Limit value is entered by the user and is the total open or flow time. The time begins when the production valve is opened and ends when the Limit time has elapsed. This will include arrival time for the plunger and AfterFlow time which is after the plunger arrives. The Value column displays the timer which commences counting at the beginning of the AfterFlow state. AfterFlow starts when the plunger arrives. The counter counts up to the Limit value entered in the Limit column by the user. Limit time is the amount of flow time requested by the user during the AfterFlow state. The Value column displays the time that has elapsed since plunger arrival. When this value becomes equal to the Evaluation Time entered in the Limit column by the user, the Evaluation Flag is set to On. The Value column displays the amount of time that the current flow rate has been below Turner Flow Rate x Turner Rate multiplier (see above regarding Packer Well selection). The timer is reset if the flow rate goes above the threshold. The flow rate has to be below for the amount of time entered in the Limit column. The Value column displays a timer that commences counting after the Evaluation Limit time has expired and if the Casing Delta Value is above the Casing Delta Limit. If at any time before reaching the Casing Rise Timer Limit, the Casing Average falls below the Casing Delta Limit, the timer is reset and commences counting again. If the counter reaches the Casing Rise Timer Limit and the Casing Average is above the Casing Delta Limit, the production valve will close. The Value column displays a timer that commences counting after the Evaluation Limit time has expired and if the Casing Slope Value is above the Casing Slope Limit. If at any time before reaching the Casing Slope Timer Limit, the Casing Slope falls below the Casing Slope Limit, the timer is reset and commences counting again when the Casing Slope is above the Limit. If the counter reaches the Casing Slope Timer Limit and the Casing Slope is above the Casing Slope Limit, the production valve will close. The Value column displays a counter which will commence counting at the plunger arrival time and count up to the user entered Load Ratio Close Limit time. The Load Ratio must be below the Load Ratio Limit value for this limit time before the production valve is closed. The Value column displays a timer that commences counting at the plunger arrival time if the current DP is below the DP Limit value. The counter will continue to count until the DP Low Timer Limit is reached. At this point the production value is closed. If at any time, the DP raises above the DP Limit value, the counter is reset and only starts counting again if the DP falls below the DP Limit value while in the AfterFlow state. The Value column displays a timer that commences counting at the plunger arrival time if the Flow Rate is below the Flow Rate Limit value. The counter will continue to count until the Flow Rate Low Limit time is reached. At this point the production value is closed. If at any time, the Flow Rate rises above the Flow Rate Limit value, the counter is reset and only starts counting again if the Flow Rate falls below the Flow Rate Limit value while in the AfterFlow state. Page rev. AA
93 Tubing Close Timer SP Close Timer Close1 Timer Close2 Timer If the current tubing pressure is above/below (per Close Action) the tubing pressure Limit value, the Value column timer will commence counting up to the Tubing Close Timer Limit time. If the counter reaches the Limit value, the production valve will close. If the tubing pressure changes such that it does not meet the Close Action criteria, the counter will reset and wait until the Close Action criteria is met again. The Value column displays a counter which commences counting when the SP Current Value is above/below the SP Limit value as specified by the SP Action parameter. If the counter reaches the SP Limit time, the production valve will close. If the static pressure changes such that it is not above/below the SP Limit value per the SP Action, the counter will reset and wait until the pressure reaches its Limit pressure again and commence counting. Displays the current Close 1 Timer value and Timer Limit. Displays the current Close 2 Timer value and Timer Limit. Close Timers Plunger Fall Timer Valve Close Check Timer Hold Once Timer Closed Timer SP Open Time Timer Mandatory Close Timer Load Ratio Open Timer Tubing Open Timer Casing Open Timer Foss Gaul Timer Open1 Open Timer Open2 Open Timer The Value field displays the elapsed time since the production valve was closed. This is a time delay to allow enough time for the plunger to reach the bottom after closing the production valve before going to State 2 (Closed). The Value field is a timer which displays the amount of time that the flow rate has stayed above the Valve Close Check Setpoint. The Value field displays the timer which starts at zero and runs through the duration of the Hold Once operation. Displays the elapsed time in the Value field since the valve was commanded closed and for the duration of the Limit value. The Value field displays the amount of time the SP Current Value has been above/below the SP Limit Value as selected by the Static Pressure Action parameter. The Value field displays a timer that tracks the time from the beginning of the Active state up to the end of the Limit time. The Value field displays a timer that commences counting when the Load Ratio drops below the Load Ratio Limit value and continues counting until it reaches the time entered in the Limit column. If the Load Ratio should move back above the Load Ratio Limit, the timer will reset and only commence counting again when Load Ratio again drops below the Load Ratio Limit. The Value field displays the Limit timer which starts when the Low or High Open condition is met to open the valve and counts up to the Limit time (Limit field). The Value field displays the Casing Open timer which starts when the Low or High Open condition is met to open the valve and counts up to the Casing Open Limit time (Limit field). The Value field displays the amount of time that the casing minus line is less than the Foss Gaul Multiplied Value. The Value field displays a timer which is the amount of time that the Open 1 Current Value is above/below the Open 1 Limit value based on the Open Action selection. The timer increments until it reaches the Open 1 Timer Limit which will trigger the opening of the valve. The Value field displays a timer which is the amount of time that the Open 2 Current Value is above/below the Open 2 Limit value based on the Open rev. AA Page 93
94 Total Cycle Timer Close1 Timer Close2 Timer Action selection. The timer increments until it reaches the Open Timer Limit which will trigger the opening of the valve. The Value field is a timer that starts at the beginning of the open time and runs until it reaches the end of the total cycle time, resets and starts again with the next open. The Value field displays the current Close 1 Timer value and is the amount of time in Hold or time value that has been above/below the Close 1 Limit. The Value field displays the current Close 2 Timer value and is the amount of time in Hold or time Value has been above/below the Close 2 Limit. Flt Pt Log Times Log Close Cycle Log Open Cycle Log Arrival Time Log BV Time Log # Displays the elapsed time of the close valve cycle for each log entry. Displays the elapsed time of the open valve cycle for each log entry. Displays the elapsed time for the plunger arrival for each log entry. Displays the elapsed time since the plunger arrived in the Blow Valve state for each log entry. Displays the number of the Log entry. Page rev. AA

95 Plunger SU Overview The Plunger Lift application works in a manner similar to a pneumatic piston, wherein it is caused by gravity to fall to the bottom of the well. Acting as a seal between the liquid and the gas, the plunger settles to the bottom of the production tubing and allows liquid to accumulate above it. This accumulation of liquid restricts the flow of gas and slows it down. The production valve is closed to allow down-hole pressure to build in the casing. After the pressure has built up, the production valve is opened and the casing pressure lifts the plunger and accumulated liquids to the surface. At the surface, separators remove the liquids from the gas. Once the flowing gas drops, it becomes necessary to choose a time or method of closing the production valve. Once closed, the plunger drops to the bottom of the production tube. With the plunger deployed and the well shut-in, the downhole pressure builds, causing the cycle to repeat. Read-only fields display values for Casing/Tubing/Line pressures, Flow Rate and Yesterday's/Today's volumes. The TWI system is designed to enable users to affect certain parameters that work in conjunction with the Plunger Lift application. Outside of the United States, requirements for standards of measurement may differ from existing domestic standards in the oil and gas industry. For example DP measured in inh2o here in one market but in another country's market may be measured in kg/cm2 instead. To meet such need in the overseas markets, a Selectable Unit (SU) functionality has been added to the AGA-3 and AGA-7. Thus the new nomenclature of SUAGA-3 is to signify this functionality rev. AA Page 95
96 Navigation The Plunger Lift window is laid out in a similar fashion to other windows found within the TWI. Upon first entering the Plunger Lift screen, the user is within the Trend tab. There are five other tabs that are available: Trend, Setup, Closed, Open and Statistics. Clicking on any of the available tabs takes the user to that particular area. Within each of the tabs resides information and/or certain parameter fields that the user can manipulate, based on their specific needs. When the user hovers their cursor over a particular field and a Pencil icon displays, this signifies that this is a field that can be changed. If there is no Pencil icon displayed, this represents a read-only field. If the user wishes to save time instead of searching for those fields that can or cannot be edited, they can click the Edit All button. This opens a dialog box that has all of the fields that the user can affect. The following details the individual tabs that the user encounters within the Plunger Lift screen and the various parameters that are contained within each. Click on the preferred link below to view the information regarding that particular tab or item. Overview Casing Plots the raw casing pressure values (PSIA). Associated PCCU Register (5.5) Tubing Plots the raw tubing pressure value. Associated PCCU Register (5.6) Line Pressure Plots the raw line (static) pressure values (PSIA). Associated PCCU Register (5.7) Flow Rate Plots the single point for each cycle (if an arrival has occurred) in minutes (SCF/Hr). Associated PCCU Register (5.8) Yesterday's Volume Displays yesterday s contract day volume. Today's Volume Displays the Volume from the start of the Contract Day. Shutdown Status Displays as either OK or in Shutdown. Fail Reason Value Fail Reason Date Timer Max Timer The top row displays the current state of the controller in the Description column followed by the current timer time for the current state followed by the time limit for the current state. Controller states: Fail Indicates that plunger has failed to arrive. Closing Valve Indicates that the production valve is closing, and the system is waiting for the plunger fall delay to expire. Valve Closed Indicates the plunger fall delay has expired, and the system is waiting for an open valve condition to be initiated. Plunger Arriving Indicates that the production valve has opened, and the system is waiting for the plunger to arrive. Blow Valve Indicates that the plunger has not yet arrived, blow valve conditions have been met and a secondary valve has been opened. Plunger Arrived This is an instantaneous state that indicates that the plunger has arrived. AfterFlow Indicates that the production valve is open, the plunger has arrived, gas is flowing and close conditions are waiting to be met. Provides the date/time of the last Fail Reason. Displays the elapsed time since the valve was last commanded open and the plunger arriving. Displays the maximum amount of time to wait for the plunger to arrive. Page rev. AA
97 Trend In this control application, there is no inherent capability to trend from its webpage. The association of this app and its trended file(s) must be done in PCCU32. These file(s) must be built in the Trend application's Trend File Editor including file naming and including all selected variables to trend with their App/Array/Registers. The user can then associate the trend file built and named with the control app by going under the app's Setup tab and assigning it the same trend file name. Thus from the webpage it uses the same name to call up the correct file from the Trend System application and display as required the data in graph or grid format. The Trend tab gives the user a graphical representation of the measurements and trends for the valve. The user may select the Poll Type button to display either Historical or Real Time data. One may also use the View button to select either the Grid or Graph view. The user may click on any of the check marks to the left of the variables along the bottom of the view to either display or hide the individual variable(s). The user also may use a mouse rollover on any of the displayed trends (must be in Graph view and polling Historical Data) to show the individual reading for selected times. Finally the display itself may be collapsed or expanded by selecting the corresponding button function in the upper right corner of the screen. If electing to display in Historical mode, the following variables must be included: 1 Casing 2 Units [Optional] 3 Tubing 4 Units [Optional] 5 Line 6 Units [Optional] 7 Flow Rate 8 Units [Optional] The individual parameters can be displayed with or without measurement scales. To add the scales to the background, the Scales icon to the lower right of the parameter legend would need to be selected. Selecting it again would hide the scales. Setup General Common Setup Plunger Control Allows for the plunger control types to be set. The types are as follows: Off This control type prevents the logic from running. Resets the controller. Manual This setting allows for the manual operation of both the production and blow valves. Additionally, it also allows for the input valves to be read. Off This control type initializes the logic from Startup mode and begins operation rev. AA Page 97
98 Cycle Start Trend File Name Within this field the user can add time to off-time (shut-in period) to ensure the Plunger Lift runs according to the time cycles. Enter a name here and setup a trend file in the Trend System application. Using the same name will allow the web user interface to display the trend information when viewing the Plunger application information. Tuning Optimization Plunger Fail Factor Tune Enables and disables the continuous adjustment of all setpoints. Options are either Disabled or Enabled. If Optimization has not been enabled, it will be the sole option under Tuning. Once optimized, the Plunger Fail Tune option will display. If Optimization is de-selected, the Plunger Fail Tune option will disappear. If a plunger happens to fail, this field allows the user to set this factor which is then consequently multiplied against the next tuning. Reset Options Startup Mode Safety Reset Mode Select the startup state after a controller reset. 1 Closing Valve - Startup in the Closing Valve state (State 1). 6 AfterFlow - Startup in the AfterFlow state (State 6). Previous State - Startup in the state at the time of the reset occurred. In this field if the plunger is disabled by the safety system or disabled due to max arrivals allowed being exceeded. This control is used to reset plunger controls. Well Geometry Tubing Length Tubing Inner Diameter Fluid Gradient Log Size Event Log Size This is a user configurable field that enables the establishment of the length of the tubing from the stop to the arrival sensor. This is subsequently used to calculate the lift velocity. This is a user configurable field that establishes the inner diameter of the well tubing. This is then used to calculate the Turner Flow Rate. Within this user-defined field the user can set the constant that is utilized to calculate slug size. This is a user configurable field that establishes the number of cycle, blow and fail logs that are kept. Enter the number of event logs for the system to keep. Valve On/Off Control Page rev. AA
99 Valve Position Valve Time Limit User-defined as Upstream or Downstream depending on direction in relation to the valve. This is the amount of time to manually energize the open and close DOs to either open or close the production, blow and capture valves. This is not to be confused with valve control. Enter time in seconds. Main Valve Setup Valve Type Open DO Close DO Valve Fail State Manual Valve Open Now Select the type of valve used for the production valve. Latch-One output - Only one digital output is used to both open and close the valve. Latch signifies that the DO remains closed when energized until told to open. Latch-Two output - Two digital outputs are used, one to open the valve and one to close the valve. Latch signifies that the DOs remain closed when energized until told to open. Pulse-Two output - Two digital outputs are used, one to open the valve and one to close the valve. Pulse signifies that the DO is only energized for a short duration as specified by the "Valve Time Limit" above. User-defined with the app/array/register for Open DO. User-defined with the app/array/register for Close DO. User-defined as None, Close, or Open. Select either Auto or Force Open. Manual Valve Close Now Select either Auto or Force Close. Blow Valve Setup BV Type Specify the number and type of outputs that are used by the blow valve. The selected options are set to Pulse-Two Output, Latch-One Output or Latch-Two Output. Capture Valve Setup This is simply an Enable or Disable function with no setup required other than if you have a Capture Valve, it needs to be set up in Valve Setup under the Setup tree-view item. When enabled, Catch Mode will put the well in a permanent Closed Hold mode after it completes its flow cycle. If a Capture Valve is used, Capture Valve Type the plunger is kept captured during this time. When the Plunger Catch Mode is disabled, the plunger is released and normal cycle operation resumes. Userdefined with a selection of Pulse-Two output, Latch-One output, Latch-Two output, or Disable. Valve Control rev. AA Page 99
100 VC Option Decide whether or not to use the valve control during flow cycle (plunger arriving and AfterFlow). Available options are set to Enabled or Disabled. Tube Tube Value Registers Tube App AP Register DP Register Flow Rate Register Volume Accumulator Register Volume Today Register Setting will auto-set the Tube Register Address Establishes the address of the absolute pressure analog input. Normal = AGA Specifies the address of the differential pressure analog input. Normal = AGA Can set the address of the flow rate. Normal = AGA Can set the address of the accumulated volume. Normal = AGA User-defined with the Volume Today app/array/register. Volume Yesterday User-defined with the Volume Yesterday app/array/register. Register Tf Register (Temperature) Specify the address of the temperature. Normal = AGA Z Factor Specifies the address of gas compressibility. Normal = AGA Barometer Pressure Register Contract Hour Update Register Can set the address of the barometer pressure that is used to adjust FCU pressure to PSIG. Normal = AGA Specifies the address of the last contract hour update. Normal = AGA Input Input Value Registers Casing Pressure AI Can set the address of the casing pressure analog input. Normal = IOS.3.4 (A15). External Pressure AI Can set the address of the external pressure analog input. This is then used for either tubing or line pressure depending on the valve location. Hold Pressure Specifies the address of the hold pressure analog input. Open 1 Can set the address of open 1. Open 2 Can set the address of open 2. Close 1 Can set the address of close 1 (in1). Close 2 Can set the address of close 2 (in2). Hold External Can set the address of the hold external. Page rev. AA
101 Misc Registers Detection Type Plunger Arrival Pulse Input Restart Button Open Button Close Button Select whether a plunger is used or if the logic acts as an intermitter. The available options are set to either I/O or Intermit. Can set the address of plunger arrival pulse input. Can set the address of the restart plunger digital input. Can set the address for the valve open push button digital input. Can set the address for the valve close push button digital input. Closed Falling Valve Close Check Enable VC Check Enable the VC Check by selecting the empty box. Otherwise, selecting the checked box will disable the VC Check. Plunger Fall Delay Fall Timer Fall Delay Limit The Fall Timer will display the days/hours/minutes/seconds. Set the Fall Timer display with the days/hours/minutes/seconds. This is the time to wait when closing the valve before going to state 2. Closed Setup Closed Setup Open On Tube Line Case Line Case Tube Load Ratio The primary reason for this screen is to provide optional ways to open the closed production valve using one of the following parameters (to open on): This option uses the tubing-line pressure differential to open the production valve. The User can select the Open on Tube Line box to cause a new tab (Tube-Line) to appear for setting up this option. This option uses the casing-line pressure differential to open the production valve. The User can select the Open on Case Line box to cause a new tab (Case-Line) to appear for setting up this option. This option uses the casing-tubing pressure differential to open the production valve. This option uses the casing-tube pressure differential to open the production valve. The User can select the Open on Case Tube box to cause a new tab (Case-Tube) to appear for setting up this option. This option uses the Load Ratio to open the production valve. The User can select the Open on Load Ratio box to cause a new tab (Load Ratio) to appear for setting up this option rev. AA Page 101
102 Foss Gaul Tube Pressure Casing Pressure SP Open1 Open2 Close Timer This option uses the Foss Gaul equation to open the production valve. The User can select the Open on Foss Gaul box to cause a new tab (Foss Gaul) to appear for setting up this option. This option uses the tubing pressure to open the production valve. The User can select the Open on Tube Pressure box to cause a new tab (Tube Pressure) to appear for setting up this option. This option uses the casing pressure to open the production valve. The User can select the Open on Casing Pressure box to cause a new tab (Casing Pressure) to appear for setting up this option. This option uses the static pressure to open the production valve. The User can select the Open on SP box to cause a new tab (SP) to appear for setting up this option. This option uses a timer and a register that can be pointed to any variable to open the production valve. The user sets a limit for the variable and the amount of time the value of the variable can be above or below the variable limit. The User can select the Open on Open 1 box to cause a new tab (Open 1) to appear for setting up this option. This option can be used in conjunction with Open 2 and have 2 different sets of criteria to open the valve on whichever criteria is met first. This option uses a timer and a register that can be pointed to any variable to open the production valve. The user sets a limit for the variable and the amount of time the value of the variable can be above or below the variable limit. The User can select the Open on Open 2 box to cause a new tab (Open 2) to appear for setting up this option. This option can be used in conjunction with Open 1 and have 2 different sets of criteria to open the valve on whichever criteria is met first. This option uses a timer to open the production valve. The User can select the Open on Closed Timer box to cause a new tab (Closed Timer) to appear for setting up this option. Plunger Fall Delay Hold Reason Open Reason The Value column displays reasons the plunger is in Hold (valve closed). The Limit column displays the last reason the valve was opened. Closed Hold Closed Hold Hold Plunger Fall Mandatory Recovery Total Cycle This option is basically the same as the Fall Timer used in State 1 (Closing Valve) with the exception that this option is in State 2 (Closed). This option will keep the production valve closed for the Limit time entered even if conditions have been met to open the valve. This option would replace the Fall Timer in State 1 and not be used in conjunction. The User enables this option by selecting the Enable Mandatory Recovery Time box. When enabled, it will run after a plunger non-arrival and keep the well in a closed state to allow the pressure time to recover. The User selects whether to use 1 Cycle, 2 Cycle or 3 Cycle times or Fixed to enter a fixed amount of time. Option of using an amount of time between valve open to valve open to operate the well. Fixed - The user enters a time in the Total Cycle Timer Limit column for the desired total cycle time. The close time is adjusted automatically each cycle to Page rev. AA
103 make up the difference between the open time and the total cycle time. Open time can be the result of any option and thus not restricted to a timer. Auto - Uses the Flow Timer Close option found under "Open \ Open Setup" for the open time and the Closed Timer option found under "2:Closed \ Closed Setup" for the close time. The limit value of each option is added together to get the Total Cycle Time which will be displayed as the Total Cycle Timer Limit value. Each option has to be enabled of course and a Limit time entered. Hold Once Hold External Hold Schedule Option of delaying the well operation once for a single amount of time. Options are 1 Cycle, 2 Cycle, 3 Cycle, or Fixed for a fixed amount of time. Selecting Enable and Send will display the "2: Hold Once" tab for setup. Option to hold the valve closed until enabled by an external input such as a digital input. Selecting the Hold External box will display the "Hold External" tab for setup. Option to hold the valve closed until enabled by a schedule. Selecting the Hold Schedule (Hold on Pad Controller) box will display the "Hold Schedule" tab for setup. Hold Pressure The User selects whether to hold when the Hold Value pressure is lower (Hold Low) than the Hold Value Limit or hold when it is higher (Hold High). Hold Close 1 Hold Close 2 Hold High Line Time of Day Plunger Catch Mode Hold Reason Open Reason This option supports an input called "Close 1" which would typically be a pressure but could be a digital input. The setup options are split into two functions, close the production valve when it's open and hold it closed for some period. The input value is tested to see if it is above or below a specified value and the value must be above or below the specified value for a user specified amount of time. "Close 1" and "Close 2" can both be used at the same time and whichever has its criteria met first will drive or hold the valve. This option supports and input called "Close 2" which would typically be a pressure but could be a digital input. The setup options are split into two functions, close the production valve when its open and hold it closed for some period. The input value is tested to see if it is above or below a specified value and the value must be above or below the specified value for a user specified amount of time. "Close 1" and "Close 2" can both be used at the same time and whichever has its criteria met first will drive or hold the valve. This option uses high line pressure to close the production valve and either keep closed or re-open. Enable/Disable in the Value column. This option allows the user to set up to four different time spans each day to put the well into Hold mode. Enable/Disable in the Value column. The Limit column indicates Yes or No whether in Hold mode or not. This option when enabled will keep the production valve closed until the option is disabled. This typically allows for closing in the well after a plunger catch. The Value column displays reasons the plunger is in Hold (valve closed). The Limit column displays the last reason the valve was opened. Open Open Setup rev. AA Page 103
104 Open Setup Plunger catch mode This is simply an Enable or Disable function with no setup required other than if you have a Capture Valve; it needs to be setup in Valve Setup under the Setup tree-view item. When enabled, Catch Mode will put the well in a permanent Closed Hold mode after it completes its flow cycle. If a Capture Valve is used, the plunger is kept captured during this time. When the Plunger Catch Mode is disabled, the plunger is released and normal cycle operation resumes. Flow Timer Close 1 Close 2 Blow Cushion This is a timer option that allows the well to flow for specified period of time each cycle before closing the production valve. Close 1 Hold option: Value Column - Displays the Close 1 input current value. Limit Column - The Close 1 value must be below/above this Close 1 Limit value for the Close 1 timer Limit time. Time Limit Column - Displays the Hold Close 1 Time Limit. Misc Column - Displays the Close 1 Open Action. This is how Close 1 will release hold. Close 1 Hold option: Value Column - Displays the Close 2 input current value. Limit Column - The Close 2 value must be below/above this Close 2 Limit value for the Close 2 timer Limit time. Time Limit Column - Displays the Hold Close 2 Time Limit. Misc Column - Displays the Close 2 Open Action. This is how Close 2 will release hold. Value Column - Displays the Blow Valve Cushion Timer which is the elapsed time since the plunger arrived while in Blow Valve state. Time Limit Column - Displays the Blow Valve Cushion Time Limit which is the time to wait after the plunger arrives while in Blow Valve state. After this time limit, open the production valve and close the blow valve. Waiting Close Valve Enables Flow Timer Close Option of using a timer as the means of closing the production valve. Flow Cycle Time Limit The time begins when the production valve is opened and ends when the Limit time has elapsed. This will include arrival time for the plunger and AfterFlow time which is after the plunger arrives. Close 1 Close 1 Close Limit This option which uses the Close 1 input provides two primary uses. It can be used to hold the production valve closed and/or release it when in the Closed state (State 2). It can also be used to Close the production valve when in the Waiting/Arrival (State 3) or AfterFlow (State 6). Displays the current Close 1 value and the Close Limit value. Value column - Current Close 1 Value. Limit column - Hold closed if Close 1 Value is below/above (Close Action) this Limit for Close 1 Timer Limit. Page rev. AA
105 Close 2 Close 2 Open Limit Arrival Timer Last Plunger Arrival Non-Arrivals Count Max Non-Arrivals Count This option which uses the Close 2 input provides two primary uses. It can be used to hold the production valve closed and/or release it when in the Closed state (State 2). It can also be used to Close the production valve when in the Waiting/Arrival (State 3) or AfterFlow (State 6). Displays the current Close 2 value and the Open Limit value. Value column - Current Close 2 Value. - Limit column - Close 2 value must be above/below this Limit value based on Close 2 Action for Close 2 Timer Limit to close valve. The Value column displays the elapsed time since the production valve was commanded open and until the plunger arrives. Then the timer will reset. Displays the time of the last plunger arrival. The value is set in the following format: dd:hh:mm:ss. Displays the elapsed time since the valve was commanded open and the plunger is arriving. Counts the consecutive number of arrival times that were greater than the Max Arrival Time. The value is automatically reset if the plunger arrival time is less than the Max Arrival Time. Arrival Time Limits Max Arrival Time Slow Arrival Time Fast Arrival Time Min Arrival Time The Value column displays the number of consecutive times the arrival time exceeded the maximum arrival time. The count will reset if the arrival time is less than the maximum time. The Value column displays the number of counts where the arrival time fell below the Slow Arrival Time Limit. The count will reset if an arrival time is greater than the Slow Limit Time. Also, tuning will occur if the plunger arrival is slower than the Slow Arrival Time Limit. The Value column displays the number of counts where the arrival time exceeded the Fast Arrival Time Limit. The count will reset if an arrival time is slower than the Fast Arrival Limit Time. Also, tuning will occur if the plunger arrival is faster than the Fast Arrival Time Limit. The Value column displays the number of consecutive arrival counts where the arrival time fell below the minimum arrival time. The count will reset if the an arrival time is greater than the minimum time. High Line High Line Option to use high line pressure as a way to close the production valve and adjust the close time. Arrived Plunger Swab Plunger Swab (Option) Swab Runs Completed The Swabbing section's Enable first field is optional and user-defined from which the user can enable the use of the plunger to swab. When set to Enable, the plunger will begin tripping on the next cycle, repeating the drop phase on the next arrival. Options are either Yes or No. The Swab Run Count is the read-only field that displays the number of swab runs completed to date rev. AA Page 105
106 Swab Runs Setpoint When the user enables the Swabbing option, this user-defined field allows the user to set the number of swab runs that need to be completed. Swab Now To swab now, select Yes and Send. At the start of or during AfterFlow, the production valve will close immediately and stay closed through its normal close time and then commence swabbing. The number of swabs is as specified in the Limit column for Total Runs. Total Cycles Total Cycles Left Till Maintenance Cycles left until maintenance The Value column will display the total number of cycles ran until the Plunger Counter Reset. When the Total Cycles equals the number specified by the user in the Limit column, the Cycle Status on the Summary screen will display the word Maintenance. Plunger Arrived First Run Count First Run Limit Displays the Value column counts up to the Limit value entered by the user in the Limit column. On each plunger arrival, the count will increment and the production valve will close, not allowing the Plunger application to go into the AfterFlow state. After the Value column count reaches the Limit value, AfterFlow and normal operation commences on the next cycle. The User defines the Limit value by entering it here. On each plunger arrival, the count will increment and the production valve will close, not allowing the Plunger application to go into the AfterFlow state. After the Value column count reaches the Limit value, AfterFlow and normal operation commences on the next cycle. After Flow After Flow Setup After Flow Timer This option uses a timer during After Flow to close the production valve. Turner Flow Rate This option uses the Turner flow rate to close the production valve. Load Ratio DP Flow Rate Casing Rise This option uses the Load Ratio which must be below a specified value for a specified amount of time to close the production valve. This option uses the differential pressure which must be below a specified value for a specified amount of time to close the production valve. This option uses the flow rate which must be below a specified value for a specified amount of time to close the production valve. This option closes the production valve when the Casing Delta Value (current casing pressure average minus previous casing pressure average) is above the user specified Casing Delta Limit at the end of the user specified Casing Rise Timer Limit. Page rev. AA
107 Tube Line Casing Pressure SP Tubing Pressure Casing Slope Case Tube This option will close the production valve when the tubing pressure minus the line pressure is less than the user specified limit value. This option uses low casing pressure to close the production valve if it is below a user specified value. This option uses the static pressure to close the production valve if is above or below a user specified limit for a specified amount of time. This option uses the tubing pressure to close the production valve if is above or below a user specified limit for a specified amount of time. This option closes the production valve when the Casing Slope value is above the specified Casing Slope Limit at the end of the specified Casing Slope Timer Limit. This option will close the production valve when the casing pressure minus the tubing pressure is less than the user specified pressure differential limit. Blow Valve (if Tab Displayed) BV Plunger Arriving BV Plunger Arrival Timer Option BV Plunger Arrival Time Limit Option to use plunger arrival time to open the blow valve. This is not the Blow Valve state (state 4). Enter the time to wait for the plunger arrival before opening the blow valve (not state 4). Flow Rate BV Option Option to use flow rate to open the blow valve. Flow Rate Flow Rate BV Limit Flow Rate BV Low Timer Case BV Option Casing Case BV Open Limit DP BV Option DP DP BV Limit Displays the flow rate as measured by the flow computer. Enter the flow rate limit that will initiate the blow valve opening once the flow rate falls below the entered amount. Displays the elapsed time since the flow rate has been below the Flow Rate Blow Valve Limit. Option to use the casing pressure to open the blow valve. Displays the current casing pressure. Enter a value to open the blow valve when the casing pressure falls below this set amount. Option to use differential pressure to open the blow valve. Displays the current differential pressure. Enter a low limit for the differential pressure which will open the blow valve when the pressure falls below this value. SETUP BLOW VALVE Returns the production valve state from valve control, or the last command Fail BV State sent to the valve when not using valve control rev. AA Page 107
108 BV During Wait for Arrival BV Plunger Arrival Option to use plunger arrival time to open the blow valve. Timer Option Flow Rate BV Option Option to use flow rate to open the blow valve. Case BV Option DP BV Option Option to use casing pressure to open the blow valve. Option to use differential pressure to open the blow valve. Blow Valve BV State Option BV Curtail Option BV Cushion Option Option of enabling the blow valve state when the plunger arrival fails. Option to disable venting of the wells during certain hours of the day. Option of enabling the blow valve cushion timer, plus closes the production valve when in the Blow Valve state (State 4). Blow Valve Statistics (if Tab Displayed) Blow Count Blow Count This screen displays a table of time stamps and cycle times of the blow valve occurrences. Time Stamp Time Stamp Cycle Time Displays the Date/Time of each blow valve occurrence Displays the Cycle Time of each blow valve occurrence Blow Valve Help (if Tab Displayed) Blow Valve Help BLOW VALVE State Displays the last command sent to the blow valve. BV - Plunger Arrival Time BV Plunger Arrival Timer Option Option to open the blow valve when the plunger arrival time is later than normal. BV Plunger Arrival Time Limit Enter a time that is longer than the normal arrival time but not as long as the maximum arrival time which would be considered a failure. If the arrival timer reaches this Limit time before the plunger arrives, the blow valve will open. BV DP Low Page rev. AA
109 DP Blow Valve Option DP DP BV Limit Option to use differential pressure to open the blow valve Displays the current differential pressure. Enter a DP value that would open the blow valve when the differential pressure falls below this value. BV Casing Pressure Low Case Blow Valve Casing Open Limit Option to use casing pressure as a condition to open the blow valve. Displays the current casing pressure. Enter a casing pressure which will open the blow valve when the pressure falls below this set amount. BV Flow Rate Low Time Flow Rate BV Option Option to use flow rate to open the blow valve. Flow Rate Flow Rate BV Limit Low Time Limit Low Timer Displays the current flow rate. Enter a flow rate limit that will initiate the blow valve opening once the flow rate falls below the entered amount for the amount of time specified by the Low Time Limit. Enter a time frame that the flow rate must remain below before opening the blow valve. Displays the elapsed time since the flow rate was below the established limit. Timer will reset if flow rate goes above Flow Rate BV Limit before reaching the Flow Rate BV Low Time Limit. Inputs - Measurement Plunger Arrival Value Displays the number of elapsed seconds for the plunger arrival. Cal Hold? Displays Yes or No. Statistics Inputs/Strings Inputs - Pressures AP (AP at APvcb) DP User-defined field for Absolute Pressure User-defined field for Differential Pressure rev. AA Page 109
110 Line Pressure Tube (Tubing) Case (Casing) Barometer Pressure User-defined field for Line Pressure User-defined field for Tubing Pressure User-defined field for Casing Pressure User-defined field for Barometric Pressure (PSIG) Inputs - Derived Values Tube Line Case Line Case - Tube Load Ratio Current Value Foss Gaul Multiplied Turner Flow Rate Multiplied Current tubing minus line pressure differential. The Value column displays the casing minus line pressure. Current casing minus tubing pressure differential. Current load ratio value. (Case-tube)/(Case-Line) The Value column is the Foss Gaul multiplier which is used for tuning. The Limit column displays the Foss Gaul multiplied value which is the FG Raw Value times FG Multiplier. The Value column displays the multiplier that is multiplied against the calculated Turner unloading rate to determine the flow rate at which the valve will be closed. The Limit column displays the raw Turner calculated flow rate which is the flow rate that will carry fluids to the surface. Inputs - External Inputs Hold Input Value Open 1 Value Open 2 Value Close 1 Value Close 2 Value Value used to determine if valve should be held closed. User defines the Open 1 value (app/array/register) used for plunger. User defines the Open 2 value (app/array/register) used for plunger. User defines the Close 1 value (app/array/register) used for plunger. User defines the Close 2 value (app/array/register) used for plunger. Inputs - Valve Controller VC Cmd VC Features Displays the values for Valve Control Controller as set up in PCCU (VCI Cmd1) Displays the parameter settings for Valve Control as set up in PCCU (Features1) Strings Current State Displays the current state of the controller. Controller current states are as follows: Fail Indicates that plunger has failed to arrive. Closing Valve Indicates that the production valve is closing, and the system is waiting for the plunger fall delay to expire. Page rev. AA
111 Valve Closed Indicates the plunger fall delay has expired, and the system is waiting for an open valve condition to be initiated. Plunger Arriving Indicates that the production valve has opened, and the system is waiting for the plunger to arrive. Blow Valve Indicates that the plunger has not yet arrived, blow valve conditions have been met and a secondary valve has been opened. Plunger Arrived This is an instantaneous state that indicates that the plunger has arrived. AfterFlow Indicates that the production valve is open, the plunger has arrived and close conditions are waiting to be met. Max. State Timer Displays the maximum timer time for the current state. State Timer Displays the current timer time for the current state followed by the time limit for the current state. Max. O/C Timer (max open/close timer) Displays the Open/Close maximum time limit. O/C Timer (current open/close timer) Displays the Open/Close time counter. In Tube/In Plunger In Tube - Tube Values Temperature Flow rate Volume - Accum Enter temperature value. Enter flow rate value. Enter accumulated volume value. Today's Volume Enter today's volume value. Yesterday's Volume Z factor Enter yesterday's volume value. Enter z factor value. In Tube - Contract Hour Last Contract Hr Update Tube Last Contract Time Displays the date/time stamp of the update. Displays the date/time stamp of the last contract time rev. AA Page 111
112 Log Time Day End Flag Displays the Log Time (dd:hh:mm:ss). Enter the value for the Day End Flag (Wait or Log). In Plunger Total Cycles Displays the total cycles. Total Plunger Travel Displays the total plunger travel. Plunger Arrivals Today Last Lift Velocity Reset Date/Time Reset Plunger Counters Displays the plunger arrivals today. Displays the last lift velocity. Displays the reset date/time. User defined as No or Reset. Events Time Stamp Reason Value Displays the Time Stamp of the Event. Displays the Reason that caused the Event. Displays the app/array/register associated with the event. Total Cycles Averages Average Close Time Displays the average closing time of the last ten plunger arrivals. Average Close Case Displays the average closing casing pressure of the last ten plunger arrivals. Average Close Tube Displays the average closing tubing pressure of the last ten plunger arrivals. Average Close Line Average Close FR Average Close Vol Average Open Time Displays the average closing line pressure of the last ten plunger arrivals. Displays the average closing flow rate of the last ten plunger arrivals. Displays the average closing volume of the last ten plunger arrivals. Displays the average opening time of the last ten plunger arrivals. Average Open Case Displays the average opening casing pressure of the last ten plunger arrivals. Average Open Tube Average Open Line Average Open Vol AR Time Displays the average opening tubing pressure of the last ten plunger arrivals. Displays the average opening line pressure of the last ten plunger arrivals. Displays the average opening volume of the last ten plunger arrivals. Displays the time it takes for the plunger to arrive. Total CC Close Stamp Displays the Date/Time Stamp at the time of valve closure. Page rev. AA
113 Close Reason Close Time Close Case Close Tube Close Line Close Flow Rate Close Volume Open Stamp Open Reason Open Time Open Case Open Tube Open Line Open Volume AR Stamp AR Status AR Time Displays the reason for valve closure. Displays the time at valve closure. Displays the closing casing pressure. Displays the closing tubing pressure. Displays the closing line pressure. Displays the closing flow rate. Displays the closing volume. Displays the Date/Time Stamp at the time of valve opening. Displays the reason for valve opening. Displays the time at valve opening. Displays the casing pressure at valve opening. Displays the tubing pressure at valve opening. Displays the line pressure at valve opening. Displays the volume at valve opening. Displays the Date/Time Stamp of the valve arrival. Displays the Status of the valve arrival. Displays the Time of the valve arrival. Total OO (if displayed) Open Stamp Open Reason Open Time Open Case Open Tube Open Line Open Flow Rate Open Volume Close Stamp Close Reason Close Time Close Case Close Tube Close Line Close Volume AR Stamp Displays the Date/Time Stamp at the time of valve opening. Displays the reason for valve opening. Displays the time at valve opening. Displays the open casing pressure. Displays the open tubing pressure. Displays the open line pressure. Displays the opening flow rate. Displays the opening volume. Displays the Date/Time Stamp at the time of valve closure. Displays the reason for valve closure. Displays the time at valve closure. Displays the casing pressure at valve closure. Displays the tubing pressure at valve closure. Displays the line pressure at valve closure. Displays the volume at valve closure. Displays the Date/Time Stamp of the valve arrival rev. AA Page 113
114 AR Status AR Time Displays the Status of the valve arrival. Displays the Time of the valve arrival. Current/Daily Cycles Current Cycles - Open Valve Open Stamp Open Reason Open Time Open Case Open Tube Open Line Open Volume Displays Date/Time Stamp at time of valve opening. Displays reason for opening valve. Displays time of valve opening. Displays casing pressure value at time of valve opening. Displays tube pressure value at time of valve opening. Displays line pressure value at time of valve opening. Displays volume value at time of valve opening. Current Cycles - Plunger Arrival AR Stamp AR Status Average Case Average Tube Average Line Average FR Displays the date/time stamp of the plunger arrival. Displays the status of the plunger arrival (i.e. Normal) Displays the average casing pressure for the last ten plunger arrivals. Displays the average tubing pressure for the last ten plunger arrivals. Displays the average line pressure for the last ten plunger arrivals. Displays the average flow rate for last ten plunger arrivals. Current Cycles - Close Valve Close Stamp Close Reason Close Time Close Case Close Tube Close Line Close Flow Rate Close Volume Displays Date/Time Stamp at time of valve closure. Displays reason for closing valve. Displays time of valve closure. Displays casing pressure value at time of valve closure. Displays tube pressure value at time of valve closure. Displays line pressure value at time of valve closure. Displays flow rate value at time of valve closure. Displays volume value at time of valve closure. Current Cycles - Open Valve Open Stamp Open Reason Displays the Date/Time stamp at the time of valve opening. Displays the Reason for valve opening. Daily Cycles Today's Volume Yesterday's Volume Displays volume value since contract hour. Displays volume value during previous contract day. Page rev. AA
115 Total Cycles Since Reset Plunger Arrivals Today Plunger Arrivals Yesterday Closed Today Displays number of total cycles since last reset. Displays the total count of plunger arrivals that occurred since the contract hour. Displays the total count of plunger arrivals that occurred on the previous contract day. Displays time closed during the contract day. Closed Yesterday Displays time closed during the previous contract day. Open Today Displays time open during the contract day. Open Yesterday Displays time open during the previous contract day. Open Time Today Displays % of available time open during the contract day. Open Time Displays % of available time open during the previous contract day. Yesterday Close Time Today Displays % of available time closed during the contract day. Close Time Displays % of available time closed during the previous contract day. Yesterday Plunger Plunger Counts Plunger Normal Count Consecutive Normal Arrivals Fast Count Slow Count Late Count Fail Reason Date Keeps count of the number of times the plunger arrived within the Slow and Fast Arrival times. The count will increment until cleared by the Clear Plunger Counters. The Value column displays the number of consecutive arrival counts where the arrival time is between the Slow Arrival Time Limit and the Fast Arrival Time Limit. The count will reset if an arrival is outside this limit. Keeps count of the number of times the plunger exceeded its Fast Arrival time. The count will increment until cleared by the Clear Plunger Counters. Keeps count of the number of times the plunger arrived below its Slow Arrival Time. The count will increment until cleared by the Clear Plunger Counters. Displays the total number of late arrivals since the last reset plunger counter command was executed. Displays the Date/Time Stamp of the Fail Reason Date. Plunger Arrivals Today Displays the count of Plunger Arrivals since the Contract Hour. Plunger Arrivals Yesterday Plunger Arrivals Average Time Displays the count of Plunger Arrivals for the previous Contract Day. Displays the average arrival times for the last ten plunger arrivals rev. AA Page 115
 of the plunger arrival for the individual log entry. Displays the number of the Log entry. Page 116 2105166-001 rev. AA")
116 Plunger Arrivals Log AR Stamp Log AR Status Log AR Time Log # Displays the Date/Time Stamp of the plunger arrival for the individual log entry. Displays the Status of the plunger arrival (i.e. Normal) for the individual log entry. Displays the Time (elapsed seconds) of the plunger arrival for the individual log entry. Displays the number of the Log entry. Page rev. AA
117 Fail Fail Log Fail Stamp Fail Log Fail Reason Log # Displays the Date/Time Stamp of the failed action. Displays the Reason for the failed action. Displays the number of the Log entry rev. AA Page 117
118 Flt Pt Time Limits Status Max State Timer State Timer Max OC Timer OC State Timer Displays the state's maximum time limit. Displays the state's time counter. Displays the Open/Close maximum time limit. Displays the Open/Close time counter. Open Limits Flow Cycle Time Limit After Flow Time Limit Evaluation Time Limit Turner Low Time Limit The Value field displays the timer value as it counts up toward the Limit value in the Limit field. Displays the AfterFlow Timer Limit which will close the production valve when the AfterFlow Timer reaches this limit. The Value column displays the time that has elapsed since plunger arrival. When this value becomes equal to the Evaluation Time entered in the Limit field by the user, the Evaluation Flag is set to On. The Value column displays the amount of time that the current flow rate has been below Turner Flow Rate x Turner Rate multiplier. The timer is reset if the flow rate goes above the threshold. The flow rate has to be below for the amount of time entered in the Limit column. Page rev. AA
119 Casing Rise Time Limit Casing Evaluation Time Limit Casing Slope Time Limit Displays the Casing Delta Value Limit. The delta value must be above the Casing Delta Value Limit for the amount of time specified in the Casing Rise Timer Limit, before the valve is closed. The Value column displays a timer that commences counting after the Evaluation Limit time has expired and if the Casing Delta Value is above the Casing Delta Limit. If at any time before reaching the Casing Rise Timer Limit, the Casing Average falls below the Casing Delta Limit, the timer is reset and commences counting again. If the counter reaches the Casing Rise Timer Limit and the Casing Average is above the Casing Delta Limit, the production valve will close. Displays the Casing Slope Timer Limit. The Casing Slope Value must be above the Casing Slope Value Limit for the time specified by the Casing Slope Timer Limit before closing the production valve. Load Ratio Time Limit Displays the Load Ratio Timer Limit. The Load Ratio must be below the Load Ratio Limit value for this limit time before the production valve is closed. DP Low Time Limit Flow Rate Time Limit Tubing Close Time Limit SP Close Time Limit Close1 Time Limit Displays the DP Low Timer Limit. The current differential pressure must be above/below the DP Limit value for this DP Low Timer Limit amount of time before the production valve will close. The Value column displays the current flow rate. If the flow rate remains below the user specified Flow Rate Time Limit in the Limit column for the Flow Rate Timer Limit amount of time, the production valve will close. Displays the Tubing Close Timer Limit. The current tubing pressure must be above/below the Tubing Limit value for this Tubing Close Timer Limit time before the production valve will close. Displays the SP Close Timer Limit. The SP Current Value must be above/below the SP Limit value for the SP Timer Limit time before the production valve will close. Time that Close 1 must be above/below the Close 1 Limit before the valve is closed. Close1 Hold Time that Close 1 will DELAY a Hold or Force Open (not Hold Value). Time Limit Close2 Time that Close 2 must be above/below the Close 2 Limit before the valve is closed. Time Limit Close2 Hold Time that Close 2 will cause a HOLD. Time Limit Close Limits Plunger Fall Limit Time Limit field displays time limit for the fall time. Valve Close Check Time The Limit data is for setting the amount of time the flow rate has to stay above the Valve Close Check Setpoint before a valve close failure is declared. Hold Timer Limit Hold Once Time Limit Close Cycle Limit May replace Plunger Fall Delay. The Limit data allows for the entry of the time if Fixed will be used. The fixed time needs to be entered before enabling the Fixed option. The Limit column will also display the computed hold time if the 1 Cycle, 2 Cycle or 3 Cycle option is used. Enter the delay time in the Limit field to keep the valve closed after being closed rev. AA Page 119
120 The Limit field is for entering the SP Limit time. The SP Current Value must be SP Open Time Limit above/below the SP Limit value for the SP Limit time before the production valve will open. Mandatory Close Time Limit The Limit field will either display the time computed when the 1, 2, or 3 Cycle is selected or allow the user to enter a time when Fixed is selected. Load Ratio Open Time Limit The Limit field displays the user entered amount of time that the Load Ratio must be below the Load Ratio Limit value to open the valve. However, even if the timer reaches this Limit time, the casing pressure must be greater than the line pressure x Casing-Line Multiplier to open the valve. Tubing Open Time Limit Casing Open Time Limit The Limit field is the time the tubing pressure must be above or below the Tube Open Limit pressure before the valve is opened. The Limit field which is the time the casing pressure must be above or below the Casing Open Limit pressure before the valve is opened. Foss Gaul Time Limit Open1 Open Time Limit Time Limit field - Displays the Limit Time. The production valve will open if the casing minus line pressure is less than the Foss Gaul Multiplied Value for this Limit Time. The Limit field displays and allows user entry of the Open 1 Limit time which is the time the Open 1 Current value must be above/below the Open 1 Limit value before opening the valve. Open2 Time Limit Total Cycle Time Limit High Line Close Time Limit High Line Open Time Limit Close1 Time Limit Close1 Hold Time Limit Close2 Time Limit Close2 Hold Time Limit The Limit field displays and allows user entry of the Open 2 Limit time which is the time the Open 2 Current value must be above/below the Open 2 Limit value before opening the valve. The Limit field displays the total cycle time which is the total of the Flow Timer time and the Closed Timer time for the Auto mode or displays and allows for the user entered total cycle time for the Fixed mode. The Value field displays the elapsed time since the valve closed. The Limit field is for entering the time or delay since the valve closed before initiating the High Line Open Action parameter. The Value column displays the elapsed time since the production valve opened. The Limit field is for entering a time to wait after the production valve opens before checking the high line pressure and taking any actions. Time that Close 1 must be above/below the Close 1 Limit before the valve is closed. Time that Close 1 will DELAY a Hold or Force Open (not Hold Value). Time that Close 2 must be above/below the Close 2 Limit before the valve is closed. Time that Close 2 will cause a HOLD. Page rev. AA
121 Flt Pt Timers Arrival Times Arrival Timer Max Arrival Limit Slow Arrival Limit Fast Arrival Limit Min Arrival Limit Displays the elapsed time since the valve was last commanded open. The User will select a time format and enter the time in the Value field. The Limit field is for the user entry of the Max Arrival Time Limit. The Limit field is for the user entry of the Slow Arrival Time Limit. The Limit field is for the user entry of the Fast Arrival Time Limit. The Limit field is for the user entry of the Minimum Arrival Time Limit. Open Timers Flow Cycle Time Timer After Flow Timer Evaluation Timer Turner Low Timer Casing Rise Timer Casing Slope Timer The Value column displays the timer value as it counts up toward the Limit value in the Limit field. The Limit value is entered by the user and is the total open or flow time. The time begins when the production valve is opened and ends when the Limit time has elapsed. This will include arrival time for the plunger and AfterFlow time which is after the plunger arrives. The Value column displays the timer which commences counting at the beginning of the AfterFlow state. AfterFlow starts when the plunger arrives. The counter counts up to the Limit value entered in the Limit column by the user. Limit time is the amount of flow time requested by the user during the AfterFlow state. The Value column displays the time that has elapsed since plunger arrival. When this value becomes equal to the Evaluation Time entered in the Limit column by the user, the Evaluation Flag is set to On. The Value column displays the amount of time that the current flow rate has been below Turner Flow Rate x Turner Rate multiplier (see above regarding Packer Well selection). The timer is reset if the flow rate goes above the threshold. The flow rate has to be below for the amount of time entered in the Limit column. The Value column displays a timer that commences counting after the Evaluation Limit time has expired and if the Casing Delta Value is above the Casing Delta Limit. If at any time before reaching the Casing Rise Timer Limit, the Casing Average falls below the Casing Delta Limit, the timer is reset and commences counting again. If the counter reaches the Casing Rise Timer Limit and the Casing Average is above the Casing Delta Limit, the production valve will close. The Value column displays a timer that commences counting after the Evaluation Limit time has expired and if the Casing Slope Value is above the Casing Slope Limit. If at any time before reaching the Casing Slope Timer Limit, the Casing Slope falls below the Casing Slope Limit, the timer is reset and commences counting again when the Casing Slope is above the Limit. If the counter reaches the Casing Slope Timer Limit and the Casing Slope is above the Casing Slope Limit, the production valve will close rev. AA Page 121
122 Load Ratio Close Timer DP Low Timer Flow Rate Timer Tubing Close Timer SP Close Timer Close1 Timer Close2 Timer The Value column displays a counter which will commence counting at the plunger arrival time and count up to the user entered Load Ratio Close Limit time. The Load Ratio must be below the Load Ratio Limit value for this limit time before the production valve is closed. The Value column displays a timer that commences counting at the plunger arrival time if the current DP is below the DP Limit value. The counter will continue to count until the DP Low Timer Limit is reached. At this point the production value is closed. If at any time, the DP raises above the DP Limit value, the counter is reset and only starts counting again if the DP falls below the DP Limit value while in the AfterFlow state. The Value column displays a timer that commences counting at the plunger arrival time if the Flow Rate is below the Flow Rate Limit value. The counter will continue to count until the Flow Rate Low Limit time is reached. At this point the production value is closed. If at any time, the Flow Rate rises above the Flow Rate Limit value, the counter is reset and only starts counting again if the Flow Rate falls below the Flow Rate Limit value while in the AfterFlow state. If the current tubing pressure is above/below (per Close Action) the tubing pressure Limit value, the Value column timer will commence counting up to the Tubing Close Timer Limit time. If the counter reaches the Limit value, the production valve will close. If the tubing pressure changes such that it does not meet the Close Action criteria, the counter will reset and wait until the Close Action criteria is met again. The Value column displays a counter which commences counting when the SP Current Value is above/below the SP Limit value as specified by the SP Action parameter. If the counter reaches the SP Limit time, the production valve will close. If the static pressure changes such that it is not above/below the SP Limit value per the SP Action, the counter will reset and wait until the pressure reaches its Limit pressure again and commence counting. Displays the current Close 1 Timer value and Timer Limit. Displays the current Close 2 Timer value and Timer Limit. Close Timers Plunger Fall Timer Valve Close Check Timer Hold Once Timer Closed Timer SP Open Time Timer Mandatory Close Timer The Value field displays the elapsed time since the production valve was closed. This is a time delay to allow enough time for the plunger to reach the bottom after closing the production valve before going to State 2 (Closed). The Value field is a timer which displays the amount of time that the flow rate has stayed above the Valve Close Check Setpoint. The Value field displays the timer which starts at zero and runs through the duration of the Hold Once operation. Displays the elapsed time in the Value field since the valve was commanded closed and for the duration of the Limit value. The Value field displays the amount of time the SP Current Value has been above/below the SP Limit Value as selected by the Static Pressure Action parameter. The Value field displays a timer that tracks the time from the beginning of the Active state up to the end of the Limit time. Page rev. AA
123 Load Ratio Open Timer Tubing Open Timer Casing Open Timer Foss Gaul Timer Open1 Open Timer Open2 Open Timer Total Cycle Timer Close1 Timer Close2 Timer The Value field displays a timer that commences counting when the Load Ratio drops below the Load Ratio Limit value and continues counting until it reaches the time entered in the Limit column. If the Load Ratio should move back above the Load Ratio Limit, the timer will reset and only commence counting again when Load Ratio again drops below the Load Ratio Limit. The Value field displays the Limit timer which starts when the Low or High Open condition is met to open the valve and counts up to the Limit time (Limit field). The Value field displays the Casing Open timer which starts when the Low or High Open condition is met to open the valve and counts up to the Casing Open Limit time (Limit field). The Value field displays the amount of time that the casing minus line is less than the Foss Gaul Multiplied Value. The Value field displays a timer which is the amount of time that the Open 1 Current Value is above/below the Open 1 Limit value based on the Open Action selection. The timer increments until it reaches the Open 1 Timer Limit which will trigger the opening of the valve. The Value field displays a timer which is the amount of time that the Open 2 Current Value is above/below the Open 2 Limit value based on the Open Action selection. The timer increments until it reaches the Open Timer Limit which will trigger the opening of the valve. The Value field is a timer that starts at the beginning of the open time and runs until it reaches the end of the total cycle time, resets and starts again with the next open. The Value field displays the current Close 1 Timer value and is the amount of time in Hold or time value that has been above/below the Close 1 Limit. The Value field displays the current Close 2 Timer value and is the amount of time in Hold or time Value has been above/below the Close 2 Limit rev. AA Page 123

124 Flt Pt Log Times Log Close Cycle Log Open Cycle Log Arrival Time Log BV Time Log # Displays the elapsed time of the close valve cycle for each log entry. Displays the elapsed time of the open valve cycle for each log entry. Displays the elapsed time for the plunger arrival for each log entry. Displays the elapsed time since the plunger arrived in the Blow Valve state for each log entry. Displays the number of the Log entry. Trend System Overview It is now possible to create trend files not only in PCCU32 but also with the web. In addition the created files can be assigned to stations, sub-facilities and facilities using configuration or FMA. There are two major tabs for this application: Trend File and Setup Page rev. AA
 and 02W01PR (lower).")
125 Trend File The Trend Files pulldown menu, located under the Trend File table, allows the user to assign specific trend files to run for an established application group. Only two files can be selected for view at a time: one above and one below. In this example, the two files selected are 01W02TP (upper) and 02W01PR (lower). Each chart has two buttons over the right side as follows to control display of information: View Poll Type This button controls the display of data. The user may select either Grid or Graph. This button controls the time source of the data. The user may select either Historical or Real Time. Using the mouse to hover over the displayed data, the color-coded variables on the graph show date/time and value for any point selected. In this graph only one variable is displayed (Meter Temp in the upper graph and Gas DP in the lower one). A maximum of four variables can be plotted per graph at one time with the multiple y axis. The Options icon is located in the lower right corner of the graph and displayed only if there are more than four variables resident with the file. It allows the user to click on the icon and display an overlay of all variables present and change, if desired, the variables to display rev. AA Page 125
126 Setup From the Setup section, on the right side of the screen, the user can also add new Trend files using the first icon on the right side, modify an existing file with the second option or delete a file with the third. The following fields are read only and display information about the selected analysis file: File Name Description Default Scan Status Scan Period Log Period No. of Variables The user-defined name of the Trend File displays. A description of the Trend File displays with a user-defined description of the trend file (up to 25 characters). The default is either enabled or disabled by clicking on a check box from the Modify Trend box. The following are options for the Scan Status pulldown menu from the Modify Trend box: Off, On, OnTime, Trigger-AutoReset, Trigger-Freeze, Freeze, Frozen or Register.* This defaults to one second but is able to be changed by the user from the Modify Trend box. This defaults to one second but is able to be changed by the user from the Modify Trend box. This displays the number of variables assigned to the Trend File. The user can add or delete variables from the Modify Trend box. This displays the number of records assigned to the Trend File. You need to enter the No. of Records number of records you want although there may be a default. Required Space This displays the space required for the selected Trend File. *The options for the Scan Status are defined as follows: Off On OnTime Trigger - AutoReset Trigger - Freeze Freeze Frozen Register No scanning or data logging occurs. Scan and Log as specified by the Scan Period and Log Period. Log at specified time of day as specified by Log Time. Log Period becomes Log Time with this selection. Log while triggered. Resume logging if trigger returns after loss of trigger. Triggering mechanism is a trend variable specified by Log Trigger. Waits for trigger to start logging at which time enters Freeze state and keeps logging until trigger is lost. Enters the Frozen state with loss of trigger but will continue to log data for the amount of time as specified in Freeze Delay. Freeze is more of a status condition meaning that the trigger condition is met, and data is being logged; however, the Scan Status may have been put in the Frozen state intentionally by a Modbus Register or an App/Array/Register. Frozen is more of a status condition indicating that the trigger has been lost and logging will cease; however, the Scan Status may have been put in the Frozen state intentionally by a Modbus Register or an App/Array/Register. Logging is controlled by the specified App/Array/Register. A window will appear to the right of the Scan Status to enter the App/Array/Register. Expected values from the App/Array/Register are: 0 - Off, 1 - On, 2 - Ontime, 3 - Trigger-AutoReset, 4 - Trigger- Freeze, 5 - Freeze & 6 - Frozen. Page rev. AA

127 Analysis Trend File Overview The Trend Analysis File is used in conjunction with the Natural Gas Chromatograph (NGC) to analyze for customers the quality of the gas measured. The user can modify information to modify or create a new file using the trend buttons provided. Setup From the Setup section, the user can change the Trend Analysis file displayed. From the right side of the screen, the user can add a new Trend file using the first icon on the right side, modify an existing file with the second option or delete a file with the third. The following fields are read-only: File Name Description Flow Weight Tube App # Sample Source Scan Period Log Period The name of the Trend File displays. A description of the Trend File displays. If Enable displays, all components will be Flow Weighted as opposed to using a mean average of the sampled values. When Flow Weighted, each sampled value is multiplied times the Flow Rate, the products of these multiplications are added together and divided by the sum of the flow rates. If disabled, Flow Weighting is not applied. The Tube App # displayed is changed as needed from the Tube App # box in the Modify Trend box. Either Tube or Therms displays. If Therms is displayed, the user can change the Stream assignment from the Modify Trend box. Therms is not available for display if Flow Weight is Enabled. This field defaults to one second but is able to be changed by the user from the Modify Trend box. This field defaults to one second but is able to be changed by the user from the Modify Trend box rev. AA Page 127
128 Scan Status No. of Records No. of Components Required Space Component Type The following are options for the Scan Status pulldown menu from the Modify Trend box: (Tube selected as Sample Source: Off, Sync w/log Period or Synch w/day Period) or (Therms selected as Sample Source: Off, On or OnTime) This displays the number of records assigned to the Trend File. This displays the number of components assigned to the Trend File. This displays the space required for the selected Trend File. Display as Gross, Detailed or Custom. Selecting Gross or Detailed defaults to the standard components used by these two F(pv) methods. Modifying either list from the Modify Trend Box will cause Custom to display. When the file is opened at a later date, the Custom display indicates to the User that neither the Gross nor Detailed list is available to change and needs to be Custom built by the User. The list is generated by using the Increase/Decrease box for Min and Max percentages of each component. Coriolis Interface Overview The ABB Totalflow XSeries Coriolis (Gas) application allows an XSeries device (XFC or XRC) to interface with an ABB Coriolis transmitter and perform volume and corrected mass calculations. Mass flow from the Coriolis device, retrieved via Modbus protocol, is requested and utilized by the interface application to calculate corrected volume. Daily logs, hourly logs, characteristics and event logs are collectable, both locally and remotely from the Coriolis application's historical data (i.e. corrected volume, corrected mass, uncorrected mass, energy and alarms). PCCU (local PC user Configuration and Collection software) provides the user interface to the Totalflow XSeries device for configuration, calibration, collection and viewing of historical data, as well as the ability to view and edit parameters resident in the transmitter. The Coriolis Interface allows the user to enter the calibration pressure (PCal) and pressure effect (PEffect), which are then applied to mass flow to produce the corrected mass flow. Page rev. AA

129 Communication NOTE: Remember in order to setup communication for Coriolis Interface, please access PCCU. There are two major sections on the Coriolis Interface title page: Communication and Coriolis Devices. On this, the Communication section, four tabs are displayed (Setup, Statistics, Packet Log and Request Blocks) across the top of the page. Each tab with its relevant information is discussed as follows: Setup NOTE: Remember in order to setup communication for Coriolis Interface, please access PCCU. Setup Device/App ID Number of Devices Enter the name of the device with its App ID. Enter the number of devices instantiated with the device. Communications Port Port Type Enter the Serial Port that will be used for the Coriolis interface. This will typically be COM2. Select the type of port from the drop-down list. OnBoard Serial - Select if using one of the serial communication ports located physically on the device's main electronic's board. TCP/IP Client - Select if using the Ethernet port rev. AA Page 129
130 TFIO Serial - Select when using a TFIO communications module referred to as a Communications Interface Module (CIM). These will be mounted on a rail external to the main electronics board. Protocol Register Format Select a protocol from the drop-down menu. Modbus Host (ASCII) - Select when communicating with a Slave using Modbus ASCII protocol. Modbus Host (RTU) - Select when communicating with a Slave using Modbus RTU protocol. Modbus/TCP Client - A TCP Client initiates conversations with the server by asking the server to perform a task. (Host and Slave) Select the appropriate format from the drop-down list. 32 Bit Totalflow - 32 bit values are transferred as a single 32 bit register. Register list entries are biased one greater than standard Modbus (7002 = 7001 Standard). 32 Bit - 32 bit values are transferred as a single 32 bit register. 16 Bit Modicon - 32 bit values are transferred as two consecutive 16 bit registers. 16 Bit Word Swapped - 32 bit values are transferred as two consecutive 16 bit registers and swaps the order of the registers. 16 Bit ROS Modulo Multiplies the floating point number by 1000 and then divides by The integer portion (before the decimal point) goes into the first 16 bit register and the fractional portion (after the decimal point) goes in the second 16 bit register. Select the interface type from the drop-down list that will be used on this port. Available selections are: Interface Baud Rate Data Bits Parity Stop Bits Response Delay (ms) Xmit Key Delay (ms) Unkey Delay (ms) Timeout (ms) RS232 - Select if communicating via RS232. RS485 - Select if communicating via RS485. RS422 - Select if communicating via RS422. Click in the Value column, and select the Baud Rate from the drop-down list. Range is from 1200 to Selections are 7 or 8 data bits. Selections are None, Odd or Even Selections are 1 or 2 stop bits. Response Delay has to do with the turnaround time when responding to a Coriolis device. Its possible that, for example, a flow computer may respond before the Coriolis device is ready to receive data. In this case, a delay is needed before data is sent to the Coriolis device. If needed start with a short time, such as 10 milliseconds. Typically used when communicating via radio but can affect any communications equipment; this is a delay time to allow a radio's transmitter to stabilize after being keyed up before data is transmitted. This can typically be left at the default time of 420 milliseconds. Typically used when communicating via radio but can affect any communications equipment; this is a delay time to keep the radio's transmitter keyed up after the last data bit is transmitted. It can typically be set at approximately 10 milliseconds. If having problems communicating, enter a value here from milliseconds. This is the largest gap tolerated between characters within a packet. If this time expires, any partial packet is discarded, and the protocol looks for the beginning of a new packet. Page rev. AA
131 Switched V- Batt/Operate Retries Trailing Pad Directory This parameter selects the mode for Switched V-Batt and Operate. Both Switched V- Batt and Operate are switched voltage outputs and come from the same source with the exception that Operate has an on-board 500 ohm current limiting resister in series with it. They will turn on and off at the Listen Cycle frequency and is controlled by the communication Schedule if used. Enable - Allows the outputs to switch on and off with the Listen Cycle time. Additionally, allows the output to be controlled by the communication's schedule. Disable - Disables the outputs. Always ON - Causes the outputs to be on all the time. When initiating requests, specify the number of times to retry if the initial request fails. Trailing Pad allows the user to add zeroes to the end of a transmission sequence to make sure the transmission is accomplished before the remote device tries to respond. This is more for devices that have a quick turnaround time. This can be used in place of having an Unkey Delay. Select 2 bytes, 3 bytes or 4 bytes from the dropdown list. Specify a directory and path in the device for Request Block files. Typically, this would be under the directory associated with the communication port being used. Typically a default directory will already be specified. Statistics NOTE: Remember in order to setup communication for Coriolis Interface, please access PCCU. Displays the last poll loop time. If multiple devices, the time to poll all Previous Poll Loop Time devices. Minimum Poll Loop Time Keeps the minimum poll loop time of all polls. Maximum Poll Loop Time Keeps the maximum poll loop time of all polls. No. of Polls No. of Errors No. of Late Completions No. of Interrupts No. of Characters Received No. of Characters Transmitted Thread Priority 1st Priority The number of times the device tried to communicate with the devices. Displays the total number of times that communication with the polled devices was not successful. Displays the number of times the communication s poll failed to retrieve data from the device or devices within the scan time allotted. For example, if polling multiple devices once a second, then all the devices must be polled and data retrieved within the second. If the user is seeing multiple late completions, try reducing the time slightly on one of the parameters mentioned above. If the Number of Errors start to increase after changing a parameter, increase it until the Number of Errors stop. If Late Completions are still happening, try reducing one of the other parameters using the same scenario. Displays the total number of transmit/receive interrupts. Displays a running total of received bytes from the devices Displays a running total of transmitted bytes to the devices. Displays the priority of the protocol task. Displays the priority of the interrupt service thread rev. AA Page 131

132 Packet Log NOTE: Remember in order to setup communication for Coriolis Interface, please access PCCU. The Packet Log tab is included for troubleshooting purposes only. The information provided has only to do with Totalflow Remote protocol or Modbus protocol. Other than the number of errors and polls that are displayed at the bottom of the screen, the user would need a Totalflow Remote protocol and/or a Modbus document to understand the information that gets displayed. You might however be asked by a customer service representative for information provided on this screen. The information displayed on the screen is provided from a file maintained in the device. You can specify the number of records that are kept in the file by selecting one of the values for the Log Size from its pulldown menu to ensure only the newest records are kept. To receive any updated information after initially viewing the screen, you will be required to either click the Re-read button or check the Monitor button. The information displayed will only change if additional polls have occurred since the last time the information was read. Request Blocks NOTE: Remember in order to setup communication for Coriolis Interface, please access PCCU. The Request Blocks tab is for setting up information to poll a remote Totalflow device. The procedure is currently performed in PCCU. Coriolis Devices There are two major sections on the Coriolis Interface main page: Communication and Coriolis Devices. The drop-down menu in the upper left corner in the page allows the user to select the tube to be instantiated. Below this menu is a display of key flow parameters as follows: Page rev. AA
133 Mass Flow Rate Flow Direction This parameter displays the calculated mass flow rate through the Coriolis meter independent of the direction. The field is auto-populated by the application. Forward or Backward are the possible directions displayed depending on the polarity of the data. Positive polarity designates forward flow and negative polarity designates reverse flow. Forward Mass Flow Reverse Mass Flow This parameter is the Mass Flow Rate value from above, if forward flow, but is converted to kilograms per second for use by the Coriolis measurement application. This parameter is the Mass Flow Rate value from above, if reverse flow, but is converted to kilograms per second for use by the Coriolis measurement application. On this, the Coriolis Devices section, six tabs (Coriolis Data, Diagnostics, Mass Flow, Density One, Density Two and Temperature are displayed across the top of the page. A seventh (TSeries) tab is available with the pulldown arrow from the Temperature tab. Each tab with its relevant information is discussed as follows: Coriolis Data Mass Flow Correction Calibration Pressure PCal Pressure Effect PEffect This is the pressure at which the meter was calibrated; therefore, this defines the pressure at which there will be no effect on the calibration factor. Enter the calibration pressure from the designated Sensor Calibration document. If calibration pressure is not offered, enter a default of 30 PSIG. Enter the pressure effect for flow. Obtain the pressure effect values from the Product Data sheet for the user's particular sensor. Typically, the value ranges are from to %. At this time, PEffect MUST be entered as a positive (+) value. The Coriolis software automatically changes the value to negative. PCCU will display the value as positive under the Mass Flow Correction tab in the Characteristics section of the Historical Data. Tube App Setting Forward Tube App Reverse Tube App The parameter enables the user to specify the application number for Forward Coriolis Measurement tube. See the Applications tab located under the Station ID for this information. A Coriolis Measure application must be running for each forward and reverse application. Coriolis meters are bidirectional; therefore, a meter may require both a forward and reverse application. Enables the user to specify the application number used for the Reverse Coriolis Measurement tube. See the Applications tab located under the Station ID for this information. A Coriolis Measurement application must be running for each forward and reverse application. Coriolis meters are bidirectional; therefore, a meter may require both a forward and reverse application. Setup Modbus Address Enter a unique Modbus address for each Coriolis device rev. AA Page 133
134 Modbus Scan Enable Engineering Units Use Serial Link Communication Errors Limit Fixed or Last Good Value on Error Fixed Mass Flow Rate Value Read Configuration Parameters When set to Yes, this parameter allows the Coriolis device to start communications between the Coriolis device and the flow computer. This parameter indicates whether the Coriolis meter is configured to provide data in US or SI (European) units. This parameter is configured by the user. Coriolis meter data is available via a Modbus serial link or through a Pulse Input. Select Yes from the drop-down menu to use the Modbus link or No to use a Pulse Input. Specify the number of consecutive communication errors allowable. Whenever the limit is met, either the fixed or last good value, as specified below, will be used. The user is given the option of selecting either Last Good or Fixed value to be used as the Mass Flow Rate, under the General tab, whenever the Communication Errors Limit is met. If the user has selected Fixed Value to be used for the Mass Flow Rate, the value entered here will replace the Mass Flow Rate value under the General tab. Select Yes from the drop-down menu to read all configuration parameters from the Coriolis transmitter. Values may be confirmed by clicking the Mass Flow, Density and Temperature tabs found in Configuration on the Coriolis Interface tree. Diagnostics General Current Comm Status Number of Polls Number of Errors Number of Polls Number of Errors Consecutive Comm Error Limit Met The current communication status for this particular device. This parameter displays the number of attempted Modbus requests for the current Alarm Cycle. Displays the number of communication errors for the current Alarm Cycle. This displays the number of attempted Modbus requests for the current Contract Day. This parameter displays the number of communication errors for the current Contract Day. When the number of consecutive communication errors is met, the value displayed reverts to Yes. The first good communications value causes this to automatically switch back to No. Device Alarm Transmitter Electronics Failure Zeroing In Progress Slug Flow Power Reset Occurred Transmitter Configuration Changed Transmitter Configuration Warming Up EPROM Checksum Failure RAM Diagnostics Failure Sensor Failure The Coriolis Device Alarms screen is the area where the user can find information on any failures or resets that have occurred with a device. If any value is set to Yes within any of the alarm types, the alarm is posted to the tube's Historical Data Daily and Log Period Collect. When the failure or reset is resolved, the value is automatically changed back to No. Page rev. AA
135 Temperature Sensor Failure Input Overrange Frequency/Pulse Output Saturated Transmitter Not Configured Real-Time Interrupt Failure Primary ma Output Saturated Secondary ma Output Saturated Primary ma Output Fixed Secondary ma Output Fixed Density Overrange Zeroing Failure Zero Value Too High Zero Value Too Low Mass Flow Damping Period Low Flow Cutoff Flow Calibration Factor FCF Flow Temperature Coefficient FT Meter Factor Mechanical Zero The number of seconds over which the reported mass flow rate will change to reflect 63% of the change in the actual process. The default is set to 3.2 seconds. The user is able to input a new value into the Value field and then send the new value to the Coriolis meter by selecting Yes in the last column and clicking the Send button. This value will be considered zero mass flow rate by the Coriolis meter. The user is able to input a new value into the Value field and then send the new value to the Coriolis meter by selecting Yes in the last column and clicking the Send button. The default is set to 0.0 with a recommended setting of % of the sensor's rated maximum flow rate. This is a required value that characterizes the Coriolis meter for the particular sensor it is using. One of the required values that characterizes the Coriolis meter for the particular sensor it is using. The adjustment to be applied to the mass flow process variable. The default is set to 0.0. This parameter displays the zero value derived from the most recent zero procedure. Density One Measured Density This parameter details the density read per second from the Coriolis device. Damping Period Low Density Cutoff The number of seconds over which the reported mass flow rate will change to reflect 63% of the change in the actual process. The default is set to 3.2 seconds. The user is able to input a new value into the Value field and then send the new value to the Coriolis meter by selecting Yes in the last column and clicking the Send button. The density value at which the Coriolis application considers zero density. The default is set at 200 kg/m3 (12.48 lb/ft3). The range is specified between kg/m3 ( lb/ft3) rev. AA Page 135
136 Slug Duration High Slug Limit Low Slug Limit Density Meter Factor The number of seconds the Coriolis waits for a slug flow condition (outside the slug flow limits) to return to normal (inside the slug flow limits). The default is set to 0.0 with a range from 0.0 to 60.0 seconds. The density value above which a condition of slug flow exists. Typically, this is the highest point in the normal density range of the process. The default is set to 5.0 g/cm3, with a range of g/cm3. The user needs to use g/cm3 to configure this parameter, even if configured. The density value below which a condition of slug flow will exist. Typically, this is the lowest point in the normal density range of the process. The adjustment to be applied to the density process variable. Density Two Flowing Density Factor FD Temperature Coefficient DTC Low Density Calibration D1 Temperature Corrected Tube Period K1 High Density Calibration D2 Temperature Corrected Tube Period K2 FD is the correction factor for the effect of flow on density. Enter the FD value stamped on the sensor tag. Default value is 0.0. DTC is one of the values required to characterize certain meters for the particular sensor it is using. If your sensor tag does not show a DTC or TC value, enter the last 3 digits of the density calibration factor. D1 is one of the values required to characterize certain meters for the particular sensor it is using. Enter the Dens A or D1 value from the calibration certificate. This value is the line-condition density of the low-density calibration fluid. Some meters use air. K1 is one of the values required to characterize certain meters for the particular sensor it is using. If your sensor tag does not show a K1 value, enter the first 5 digits of the density calibration factor. Example: From the Sensor tag, the Density Calibration Factor, denoted as Dens Cal Factor, is Enter D2 is one of the values required to characterize certain meters for the particular sensor it is using. Enter the Dens B or D2 value from the calibration certificate. This value is the line-condition density of the high-density calibration fluid. Some meters use water. K2 is one of the values required to characterize certain meters for the particular sensor it is using. If your sensor tag does not show a K2 value, enter the second 5 digits of the density calibration factor. Example: From the Sensor tag, the Density Calibration Factor, denoted as Dens Cal Factor, is Enter Temperature Damping Period Calibration Slope The number of seconds over which the reported mass flow rate will change to reflect 63% of the change in the actual process. The default is set to 3.2 seconds. The user is able to input a new value into the Value field and then send the new value to the Coriolis meter by selecting Yes in the last column and clicking the Send button. This field details the slope value used to adjust the temperature process variable. Page rev. AA
137 Calibration Offset External Temperature This field details the offset value used to adjust the temperature process variable. Yes: Temperature data from Coriolis sensor is used. No: The temperature data from a different temperature device is used. If Enabled is specified, a Source field displays. Use the select TLP dialog box to specify the temperature source. The Value field displays the current temperature value for the specified source. TSeries Temperature Corrected Tube Period K3 Temperature Corrected Tube Period K4 Density Calibration D3 Density Calibration D4 FTG FFQ DTG DFQ1 DFQ2 See Micro Motion's T-Series manual for K3 calibration. See Micro Motion's T-Series manual for K4 calibration. See Micro Motion's T-Series manual for D3 calibration. See Micro Motion's T-Series manual for D4 calibration. See Micro Motion's T-Series manual. See Micro Motion's T-Series manual. See Micro Motion's T-Series manual. See Micro Motion's T-Series manual. See Micro Motion's T-Series manual. AGA-3 Overview The Totalflow Fourth Generation XSeries flow computers (XFCG4) provide functionality though the convergence of RTU, PLC and flow computer concepts. The XFCG4 represents a unique milestone in the development of remote, low power measurement and control devices. All XFCG4 units feature multi-tube capacity --up to eight per individual unit or 20 tubes per unit in special cases-- with custodytransfer measurement features. The flexibility of these units, including backward compatibility with legacy Totalflow systems, allows the user to increase productivity and improves asset utilization. While the XFCG4 is designed for either differential (orifice) or pulse (linear) metering, the following information concentrates solely on differential pressure as it regards the AGA-3 standard. The AGA-3 standard provides a procedure for the measurement of natural gas, hydrocarbons and other related fluid flows using flange tap and pipe tap orifice meters. Additionally, AGA-3 provides the standards for the construction and installation of orifice plates, meter tubes and associated fittings and the instructions for computing the flow of natural gas and hydrocarbon fluids through orifice meters. The standard, user-configurable calculations include AGA-3 (1985 vintage), AGA-3 (1992 vintage), Nx19, AGA-8-Gross and AGA-8-Detail methods for computing supercompressibility. It should be noted that all measurement, math and data storage functions either meet or exceed the requirements of the API 21.1 Electronic Gas Flow Measurement standard and Industry Canada Legal Metrology Branch rev. AA Page 137
 AGA-3 measurement applications instantiated per comm channel on the XFCG4 board.")
138 The user can also use the general information displayed as a snapshot of the current existing values for each parameter listed. There can be up to eight (8) AGA-3 measurement applications instantiated per comm channel on the XFCG4 board. The fields displayed here are as follows: Tube Description Yesterday's Volume This is the user-designated description of the tube. This serves as an aid for the user when there is more than one tube application running in a single device. This is the prior Contract Day's volume. The Contract Day is defined as a 24-hour period that establishes the parameters for a complete day. Today's Volume Flow Rate This value is updated at the end of each Volume Calculation Period. The Volume Calculation Period represents the rate at which the volume is calculated based on one second averages of the static pressure, differential pressure and temperature. At the end of this period, the average value of the extension (portion of the flow rate equation that is integrated each second) is multiplied by other factors in the AGA-3 equation to arrive at the flow rate for the Volume Calculation Period. The flow rate is then multiplied by the Volume Calculation Period. Every Volume Calculation Period volume is added to the current volume for the duration of the Contract Day. This field displays the estimated flow rate based on the current integral (portion of the flow rate equation that is integrated each second) and the last calculated integral multiplier. The user can establish the parameters for the AGA-3 application using the read/write fields provided. These parameters are as follows: The contract hour is the start of the day for daily volumes expressed in military Contract Hour time (0-23). From the drop-down list, select the location (upstream, downstream) of the SP tap SP Tap Location in relation to the orifice plate. Calculation Type Select the desired calculation type (e.g., AGA3-2012) Page rev. AA
139 Orifice Diameter Enter the orifice diameter size in dimensional units. Pipe Diameter Enter the pipe diameter size in dimensional units. Select the desired supercompressibility method. (NX19 fixed FtFp, NX19 GCN, NX19 GCNM, NX19 Auto, etc.) FPV Method Available Fpv methods are: AGA8 Gross Method 1 - This method uses Gross Heating Value, Relative Density and Carbon Dioxide. AGA8 Gross Method 2 - This method uses Relative Density, Nitrogen and Carbon Dioxide. AGA8 Detail 92 - This method basically supports a total analysis. ISO This method supports total analysis as specified in the international standard ISO SGERG88 - This method adheres to the international standard ISO For this method to be viable, one of the following base conditions must exist: 0 C / 32 F and bar / psi 15 C / 59 F and bar / psi C / 60 F and bar / psi C / 60 F and bar / psi For detailed information on these methods, see the American Gas Association, Report No. 8 / American Petroleum Institute Chapter 14.2 and/or ISO Standards and The graph includes the four variables displayed in individual colors: Static Pressure (SP), Differential Pressure (DP), Temperature and Flow Rate. The six tabs displayed horizontally at the top of the page include important displayed data as well as read/write fields the user would need to set up functions such as Analysis or Calibration. Seventh (Configuration), eighth (Adv Setup), ninth (Digital Output), tenth (Orifice) and eleventh (Last Calc Values) tabs are accessible by selecting the pulldown arrow to the right of the Calibration tab. The user can re-select the arrow to re-display the Calibration tab (information) or select the remaining tabs. Each tab with relevant information is discussed as follows: RealTime Here the color-coordinated displays of each variable would be charted on the graph. By clicking on the individual variable's box below the chart, it will be displayed or removed from the chart as the situation dictates. The Points button is used to set the density of the displayed graph, the higher the number of points, the more accurate the graph displayed. The View button can be used to either display the variable in a Graph (as currently shown) or a Grid format. There is an option to expand/collapse the Graph view. The Expand button shall expand the graph to full screen. The Collapse button will return the graph to normal view. Day The Day tab displays information for the user that is based on the accumulated daily totals for the meter rev. AA Page 139
140 The Day button allows the user to set the number of days displayed at one time. The user can select the View button to display the charted information in a Graph or Grid format. The user can hover the mouse cursor over any portion of the graph display to display the value and date/time of the variable reading. (This can also be done for any of the displayed variables on the graph.) There is an option to expand/collapse the Graph view. The Expand button shall expand the graph to full screen. The Collapse button will return the graph to normal view. Legends are selectable under graph. In case the graph has more than four parameters, an option is provided on the bottom of the graph to select up to four possible variables for plotting in overlay and once selected, they will be shown on the bottom of the graph as legends (selectable). A minimum of one variable is to be selected. The parameters possible to display from the Options icon are as follows: DP SP TF Volume Integral Energy DP Min DP Max DP Percent Low DP Percent Hi SP Min SP Max SP Percent Low SP Percent Hi TF Min TF Max This field represents the differential pressure. The value shown is the average of one second samples for the day. This field represents the static pressure. The value shown is the average of one second samples for the day. This field represents the flowing temperature. The value shown is the average of one second samples for the day. The Volume values are the sum of all the volume quantities that are calculated for each Volume Calculation Period during the Contract Day. The Integral value represents the portion of the flow rate equation that is integrated each second. The volume period computation made by the computer is the product of C and the integrated extension (AGA 1985) or the integral multiplier and the integrated extension (AGA 1992). This value represents the sum of energy quantities (MMBTU) that are accumulated since the beginning of the Contract Day. This is updated at the end of each Volume Calculation Period. At the end of the Volume Calculation Period, the energy quantity is calculated by multiplying the Volume Calculation Period volume by the energy content. Minimum Differential Pressure recorded during the Contract Day. Maximum Differential Pressure recorded during the Contract Day. Displays the percentage of time the Differential Pressure was below the low limit during the Contract Day. Displays the percentage of time the Differential Pressure was above the high limit during the Contract Day. Minimum Static Pressure recorded during the Contract Day. Maximum Static Pressure recorded during the Contract Day. Displays the percentage of time the Static Pressure was below the low limit during the Contract Day. Displays the percentage of time the Static Pressure was above the high limit during the day. Minimum Temperature recorded during the Contract Day Maximum Temperature recorded during the Contract Day Page rev. AA
141 TF Percent Low TF Percent Hi Period Time Flow Time Back Flow Displays the percentage of time the Temperature was below the low limit during the Contract Day. Displays the percentage of time the Temperature was above the high limit during the Contract Day. If Day Period, enter the frequency at which the trend data is logged. The format is hh:mm:ss in which one second is the fastest allowable time. It is recommended that Log Periods not be set faster than is necessary to conserve the device s processor time. Also, the more frequent the Log Periods, the faster the available memory of the device is used. Number of one second samples where DP is above zero cutoff, divided by the number of one second samples in a day, times 100 (rounded to the nearest.5 seconds). Number of one second samples where DP is at least three inches below zero. Log Log The Log tab provides information for the log period records (typically hourly records) for the selected meter. The user can select the View button to display the charted information in a Grid (default) or Graph format. The user can hover the mouse cursor over any portion of the graph display to display the value and date/time of the variable reading. (This can also be done for any of the displayed variables on the graph.) There is an option to expand/collapse the Graph view. The Expand button shall expand the graph to full screen. The Collapse button will return the graph to normal view. Legends are selectable under graph. In case the graph has more than four parameters, an option is provided on the bottom of the graph to select up to four possible variables for plotting in overlay and once selected, they will be shown on the bottom of the graph as legends (selectable). A minimum of one variable is to be selected. The parameters possible to display from the Options icon are as follows: DP SP TF Integral Volume Energy Flow Time Period Time This field represents the differential pressure (in H2O). This field represents the static pressure (PSIA). This field represents the flowing temperature (Deg F). The Integral value represents the portion of the flow rate equation that is integrated each second. The volume period computation made by the computer is the product of C and the integrated extension (AGA 1985) or the integral multiplier and the integrated extension (AGA 1992). This field displays the totalized volume (MCF). This value represents the sum of energy quantities (MMBTU). Number of one second samples where DP is below zero cutoff, divided by the number of one second samples in a day, times 100 (rounded to the nearest.5 percent). If Log Period, enter the frequency at which the trend data is logged. The format is hh:mm:ss in which one second is the fastest allowable time. It is recommended that Log Periods not be set faster than is necessary to conserve the device s processor rev. AA Page 141
142 time. Also, the more frequent the Log Periods, the faster the available memory of the device is used. Event The Event tab provides a table of events from the selected meter. The information is presented as one line per event with a date and time stamp. The Day button allows the user to set the number of days displayed at one time. The parameters displayed in this chart are as follows: Date/Time Event Old Value New Value SN Displays the date and time to the nearest second for the beginning of the event. This field displays the type of event that occurred. This field represents the value or condition that existed prior to the event. For a DP or SP check, this shows the actual reading (manually entered by the technician) when a test pressure is applied. This field represents the value or condition entered by the technician. For a DP or SP check, this is the test pressure applied on the transducer. If displayed, this is a sequence number assigned to each event. The numbers should be in sequence and if there is a gap in the sequence, it could signal a problem. Analysis The Analysis tab provides information on the composition elements and other parameters of either Fixed or Live analysis or Advanced Setup. The user can opt to view any option by selecting the corresponding button. In Fixed analysis, the user can use the Edit All option to the right of any of the sections on the screen to edit each or all of the fields to set the individual percentage of each variable. These sections include the Composition Elements, Gas Properties and Others. The Composition Elements deal with those potential components of the gas being measured. The user would enter the percentage of the whole that each component would represent. The aggregate of all measurement input should be 100%. The Gas Properties section fields are either set by the user or displayed in the field itself. These six fields are as follows: Heating Value Real Specific Gravity Viscosity Pressure Base Temperature Base Z of Air Calculation of Energy is based on Volume or Mass. Energy is calculated by multiplying the Heating Value times the Volume or Mass. Ratio of the density of the material to the density of the water A default standard value of is used but can be edited by the user. 1 atmosphere / PSIA or kpa 1 atmosphere / PSIA or kpa. The Base Pressure is based on the API 11.1 standards. 60 degrees F base temperature is based on the API 11.1 standards Z of Air measured at the contractual values for pressure base and temperature base. Enter a value for the Z or Air. This is the compressibility of air at a reference temperature (Typ. 60 degrees). The default standard is The Others section also has three editable fields as follows: Page rev. AA
143 FPV Method Fp for NX19 Fpv Ft for NX19 Fpv FPV method is then squared (Fpv2) to derive the compressibility factor (Fs) for pulse meters. Available FPV methods are: AGA8 Gross Method 1 - This method uses Gross Heating Value, Relative Density and Carbon Dioxide. AGA8 Gross Method 2 - This method uses Relative Density, Nitrogen and Carbon Dioxide. AGA8 Detail 92 - This method basically supports a total analysis. ISO This method supports total analysis as specified in the international standard ISO SGERG88 - This method adheres to the international standard ISO For this method to be viable, one of the following base conditions must exist: 0 C / 32 F and bar / psi 15 C / 59 F and bar / psi C / 60 F and bar / psi C / 60 F and bar / psi For detailed information on these methods, see the American Gas Association, Report No. 8 / American Petroleum Institute Chapter 14.2 and/or ISO Standards and Calculate and enter the value here for Fp to include the Pressure Base factor in the volume calculations. Calculate and enter the value here for Ft to include the Temperature Base factor in the volume calculations. In Live analysis, the user relies on real time data as displayed in each field under the Live column. As in Fixed Analysis, the aggregate of all the values displayed should be 100% The same values are displayed in each. The Advanced Setup option includes both the Analysis and Therms Setup. In the Analysis Setup, the first three user defined fields deal with the type, error conditions and wait time for live data. The multiple configuration parameters default to use the fixed values although multiple options are available for the user. The Therms Setup allows the user to select the fields to assign required values for the assigned fields. These fields are defined as follows: Attached to Stream # Stream ID Analyzer Modbus ID or Btu Stream Unit # If using analyzer data from a Master, select the stream number to use. If not using analyzer Enter four numeric numbers to help uniquely define the measurement tube's stream ID (e.g., 1234). Each measurement tube must have a unique stream ID. The tube's complete stream ID is composed of the four digit stream ID assigned here, the analyzer Modbus ID and the stream number currently attached (e.g., ). If this tube application is running on a flow computer, enter the Modbus ID of the external Therms analyzer. If this tube application is running on an NGC and the source of the analysis data is a Btu application, enter the Btu Unit Number. If this tube application is running on an NGC and the source of the analysis data is a Therms application, enter the Modbus ID of the external Therms analyzer. Stream Source App Enter the application number of the application providing the analysis information. This can be a Therms Master, Therms Slave or a Btu Stream application. A Btu Stream application only applies to an NGC rev. AA Page 143
144 Calibration The Calibration tab provides necessary information to assist the user in completing the calibration process and a resulting report. With the tab selected, the Select Calibration Type button is initially selected to display the desired calibration check. To start the calibration, select the type. Note the display of the Calibration Options fields changes depending on the calibration type selected as follows: The user selects a tolerance value equal to a desired % of the range; a warning Tolerance (% message will display if the difference between the measured value and entered value Diff) exceeds this value. (applies to the following calibration checks: DP-SP, Differential Pressure, Static Pressure, Temperature/RTD) When the user elects to move into Calibration mode, the tube immediately moves into Hold Timer mode. The Hold Time Out (seconds) field allows the user to set a time frame (in seconds) from which to take the tube out of hold. The default is set to 3600 Hold Timer seconds (1 hour), but the user can establish a different time frame based on their individual needs. It should be noted that the timer starts as soon as the user moves into Calibration mode. (applies to the following calibration checks: DP-SP, Differential Pressure, Static Pressure, Temperature/RTD) Calibration Points Do you want to calibrate using Absolute? Barometric Pressure Temperature Bias The user would select the number of calibration points from this field. Options are 3 Points or 5 Points depending on the desired accuracy of the calibration. With the setup complete, the 3 or 5 point Target pressure values will be calculated for convenience. These are suggested because of being evenly spaced across the calibration range, but it is not mandatory that these be used. (applies to the following calibration checks: DP- SP, Differential Pressure, Static Pressure, Temperature/RTD) This option is simply an aid for doing checks. Selecting gauge allows the user to enter values directly from the test pressure without having to add the barometric pressure which is automatically included. (applies to the following calibration checks: Static Pressure) This value is subtracted from Absolute pressure readings when calibrating the static pressure in gauge pressure and for displaying the static pressure in gauge on the device s display. This value is also entered on the calibration screen when calibrating in gauge pressure. (applies to the following calibration checks: Static Pressure) If the user elects to use Temperature/RTD as a calibration method, select the Temperature Bias field under Calibration Options. This allows the user to enter a new Page rev. AA
 The user would change the value of any of the fields displayed for the check selected as needed.")
145 value. The RTD's temperature will always be biased by this value. (applies to the following calibration checks: Temperature/RTD) The user would change the value of any of the fields displayed for the check selected as needed. Then the Start Calibration button would be selected to start the process. The DP-SP Check screen was designed as a troubleshooting tool so that the static pressure could be varied while at the same time, recording the differential pressure. Any significant change in the DP while changing the SP indicates a problem. The applied static pressure will be displayed in the SP window as well as the differential pressure in the DP window. Clicking on the check mark box will accept the pressures. Repeat the process to enter the number of static pressure points desired. If it's decided that a re-zero is needed before any more checks, click the RE-ZERO tab and a screen will appear to allow the user to re-zero the transducer and return to the Checks screen. The RE-ZERO function shifts up or down the calibration range so that the low end is true zero. The buttons with X's can be used to delete the selected entries from the log until the desired entries are input. Select the Accept & Finish button to complete the entry process which will save the checks as the "As Found" and "As Left" and log the check events. The user can now "Abort" to finish or select the "Add to Report & Finish" button to send the data to reports and finish rev. AA Page 145
146 Page rev. AA

147 The DP Calibrate screen allows for doing checks or doing checks and a calibration. Start with doing checks and then continue with the calibration if needed. The As Found checks are created by applying different test pressures across the calibration range. For each test pressure applied, enter the test pressure in the Test box and click the Check Mark. The live reading will be displayed in the Live/Found box and be captured along with the entered Test value when the Check Mark is clicked. The % difference between the Test value and the live value will also be displayed. Repeat the process to enter the number of points desired. If checks are all that are required, click "Accept and Finish" or "Continue to Calibrate" to do a calibration rev. AA Page 147
148 If the user elected to calibrate, the Calibrate screen will display with the points plotted and listed in a table. If a 3-point calibration had been selected in setup but had done more than three checks, the user would have the option to check the boxes of desired points to use for the calibration. If however, a 3-point calibration was set up and three checks were done, naturally there is no option. Click the Calibrate button to continue. Page rev. AA
149 After the calibration, the user will need to do additional checks referred to as "Verify." Use the same procedure as when doing the first checks, typically using the same pressures. If satisfied after doing the verify checks, selecting the Accept & Finish button will complete this calibration. If not satisfied, the user can select the Re-calibrate button to return to the Calibrate screen. If the user wants to start the process over, the Abort button would be selected instead. With the SP Calibration Check, the process is the same as the DP check. The final Calibration Check is the Temperature/RTD. The process is also the same as the DP Calibration Check and the SP Calibration Check rev. AA Page 149
150 With a completed calibration, the appropriate box or boxes would be checked. The user could then select the Generate Report button to generate a report in HTML. Configuration The user can select the Configuration tab to access the read/write and read only fields used to set up data needed for configuration. The following eight (8) areas of fields are accessible to the user: Constants Factors Density Commands Log Capacity Setup Current Values Limits The following information is provided in relation to all parameters and their fields: Constants Orifice Diameter Pipe Diameter Pressure Base (Pb) Auxiliary Factor (Faux) Fixed Cd Use Fixed Sp On Error Fixed Sp Z of Tb and Pb Barometric Pressure SP Tap Location Enter the orifice diameter size in dimensional units. Enter the pipe diameter size in dimensional units. Enter the Pressure Base in the units specified. A specific Pressure Base value may be required because of contractual agreements. This value is used when the Faux factor is turned on. Faux is simply a multiplication factor times the computed gas volume that can be used to correct for a known error condition. This factor is typically used for what is referred to as the Full Well Stream Factor. This is used to adjust the computed gas volume downward to account for the portion of the measured stream that is liquid. If Use Calc Cd is not selected, this fixed value for Coefficient of Discharge is used. A typical value is Select Yes to use the Fixed Sp Value if the Static Pressure exceeds the Sp High Error value or drops below the Sp Low Error value; otherwise, select No. Enter a static pressure to be used when the Use Fixed Sp On Error field is selected. Z of Air at the contractual values for pressure base and temperature base. The user would enter a value for the Z of Air. This is the compressibility of air at a reference temperature (typically 60 degrees F.) The default standard is This value is subtracted from Absolute pressure readings when calibrating the static pressure in gauge pressure and for displaying the static pressure in gauge on the device s display. This value is also entered on the calibration screen when calibrating in gauge pressure. Select the location (upstream, downstream) of the Sp tap in relation to the orifice plate. Page rev. AA
151 Enter the Temperature Base. A specific Temperature Base may be required Temperature Base (Tb) because of contractual agreements. Viscosity A default standard value of is used but can be edited by the user. Specific Heat Ratio Enter the Specific Heat Ratio. This is Cp divided by Cv. A typical value is 1.3 Select the Orifice Plate material type from the drop-down list. A standard expansion coefficient is used based on the material type. Three standard material types are provided (Stainless Steel, Monel and Carbon Steel). If an orifice plate is used that consists of a different material, the user must select Orifice Coef Exp "Other" and enter an Expansion Coefficient in the units as specified by the Expansion variable group on the Units tree view item. Move the decimal point 6 places to the right and enter in the format of (x.xx) which is then scaled by the flow computer to x.xx times A standard expansion coefficient is used based on the material type. Three standard material types are available (Stainless Steel, Monel & Carbon Steel). If pipe is used of a different type material, the user must enter an Pipe Exp Coef Expansion Coefficient in units. Move the decimal point 6 places to the right, and enter in the format of (x.xx) which is then scaled by the flow computer to x.xx times E -6. Enter the value in units as specified by the Units column. A decimal point is DP Zero Cutoff allowed. No volume calculations will occur when DP is below this value. Basic Orifice Factor (Fb) Orifice Material Tap Type Used in the AGA equation when Fb Calculation is set to Auto on the Factors tab. Re-calculated by PCCU when the orifice size, pipe size, tap type or tap location is changed. Select between Stainless or Monel for the orifice plate material. Used in AGA equation. Select Flange or Pipe tap. Used in AGA equation. Factors Use Fpv Use Y Use Fw Use Faux Use Calc Cd Compressibility factor - Select Yes for the flow computer to calculate, and use this factor based on the Fpv method selected. Expansion factor (Y) - Select Yes for the device to calculate, and use this factor in the volume calculations. Water Vapor factor (Fw) - Select Yes for the device to calculate, and use this factor in the volume calculations. Used to adjust the computed gas volume downward to account for the portion of the measured fluid stream that is water in vapor phase. If supported, see the Water Constants tab for additional setup. Full Well Stream Factor (Faux) - Select Yes for the device to use the Faux value entered by the user in the Constants tab. Typically, used as a Full Well Stream factor which is used to adjust the computed gas volume downward to account for the portion of the measured fluid stream that is liquid. The user enters a value which will be used as a direct multiplier when calculating the volume. For example, a value of 0.9 would result in a volume reduction of 10%. The percentage liquids in the stream is typically determined by a Full Well Stream Test. Since Faux is a direct multiplier to the volume, it can be used for any correction to the volume not accounted for in the basic equation. Coefficient of Discharge factor (Cd) - Select Yes for the device to calculate, and use this factor in the volume calculations. Selecting No will cause the device to use a Fixed Cd, which by default is.6, but can be edited by the user in Constants rev. AA Page 151
152 Use Fpb Use Ftb Use Fg Use Fb Fb Calculation Use Ftf Use Fr Use Fa Pressure Base factor (Fpb) - Select Yes for the device to calculate, and use this factor in the volume calculations. Temperature Base factor (Ftb) - Select Yes for the device to calculate, and use this factor in the volume calculations. Specific Gravity factor (Fg or Fgr) - Select Yes for the device to calculate, and use this factor in the volume calculations Basic Orifice factor (Fb) - Select Yes for the device to calculate, and use this factor in the volume calculations. Auto - The device automatically calculates Fb when the Orifice Diameter or Pipe Diameter is changed. This is the recommended method for standard transducer type units. Manual - The user will be required to enter an Fb on the Constants tab. Flowing Temperature factor (Ftf) - Select Yes for the device to calculate, and use this factor in the volume calculations. Reynolds Number factor (Fr) - Select Yes for the device to calculate, and use this factor in the volume calculations. Orifice Thermal Expansion factor (Fa) - Select Yes for the device to calculate, and use this factor in the volume calculations. Density Base Condition Density Source Base Condition User Entered Density Select one of three sources to use for the density for base conditions: Calculated from Real Specific Gravity - This selection causes the Specific Gravity to be picked up from the Fixed or Live Analysis data section and used to calculate the density. Calculated from AGA8 Detail - This selection uses the AGA8 Detail Fpv method and requires that the AGA8 Detail Fpv method be used as selected on the General tab. User Entered - If used, the entered value needs to match up with the Real Specific Gravity in the Analysis section. Enter the value in the User Entered Density field as shown below. This selection is not recommended if any of the other methods are viable. Enter the density to be used if User Entered was selected as the Density Source for base conditions. Flowing Condition Density Source Select one of four sources to use for the density for flowing conditions: Calculated from Real Specific Gravity - This selection causes the Specific Gravity to be picked up from the Fixed or Live Analysis data section and used to calculate the density Calculated from AGA8 Detail - This selection uses the AGA8 Detail Fpv method and requires that the AGA8 Detail Fpv method be used as selected on the General tab. User Entered - If used, the entered value needs to match up with the Real Specific Gravity in the Analysis section. Enter the value in the User Entered Density field as shown below. This selection is not recommended if any of the other methods are viable. Page rev. AA
153 Flowing Condition User Entered Density Live Density Input Register Live Measured - This method assumes density is brought via an external source such as a densitometer. If used, specify the app/array/register for the Live Density Input Register Enter the density to be used if User Entered was selected as the Density Source for flowing conditions. Specify the App/Array/Register for the source of the density value if Live Measured was selected as the Density Source for flowing condition. If an onboard analog input or TFIO module is used for the input, the address can be found under the I/O Interface tree-view item. Commands Reset Volume Select Yes from the drop-down menu, and click the Send button. The user will be asked to confirm the request. Answer Yes for the request to be carried out. A typical use for this command is just prior to an orifice plate change on a gas orifice meter. The device reacts, as follows, to a Reset Volume: Completes all computations for the present flow file daily record. Stores date/time and partial log period's volume into its historical record. Logs an event with the accumulator value before zeroing the accumulator. Zeroes the total volume accumulator. Begins a new flow file daily record. Select Yes from the drop-down menu, and click the Send button. The user will be asked to confirm the request. Answer Yes for the request to be carried out. This is similar to a Reset Volume, except the volume accumulator is not zeroed. A typical use for this command is just prior to an orifice plate change on a gas orifice meter. Reset Log Period The device reacts, as follows, to a Reset Log Period: Completes all computations for the present flow file daily record. Stores date/time and partial log period's volume into its historical record. Logs an event in the Event file. Begins a new flow file daily record. Set site code Enter up to seven numerical digits, and a decimal point is allowed anywhere among the digits. A site code entry enters an event in the event file using the site code number. This number can represent anything to the user as some function performed at the site. Log Capacity Maximum # Daily Records Maximum # Log Period Records Maximum # Event Records Enter the maximum number of Daily Records that the device will store. The default of 50 is recommended. Enter the maximum number of Log Period Records that the device will store. The default of 970 is recommended. 970 allows for 40 days of hourly records. One Log Period Record is used no matter what the Log Period time. Enter the maximum number of Event Records that the device will store. Each entry into the Event file is a record rev. AA Page 153
154 Setup Device/APP ID Log Period Tube Description Vol Calc Period Contract Hour Dp Zero Cutoff Fpv Method Sp/Dp Averaging The ID field represents the unique identifier for the device. As devices can have multiple flow calculations (tubes) running simultaneously, each one of these will have their own ID. Select the log period from the drop-down list. Options are 1, 2, 5, 10, 20, 30 and 60 minutes. This is the rate at which the calculated volumes are logged to the historical file. Unless otherwise required, the default of 60 minutes is recommended. This period can be the same as but should never be less than the volume calculation period. If not the same, it should always be an even multiple of the volume calculation period. Enter alphanumeric characters for a description of the tube. This is helpful when there is more than one tube application running in a single device. Displays and/or allows the selection of the Volume Calculation Period. This is the rate at which the volume is calculated based on one second averages of equation parameters such as SP, DP, Temperature, etc. Earlier devices offered several time selections whereas newer faster devices may be locked at one second. For devices that still provide multiple Vol. Calc. Periods, the time can be the same as, but should never be greater than the Log Period. If not the same, the Log Period should always be an even multiple of the Vol. Calc. Period. Enter the contract hour in military time (0-23). The contract hour is the start of the day for daily volumes. Enter the value in units as specified. A decimal point is allowed. No volume calculations will occur when DP is below this value. Select the compressibility (Fpv) method from the drop-down list. Available Fpv methods are: AGA8 Gross Method 1 - This method uses: Gross Heating Value, Relative Density and CO2. AGA8 Gross Method 2 - This method uses: Relative Density, Nitrogen and Carbon Dioxide. AGA8 Detail 92 - This method basically supports a total analysis. ISO This method supports total analysis as specified in the international standard ISO SGERG88 - This method adheres to the international standard ISO For this method to be viable, one of the following base conditions must exist: 0 C / 32 F and bar / psi 15 C / 59 F and bar / psi C / 60 F and bar / psi C / 60 F and bar / psi For detailed information on these methods, see the American Gas Association, Report No. 8 / American Petroleum Institute Chapter Select Linear or Square Root averaging from the drop-down list. The following explanation applies to the Differential Pressure, Static Pressure and Temperature. Linear - Sums the samples and divides by the number of samples. Page rev. AA
155 Square Root - Sum of the square root of the samples divided by the number of samples and squared. Calculation Type Select one of the calculation types: AGA Adheres to American Gas Association's Report No. 3, AGA Adheres to American Gas Association's Report No. 3, 1992 / American Petroleum Institute's Report AGA Adheres to American Gas Association's Report No. 3, 2012 / American Petroleum Institute's Report Select the volume unit and associated flow rate unit from the list. The first unit is the volume and the second is the flow rate unit. Selections are paired as shown: MCF - SCF/Hr Vol. Unit - Flow Rate MCF - MCF/Day MMCF - MCF/Hr MMCF - MMCF/Day Sets a time duration that informs the device how long to remain in Hold when the user is in Calibration mode. The default is set to 01:00:00 (1 hr.). This is Hold Timeout primarily protection against getting side-tracked and forgetting to take the unit out of Hold. This pertains to any tube that is put in Hold while in Calibration mode. Last Analysis Time Displays the last date/time that a live analysis was received. Current Values Yesterday's Volume Today's Volume Flow Rate Accumulated Volume This is the prior Contract Day's volume. The Contract Day is defined as a 24- hour period that establishes the parameters for a complete day. This value is updated at the end of each Volume Calculation Period. The Volume Calculation Period represents the rate at which the volume is calculated based on one second averages of the static pressure, differential pressure and temperature. At the end of this period, the average value of the extension (portion of the flow rate equation that is integrated each second) is multiplied by other factors in the AGA-3 equation to arrive at the flow rate for the Volume Calculation Period. The flow rate is then multiplied by the Volume Calculation Period. Every Volume Calculation Period volume is added to the current volume for the duration of the Contract Day. Estimated flow rate based on the current Integral and the last calculated integral multiplier. Updated at the end of each Volume Calculation Period. At the end of the Volume Calculation Period, the average value of the Extension is multiplied by the Integral Multiplier resulting in the flow rate for the Volume Calculation Period. The flow rate is then multiplied by the Volume Calculation Period. Each Volume Calculation Period volume is then added to the accumulated volume until zeroed by a Reset Volume command or an accumulator rollover happens. Yesterday's Energy Prior Contract Day s energy. The sum of energy quantities accumulated since the beginning of the contract Today's Energy day. At each Volume Calculation Period, the energy quantity is calculated by multiplying the period volume by the energy content. Running total of the Energy which is updated at the end of each Volume Accumulated Energy Calculation Period. See Today s Energy above for the calculation procedure rev. AA Page 155
156 Yesterday's Mass Today's Mass Accumulated Mass Mass Rate Energy Rate Last Calculated Value Last Calculated Energy Last Calculated Mass Prior Contract Day's Mass At the end of each Volume Calculation Period, Mass is calculated using the equation: Mass = Indicated Volume / Flowing Density Flowing Density is either calculated or user entered. Each Volume Calculation Period Mass is added to the current Mass for the duration of the Contract Day. Running total of the calculated Mass which is updated at the end of each Volume Calculation Period. See Today s Mass for the calculation procedure. The estimated flow rate times the mass content (fixed or from live analysis). The estimated flow rate times the energy content (fixed or from live analysis). Update frequency of the last calculated values is based on the Volume Calculation Period (typically 1 sec.) as specified on the General tab. Energy for the last Volume Calculation Period. See Today s Energy for the calculation procedure. Mass for the last Volume Calculation Period. See Today s Mass for the calculation procedure. Limits The Limits tab allows the user to enter High and Low Limits for Static Pressure, Differential Pressure, Temperature, and Flow Rate. When a low or high limit is exceeded, an alarm is entered into the Daily Flow record noting the day of the occurrence and also in the Log Period record noting which Log Period of that day the occurrence happened. Another use of the limits is to operate digital outputs based on the high or low limit. The XSeries series flow computers (XFC) have two digital outputs which can be used and an XRC has four of which two can be operated based on the limits. These operations are setup on the Digital Outputs tree-view item. Sp High Limit Sp Low Limit Dp High Limit Dp Low Limit Tf High Limit Tf Low Limit Flow High Limit Flow Low Limit Enter the static pressure high limit. Enter the static pressure low limit. Enter the differential pressure high limit. Enter the differential pressure low limit. Enter the total flowing temperature high limit. Enter the total flowing low limit. Enter the flow rate high limit. Enter the flow rate low limit. Adv Setup Adv Setup Static Pressure Diff Pressure Temperature Static Pressure Type Enter the App/Array/Register for Static Pressure. Enter the App/Array/Register for Differential Pressure. Enter the App/Array/Register for Flowing Temperature. Select whether the static is coming from a Gauge or Absolute device. Page rev. AA
157 RTD Installed Use Fixed Temperature Enter Yes if using an RTD for temperature. Enter Yes to use a Fixed Temperature instead of measured. Fixed Temperature Enter the Fixed Temperature value. No Flow Digital Input DI Action Flow State Enter the App/Array/Register used for the No Flow condition. Select whether an Open or Closed contact represents the No Flow condition. Indicate Flow or No Flow based on the digital input. Speed of Sound Speed of Sound Calculation Speed of Sound Select either Disabled or Enabled Displayed in feet/second Digital Output Digital Output 1 Digital Output Volume Setpoint Trip on Volume Setpoint Trip on DP Low Trip on DP High Trip on SP Low Trip on SP High Trip on TF Low Trip on TF High Trip on Fr Low Trip on Fr High Trip on Charger Low Trip on Digital Input Digital Input Specify the output register for Digital Output 1 or Digital Output 2 depending on the tab selected. Enter the Volume Setpoint in MCF for tripping of the digital output by the Volume Setpoint command. If set to Yes, the digital output will be tripped each time the Volume Setpoint is reached. If set to Yes, the digital output will be tripped on the DP Low alarm. Alarm limits are set in the Limits tab. If set to Yes, the digital output will be tripped on the DP High alarm. Alarm limits are set in the Limits tab. If set to Yes, the digital output will be tripped on the SP Low alarm. Alarm limits are set in the Limits tab. If set to Yes, the digital output will be tripped on the SP High alarm. Alarm limits are set in the Limits tab. If set to Yes, the digital output will be tripped on the Flowing Temperature Low alarm. Alarm limits are set in the Limits tab. If set to Yes, the digital output will be tripped on the Flowing Temperature High alarm. Alarm limits are set in the Limits tab. If set to Yes, the digital output will be tripped on the Flow Rate Low alarm. Alarm limits are set in the Limits tab. If set to Yes, the digital output will be tripped on the Flow Rate High alarm. Alarm limits are set in the Limits tab. If set to Yes, the digital output will be tripped on the Low Charger alarm. The Low Charger alarm happens automatically if the charging source is removed or cannot maintain an adequate battery voltage. If set to Yes, the digital output will be tripped if the Digital Input specified below is set to a 1 (senses a closed contact). Specify a digital input register (format 0.0.0) for the Trip on Digital Input option rev. AA Page 157
158 DO Action Auto Reset Auto Reset Delay (Sec) Current State Manual Operation Select whether the digital output is to act as a Normally Open or Normally Closed contact. If set to Yes, the digital output will reset after the Auto Reset Delay time has elapsed. If set to No, Auxiliary Contact 1 will remain tripped until manually reset. Specify the amount of time in seconds Auxiliary Contact 1 will reset after being opened or closed by some action. Auto Reset must be set to Yes. Displays the current state of the digital output as Open or Closed. This function allows the user to manually operate the digital output. This might be done for testing purposes. If the DO Action parameter above is set to Normally Open, Trip will close the digital output, and Clear will open the digital output. If the DO Action parameter is set to Normally Closed, Trip will open the digital output and Clear will close it. Digital Output 2 (Same as Digital Output 1) Orifice The user can select the Orifice tab to change the Orifice Plate. The first option would be to ensure all read/write fields have the correct value selected. These fields are as follows: Orifice Diameter Hold Timeout Pipe Diameter Sp Tap Location Tap Type Enter the orifice diameter size in dimensional units. The user defines the duration of the Hold Timeout (default 60 minutes) to change the orifice plate. Enter the pipe diameter size in dimensional units. This read only field displays the location (upstream, downstream) of the Sp tap in relation to the orifice plate. Specified on Configuration tab. In this field, available displayed values for this read only field for Tap Type are: 1. No DP - No live differential pressure provided 2. Flange - Flange type taps 3. Corner - Corner taps 4. D-D/2 - D and D/2 taps 5. Custom - User must enter a value specified on Configuration tab. Once all the fields are showing the desired values, the user must first select the Hold button to set the timer at 60 minutes. The flow pressure is then held for that period of time to allow the user to change the orifice plate. The user then presses the Change Orifice Plate button and changes the orifice plate. Once finished, the user would select the Flowing button to resume flow. Last Calculated Values The values in the Calc column display the last calculated values of variables that are specific to volume calculations. Updated frequency of the last calculated values is based on the Volume Calculation Period. The data displayed varies depending on the type of device and is for informational purposes only. Some of the information displayed will be familiar to the user, while others will not. As this is the case, the information presented is likely to be more useful to a Totalflow customer service representative than a field user. Volume Mass Displayed in SCF (standard cubic feet) Displayed in lbm (pounds of mass) Page rev. AA
159 Energy Real Specific Gravity Fluid Viscosity Zbase of Air Contract Baro Pressure Base Displayed in MBtu (thousands of British thermal units) Displayed as a ratio of the density of the sample to the density of water Displayed in cp (centipoise), a unit of viscosity Z of Air at the contractual values for pressure base and temperature base. The user would enter a value for the Z of Air. This is the compressibility of air at a reference temperature (typically 60 degrees F.) The default standard is Displayed in PSIA (pounds per square inch absolute) Displayed in PSIA (pounds per square inch absolute) Temperature Base Displayed in Degrees F. Base Compressibility Display follows one of four existing base conditions. Flowing Compressibility Calculated from the Base Compressibility A factor used to account for the following effect: Boyle's law for gases states that the specific weight of a gas is directly proportional to the absolute pressure, the temperature remaining constant. All gases deviate from this law by varying amounts, and within the range of conditions ordinarily Super Compressibility encountered in the natural gas industry, the actual specific weight under the higher pressure is usually greater than the theoretical. The factor used to reflect this deviation from the ideal gas law in gas measurement with an orifice meter is called the "supercompressibility factor"or Fpv. Fip (Female Iron Pipe Connection) is the adaptor and will accept the pipe Fip into its fitting Live Static Pressure Displays last live reading in PSIA (pounds per square inch absolute) Displays last static pressure reading in PSIA (pounds per square inch Static Pressure absolute) Differential Pressure Displays last differential pressure reading in INH2O (inches of water) Live Temperature Displays last live temperature reading in degrees F. Flowing Temperature Displays last flowing temperature reading in degrees F. Orifice Expansion Coefficient Pipe Expansion Coefficient Pipe Inside Diameter Select the Orifice material type from the drop-down list. A standard expansion coefficient is used based on the material type. Three standard material types are provided (Stainless Steel, Monel and Carbon Steel). If an Orifice is used of a different type material, the user must select "Other", and enter an Expansion Coefficient (inches per Deg. F). Move the decimal point six places to the right, and enter in the format of (x.xx) which is then scaled by the flow computer to x.xx times A standard expansion coefficient is used based on the material type. Three standard material types are available (Stainless Steel, Monel & Carbon Steel). If pipe is used of a different type material, the user must enter an Expansion Coefficient in units. Move the decimal point 6 places to the right, and enter in the format of (x.xx) which is then scaled by the flow computer to x.xx times E-6. Displays pipe inside diameter in inches Orifice Inside Diameter Displays orifice inside diameter in inches Faux Displays faux or fpv (supercompressibility) value Y Expansion Factor Displays Y (expansion factor), used in volume calculations Specific Heat Ratio Displays the ratio of Cp divided by Cv Water Vapor Factor (Fw) Displays the water vapor factor (Fw) rev. AA Page 159
160 C-Prime Static Factor The Static Factor value displays here. (cp_s) The portion of the flow rate equation that is computed each Vol. Calc. C-Prime (cp) Period. Live Flowing Density Assumes not using fixed data but live data from an external source Displays the Base Density used from the Start Date/Time to the End Base Density Date/Time. Displays the average Flowing Density used from the Start Date/Time to the Flowing Density End Date/Time. Temperature Corrected Pipe/Orifice Ratio The Pipe/Orifice Ratio corrected for temperature (Beta) This parameter is often referred to as the velocity of approach factor and dividing the coefficient of discharge by that parameter (as was done above) produces the flow coefficient. Methods also exist for determining the flow coefficient as a function of the beta function and the location of the Velocity of Approach downstream pressure sensing tap. For rough approximations, the flow coefficient may be assumed to be between 0.60 and For a first approximation, a flow coefficient of 0.62 can be used as this approximates to fully developed flow. Discharge Coefficient (Cd) Coefficient of Discharge factor (Cd) - Select Yes for the flow computer to calculate and use this factor in the volume calculations. Selecting No will cause the flow computer to use a Fixed Cd which is entered on the Constants tab. AGA-7 Overview The Totalflow Fourth Generation XSeries flow computers (XFCG4) provide functionality though the convergence of RTU, PLC and flow computer concepts. The XFCG4 represents a unique milestone in the development of remote, low power measurement and control devices. All XFCG4 units feature multi-tube capacity --up to eight per individual unit or 20 tubes per unit in special cases-- with custodytransfer measurement features. The flexibility of these units, including backward compatibility with legacy Totalflow systems, allows the user to increase productivity and improves asset utilization. Page rev. AA

161 While the XFCG4 is designed for either differential (orifice) or pulse (linear) metering, the following information concentrates solely on pulse metering as it regards the AGA-7 standard. The user can also use the general information displayed as a snapshot of the current existing values for each parameter listed. There can be up to eight (8) AGA-7 measurement applications instantiated per comm channel on the XFCG4 board. The fields displayed are as follows: Tube Description Yesterday's Volume Today's Volume Calculation Type This is the user-designated description of the tube. This serves as an aid for the user when there is more than one tube application running in a single device. This is the prior Contract Day's volume. The Contract Day is defined as a 24- hour period that establishes the parameters for a complete day. Updated at the end of each Volume Calculation Period. At the end of each Volume Calculation Period, the counts for the period are multiplied times the K Factor to produce an uncorrected volume which is then multiplied times the currently selected AGA-7 factors (See Factors tab under Setup) to produce a Corrected Volume. Each Volume Calculation Period volume is added to the current volume for the duration of the Contract Day. Displays the type of flow calculation. The user can establish the parameters for the AGA-7 application using the read/write fields provided. These parameters are as follows: Contract Hour K Factor The Contract Hour is the start of the day for daily volumes. Enter the Contract Hour in military time (0-23). K Factor specifies the number of pulses required per volume of liquid. To get the Indicated Volume, the number of pulses is divided by the K Factor or multiplied by the inverse of the K Factor depending on whether the K Factor method is set to Quantity/Pulse or Pulse/Quantity rev. AA Page 161
162 Flow Period (Seconds) Aux Factor (Faux) Fpv Method Flow Period is a read only window which displays the time period in seconds. Flow Period is used to establish whether flow or no flow conditions exist. If no pulses are received during a flow period, it is considered a period of no flow. Pressure and temperature data accumulated during that period are not included in the log period averages and therefore no volume during that flow period. Flow Period can also be viewed in the Entry Mode under the tube's Setup/General tab. This value is used when the Use Faux parameter is turned on below. This is a multiplication factor which directly affects the volume calculation. For example, a value of.9 would cause a 10% reduction in the calculated volume. Can be set to any value to allow for static corrections for site conditions that are not handled by the fundamental equation. An example would be a linear meter calibration shift. Select the compressibility (Fpv) method from the drop-down list. Available Fpv methods are: NX19 fixed FtFp - Uses NX19 Gravity, Carbon Dioxide and Nitrogen method but the user must manually calculate and enter Ft and Fp. NX19 GCN - Uses NX19 Gravity, Carbon Dioxide and Nitrogen method. NX19 GCNM - Uses NX19 Gravity, Carbon Dioxide, Nitrogen and Methane method. NX19 Auto (GCN or GCNM) - This method automatically switches to GCNM method if Gravity exceeds.75 and/or Carbon Dioxide or Nitrogen exceed 15%. AGA8 Gross 92 - This is one of the newer and recommended Fpv methods assuming only Specific Gravity, Carbon Dioxide and Nitrogen are used. AGA8 Detail 92 - This method supports total analysis. SGERG88 - This method adheres to the international standard ISO For this method to be viable, one of the following base conditions must exist: 0 C / 32 F and bar / psi 15 C / 59 F and bar / psi C / 60 F and bar / psi C / 60 F and bar / psi For detailed information on these methods, see the American Gas Association, Report No. 8 / American Petroleum Institute Chapter 14.2 and/or ISO Standards and The six tabs displayed horizontally at the top of the page include important displayed data as well as read/write fields the user would need to set up functions such as Analysis or Calibration. The seventh (Configuration), eighth (Adv Setup), ninth (Digital Output), tenth (K Factor) and eleventh (Last Calc Values) tabs are accessible by selecting the pulldown arrow to the right of the Calibration tab. The user can re-select the arrow to re-display the Calibration tab (information). Each tab with relevant information is discussed as follows: RealTime Here the color-coordinated parameters are charted either on graph or grid. By clicking on the individual parameter's box below the chart, it will be displayed or removed from the chart as the situation dictates. These variables include: SP, Pulse Count, Temperature and Flow. The Points button is used to set the range of the displayed cycle measured. Page rev. AA
163 The View button can be used to either display the parameter in a Graph (default) or a Grid format. There is an option to expand/collapse the Graph view. The Expand button shall expand the graph to full screen. The Collapse button will return the graph to normal view. Day The Day tab displays information for the user that is based on the accumulated daily totals for the meter. The Day button allows the user to set the number of days displayed at one time. The user can select the View button to display the charted information in a Grid (default) or Graph format. The user can hover the mouse cursor over any portion of the graph display to display the value and date/time of the variable reading. (This can also be done for any of the displayed variables on the graph.) There is an option to expand/collapse the Graph view. The Expand button shall expand the graph to full screen. The Collapse button will return the graph to normal view. Legends are selectable under graph. In case the graph has more than four parameters, an option is provided on the bottom of the graph to select up to four possible variables for plotting in overlay and once selected, they will be shown on the bottom of the graph as legends (selectable). A minimum of one variable is to be selected. The parameters displayed in this chart are as follows: Count SP TF Volume Avol Energy Cnt Min Cnt Max AVol Percent Low AVol Percent Hi SP Min SP Max SP Percent Low SP Percent Hi TF Min TF Max TF Percent Low TF Percent Hi This field represents the total number of counts for the flow period. This field represents the static pressure (PSIA). This field represents the flowing temperature (Deg F). This field displays the totalized volume (MCF). Uncorrected volume for the Contract Day. The uncorrected volume for each Volume Calculation Period of the Contract Day is added together to produce a Daily uncorrected volume. This value represents the sum of energy quantities (MMBTU). Displays the minimum counts that occurred during any Flow Period during the Contract Day. Displays the maximum counts that occurred during any Flow Period during the Contract Day. Percentage of the time that the Uncorrected Volume is below the Uncorrected Volume Low Limit. Limits are set on the Limits tab of the Setup tree view item. Percentage of the time that the Uncorrected Volume is above the Uncorrected Volume High Limit. Limits are set on the Limits tab of the Setup tree view item. Minimum Static Pressure recorded during the Contract Day. Maximum Static Pressure recorded during the Contract Day. Displays the percentage of time the Static Pressure was below the low limit during the Contract Day. Displays the percentage of time the Static Pressure was above the high limit during the day. Minimum Temperature recorded during the Contract Day Maximum Temperature recorded during the Contract Day Displays the percentage of time the Temperature was below the low limit during the Contract Day. Displays the percentage of time the Temperature was above the high limit during the Contract Day rev. AA Page 163
164 Period Time Flow Time If Day Period, enter the frequency at which the trend data is logged. The format is hh:mm:ss in which one second is the fastest allowable time. It is recommended that Log Periods not be set faster than is necessary to conserve the device s processor time. Also, the more frequent the Log Periods, the faster the available memory of the device is used. Number of one second samples where DP is above zero cutoff, divided by the number of one second samples in a day, times 100 (rounded to the nearest.5 seconds). Log The Log tab provides information for the log period records (typically hourly) for the selected meter. The Day button allows the user to set the number of days displayed at one time. The user can select the View button to display the charted information in a Grid (default) or Graph format. The user can hover the mouse cursor over any portion of the graph display to display the value and date/time of the variable reading. (This can also be done for any of the displayed variables on the graph.) There is an option to expand/collapse the Graph view. The Expand button shall expand the graph to full screen. The Collapse button will return the graph to normal view. Legends are selectable under graph. In case the graph has more than four parameters, an option is provided on the bottom of the graph to select up to four possible variables for plotting in overlay and once selected, they will be shown on the bottom of the graph as legends (selectable). A minimum of one variable is to be selected. The parameters displayed in this chart are as follows: Count SP TF Avol Volume Energy Flow Time Period Time This field represents the total number of counts for the flow period. This field represents the static pressure (PSIA). This field represents the flowing temperature (Deg F). Uncorrected volume for the Contract Day. The uncorrected volume for each Volume Calculation Period of the Contract Day is added together to produce a Daily uncorrected volume. This field displays the totalized volume (MCF). This value represents the sum of energy quantities (MMBTU). Flow Time is a read only window which displays the time period in seconds. Flow Time is used to establish whether flow or no flow conditions exist. If no pulses are received during a flow period, it is considered a period of no flow. Pressure and temperature data accumulated during that period are not included in the log period averages and therefore no volume during that flow period. Flow Period can also be viewed in the Entry Mode under the tube's Setup/General tab. If Day Period, enter the frequency at which the trend data is logged. The format is hh:mm:ss in which one second is the fastest allowable time. It is recommended that Log Periods not be set faster than is necessary to conserve the device s processor time. Also, the more frequent the Log Periods, the faster the available memory of the device is used. Event The Event tab provides a table of events from the selected meter. The information is presented as one line per event with a date and time stamp. Page rev. AA
165 The Day button allows the user to set the number of days displayed at one time. The parameters displayed in this chart are as follows: Date/Time Event Old Value New Value SN Displays the date and time to the nearest second for the beginning of the event. This field displays the type of event that occurred. This field represents the value or condition that existed prior to the event. For example, using an SP check, this shows the actual reading (manually entered by the technician) when a test pressure is applied. This field represents the value or condition entered by the technician. For example, using an SP check, this is the test pressure applied on the transducer. If displayed, this is a sequence number assigned to each event. The numbers should be in sequence and if there is a gap in the sequence, it could signal a problem. Analysis The Analysis tab provides information on the composition elements and other parameters of either Fixed or Live analysis. The user can opt for either analysis method by selecting the corresponding button. In Fixed analysis, the user can use the left Composition Elements column to edit each or all of the read/write fields to set the individual percentage of each element. The Gas Properties section fields are either set by the user or displayed in the field itself. These five fields are as follows: Heating Tb and Pb Real Specific Gravity Pressure Base Calculation of Energy is based on Volume or Mass. Energy is calculated by multiplying the Heating Value times the Volume or Mass. This value should be at the contracted pressure and temperature bases. The default is PSIA. The Base Pressure is based on the API 11.1 standards. Temperature Base 60 degrees F base temperature is based on the API 11.1 standards Z of Air Z of Air measured at the contractual values for pressure base and temperature base. Enter a value for the Z or Air. This is the compressibility of air at a reference temperature (Typ. 60 degrees). The default standard is The Others section has three editable fields as follows: FPV Method Select the supercompressibility (Fpv) method from the drop-down list. This option is only available in devices supporting the Extended Characteristic mode. By default, the NX19 Fpv method is used all other times. The value calculated by the selected FPV method is then squared (Fpv2) to derive the compressibility factor (Fs) for pulse meters. Available Fpv methods are: NX19 fixed FtFp - Uses NX19 Gravity, Carbon Dioxide and Nitrogen method but the user must manually calculate and enter Ft and Fp. NX19 GCN - Uses NX19 Gravity, Carbon Dioxide and Nitrogen method. NX19 GCNM - Uses NX19 Gravity, Carbon Dioxide, Nitrogen and Methane method rev. AA Page 165
166 NX19 Auto (GCN or GCNM) - This method automatically switches to GCNM method if Gravity exceeds.75 and/or Carbon Dioxide or Nitrogen exceed 15%. AGA8 Gross 92 - This is one of the newer and recommended Fpv methods assuming only Specific Gravity, Carbon Dioxide and Nitrogen are used. AGA8 Detail 92 - This method supports total analysis. SGERG88 - This method adheres to the international standard ISO For this method to be viable, one of the following base conditions must exist: 0 C / 32 F and bar / psi 15 C / 59 F and bar / psi C / 60 F and bar / psi C / 60 F and bar / psi For detailed information on these methods, see the American Gas Association, Report No. 8 / American Petroleum Institute Chapter 14.2 and/or ISO Standards and Fp for NX19 Fpv Ft for NX19 Fpv Calculate and enter the value here for Fp to include the Pressure Base factor in the volume calculations. Calculate and enter the value here for Ft to include the Temperature Base factor in the volume calculations. In Live analysis, the user relies on real time data as displayed in each field under the Live column. The values in the Calc column display the last calculated values of variables that are specific to volume calculations. Update frequency of the last calculated values is based on the Volume Calculation Period. The data displayed varies depending on the type of device and is for informational purposes only. Some of the information displayed will be familiar to the user, while others will not. As this is the case, the information presented is likely to be more useful to a Totalflow customer service representative than a field user. The Advanced Setup option includes both the Analysis and Therms Setup. In the Analysis Setup, the first three user defined fields deal with the type and duration of the analysis type selected. The multiple configuration parameters default to use the fixed values although multiple options are available for the user. The Therms Setup allows the user to select the fields to assign required values for the assigned fields. These fields are defined as follows: Attached to Stream # Stream ID Analyzer Modbus ID or Btu Stream Unit # If using analyzer data from a Master, select the stream number to use. If not using analyzer data, select None. Selecting a stream will cause what is referred to as an Attachment. This logs an event in the Event file, sets the analysis period from 0 to 1 hour and sets a bit to tell the unit to use Live Analysis from the analyzer. Enter four numeric numbers to help uniquely define the measurement tube's stream ID (e.g., 1234). Each measurement tube must have a unique stream ID. The tube's complete stream ID is composed of the four digit stream ID assigned here, the analyzer Modbus ID and the stream number currently attached (e.g., ). If this tube application is running on a flow computer, enter the Modbus ID of the external Therms analyzer. If this tube application is running on an NGC and the source of the analysis data is a Btu application, enter the Btu Unit Number. If this tube application is running on an NGC and the source of the analysis data is a Therms application, enter the Modbus ID of the external Therms analyzer. Page rev. AA
167 Stream Source App Enter the application number of the application providing the analysis information. This can be a Therms Master, Therms Slave or a Btu Stream application. A Btu Stream application only applies to an NGC. Calibration The Calibration tab provides necessary information to assist the user in completing the calibration process and a resulting report. With the tab selected, the Select Calibration Type button is initially selected to display the desired calibration check. To start the calibration, select the type. Note the display of the Calibration Options fields change depending on the calibration type selected as follows: Tolerance (% Diff) Hold Timeout Calibration Points Do you want to calibrate using Gauge? Barometric Pressure Temperature Bias The user selects a tolerance value equal to a desired % of the range; a warning message will display if the difference between the measured value and entered value exceeds this value. (applies to the following calibration checks: DP-SP, Differential Pressure, Static Pressure, Temperature/RTD) When the user elects to move into Calibration mode, the tube immediately moves into Hold Timer mode. The Hold Time Out (seconds) field allows the user to set a time frame (in seconds) from which to take the tube out of hold. The default is set to 3600 seconds (1 hour), but the user can establish a different time frame based on their individual needs. It should be noted that the timer starts as soon as the user moves into Calibration mode. (applies to the following calibration checks: DP-SP, Differential Pressure, Static Pressure, Temperature/RTD) The user would select the number of calibration points from this field. Options are 3 Points or 5 Points. With the setup complete, the 3 or 5 point Target pressure values will be calculated for convenience. These are suggested because of being evenly spaced across the calibration range, but it is not mandatory that these be used. (applies to the following calibration checks: DP- SP, Differential Pressure, Static Pressure, Temperature/RTD) This option is simply an aid for doing Static Pressure checks. Selecting gauge allows the user to enter values directly from the test pressure without having to add the barometric pressure which is automatically included. (applies to the following calibration checks: Static Pressure) This value is subtracted from Absolute pressure readings when calibrating the static pressure in gauge pressure and for displaying the static pressure in gauge on the device s display. This value is also entered on the calibration screen when calibrating in gauge pressure. (applies to the following calibration checks: Static Pressure) If the user elects to use Temperature/RTD as a calibration method, select the Temperature Bias field under Calibration Options. This allows the user to enter a new value. The RTD's temperature will always be biased by this value. (applies to the following calibration checks: Temperature/RTD) rev. AA Page 167
168 The user would change the value of any of the fields displayed for the check selected as needed. Then the Start Calibration button would be selected to start the process. The SP Calibrate screen allows for doing checks or doing checks and a calibration. Start with doing checks and then continue with the calibration if needed. The As Found checks are created by applying different test pressures across the calibration range. For each test pressure applied, enter the test pressure in the Test box and click the Check Mark. The live reading will be displayed in the Live/Found box and be captured along with the entered Test value when the Check Mark is clicked. The % difference between the Test value and the live value will also be displayed. Repeat the process to enter the number of points desired. If checks are all that are required, click "Accept and Finish" or "Continue to Calibrate" to do a calibration. Page rev. AA
169 If the user elected to calibrate, the Calibrate screen will display with the points plotted and listed in a table. If a 3-point calibration had been selected in setup but had done more than three checks, the user would have the option to check the boxes of desired points to use for the calibration. If however, a 3-point calibration was set up and three checks were done, naturally there is no option. If needed, use the RE-ZERO function to shift up or down the calibration range so that the low end is true zero. Click the Calibrate button to continue rev. AA Page 169
170 If the user is satisfied at this point, the Accept & Finish button is selected. If not satisfied, the user can select the Re-calibrate button until satisfied. Selecting the Accept & Finish button will complete this calibration. If the user wants to start the process over and not accept the entries, the Abort button would be selected instead. The final Calibration Check is the Temperature/RTD. This process is also the same as the SP Calibration Check. With a completed calibration, the appropriate box or boxes would be checked. The user could then select the Generate Report button to generate a report in HTML. Configuration The user can select the Configuration tab to access the read/write and read only fields used to set up data needed for configuration. The following five (5) areas of fields are accessible to the user: Constants Factors Page rev. AA
171 Setup Current Values Limits The following information is provided in relation to all parameters and their fields: Constants Fixed Sp Value Barometric Pressure Pressure Base Temperature Base (Tb) Auxiliary Factor (Faux) K Factor Click in the Fixed Sp field and enter a static pressure to be used when the Use Fixed Sp On Error field is selected. This value is subtracted from Absolute pressure readings when calibrating the static pressure in gauge pressure and for displaying the static pressure in gauge on the device s display. This value is also entered on the calibration screen when calibrating in gauge pressure. Enter the Pressure Base in the units specified. A specific Pressure Base value may be required because of contractual agreements. Enter the Temperature Base in the units as specified by the Units column. A specific Temperature Base may be required because of contractual agreements. This value is used when the Faux factor is turned on. Faux is simply a multiplication factor times the computed gas volume that can be used to correct for a known error condition. This factor is typically used for what is referred to as the Full Well Stream Factor. This is used to adjust the computed gas volume downward to account for the portion of the measured stream that is liquid. K Factor specifies the number of pulses required per volume of liquid. To get the Indicated Volume, the number of pulses is divided by the K Factor or multiplied by the inverse of the K Factor depending on whether the K Factor method is set to Quantity/Pulse or Pulse/Quantity. Factors Use Fpc Use Ftc Use Fs Use Faux Select Yes to use the Pressure Correction Factor (Fpc). Calculated by dividing the Volume Calculation Period average SP by the Pressure Base. Select Yes to use the Temperature Correction Factor (Ftc). Calculated by dividing the Temperature Base by the Volume Calculation Period average temperature. Select Yes to use the Compressibility Factor (Fs). Fs is equal to Fpv 2. Fpv is based on the Fpv method selected in General tab and analysis data. Full Well Stream Factor (Faux) - Select Yes for the device to use the Faux value entered by the user in the Constants tab. Typically, used as a Full Well Stream factor which is used to adjust the computed gas volume downward to account for the portion of the measured fluid stream that is liquid. The user enters a value which will be used as a direct multiplier when calculating the volume. For example, a value of 0.9 would result in a volume reduction of 10%. The percentage liquids in the stream is typically determined by a Full Well Stream Test. Since Faux is a direct multiplier to the volume, it can be used for any correction to the volume not accounted for in the basic equation. Density Base Condition Density Source Select one of three sources to use for the density for base conditions: rev. AA Page 171
172 Base Condition User Entered Density Flowing Condition Density Source Flowing Condition User Entered Density Live Density Input Register Calculated from Real Specific Gravity - This selection causes the Specific Gravity to be picked up from the Fixed or Live Analysis data section and used to calculate the density. Calculated from AGA8 Detail - This selection uses the AGA8 Detail Fpv method and requires that the AGA8 Detail Fpv method be used as selected on the General tab. User Entered - If used, the entered value needs to match up with the Real Specific Gravity in the Analysis section. Enter the value in the User Entered Density field as shown below. This selection is not recommended if any of the other methods are viable. Enter the density to be used if User Entered was selected as the Density Source for base conditions. Select one of four sources to use for the density for flowing conditions: Calculated from Real Specific Gravity - This selection causes the Specific Gravity to be picked up from the Fixed or Live Analysis data section and used to calculate the density Calculated from AGA8 Detail - This selection uses the AGA8 Detail Fpv method and requires that the AGA8 Detail Fpv method be used as selected on the General tab. User Entered - If used, the entered value needs to match up with the Real Specific Gravity in the Analysis section. Enter the value in the User Entered Density field as shown below. This selection is not recommended if any of the other methods are viable. Live Measured - This method assumes density is brought via an external source such as a densitometer. If used, specify the app/array/register for the Live Density Input Register Enter the density to be used if User Entered was selected as the Density Source for flowing conditions. Specify the App/Array/Register for the source of the density value if Live Measured was selected as the Density Source for flowing condition. If an on-board analog input or TFIO module is used for the input, the address can be found under the I/O Interface tree-view item. Commands Reset Volume Select Yes from the drop-down menu, and click the Send button. The user will be asked to confirm the request. Answer Yes for the request to be carried out. A typical use for this command is just prior to an orifice plate change on a gas orifice meter. The device reacts, as follows, to a Reset Volume: Completes all computations for the present flow file daily record. Stores date/time and partial log period's volume into its historical record. Logs an event with the accumulator value before zeroing the accumulator. Zeroes the total volume accumulator. Begins a new flow file daily record. Page rev. AA
173 Set Uncorrected Volume to > Reset Log Period Set site code Enter the provided value of the Uncorrected Volume. Select Yes from the drop-down menu, and click the Send button. The user will be asked to confirm the request. Answer Yes for the request to be carried out. This is similar to a Reset Volume, except the volume accumulator is not zeroed. A typical use for this command is just prior to an orifice plate change on a gas orifice meter. The device reacts, as follows, to a Reset Log Period: Completes all computations for the present flow file daily record. Stores date/time and partial log period's volume into its historical record. Logs an event in the Event file. Begins a new flow file daily record. Enter up to seven numerical digits, and a decimal point is allowed anywhere among the digits. A site code entry enters an event in the event file using the site code number. This number can represent anything to the user as some function performed at the site. Log Capacity Maximum # Daily Records Maximum # Log Period Records Maximum # Event Records Enter the maximum number of Daily Records that the device will store. The default of 50 is recommended. Enter the maximum number of Log Period Records that the device will store. The default of 970 is recommended. 970 allows for 40 days of hourly records. One Log Period Record is used no matter what the Log Period time. Enter the maximum number of Event Records that the device will store. Each entry into the Event file is a record. Setup Device/APP ID Vol Calc Period Contract Hour Calculation Type Fpv Method The ID field represents the unique identifier for the device. As devices can have multiple flow calculations (tubes) running simultaneously, each one of these will have their own ID. Select the volume calculation period from the drop-down list. Options are 1, 2, 5, 10, 20, 30 and 60 seconds/minutes. This is the rate at which the volume is calculated based on one second averages of SP, DP and Temperature. Unless otherwise required, the default of 60 minutes is recommended. This period can be the same as but should never be greater than the log period. If not the same, the log period should always be an even multiple of the volume calculation period. Enter the contract hour in military time (0-23). The contract hour is the start of the day for daily volumes. Displays the type of flow calculation which is API Liquid. This is a read-only parameter. Select the supercompressibility (Fpv) method from the drop-down list. Available Fpv methods are: NX19 fixed FtFp - Uses NX19 Gravity, Carbon Dioxide and Nitrogen method but the user must manually calculate and enter Ft and Fp rev. AA Page 173
174 NX19 GCN - Uses NX19 Gravity, Carbon Dioxide and Nitrogen method. NX19 GCNM - Uses NX19 Gravity, Carbon Dioxide, Nitrogen and Methane method. NX19 Auto (GCN or GCNM) - This method automatically switches to GCNM method if Gravity exceeds.75 and/or Carbon Dioxide or Nitrogen exceed 15%. AGA8 Gross 92 - This is one of the newer and recommended Fpv methods assuming only Specific Gravity, Carbon Dioxide and Nitrogen are used. AGA8 Detail 92 - This method supports total analysis. SGERG88 - This method adheres to the international standard ISO For this method to be viable, one of the following base conditions must exist: 0 C / 32 F and bar / psi 15 C / 59 F and bar / psi C / 60 F and bar / psi C / 60 F and bar / psi For detailed information on these methods, see the American Gas Association, Report No. 8 / American Petroleum Institute Chapter 14.2 and/or ISO Standards and Log Period Vol Calc Period Display Rate Corrected Vol Unit Uncorrected Vol Unit Select the log period from the drop-down list. Options are 1, 2, 5, 10, 20, 30 and 60 minutes. This is the rate at which the calculated volumes are logged to the historical file. Unless otherwise required, the default of 60 minutes is recommended. This period can be the same as but should never be less than the volume calculation period. If not the same, it should always be an even multiple of the volume calculation period. Select the volume calculation period from the drop-down list. Options are 1, 2, 5, 10, 20, 30 and 60 seconds/minutes. This is the rate at which the volume is calculated based on one second averages of SP, DP and Temperature. Unless otherwise required, the default of 60 minutes is recommended. This period can be the same as but should never be greater than the log period. If not the same, the log period should always be an even multiple of the volume calculation period. Select either "per hour", "per day" or "per flow period". This dictates what flow rate units are used on the flow computer's display. Select one of the following options from the drop-down menu. This dictates what Corrected Volume Units are used on the flow computer's display. scf = Standard cubic feet. dscf = scf / 10 cscf = scf / 100 mscf = scf / 1,000 dmscf = scf / 10,000 cmscf = scf / 100,000 mmscf = scf / 1,000,000 Select one of the following options from the drop-down menu. This dictates which Uncorrected Volume Units are used on the flow computer's display. acf = Actual cubic feet. dacf = acf / 10 cacf = acf / 100 Page rev. AA
175 macf = acf / 1,000 dmacf = acf / 10,000 cmacf = acf / 100,000 mmacf = acf / 1,000,000 Select whether the turbine meter or device generating the pulses is designed to Meter Factor Select output pulses based on pulses per volume or volume per pulse and makes that selection here. The K-factor for the device is entered in Calibration mode. Flow Period (Seconds) Hold Timeout (Seconds) Flow Period is a selectable time period used to establish whether flow or no flow conditions exist. If no pulses are received during a flow period, it is considered a period of no flow. Pressure and temperature data accumulated during that period is not included in the log period averages. This variable can also be entered in the 'Calibration' section. Sets a time duration (in seconds) that informs the device how long to remain in Hold when the user is in Calibration mode. The default is set to 3600 (1 hr.). This is primarily protection against getting side-tracked and forgetting to take the unit out of Hold. This pertains to any tube that is put in Hold while in Calibration mode. Current Values Uncorrected Flow Rate Energy Rate Mass Rate Yesterday's Volume Today's Volume Accumulated Volume Last Calc. Volume Updated at the end of each Flow Period. This is counts for the Flow Period times the K Factor. Updated at the end of each Flow Period. Generated by multiplying the Flow Rate times the energy content (fixed or from live analysis). At the end of each Volume Calculation Period, Mass is calculated using the equation: Mass = Indicated Volume / Flowing Density The Flowing Density is either calculated or user entered. This is the prior Contract Day's volume. The Contract Day is defined as a 24- hour period that establishes the parameters for a complete day. Updated at the end of each Volume Calculation Period. At the end of each Volume Calculation Period, the counts for the period are multiplied times the K Factor to produce an uncorrected volume which is then multiplied times the currently selected AGA-7 factors (See Factors tab under Setup) to produce a Corrected Volume. Each Volume Calculation Period volume is added to the current volume for the duration of the Contract Day. Updated at the end of each Volume Calculation Period. At the end of each Volume Calculation Period, the counts for the period are multiplied times the K Factor to produce an uncorrected volume which is then multiplied times the currently selected AGA-7 factors (See Factors tab under Setup) to produce a Corrected Volume. Each Volume Calculation Period corrected volume is then added to the Accumulated Volume. This continues until zeroed by the Reset Volume command or an accumulator rollover happens. At the end of the Volume Calculation Period, the average value of the extension is multiplied by the Integral Multiplier resulting in the flow rate for the Volume Calculation Period. The flow rate is then multiplied by the Volume Calculation Period rev. AA Page 175
176 Yesterday's Energy Prior Contract Day s energy. Updated at the end of each Volume Calculation Period. The sum of energy quantities accumulated since the beginning of the contract day. At the end of Today's Energy each Volume Calculation Period, the energy quantity is calculated by multiplying the Volume Calculation Period volume by the energy content. Accumulated Energy Last Calc. Energy Yesterday's Mass Today's Mass Accumulated Mass Last Calc. Mass Yesterday's Uncorr Vol Today's Uncorrected Volume Accumulated Uncorr Volume Last Calc. Uncorrected Volume Running total of the Energy which is updated at the end of each Volume Calculation Period. See Today s Energy above for the calculation procedure. Energy for the last Volume Calculation Period. See Today s Energy above for the calculation procedure. Prior Contract Day s Mass. See Today s Mass above for the calculation procedure. At the end of each Volume Calculation Period, Mass is calculated using the equation: Mass = Indicated Volume / Flowing Density Flowing Density is either calculated or user entered. Each Volume Calculation Period Mass is added to the current Mass for the duration of the Contract Day. Running total of the calculated Mass which is updated at the end of each Volume Calculation Period. See Today s Mass above for the calculation procedure. Mass for the last Volume Calculation Period. See Today s Mass above for the calculation procedure. Prior Contract Day s uncorrected volume. See Today s UC Volume for the calculation procedure. Updated at the end of each Volume Calculation Period. At the end of each Volume Calculation Period, the counts for the period are multiplied times the K Factor to produce an uncorrected volume. Each Volume Calculation Period volume is added to the current volume for the duration of the Contract Day. Updated at the end of each Volume Calculation Period. At the end of each Volume Calculation Period, the counts for the period are multiplied times the K Factor to produce an uncorrected volume which is added to the Accumulated UC Volume. This continues until zeroed by the Reset Volume command or an accumulator At the end of the Volume Calculation Period, the average value of the extension is multiplied by the Integral Multiplier resulting in the flow rate for the Volume Calculation Period. The counts for the period are then multiplied by the K Factor to produce the Uncorrected Volume. The flow rate is then multiplied by the Volume Calculation Period. Limits Sp High Limit Sp Low Limit Tf High Limit Tf Low Limit Flow High Limit Flow Low Limit This represents the higher limit of the static pressure value that can be sent to the tube application. This represents the lower limit of the static pressure value that can be sent to the tube application. This represents the higher limit of the total flowing temperature value that can be sent to the tube application. This represents the lower limit of the total flowing value that can be sent to the tube application. This represents the higher limit of the flow value that can be sent to the tube application. This represents the lower limit of the flow value that can be sent to the tube application. Page rev. AA
177 Uncorr Vol High Limit Uncorr Vol Low Limit At the end of each Volume Calculation Period, the counts for the period are multiplied times the K Factor to produce an uncorrected volume. The High Limit for the uncorrected value is set in this field to specify which values can be sent to the application. At the end of each Volume Calculation Period, the counts for the period are multiplied times the K Factor to produce an uncorrected volume. The Low Limit for the uncorrected value is set in this field to specify which values can be sent to the application. Adv Setup Adv Setup Static Displays the current scaled static pressure. Pressure Pulse Input Enter the Pulse Input register here. Temperature Snapshot of the current flowing temperature. Static Pressure Type Use Fixed Static Fixed Static Select whether the static pressure is coming from a Gauge or Absolute pressure device. Select Yes to use the Fixed Static Pressure instead of a measured pressure. Used for AGA-7 tubes when static pressure is not available. Enter a value to be used when the Use Fixed Static is set to Yes. RTD Installed Select Yes if you are using an RTD for flowing temperature. Use Fixed Select Yes to use the Fixed Temperature instead of a measured temperature. Temp Enter a value to be used when the Use Fixed Temperature is set to Yes. The Fixed Fixed Temp Temperature will also be used in case of an RTD error if setup on the Fixed Values On Errors tab. No Flow Digital Input DI Action Flow State Specify a digital input register (format 0.0.0) for the Trip on Digital Input option. Select whether an Open Contact or a Closed Contact constitutes a No Flow condition. Displays the Flow State as Flow or No Flow based on the Digital Input specified above and the DI Action selected. Speed of Sound Speed of Sound Calculation Speed of Sound Speed of Sound is calculated based on AGA-10 specifications and is provided to the user to use as they see fit and is not used by the NGC for any subsequent calculations. Pressure and temperature are two additional parameters required for the calculation which are not typically available in the NGC. This screen allows for the entry of registers if the two values are brought via an external source, or permits the user to enter a fixed value for either or both parameters. Displays the calculated value of the Speed of Sound based on AGA-10 specifications. Digital Output rev. AA Page 177
178 Digital Output 1 Digital Output Volume Setpoint Trip on Volume Setpoint Trip on ACF Low Trip on ACF High Trip on SP Low Trip on SP High Trip on TF Low Trip on TF High Trip on FR Low Trip on FR High Trip on Charger Low Trip on Digital Input Digital Input DO Action Auto Reset Auto Reset (Sec) Current State Manual Operation Specify the output register for Digital Output 1 or Digital Output 2 depending on the tab selected. Enter the Volume Setpoint in MCF for tripping of the digital output by the Volume Setpoint command. If set to Yes, the digital output will be tripped each time the Volume Setpoint is reached. If set to Yes, the digital output will be tripped on the ACF Low alarm. Alarm limits are set in the Limits tab. If set to Yes, the digital output will be tripped on the ACF High alarm. Alarm limits are set in the Limits tab. If set to Yes, the digital output will be tripped on the SP Low alarm. Alarm limits are set in the Limits tab. If set to Yes, the digital output will be tripped on the SP High alarm. Alarm limits are set in the Limits tab. If set to Yes, the digital output will be tripped on the Flowing Temperature Low alarm. Alarm limits are set in the Limits tab. If set to Yes, the digital output will be tripped on the Flowing Temperature High alarm. Alarm limits are set in the Limits tab. If set to Yes, the digital output will be tripped on the Flow Rate Low alarm. Alarm limits are set in the Limits tab. If set to Yes, the digital output will be tripped on the Flow Rate High alarm. Alarm limits are set in the Limits tab. If set to Yes, the digital output will be tripped on the Low Charger alarm. The Low Charger alarm happens automatically if the charging source is removed or cannot maintain an adequate battery voltage. If set to Yes, the digital output will be tripped if the Digital Input specified below is set to a 1 (senses a closed contact). Specify a digital input register (format 0.0.0) for the Trip on Digital Input option. Select whether the digital output is to act as a Normally Open or Normally Closed contact. If set to Yes, the digital output will reset after the Auto Reset Delay time has elapsed. If set to No, Auxiliary Contact 1 will remain tripped until manually reset. Specify the amount of time in seconds Auxiliary Contact 1 will reset after being opened or closed by some action. Auto Reset must be set to Yes. Displays the current state of the digital output as Open or Closed. This function allows the user to manually operate the digital output. This might be done for testing purposes. If the DO Action parameter above is set to Normally Open, Trip will close the digital output, and Clear will open the digital output. If the DO Action parameter is set to Normally Closed, Trip will open the digital output and Clear will close it. Digital Output 2 (Same as Digital Output 1) Page rev. AA
179 Last Calculated Values The values in the Calc column display the last calculated values of variables that are specific to volume calculations. Updated frequency of the last calculated values is based on the Volume Calculation Period. The data displayed varies depending on the type of device and is for informational purposes only. Some of the information displayed will be familiar to the user, while others will not. As this is the case, the information presented is likely to be more useful to a Totalflow customer service representative than a field user. Volume Uncorrected Volume Mass Energy Real Specific Gravity Zbase of Air Live Static Pressure Static Pressure Displayed in SCF (standard cubic feet) C-Prime Static Factor (cp_s) Sum of all the volume quantities calculated for each Volume Calculation Period during the Contract Day. At the end of each C Prime (cp) Volume Calculation Period, the counts for the period are multiplied times the K Factor to produce an uncorrected volume. Displayed in lbm (pounds of mass) Displayed in MBtu (thousands of British thermal units) Displayed as a ratio of the density of the sample to the density of water Z of Air at the contractual values for pressure base and temperature base. The user would enter a value for the Z of Air. This is the compressibility of air at a reference temperature (typically 60 degrees F.) The default standard is Displays last live reading in PSIA (pounds per square inch absolute) Displays last static pressure reading in PSIA (pounds per square inch absolute) Faux Temperature Correction Factor (Ftc) Pressure Correction Factor (Fpc) Base Compress Flowing Compress (Supercompress)^2 The Static Factor value displays here. The portion of the flow rate equation that is computed each Vol. Calc. Period. Faux defaults to but can be changed in the Constants tab by the user. Displays the average Temperature Correction (Ftc) Factor from the Start Date/Time to the End Date/Time. Displays the average Pressure Correction (Fpc) Factor from the Start Date/Time to the End Date/Time. Displays the Compressibility factor which is a factor that is used to account for the deviation of a gas from volumetric ideality (non ideal gas behavior). Three methods are used in the Totalflow NGC. NX-19, AGA 8, AGA5. Calculated from the Base Compressibility A factor used to account for the following effect: Boyle's law for gases states that the specific weight of a gas is directly proportional to the absolute pressure, the temperature remaining constant. All gases deviate from this law by varying rev. AA Page 179
180 amounts, and within the range of conditions ordinarily encountered in the natural gas industry, the actual specific weight under the higher pressure is usually greater than the theoretical. The factor used to reflect this deviation from the ideal gas law in gas measurement with an orifice meter is called the "supercompressibility factor"or Fpv. Contract Baro Pressure The barometric pressure should display PSIA Live Flowing Density Displays the Live Flowing Density used from the Start Date/Time to the End Date/Time. Pressure Base Displayed in PSIA (pounds per square inch absolute) Base Density Displays the Base Density used from the Start Date/Time to the End Date/Time. Temperature Base Displayed in Degrees F. Live Displays the value of live Temperature temperature Displays the average Flowing Flowing Temperature from the Start Temperature Date/Time to the End Date/Time. Flowing Density Pulse Count ACF Measured or Calculated from the provided Base Density. Displays the total pulses from the Start Date/Time to the End Date/Time. Uncorrected Flow converted to Actual Cubic Feet (ACF) for use by the totalflow device SUAGA-3 Overview The Totalflow Fourth Generation XSeries flow computers (XFCG4) provide functionality though the convergence of RTU, PLC and flow computer concepts. The XFCG4 represents a unique milestone in the development of remote, low power measurement and control devices. All XFCG4 units feature multi-tube capacity --up to eight per individual unit or 20 tubes per unit in special cases-- with custodytransfer measurement features. The flexibility of these units, including backward compatibility with legacy Totalflow systems, allows the user to increase productivity and improves asset utilization. While the XFCG4 is designed for either differential (orifice) or pulse (linear) metering, the following information concentrates solely on differential pressure as it regards the AGA-3 standard. The AGA-3 standard provides a procedure for the measurement of natural gas, hydrocarbons and other related fluid flows using flange tap and pipe tap orifice meters. Additionally, AGA-3 provides the standards for the construction and installation of orifice plates, meter tubes and associated fittings and the instructions for computing the flow of natural gas and hydrocarbon fluids through orifice meters. The standard, user-configurable calculations include AGA-3 (1985 vintage), AGA-3 (1992 vintage), Nx19, AGA-8-Gross and AGA-8-Detail methods for computing supercompressibility. It should be noted that all measurement, math and data storage functions either meet or exceed the requirements Page rev. AA

181 of the API 21.1 Electronic Gas Flow Measurement standard and Industry Canada Legal Metrology Branch. Outside of the United States, requirements for standards of measurement may differ from existing domestic standards in the oil and gas industry. For example DP measured in inh2o here in one market but in another country's market may be measured in kg/cm2 instead. To meet such need in the overseas markets, a Selectable Unit (SU) functionality has been added to the AGA-3 and AGA-7. Thus the new nomenclature of SUAGA-3 is to signify this functionality. The user can also use the general information displayed as a snapshot of the current existing values for each parameter listed. There can be up to eight (8) AGA-3 measurement applications instantiated per comm channel on the XFCG4 board. The fields displayed here are as follows: Tube Description Yesterday's Volume Today's Volume This is the user-designated description of the tube. This serves as an aid for the user when there is more than one tube application running in a single device. This is the prior Contract Day's volume. The Contract Day is defined as a 24-hour period that establishes the parameters for a complete day. This value is updated at the end of each Volume Calculation Period. The Volume Calculation Period represents the rate at which the volume is calculated based on one second averages of the static pressure, differential pressure and temperature. At the end of this period, the average value of the extension (portion of the flow rate equation that is integrated each second) is multiplied by other factors in the AGA-3 equation to arrive at the flow rate for the Volume Calculation Period. The flow rate is then multiplied by the Volume Calculation Period. Every Volume Calculation Period volume is added to the current volume for the duration of the Contract Day. The user can establish the parameters for the AGA-3 application using the read/write fields provided. These parameters are as follows: rev. AA Page 181
182 Contract Hour SP Tap Location Calculation Type Orifice Diameter Pipe Diameter The contract hour is the start of the day for daily volumes expressed in military time (0-23). From the drop-down list, select the location (upstream, downstream) of the SP tap in relation to the orifice plate. Select the desired calculation type (e.g., AGA3-2012) Enter the orifice diameter size in dimensional units. Enter the pipe diameter size in dimensional units. Select the desired supercompressibility method. (NX19 fixed FtFp, NX19 GCN, NX19 GCNM, NX19 Auto, etc.) FPV Method Available Fpv methods are: AGA8 Gross Method 1 - This method uses Gross Heating Value, Relative Density and Carbon Dioxide. AGA8 Gross Method 2 - This method uses Relative Density, Nitrogen and Carbon Dioxide. AGA8 Detail 92 - This method basically supports a total analysis. ISO This method supports total analysis as specified in the international standard ISO SGERG88 - This method adheres to the international standard ISO For this method to be viable, one of the following base conditions must exist: 0 C / 32 F and bar / psi 15 C / 59 F and bar / psi C / 60 F and bar / psi C / 60 F and bar / psi For detailed information on these methods, see the American Gas Association, Report No. 8 / American Petroleum Institute Chapter 14.2 and/or ISO Standards and The six tabs displayed horizontally at the top of the page include important displayed data as well as read/write fields the user would need to set up functions such as Analysis or Calibration. Seventh (Configuration), eighth (Adv Setup), ninth (Digital Output), tenth (Orifice) and eleventh (Last Calc Values) tabs are accessible by selecting the pulldown arrow to the right of the Calibration tab. The user can re-select the arrow to re-display the Calibration tab (information) or select the remaining tabs. Each tab with relevant information is discussed as follows: RealTime Here the color-coordinated displays of each variable would be charted on the graph. By clicking on the individual variable's box below the chart, it will be displayed or removed from the chart as the situation dictates. The Points button is used to set the density of the displayed graph, the higher the number of points, the more accurate the graph displayed. The View button can be used to either display the variable in a Graph (as currently shown) or a Grid format. There is an option to expand/collapse the Graph view. The Expand button shall expand the graph to full screen. The Collapse button will return the graph to normal view. Page rev. AA
183 Day The Day tab displays information for the user that is based on the accumulated daily totals for the meter. The Day button allows the user to set the number of days displayed at one time. The user can select the View button to display the charted information in a Graph or Grid format. The user can hover the mouse cursor over any portion of the graph display to display the value and date/time of the variable reading. (This can also be done for any of the displayed variables on the graph.) There is an option to expand/collapse the Graph view. The Expand button shall expand the graph to full screen. The Collapse button will return the graph to normal view. Legends are selectable under graph. In case the graph has more than four parameters, an option is provided on the bottom of the graph to select up to four possible variables for plotting in overlay and once selected, they will be shown on the bottom of the graph as legends (selectable). A minimum of one variable is to be selected. The parameters possible to display from the Options icon are as follows: DP SP TF Volume Integral Energy DP Min DP Max DP Percent Low DP Percent Hi SP Min SP Max SP Percent Low SP Percent Hi This field represents the differential pressure. The value shown is the average of one second samples for the day. This field represents the static pressure. The value shown is the average of one second samples for the day. This field represents the flowing temperature. The value shown is the average of one second samples for the day. The Volume values are the sum of all the volume quantities that are calculated for each Volume Calculation Period during the Contract Day. The Integral value represents the portion of the flow rate equation that is integrated each second. The volume period computation made by the computer is the product of C and the integrated extension (AGA 1985) or the integral multiplier and the integrated extension (AGA 1992). This value represents the sum of energy quantities (MMBTU) that are accumulated since the beginning of the Contract Day. This is updated at the end of each Volume Calculation Period. At the end of the Volume Calculation Period, the energy quantity is calculated by multiplying the Volume Calculation Period volume by the energy content. Minimum Differential Pressure recorded during the Contract Day. Maximum Differential Pressure recorded during the Contract Day. Displays the percentage of time the Differential Pressure was below the low limit during the Contract Day. Displays the percentage of time the Differential Pressure was above the high limit during the Contract Day. Minimum Static Pressure recorded during the Contract Day. Maximum Static Pressure recorded during the Contract Day. Displays the percentage of time the Static Pressure was below the low limit during the Contract Day. Displays the percentage of time the Static Pressure was above the high limit during the day rev. AA Page 183
184 TF Min TF Max TF Percent Low TF Percent Hi Period Time Flow Time Back Flow Minimum Temperature recorded during the Contract Day Maximum Temperature recorded during the Contract Day Displays the percentage of time the Temperature was below the low limit during the Contract Day. Displays the percentage of time the Temperature was above the high limit during the Contract Day. If Day Period, enter the frequency at which the trend data is logged. The format is hh:mm:ss in which one second is the fastest allowable time. It is recommended that Log Periods not be set faster than is necessary to conserve the device s processor time. Also, the more frequent the Log Periods, the faster the available memory of the device is used. Number of one second samples where DP is above zero cutoff, divided by the number of one second samples in a day, times 100 (rounded to the nearest.5 seconds). Number of one second samples where DP is at least three inches below zero. Log Log The Log tab provides information for the log period records (typically hourly records) for the selected meter. The user can select the View button to display the charted information in a Grid (default) or Graph format. The user can hover the mouse cursor over any portion of the graph display to display the value and date/time of the variable reading. (This can also be done for any of the displayed variables on the graph.) There is an option to expand/collapse the Graph view. The Expand button shall expand the graph to full screen. The Collapse button will return the graph to normal view. Legends are selectable under graph. In case the graph has more than four parameters, an option is provided on the bottom of the graph to select up to four possible variables for plotting in overlay and once selected, they will be shown on the bottom of the graph as legends (selectable). A minimum of one variable is to be selected. The parameters displayed in this chart are as follows: DP SP TF Integral Volume Energy Flow Time Period Time This field represents the differential pressure (in H2O). This field represents the static pressure (PSIA). This field represents the flowing temperature (Deg F). The Integral value represents the portion of the flow rate equation that is integrated each second. The volume period computation made by the computer is the product of C and the integrated extension (AGA 1985) or the integral multiplier and the integrated extension (AGA 1992). This field displays the totalized volume (MCF). This value represents the sum of energy quantities (MMBTU). Number of one second samples where DP is above zero cutoff, divided by the number of one second samples in a day, times 100 (rounded to the nearest.5 seconds). Displays the time in seconds for the Contract Day. If the system was functioning continuously with no down time, this number should be Page rev. AA
185 Event The Event tab provides a table of events from the selected meter. The information is presented as one line per event with a date and time stamp. The Day button allows the user to set the number of days displayed at one time. The parameters displayed in this chart are as follows: Date/Time Event Old Value New Value SN Displays the date and time to the nearest second for the beginning of the event. This field displays the type of event that occurred. This field represents the value or condition that existed prior to the event. For a DP or SP check, this shows the actual reading (manually entered by the technician) when a test pressure is applied. This field represents the value or condition entered by the technician. For a DP or SP check, this is the test pressure applied on the transducer. If displayed, this is a sequence number assigned to each event. The numbers should be in sequence and if there is a gap in the sequence, it could signal a problem. Analysis The Analysis tab provides information on the composition elements and other parameters of either Fixed or Live analysis. The user can opt to view either analysis method by selecting the corresponding option as well as the Advanced Setup option. In Fixed analysis, the user can edit all in the left Composition Elements column to edit each or all of the read/write fields to set the individual percentage of each element. The right Gas Properties column has two read/write fields that can be selected and edited as well. These two fields are as follows: Heating Tb and Pb Calculation of Energy is based on Volume or Mass. Energy is calculated by multiplying the Heating Value times the Volume or Mass. Real Specific This value should be at the contracted pressure and temperature bases. Gravity The Others section also has one editable fields as follows: FPV method is then squared (Fpv2) to derive the compressibility factor (Fs) for pulse meters. Available FPV methods are: AGA8 Gross Method 1 - This method uses Gross Heating Value, Relative Density and Carbon Dioxide. AGA8 Gross Method 2 - This method uses Relative Density, Nitrogen and Carbon FPV Method Dioxide. AGA8 Detail 92 - This method basically supports a total analysis. ISO This method supports total analysis as specified in the international standard ISO SGERG88 - This method adheres to the international standard ISO For this method to be viable, one of the following base conditions must exist: 0 C / 32 F and bar / psi rev. AA Page 185
186 15 C / 59 F and bar / psi C / 60 F and bar / psi C / 60 F and bar / psi For detailed information on these methods, see the American Gas Association, Report No. 8 / American Petroleum Institute Chapter 14.2 and/or ISO Standards and In Live analysis, the user relies on real time data as displayed in each field under the Live column. As in Fixed Analysis, the aggregate of all the values displayed should be 100% The same values are displayed in each. The values in the Calc column display the last calculated values and last used component analysis. Updated frequency of the last calculated values is based on the Volume Calculation Period. The Advanced Setup option includes both the Analysis and Therms Setup. In the Analysis Setup, the first three user defined fields deal with the type, error conditions and wait time for live data. The multiple configuration parameters default to use the fixed values although multiple options are available for the user. The Therms Setup allows the user to select the fields to assign required values for the assigned fields. These fields are defined as follows: Attached to Stream # Stream ID Analyzer Modbus ID or Btu Stream Unit # Stream Source App If using analyzer data from a Master, select the stream number to use. If not using analyzer Enter four numeric numbers to help uniquely define the measurement tube's stream ID (e.g., 1234). Each measurement tube must have a unique stream ID. The tube's complete stream ID is composed of the four digit stream ID assigned here, the analyzer Modbus ID and the stream number currently attached (e.g., ). If this tube application is running on a flow computer, enter the Modbus ID of the external Therms analyzer. If this tube application is running on an NGC and the source of the analysis data is a Btu application, enter the Btu Unit Number. If this tube application is running on an NGC and the source of the analysis data is a Therms application, enter the Modbus ID of the external Therms analyzer. Enter the application number of the application providing the analysis information. This can be a Therms Master, Therms Slave or a Btu Stream application. A Btu Stream application only applies to an NGC. Calibration The Calibration tab provides necessary information to assist the user in completing the calibration process and a resulting report. With the tab selected, the Select Calibration Type button is initially selected to display the desired calibration check. The options for the checks are as follows: Page rev. AA
187 To start the calibration, select the type. Note the display of the Calibration Options fields changes depending on the calibration type selected as follows: Tolerance (% Diff) Hold Timer The user selects a tolerance value equal to a desired % of the range; a warning message will display if the difference between the measured value and entered value exceeds this value. (applies to the following calibration checks: DP-SP, Differential Pressure, Static Pressure, Temperature/RTD) When the user elects to move into Calibration mode, the tube immediately moves into Hold Timer mode. The Hold Time Out (seconds) field allows the user to set a time frame (in seconds) from which to take the tube out of hold. The default is set to 3600 seconds (1 hour), but the user can establish a different time frame based on their individual needs. It should be noted that the timer starts as soon as the user moves into Calibration mode. (applies to the following calibration checks: DP- SP, Differential Pressure, Static Pressure, Temperature/RTD) The user would select the number of calibration points from this field. Options are 3 Points or 5 Points depending on the desired accuracy of the calibration. With the setup complete, the 3 or 5 point Target pressure values will be calculated for Calibration Points convenience. These are suggested because of being evenly spaced across the calibration range, but it is not mandatory that these be used. (applies to the following calibration checks: DP-SP, Differential Pressure, Static Pressure, Temperature/RTD) Do you want to calibrate in Gauge? Barometric Pressure Temperature Bias This option is simply an aid for doing checks. Selecting gauge allows the user to enter values directly from the test pressure without having to add the barometric pressure which is automatically included. (applies to the following calibration checks: Static Pressure) This value is subtracted from Absolute pressure readings when calibrating the static pressure in gauge pressure and for displaying the static pressure in gauge on the device s display. This value is also entered on the calibration screen when calibrating in gauge pressure. (applies to the following calibration checks: Static Pressure) If the user elects to use Temperature/RTD as a calibration method, select the Temperature Bias field under Calibration Options. This allows the user to enter a new value. The RTD's temperature will always be biased by this value. (applies to the following calibration checks: Temperature/RTD) The user would change the value of any of the fields displayed for the check selected as needed. Then the Start Calibration button would be selected to start the process rev. AA Page 187

188 The DP-SP Check screen was designed as a troubleshooting tool so that the static pressure could be varied while at the same time, recording the differential pressure. Any significant change in the DP while changing the SP indicates a problem. The applied static pressure will be displayed in the SP window as well as the differential pressure in the DP window. Clicking on the check mark box will accept the pressures. Repeat the process to enter the number of static pressure points desired. If it's decided that a re-zero is needed before any more checks, click the RE-ZERO tab and a screen will appear to allow the user to re-zero the transducer and return to the Checks screen. The RE-ZERO function shifts up or down the calibration range so that the low end is true zero. The buttons with X's can be used to delete the selected entries from the log until the desired entries are input. Select the Accept & Finish button to complete the entry process which will save the checks as the "As Found" and "As Left" and log the check events. The user can now "Abort" to finish or select the "Add to Report & Finish" button to send the data to reports and finish. Page rev. AA

189 rev. AA Page 189

190 The DP Calibrate screen allows for doing checks or doing checks and a calibration. Start with doing checks and then continue with the calibration if needed. The As Found checks are created by applying different test pressures across the calibration range. For each test pressure applied, enter the test pressure in the Test box and click the Check Mark. The live reading will be displayed in the Live/Found box and be captured along with the entered Test value when the Check Mark is clicked. The % difference between the Test value and the live value will also be displayed. Repeat the process to enter the number of points desired. If checks are all that are required, click "Accept and Finish" or "Continue to Calibrate" to do a calibration. Page rev. AA
191 If the user elected to calibrate, the Calibrate screen will display with the points plotted and listed in a table. If a 3-point calibration had been selected in setup but had done more than three checks, the user would have the option to check the boxes of desired points to use for the calibration. If however, a 3-point calibration was set up and three checks were done, naturally there is no option. Click the Calibrate button to continue rev. AA Page 191
192 After the calibration, the user will need to do additional checks referred to as "Verify." Use the same procedure as when doing the first checks, typically using the same pressures. If satisfied after doing the verify checks, selecting the Accept & Finish button will complete this calibration. If not satisfied, the user can select the Re-calibrate button to return to the Calibrate screen. If the user wants to start the process over, the Abort button would be selected instead. With the SP Calibration Check, the process is the same as the DP check. The final Calibration Check is the Temperature/RTD. The process is also the same as the DP Calibration Check and the SP Calibration Check. With a completed calibration, the appropriate box or boxes would be checked. The user could then select the Generate Report button to generate a report in HTML. Page rev. AA
193 Configuration The user can select the Configuration tab to access the read/write and read only fields used to set up data needed for configuration. The following ten (10) areas of fields are accessible to the user: Constants Factors Density Commands Fixed Values on Errors Log Capacity Setup Current Values Limits Water Constants The following information is provided in relation to all parameters and their fields: Constants Orifice Diameter Enter the orifice diameter size in dimensional units. Pipe Diameter Enter the pipe diameter size in dimensional units. Enter the Pressure Base in the units specified. A specific Pressure Base value Pressure Base (Pb) may be required because of contractual agreements. Auxiliary Factor (Faux) Fixed Cd Use Fixed Sp On Error Fixed Sp Z of Tb and Pb Barometric Pressure SP Tap Location Temperature Base (Tb) Viscosity This value is used when the Faux factor is turned on. Faux is simply a multiplication factor times the computed gas volume that can be used to correct for a known error condition. This factor is typically used for what is referred to as the Full Well Stream Factor. This is used to adjust the computed gas volume downward to account for the portion of the measured stream that is liquid. If Use Calc Cd is not selected, this fixed value for Coefficient of Discharge is used. A typical value is Select Yes to use the Fixed Sp Value if the Static Pressure exceeds the Sp High Error value or drops below the Sp Low Error value; otherwise, select No. Enter a static pressure to be used when the Use Fixed Sp On Error field is selected. Z of Air at the contractual values for pressure base and temperature base. The user would enter a value for the Z of Air. This is the compressibility of air at a reference temperature (typically 60 degrees F.) The default standard is This value is subtracted from Absolute pressure readings when calibrating the static pressure in gauge pressure and for displaying the static pressure in gauge on the device s display. This value is also entered on the calibration screen when calibrating in gauge pressure. Select the location (upstream, downstream) of the Sp tap in relation to the orifice plate. Enter the Temperature Base. A specific Temperature Base may be required because of contractual agreements. A default standard value of is used but can be edited by the user rev. AA Page 193
194 Specific Heat Ratio Enter the Specific Heat Ratio. This is Cp divided by Cv. A typical value is 1.3 Select the Orifice Plate material type from the drop-down list. A standard expansion coefficient is used based on the material type. Three standard material types are provided (Stainless Steel, Monel and Carbon Steel). If an orifice plate is used that consists of a different material, the user must select Orifice Coef Exp "Other" and enter an Expansion Coefficient in the units as specified by the Expansion variable group on the Units tree view item. Move the decimal point 6 places to the right and enter in the format of (x.xx) which is then scaled by the flow computer to x.xx times A standard expansion coefficient is used based on the material type. Three standard material types are available (Stainless Steel, Monel & Carbon Steel). If Pipe Exp Coef pipe is used of a different type material, the user must enter an Expansion Coefficient in units. Move the decimal point 6 places to the right, and enter in the format of (x.xx) which is then scaled by the flow computer to x.xx times E -6. Enter the value in units as specified by the Units column. A decimal point is DP Zero Cutoff allowed. No volume calculations will occur when DP is below this value. Used in the AGA equation when Fb Calculation is set to Auto on the Basic Orifice Factor Factors tab. Re-calculated by PCCU when the orifice size, pipe size, tap type or (Fb) tap location is changed. Select between Stainless or Monel for the orifice plate material. Used in AGA-3 Orifice Material 1985 equation. Tap Type Select Flange or Pipe tap. Used in AGA equation. Factors Use Calc Cd Use Y Use Fpv Use Fw Use Faux Coefficient of Discharge factor (Cd) - Select Yes for the device to calculate, and use this factor in the volume calculations. Selecting No will cause the device to use a Fixed Cd, which by default is.6, but can be edited by the user in Constants. Expansion factor (Y) - Select Yes for the device to calculate, and use this factor in the volume calculations. Compressibility factor - Select Yes for the flow computer to calculate, and use this factor based on the Fpv method selected. Water Vapor factor (Fw) - Select Yes for the device to calculate, and use this factor in the volume calculations. Used to adjust the computed gas volume downward to account for the portion of the measured fluid stream that is water in vapor phase. If supported, see the Water Constants tab for additional setup. Full Well Stream Factor (Faux) - Select Yes for the device to use the Faux value entered by the user in the Constants tab. Typically, used as a Full Well Stream factor which is used to adjust the computed gas volume downward to account for the portion of the measured fluid stream that is liquid. The user enters a value which will be used as a direct multiplier when calculating the volume. For example, a value of 0.9 would result in a volume reduction of 10%. The percentage liquids in the stream is typically determined by a Full Well Stream Test. Since Faux is a direct multiplier to the volume, it can be used for any correction to the volume not accounted for in the basic equation. Density Base Condition Density Source Select one of three sources to use for the density for base conditions: Page rev. AA
195 Base Condition User Entered Density Flowing Condition Density Source Flowing Condition User Entered Density Live Density Input Register Calculated from Real Specific Gravity - This selection causes the Specific Gravity to be picked up from the Fixed or Live Analysis data section and used to calculate the density. Calculated from AGA8 Detail - This selection uses the AGA8 Detail Fpv method and requires that the AGA8 Detail Fpv method be used as selected on the General tab. User Entered - If used, the entered value needs to match up with the Real Specific Gravity in the Analysis section. Enter the value in the User Entered Density field as shown below. This selection is not recommended if any of the other methods are viable. Enter the density to be used if User Entered was selected as the Density Source for base conditions. Select one of four sources to use for the density for flowing conditions: Calculated from Real Specific Gravity - This selection causes the Specific Gravity to be picked up from the Fixed or Live Analysis data section and used to calculate the density Calculated from AGA8 Detail - This selection uses the AGA8 Detail Fpv method and requires that the AGA8 Detail Fpv method be used as selected on the General tab. User Entered - If used, the entered value needs to match up with the Real Specific Gravity in the Analysis section. Enter the value in the User Entered Density field as shown below. This selection is not recommended if any of the other methods are viable. Live Measured - This method assumes density is brought via an external source such as a densitometer. If used, specify the app/array/register for the Live Density Input Register Enter the density to be used if User Entered was selected as the Density Source for flowing conditions. Specify the App/Array/Register for the source of the density value if Live Measured was selected as the Density Source for flowing condition. If an onboard analog input or TFIO module is used for the input, the address can be found under the I/O Interface tree-view item. Commands Reset Volume Reset Log Period Select Yes from the drop-down menu, and click the Send button. The user will be asked to confirm the request. Answer Yes for the request to be carried out. A typical use for this command is just prior to an orifice plate change on a gas orifice meter. The device reacts, as follows, to a Reset Volume: Completes all computations for the present flow file daily record. Stores date/time and partial log period's volume into its historical record. Logs an event with the accumulator value before zeroing the accumulator. Zeroes the total volume accumulator. Begins a new flow file daily record. Select Yes from the drop-down menu, and click the Send button. The user will be asked to confirm the request. Answer Yes for the request to be carried out. This is rev. AA Page 195
196 similar to a Reset Volume, except the volume accumulator is not zeroed. A typical use for this command is just prior to an orifice plate change on a gas orifice meter. The device reacts, as follows, to a Reset Log Period: Completes all computations for the present flow file daily record. Stores date/time and partial log period's volume into its historical record. Logs an event in the Event file. Begins a new flow file daily record. Set site code Enter up to seven numerical digits, and a decimal point is allowed anywhere among the digits. A site code entry enters an event in the event file using the site code number. This number can represent anything to the user as some function performed at the site. Fixed Values on Errors Use Fixed Sp on Error Fixed Sp Value Sp High Error Sp Low Error Use Fixed DP on Error Fixed DP Value DP High Error DP Low Error Use Fixed Tf on Error Fixed Tf Value Tf High Error Tf Low Error Select Yes to use or No to not use the Fixed Sp Value if the Static Pressure exceeds the Sp High Error value or drops below the Sp Low Error value. Enter the Static Pressure value to be used if Use Fixed Sp On Error is set to Yes and the Static Pressure has exceeded the Sp High Error or dropped below the Sp Low Error value. Enter the value to be used for the Static Pressure High Error. Enter the value to be used for the Static Pressure Low Error. Select Yes to use or No to not use the Fixed DP Value if the Differential Pressure exceeds the Dp High Error value or drops below the Dp Low Error value. Enter the Differential Pressure value to be used if Use Fixed Dp On Error is set to Yes and the DP Pressure has exceeded the DP High Error or dropped below the DP Low Error value. Enter the value to be used for the Differential Pressure High Error. Enter the value to be used for the Differential Pressure Low Error. Select Yes to use or No to not use the Fixed Tf Value if the Flowing Temperature exceeds the Tf High Error value or drops below the Tf Low Error value. Enter the Flowing Temperature value to be used if Use Fixed Tf On Error is set to Yes and the Flowing Temperature has exceeded the Tf High Error or dropped below the Tf Low Error value. Enter the value to be used for the Flowing Temperature High Error. Enter the value to be used for the Flowing Temperature Low Error. Log Capacity Maximum # Daily Records Maximum # Log Period Records Maximum # Event Records Enter the maximum number of Daily Records that the device will store. The default of 50 is recommended. Enter the maximum number of Log Period Records that the device will store. The default of 970 is recommended. 970 allows for 40 days of hourly records. One Log Period Record is used no matter what the Log Period time. Enter the maximum number of Event Records that the device will store. Each entry into the Event file is a record. Setup Page rev. AA
197 Device/APP ID Log Period Tube Description Vol Calc Period Contract Hour The ID field represents the unique identifier for the device. As devices can have multiple flow calculations (tubes) running simultaneously, each one of these will have their own ID. Select the log period from the drop-down list. Options are 1, 2, 5, 10, 20, 30 and 60 minutes. This is the rate at which the calculated volumes are logged to the historical file. Unless otherwise required, the default of 60 minutes is recommended. This period can be the same as but should never be less than the volume calculation period. If not the same, it should always be an even multiple of the volume calculation period. Enter alphanumeric characters for a description of the tube. This is helpful when there is more than one tube application running in a single device. Some devices offer volume calculation options of 1, 2, 5, 10, 20, 30 and 60 seconds/minutes whereas newer devices are locked in at one second. This is the rate at which the volume is calculated based on one second averages of SP, DP, and Temperature. This period can be the same as but should never be greater than the log period. If not the same, the log period should always be an even multiple of the volume calculation period. Enter the contract hour in military time (0-23). The contract hour is the start of the day for daily volumes. Fpv Method Select the compressibility (Fpv) method from the drop-down list. Available Fpv methods are: AGA8 Gross Method 1 - This method uses: Gross Heating Value, Relative Density and CO2. AGA8 Gross Method 2 - This method uses: Relative Density, Nitrogen and Carbon Dioxide. AGA8 Detail 92 - This method basically supports a total analysis. ISO This method supports total analysis as specified in the international standard ISO SGERG88 - This method adheres to the international standard ISO For this method to be viable, one of the following base conditions must exist: 0 C / 32 F and bar / psi 15 C / 59 F and bar / psi C / 60 F and bar / psi C / 60 F and bar / psi For detailed information on these methods, see the American Gas Association, Report No. 8 / American Petroleum Institute Chapter Select Linear or Square Root averaging from the drop-down list. The following explanation applies to the Differential Pressure, Static Pressure and Temperature. Sp/Dp Averaging Linear - Sums the samples and divides by the number of samples. Square Root - Sum of the square root of the samples divided by the number of samples and squared. Calculation Type Select one of the calculation types: AGA Adheres to American Gas Association's Report No. 3, AGA Adheres to American Gas Association's Report No. 3, 1992 / American Petroleum Institute's Report rev. AA Page 197
198 AGA Adheres to American Gas Association's Report No. 3, 2012 / American Petroleum Institute's Report Hold Timeout Heating Value Method Last Analysis Time Sets a time duration that informs the device how long to remain in Hold when the user is in Calibration mode. The default is set to 01:00:00 (1 hr.). This is primarily protection against getting side-tracked and forgetting to take the unit out of Hold. This pertains to any tube that is put in Hold while in Calibration mode. Select either Volume Based or Mass Based. This tells the software whether to multiply the calculated Volume or Mass times the Heating Value which is found on the Fixed or Live Analysis tabs and provides the total heating value for the period. Displays the last date/time that a live analysis was received. Current Values Yesterday's Volume Accumulated Volume Tube Description Today's Volume Yesterday's Energy Flow Rate Today's Energy Accumulated Energy This is the prior Contract Day's volume. The Contract Day is defined as a 24-hour period that establishes the parameters for a complete day. Updated at the end of each Volume Calculation Period. At the end of the Volume Calculation Period, the average value of the Extension is multiplied by the Integral Multiplier resulting in the flow rate for the Volume Calculation Period. The flow rate is then multiplied by the Volume Calculation Period. Each Volume Calculation Period volume is then added to the accumulated volume until zeroed by a Reset Volume command or an accumulator rollover happens. Enter alphanumeric characters for a description of the tube. This is helpful when there is more than one tube application running in a single device. This value is updated at the end of each Volume Calculation Period. The Volume Calculation Period represents the rate at which the volume is calculated based on one second averages of the static pressure, differential pressure and temperature. At the end of this period, the average value of the extension (portion of the flow rate equation that is integrated each second) is multiplied by other factors in the AGA-3 equation to arrive at the flow rate for the Volume Calculation Period. The flow rate is then multiplied by the Volume Calculation Period. Every Volume Calculation Period volume is added to the current volume for the duration of the Contract Day. Prior Contract Day s energy. Estimated flow rate based on the current Integral and the last calculated integral multiplier. The sum of energy quantities accumulated since the beginning of the contract day. At each Volume Calculation Period, the energy quantity is calculated by multiplying the period volume by the energy content. Running total of the Energy which is updated at the end of each Volume Calculation Period. See Today s Energy above for the calculation procedure. Yesterday's Mass Prior Contract Day's Mass Today's Mass At the end of each Volume Calculation Period, Mass is calculated using the equation: Mass = Indicated Volume / Flowing Density Flowing Density is either calculated or user entered. Each Volume Calculation Period Mass is added to the current Mass for the duration of the Contract Day. Page rev. AA
199 Accumulated Mass Mass Rate Energy Rate Last Calculated Value Last Calculated Energy Last Calculated Mass Running total of the calculated Mass which is updated at the end of each Volume Calculation Period. See Today s Mass for the calculation procedure. The estimated flow rate times the mass content (fixed or from live analysis). The estimated flow rate times the energy content (fixed or from live analysis). Update frequency of the last calculated values is based on the Volume Calculation Period (typically 1 sec.) as specified on the General tab. Energy for the last Volume Calculation Period. See Today s Energy for the calculation procedure. Mass for the last Volume Calculation Period. See Today s Mass for the calculation procedure. Limits The Limits tab allows the user to enter High and Low Limits for Static Pressure, Differential Pressure, Temperature, and Flow Rate. When a low or high limit is exceeded, an alarm is entered into the Daily Flow record noting the day of the occurrence and also in the Log Period record noting which Log Period of that day the occurrence happened. Another use of the limits is to operate digital outputs based on the high or low limit. The XSeries series flow computers (XFC) have two digital outputs which can be used and an XRC has four of which two can be operated based on the limits. These operations are setup on the Digital Outputs tree-view item. Sp High Limit Sp Low Limit Dp High Limit Dp Low Limit RTD High Limit RTD Low Limit Flow High Limit Flow Low Limit Enter the static pressure high limit. Enter the static pressure low limit. Enter the differential pressure high limit. Enter the differential pressure low limit. Enter the RTD temperature high limit. Enter the RTD temperature low limit. Enter the flow rate high limit. Enter the flow rate low limit. Water Constants Use Fixed H2O Fixed H2O Content H2O Bias Select Yes to use the water vapor content value as specified by Fixed H2O Content in lieu of the device calculating the water vapor content. Enter a value that will be used as a fixed value for the water vapor content. The above parameter Use Fixed H2O will need to be set to Yes for the fixed value to be used. Enter an offset for calculation of Fw. If using Fw, but unfamiliar with this bias parameter, use the default value. Last Displays the Last Fw value calculated by the device. Calculated Fw Adv Setup Adv Setup Static Pressure Differential Pressure Temperature Displays the current scaled static pressure. Enter the DP value here. Enter the current flowing temperature rev. AA Page 199
200 Static Pressure Type Use Fixed Static Fixed Static RTD Installed Use Fixed Temp Fixed Temp Select whether the static pressure is coming from a Gauge or Absolute pressure device. Select Yes to use the Fixed Static Pressure instead of a measured pressure. Used for AGA-7 tubes when static pressure is not available. Enter a value to be used when the Use Fixed Static is set to Yes. Select Yes if you are using an RTD for flowing temperature. Select Yes to use the Fixed Temperature instead of a measured temperature. Enter a value to be used when the Use Fixed Temperature is set to Yes. The Fixed Temperature will also be used in case of an RTD error if setup on the Fixed Values On Errors tab. No Flow Digital Input DI Action Flow State Enter the App/Array/Register used for the No Flow condition. Select whether an Open or Closed contact represents the No Flow condition. Indicate Flow or No Flow based on the digital input. Speed of Sound Speed of Sound Calculation Speed of Sound Select either Disabled or Enabled Displayed in feet/second Digital Output Digital Output 1 Digital Output Volume Setpoint Trip on Volume Setpoint Trip on DP Low Trip on DP High Trip on SP Low Trip on SP High Trip on TF Low Trip on TF High Trip on Fr Low Trip on Fr High Specify the output register for Digital Output 1 or Digital Output 2 depending on the tab selected. Enter the Volume Setpoint in MCF for tripping of the digital output by the Volume Setpoint command. If set to Yes, the digital output will be tripped each time the Volume Setpoint is reached. If set to Yes, the digital output will be tripped on the DP Low alarm. Alarm limits are set in the Limits tab. If set to Yes, the digital output will be tripped on the DP High alarm. Alarm limits are set in the Limits tab. If set to Yes, the digital output will be tripped on the SP Low alarm. Alarm limits are set in the Limits tab. If set to Yes, the digital output will be tripped on the SP High alarm. Alarm limits are set in the Limits tab. If set to Yes, the digital output will be tripped on the Flowing Temperature Low alarm. Alarm limits are set in the Limits tab. If set to Yes, the digital output will be tripped on the Flowing Temperature High alarm. Alarm limits are set in the Limits tab. If set to Yes, the digital output will be tripped on the Flow Rate Low alarm. Alarm limits are set in the Limits tab. If set to Yes, the digital output will be tripped on the Flow Rate High alarm. Alarm limits are set in the Limits tab. Page rev. AA
201 Trip on Charger Low Trip on Digital Input Digital Input DO Action Auto Reset Auto Reset Delay (Sec) Current State Manual Operation If set to Yes, the digital output will be tripped on the Low Charger alarm. The Low Charger alarm happens automatically if the charging source is removed or cannot maintain an adequate battery voltage. If set to Yes, the digital output will be tripped if the Digital Input specified below is set to a 1 (senses a closed contact). Specify a digital input register (format 0.0.0) for the Trip on Digital Input option. Select whether the digital output is to act as a Normally Open or Normally Closed contact. If set to Yes, the digital output will reset after the Auto Reset Delay time has elapsed. If set to No, Auxiliary Contact 1 will remain tripped until manually reset. Specify the amount of time in seconds Auxiliary Contact 1 will reset after being opened or closed by some action. Auto Reset must be set to Yes. Displays the current state of the digital output as Open or Closed. This function allows the user to manually operate the digital output. This might be done for testing purposes. If the DO Action parameter above is set to Normally Open, Trip will close the digital output, and Clear will open the digital output. If the DO Action parameter is set to Normally Closed, Trip will open the digital output and Clear will close it. Digital Output 2 (Same as Digital Output 1) Orifice The user can select the Orifice tab to change the Orifice Plate. The first option would be to ensure all read/write fields have the correct value selected. These fields are as follows: Orifice Diameter Hold Timeout Pipe Diameter Sp Tap Location Tap Type Enter the orifice diameter size in dimensional units. The user defines the duration of the Hold Timeout (default 60 minutes) to change the orifice plate. Enter the pipe diameter size in dimensional units. This read only field displays the location (upstream, downstream) of the Sp tap in relation to the orifice plate. Specified on Configuration tab. In this field, available displayed values for this read only field for Tap Type are: 1. No DP - No live differential pressure provided 2. Flange - Flange type taps 3. Corner - Corner taps 4. D-D/2 - D and D/2 taps 5. Custom - User must enter a value specified on Configuration tab. In addition to these read/write fields there are four read only fields displayed as follows: Temperature Pipe Ref Temp Orifice Plate Exp. Coefficient Current temperature reading As temperatures can cause the pipe size to change, the Pipe Reference Temperature represents the actual temperature at which the pipe size was measured. A standard expansion coefficient is used based on the material type. Three standard material types are provided (Stainless Steel, Monel and Carbon Steel) rev. AA Page 201
202 Orifice Pipe Exp. Coefficient If an orifice plate is used that consists of a different material, the user must select Other and enter an Expansion Coefficient in units. Move the decimal point 6 places to the right, and enter in the format of (x.xx) which is then scaled by the flow computer to x.xx times A standard expansion coefficient is used based on the material type. Three standard material types are available (Stainless Steel, Monel & Carbon Steel). If pipe is used of a different type material, the user must enter an Expansion Coefficient in units. Move the decimal point 6 places to the right, and enter in the format of (x.xx) which is then scaled by the flow computer to x.xx times E -6. Once all the fields are showing the desired values, the user must first select the Hold button to set the timer at 60 minutes. The flow pressure is then held for that period of time to allow the user to change the orifice plate. The user then presses the Change Orifice Plate button and changes the orifice plate. Once finished, the user would select the Flowing button to resume flow. Last Calculated Values The values in the Calc column display the last calculated values of variables that are specific to volume calculations. Updated frequency of the last calculated values is based on the Volume Calculation Period. The data displayed varies depending on the type of device and is for informational purposes only. Some of the information displayed will be familiar to the user, while others will not. As this is the case, the information presented is likely to be more useful to a Totalflow customer service representative than a field user. Qm Base Mass Qv Base Volume Volume Displayed in SCF (standard cubic feet) Mass Displayed in lbm (pounds of mass) Energy Displayed in MBtu (thousands of British thermal units) Xpt_Volp Displayed value in H2O.psia/R Displayed as a ratio of the density of the sample to the density of water. This value should be at the contracted pressure and temperature bases. Real Specific Gravity All Fpv methods. The Specific gravity or Base gravity, as it is called in liquid calculations, defaults to.658 but an accurate gravity if known should be entered. Displayed as the ratio of the specific heat at a constant pressure (Cp) to Specific Heat Ratio the specific heat at a constant volume (Cv). A standard value is 1.3. Fluid Viscosity Displayed in cp (centipoise), a unit of viscosity Z of Air at the contractual values for pressure base and temperature base. The user would enter a value for the Z of Air. This is the compressibility of Zbase of Air air at a reference temperature (typically 60 degrees F.) The default standard is Contract Baro Displayed in PSIA (pounds per square inch absolute) Pressure Base Displayed in PSIA (pounds per square inch absolute) Temperature Base Displayed in Degrees F. Base Compressibility Display follows one of four existing base conditions. Flowing Compressibility Calculated from the Base Compressibility A factor used to account for the following effect: Boyle's law for gases states that the specific weight of a gas is directly proportional to the Super Compressibility absolute pressure, the temperature remaining constant. All gases deviate from this law by varying amounts, and within the range of conditions Page rev. AA
203 ordinarily encountered in the natural gas industry, the actual specific weight under the higher pressure is usually greater than the theoretical. The factor used to reflect this deviation from the ideal gas law in gas measurement with an orifice meter is called the "supercompressibility factor"or Fpv. Fip Fip (Female Iron Pipe Connection) is the adaptor and will accept the pipe into its fitting Live Static Pressure Displays last live reading in PSIA (pounds per square inch absolute) Static Pressure Displays last static pressure reading in PSIA (pounds per square inch absolute) Differential Pressure Displays last differential pressure reading in INH2O (inches of water) Live Temperature Displays last live temperature reading in degrees F. Flowing Temperature Displays last flowing temperature reading in degrees F. Faux Displays faux or fpv (supercompressibility) value Water Vapor Factor (Fw) Displays the water vapor factor (Fw) Orifice Reference Temperature Pipe Reference Temperature Orifice Expansion Coefficient As temperatures can cause the orifice size to change, the Orifice Reference Temperature represents the actual temperature at which the orifice size was measured. As temperatures can cause the pipe size to change, the Pipe Reference Temperature represents the actual temperature at which the pipe size was measured. Select the Orifice material type from the drop-down list. A standard expansion coefficient is used based on the material type. Three standard material types are provided (Stainless Steel, Monel and Carbon Steel). If an Orifice is used of a different type material, the user must select "Other", and enter an Expansion Coefficient (inches per Deg. F). Move the decimal point six places to the right, and enter in the format of (x.xx) which is then scaled by the flow computer to x.xx times A standard expansion coefficient is used based on the material type. Three standard material types are available (Stainless Steel, Monel & Carbon Steel). If pipe is used of a different type material, the user must enter an Pipe Expansion Coefficient Expansion Coefficient in units. Move the decimal point 6 places to the right, and enter in the format of (x.xx) which is then scaled by the flow computer to x.xx times E-6. Pipe Inside Diameter Temperature Corrected Orifice ID Orifice Inside Diameter Y Expansion Factor Specific Heat Ratio C-Prime Static Factor (cp_s) C-Prime (cp) Live Flowing Density Base Density Flowing Density Displays pipe inside diameter in inches The Orifice ID corrected for temperature Displays orifice inside diameter in inches Displays Y (expansion factor), used in volume calculations Displays the ratio of Cp divided by Cv The Static Factor value displays here. The portion of the flow rate equation that is computed each Vol. Calc. Period. Assumes not using fixed data but live data from an external source Displays the Base Density used from the Start Date/Time to the End Date/Time. Displays the average Flowing Density used from the Start Date/Time to the End Date/Time rev. AA Page 203
204 Temperature Corrected The Pipe/Orifice Ratio corrected for temperature Pipe/Orifice Ratio (Beta) This parameter is often referred to as the velocity of approach factor and dividing the coefficient of discharge by that parameter (as was done above) produces the flow coefficient. Methods also exist for determining the flow coefficient as a function of the beta function and the location of the Velocity of Approach downstream pressure sensing tap. For rough approximations, the flow coefficient may be assumed to be between 0.60 and For a first approximation, a flow coefficient of 0.62 can be used as this approximates to fully developed flow. Defined for different situations where a fluid is in relative motion to a Reynold's Number surface including fluid properties of density and viscosity plus a velocity and an internal diameter Coefficient of Discharge factor (Cd) - Select Yes for the flow computer to calculate and use this factor in the volume calculations. Selecting No will Discharge Coefficient (Cd) cause the flow computer to use a Fixed Cd which is entered on the Constants tab. Select either Volume Based or Mass Based. This tells the software whether to multiply the calculated volume or mass by the heating value Heating Value Select which is found on the Fixed or Live Analysis tabs and provides the total heating value for the period. Generally the mole percentage of AIR displayed here is related to the mole AIR percentage of N2 (the chief component of air). C6+ (Index Split Mode) This affects both the NGC setup as far as the C6+ split and what C6+ information is sent to an external Modbus device. User Defined C6+ Reported - With this selection, the user specifies the C6+ split percentages for the NGC. Information sent to an external Modbus includes the split values as well as the C6+ value. Pre-defined C6+ Splits - If you select one of the four predefined split percentages, the NGC will use this selection for the split. If information is sent to an external Modbus device, it will include the C6+ value and a code representing the same split percentages. User Defined C6+ Not Reported - With this selection, the user specifies the C6+ split percentages for the NGC. Information sent to an external Modbus device includes the split values but not the C6+ value. SUAGA-7 Overview The Totalflow Fourth Generation XSeries flow computers (XFCG4) provide functionality though the convergence of RTU, PLC and flow computer concepts. The XFCG4 represents a unique milestone in the development of remote, low power measurement and control devices. All XFCG4 units feature multi-tube capacity --up to eight per individual unit or 20 tubes per unit in special cases-- with custodytransfer measurement features. The flexibility of these units, including backward compatibility with legacy Totalflow systems, allows the user to increase productivity and improves asset utilization. Page rev. AA

205 While the XFCG4 is designed for either differential (orifice) or pulse (linear) metering, the following information concentrates solely on pulse metering as it regards the SUAGA-7 standard. Outside of the United States, requirements for standards of measurement may differ from existing domestic standards in the oil and gas industry. For example DP measurement (inh2o) but in another country may be measured in kg/cm2 instead. To meet such need in the overseas markets, a Selectable Unit (SU) functionality has been added to the AGA-3 and AGA-7. Thus the new nomenclature of SUAGA-7 is to signify this functionality. The user can also use the general information displayed as a snapshot of the current existing values for each parameter listed. There can be up to eight (8) AGA-7 measurement applications instantiated per comm channel on the XFCG4 board. The fields displayed here are as follows: Tube Description Yesterday's Volume Today's Volume Calculation Type This is the user-designated description of the tube. This serves as an aid for the user when there is more than one tube application running in a single device. This is the prior Contract Day's volume. The Contract Day is defined as a 24- hour period that establishes the parameters for a complete day. Updated at the end of each Volume Calculation Period. At the end of each Volume Calculation Period, the counts for the period are multiplied times the K Factor to produce an uncorrected volume which is then multiplied times the currently selected AGA-7 factors (See Factors tab under Setup) to produce a Corrected Volume. Each Volume Calculation Period volume is added to the current volume for the duration of the Contract Day. Displays the type of flow calculation. The user can establish the parameters for the SUAGA-7 application using the read/write fields provided. These parameters are as follows: rev. AA Page 205
206 Contract Hour K Factor Flow Period Aux Factor (Faux) Fpv Method The Contract Hour is the start of the day for daily volumes. Enter the Contract Hour in military time (0-23). K-Factor specifies the volume of gas in actual cubic feet, represented by a single pulse from the measuring hardware. Therefore, the number of pulses is multiplied by the K-Factor to get the actual cubic feet which is the uncorrected volume. The uncorrected volume is then multiplied by C' to correct it to base conditions thus corrected volume. This variable can also be entered in the Calibration section. Flow Period is a read only window which displays the time period in seconds. Flow Period is used to establish whether flow or no flow conditions exist. If no pulses are received during a flow period, it is considered a period of no flow. Pressure and temperature data accumulated during that period are not included in the log period averages and therefore no volume during that flow period. This value is used when the Use Faux parameter is turned on below. This is a multiplication factor which directly affects the volume calculation. For example, a value of.9 would cause a 10% reduction in the calculated volume. Can be set to any value to allow for static corrections for site conditions that are not handled by the fundamental equation. An example would be a linear meter calibration shift. Select the supercompressibility (Fpv) method from the drop-down list. Available Fpv methods are: AGA8 Gross Method 1 - This method uses: Gross Heating Value, Relative Density and CO2. AGA8 Gross Method 2 - This method uses: Relative Density, Nitrogen and Carbon Dioxide. AGA8 Detail 92 - This method basically supports a total analysis. ISO This method supports total analysis as specified in the international standard ISO SGERG88 - This method adheres to the international standard ISO For this method to be viable, one of the following base conditions must exist: 0 C / 32 F and bar / psi 15 C / 59 F and bar / psi C / 60 F and bar / psi C / 60 F and bar / psi For detailed information on these methods, see the American Gas Association, Report No. 8 / American Petroleum Institute Chapter 14.2 and/or ISO Standards and The six tabs displayed horizontally at the top of the page include important displayed data as well as read/write fields the user would need to set up functions such as Analysis or Calibration. The seventh (Configuration), eighth (Adv Setup), ninth (Digital Output), tenth (K Factor) and eleventh (Last Calc Values) tabs are accessible by selecting the pulldown arrow to the right of the Calibration tab. The user can re-select the arrow to re-display the Calibration tab (information). Each tab with relevant information is discussed as follows: Page rev. AA
207 RealTime Here the color-coordinated parameters are charted either on graph or grid. By clicking on the individual parameter's box below the chart, it will be displayed or removed from the chart as the situation dictates. These variables include: SP, Pulse Count, Temperature and Flow. The Points button is used to set the range of the displayed cycle measured. The View button can be used to either display the parameter in a Graph (default) or a Grid format. There is an option to expand/collapse the Graph view. The Expand button shall expand the graph to full screen. The Collapse button will return the graph to normal view. Day The Day tab displays information for the user that is based on the accumulated daily totals for the meter. The information displayed is sectioned for one day per row with a date and time stamp. The Day button allows the user to set the number of days displayed at one time. The user can select the View button to display the charted information in a Grid (default) or Graph format. The user can hover the mouse cursor over any portion of the graph display to display the value and date/time of the variable reading. (This can also be done for any of the displayed variables on the graph.) It is possible to use the mouse to zoom a desired portion of the graph by holding down the left button, rolling the mouse to define the desired area and releasing the left button to capture the area. That portion of the graph will then display proportionately over that area. By selecting the now active House icon to the left of the Expand button, the graph will re-display to its original position. Legends are selectable under graph. In case the graph has more than four parameters, an option is provided on the bottom of the graph to select up to four possible variables for plotting in overlay and once selected, they will be shown on the bottom of the graph as legends (selectable). A minimum of one variable is to be selected. The parameters possible to display from the Options icon are as follows: Count SP TF Volume Avol Energy Cnt Min Cnt Max Avol Percent Low This field represents the total number of counts for the flow period. This field represents the static pressure. The value shown is the average of one second samples for the day. This field represents the flowing temperature. The value shown is the average of one second samples for the day. The Volume values are the sum of all the volume quantities that are calculated for each Volume Calculation Period during the Contract Day. Uncorrected volume for the Contract Day. The uncorrected volume for each Volume Calculation Period of the Contract Day is added together to produce a Daily uncorrected volume. This value represents the sum of energy quantities (MMBTU) that are accumulated since the beginning of the Contract Day. This is updated at the end of each Volume Calculation Period. At the end of the Volume Calculation Period, the energy quantity is calculated by multiplying the Volume Calculation Period volume by the energy content. Displays the minimum counts that occurred during any Flow Period during the Contract Day. Displays the maximum counts that occurred during any Flow Period during the Contract Day. Percentage of the time that the Uncorrected Volume is below the Uncorrected Volume Low Limit. Limits are set on the Limits tab of the Setup tree view item rev. AA Page 207
208 Avol Percent Hi SP Min SP Max SP Percent Low SP Percent Hi TF Min TF Max TF Percent Low TF Percent Hi Period Time Flow Time Percentage of the time that the Uncorrected Volume is above the Uncorrected Volume High Limit. Limits are set on the Limits tab of the Setup tree view item. Minimum Static Pressure recorded during the Contract Day. Maximum Static Pressure recorded during the Contract Day. Displays the percentage of time the Static Pressure was below the low limit during the Contract Day. Displays the percentage of time the Static Pressure was above the high limit during the Contract Day. Minimum Temperature recorded during the Contract Day Maximum Temperature recorded during the Contract Day Displays the percentage of time the Temperature was below the low limit during the Contract Day. Displays the percentage of time the Temperature was above the high limit during the Contract Day. If Day Period, enter the frequency at which the trend data is logged. The format is hh:mm:ss in which one second is the fastest allowable time. It is recommended that Log Periods not be set faster than is necessary to conserve the device s processor time. Also, the more frequent the Log Periods, the faster the available memory of the device is used. Number of one second samples where DP is above zero cutoff, divided by the number of one second samples in a day, times 100 (rounded to the nearest.5 seconds). Log The Log tab provides information for the log period records (typically hourly records) for the selected meter. The Day button allows the user to set the number of days displayed at one time. The user can select the View button to display the charted information in a Grid (default) or Graph format. The user can hover the mouse cursor over any portion of the graph display to display the value and date/time of the variable reading. (This can also be done for any of the displayed variables on the graph.) There is an option to expand/collapse the Graph view. The Expand button shall expand the graph to full screen. The Collapse button will return the graph to normal view. It is possible to use the mouse to zoom a desired portion of the graph by holding down the left button, rolling the mouse to define the desired area and releasing the left button to capture the area. That portion of the graph will then display proportionately over that area. By selecting the now active House icon to the left of the Expand button, the graph will re-display to its original position. Legends are selectable under graph. In case the graph has more than four parameters, an option is provided on the bottom of the graph to select up to four possible variables for plotting in overlay and once selected, they will be shown on the bottom of the graph as legends (selectable). A minimum of one variable is to be selected. The parameters displayed in this chart are as follows: Count SP TF This field represents the total number of counts for the flow period. This field represents the static pressure (PSIA). This field represents the flowing temperature (Deg F). Page rev. AA
209 Avol Volume Energy Flow Time Period Time Uncorrected volume for the Contract Day. The uncorrected volume for each Volume Calculation Period of the Contract Day is added together to produce a Daily uncorrected volume. This field displays the totalized volume (MCF). This value represents the sum of energy quantities (MMBTU). Flow Time is a read only window which displays the time period in seconds. Flow Time is used to establish whether flow or no flow conditions exist. If no pulses are received during a flow period, it is considered a period of no flow. Pressure and temperature data accumulated during that period are not included in the log period averages and therefore no volume during that flow period. Flow Period can also be viewed in the Entry Mode under the tube's Setup/General tab. Displays the total seconds from Start Date/Time to End Date/Time when there was flow. Flow is defined as any Flow Period (1 sec.) that contained pulses. Displays the time period in seconds (86400 secs = full day). Event The Event tab provides a table of events from the selected meter. The information is presented as one line per event with a date and time stamp. The Day button allows the user to set the number of days displayed at one time. The parameters displayed in this chart are as follows: Date/Time Event Old Value New Value SN Displays the date and time to the nearest second for the beginning of the event. This field displays the type of event that occurred. This field represents the value or condition that existed prior to the event. For example, using an SP check, this shows the actual reading (manually entered by the technician) when a test pressure is applied. This field represents the value or condition entered by the technician. For example, using an SP check, this is the test pressure applied on the transducer. If displayed, this is a sequence number assigned to each event. The numbers should be in sequence and if there is a gap in the sequence, it could signal a problem. Analysis The Analysis tab provides information on the composition elements and other parameters of either Fixed or Live analysis. The user can opt for either analysis method by selecting the corresponding button. In Fixed analysis, the user can use the Edit All option from the Composition Elements column to edit each or all of the read/write fields to set the individual percentage of each element. The right Gas Properties column has two read/write fields that can be selected and edited as well. These two fields are as follows: Heating Tb and Pb Calculation of Energy is based on Volume or Mass. Energy is calculated by multiplying the Heating Value times the Volume or Mass. Real Specific This value should be at the contracted pressure and temperature bases. Gravity The Others section only has one editable field as follows: rev. AA Page 209
210 FPV Method Select the compressibility (Fpv) method from the drop-down list. Available Fpv methods are: AGA8 Gross Method 1 - This method uses: Gross Heating Value, Relative Density and CO2. AGA8 Gross Method 2 - This method uses: Relative Density, Nitrogen and Carbon Dioxide. AGA8 Detail 92 - This method basically supports a total analysis. ISO This method supports total analysis as specified in the international standard ISO SGERG88 - This method adheres to the international standard ISO For this method to be viable, one of the following base conditions must exist: 0 C / 32 F and bar / psi 15 C / 59 F and bar / psi C / 60 F and bar / psi C / 60 F and bar / psi For detailed information on these methods, see the American Gas Association, Report No. 8 / American Petroleum Institute Chapter 14.2 In Live analysis, the user relies on real time data as displayed in each field under the Live column. The values in the Calc column display the last calculated values of variables that are specific to volume calculations. Update frequency of the last calculated values is based on the Volume Calculation Period. The data displayed varies depending on the type of device and is for informational purposes only. Some of the information displayed will be familiar to the user, while others will not. As this is the case, the information presented is likely to be more useful to a Totalflow customer service representative than a field user. The Advanced Setup is comprised of the Analysis Setup and the Therms Setup. In the Analysis Setup, the first three user defined fields deal with the type and duration of the analysis type selected. The multiple configuration parameters default to use the fixed values although multiple options are available for the user. The Therms Setup allows the user to select the fields to assign required values for the assigned fields. These fields are defined as follows: If using analyzer data from a Master, select the stream number to use. If not using analyzer data, select None. Selecting a stream will cause what is Attached to Stream # referred to as an Attachment. This logs an event in the Event file, sets the analysis period from 0 to 1 hour and sets a bit to tell the unit to use Live Analysis from the analyzer. Enter four numeric numbers to help uniquely define the measurement tube's stream ID (e.g., 1234). Each measurement tube must have a unique stream Stream ID ID. The tube's complete stream ID is composed of the four digit stream ID assigned here, the analyzer Modbus ID and the stream number currently attached (e.g., ). Analyzer Modbus ID or Btu Stream Unit # If this tube application is running on a flow computer, enter the Modbus ID of the external Therms analyzer. If this tube application is running on an NGC and the source of the analysis data is a Btu application, enter the Btu Unit Number. If this tube application is running on an NGC and the source of the Page rev. AA
211 Stream Source App analysis data is a Therms application, enter the Modbus ID of the external Therms analyzer. Enter the application number of the application providing the analysis information. This can be a Therms Master, Therms Slave or a Btu Stream application. A Btu Stream application only applies to an NGC. Calibration The Calibration tab provides necessary information to assist the user in completing the calibration process and a resulting report. With the tab selected, the Select Calibration Type button is initially selected to display the desired calibration check. To start the calibration, select the type. Note the display of the Calibration Options fields change depending on the calibration type selected as follows: Do you want to calibrate in Absolute? Barometric Pressure Tolerance (% Diff) Hold Timeout Calibration Points Temperature Bias This option is simply an aid for doing Static Pressure checks. Selecting gauge allows the user to enter values directly from the test pressure without having to add the barometric pressure which is automatically included. (applies to the following calibration checks: Static Pressure) This value is subtracted from Absolute pressure readings when calibrating the static pressure in gauge pressure and for displaying the static pressure in gauge on the device s display. This value is also entered on the calibration screen when calibrating in gauge pressure. (applies to the following calibration checks: Static Pressure) The user selects a tolerance value equal to a desired % of the range; a warning message will display if the difference between the measured value and entered value exceeds this value. (applies to the following calibration checks: DP-SP, Differential Pressure, Static Pressure, Temperature/RTD) When the user chooses to move into Calibration mode, the tube immediately moves into Hold Timer mode. The Hold Time Out (seconds) field allows the user to set a time frame (in seconds) from which to take the tube out of hold. The default is set to 3600 seconds (1 hour), but the user can establish a different time frame based on their individual needs. It should be noted that the timer starts as soon as the user moves into Calibration mode. (applies to the following calibration checks: DP-SP, Differential Pressure, Static Pressure, Temperature/RTD) The user would select the number of calibration points from this field. Options are 3 Points or 5 Points. With the setup complete, the 3 or 5 point Target pressure values will be calculated for convenience. These are suggested because of being evenly spaced across the calibration range, but it is not mandatory that these be used. (applies to the following calibration checks: DP-SP, Differential Pressure, Static Pressure, Temperature/RTD) If the user chooses to use Temperature/RTD as a calibration method, select the Temperature Bias field under Calibration Options. This allows the user to rev. AA Page 211
212 enter a new value. The RTD's temperature will always be biased by this value. (applies to the following calibration checks: Temperature/RTD) The user would change the value of any of the fields displayed for the check selected as needed. Then the Start Calibration button would be selected to start the process. The tube goes into the Hold state and the hold timer value for that tube is displayed on the right corner of the tab (defaults to 3600 seconds or one hour). The SP Calibrate screen allows for doing checks or doing checks and a calibration. Start with doing checks and then continue with the calibration if needed. The As Found checks are created by applying different test pressures across the calibration range. For each test pressure applied, enter the test pressure in the Test box and click the Check Mark. The live reading will be displayed in the Live/Found box and be captured along with the entered Test value when the Check Mark is clicked. The % difference between the Test value and the live value will also be displayed. Repeat the process to enter the number of points desired. If checks are all that are required, click "Accept and Finish" or "Continue to Calibrate" to do a calibration. Page rev. AA

213 If the user chooses to calibrate, the Calibrate screen will display with the points plotted and listed in a table. If a 3-point calibration had been selected in setup but had done more than three checks, the user would have the option to check the boxes of desired points to use for the calibration. If however, a 3-point calibration was set up and three checks were done, naturally there is no option. If needed, use the RE-ZERO function to shift up or down the calibration range so that the low end is true zero. Click the Calibrate button to continue rev. AA Page 213
214 If the user is satisfied at this point, the Accept & Finish button is selected. If not satisfied, the user can select the Re-calibrate button until satisfied. Selecting the Accept & Finish button will complete this calibration. If the user wants to start the process over and not accept the entries, the Abort button would be selected instead. The final Calibration Check is the Temperature/RTD. This process is also the same as the SP Calibration Check. With a completed calibration, the appropriate box or boxes would be checked. The user could then select the Generate Report button to generate a report in HTML. Configuration The user can select the Configuration tab to access the read/write and read only fields used to set up data needed for configuration. The following nine (9) areas of fields are accessible to the user: Constants Page rev. AA
215 Factors Setup Density Current Values Commands Fixed Values on Errors Log Capacity Limits The following information is provided in relation to all parameters and their fields: Constants Barometric Pressure Pressure Base (Pb) Temperature Base (Tb) Z of Air Tb and Pb Auxiliary Factor (Faux) K Factor Factors This value is subtracted from Absolute pressure readings when calibrating the static pressure in gauge pressure and for displaying the static pressure in gauge on the device s display. This value is also entered on the calibration screen when calibrating in gauge pressure. Enter the Pressure Base in the units specified. A specific Pressure Base value may be required because of contractual agreements. Enter the Temperature Base in the units as specified by the Units column. A specific Temperature Base may be required because of contractual agreements. Z of Air at the contractual values for pressure base and temperature base. The user would enter a value for the Z of Air. This is the compressibility of air at a reference temperature (typically 60 degrees F.) The default standard is This value is used when the Faux factor is turned on. Faux is simply a multiplication factor times the computed gas volume that can be used to correct for a known error condition. This factor is typically used for what is referred to as the Full Well Stream Factor. This is used to adjust the computed gas volume downward to account for the portion of the measured stream that is liquid. K-Factor specifies the volume of gas in actual cubic feet, represented by a single pulse from the measuring hardware. Therefore, the number of pulses is multiplied by the K-Factor to get the actual cubic feet which is the uncorrected volume. The uncorrected volume is then multiplied by C' to correct it to base conditions thus corrected volume. This variable can also be entered in the Calibration section. Use Fpc Use Ftc Use Fs Use Faux Select Yes to use the Pressure Correction Factor (Fpc). Calculated by dividing the Volume Calculation Period average SP by the Pressure Base. Select Yes to use the Temperature Correction Factor (Ftc). Calculated by dividing the Temperature Base by the Volume Calculation Period average temperature. Select Yes to use the Compressibility Factor (Fs). Fs is equal to Fpv 2. Fpv is based on the Fpv method selected in General tab and analysis data. Full Well Stream Factor (Faux) - Select Yes for the device to use the Faux value entered by the user in the Constants tab. Typically, used as a Full Well Stream factor which is used to adjust the computed gas volume downward to account for the portion of the measured fluid stream that is liquid. The user enters a value which will be used as a direct multiplier when calculating the volume. For example, a value of 0.9 would result in a volume reduction of 10%. The percentage liquids in the stream rev. AA Page 215
216 is typically determined by a Full Well Stream Test. Since Faux is a direct multiplier to the volume, it can be used for any correction to the volume not accounted for in the basic equation. Setup Device/APP ID Tube Description Contract Hour Vol Calc Period Log Period Flow Period Enter up to ten alpha-numeric characters for the Device/APP ID. This identifies the specific application or flow calculation. A Station or device can have multiple flow calculations running simultaneously, and each of those will have their own Device/APP ID. Enter alphanumeric characters for a description of the tube. This is helpful when there is more than one tube application running in a single device. Enter the contract hour in military time (0-23). The contract hour is the start of the day for daily volumes. Select the volume calculation period from the drop-down list. Options are 1, 2, 5, 10, 20, 30 and 60 seconds/minutes. This is the rate at which the volume is calculated based on one second averages of SP, DP and Temperature. Unless otherwise required, the default of 60 minutes is recommended. This period can be the same as but should never be greater than the log period. If not the same, the log period should always be an even multiple of the volume calculation period. Select the log period from the drop-down list. Options are 1, 2, 5, 10, 20, 30 and 60 minutes. This is the rate at which the calculated volumes are logged to the historical file. Unless otherwise required, the default of 60 minutes is recommended. This period can be the same as but should never be less than the volume calculation period. If not the same, it should always be an even multiple of the volume calculation period. This option is only valid in devices supporting the new database (DB2) and when in the Extended Characteristic mode. A default period of one hour is used all other times. Flow Period is a read only window which displays the time period in seconds. Flow Period is used to establish whether flow or no flow conditions exist. If no pulses are received during a flow period, it is considered a period of no flow. Pressure and temperature data accumulated during that period are not included in the log period averages and therefore no volume during that flow period. Flow Period can also be viewed in the Entry Mode under the tube's Setup/General tab. Displays the type of flow calculation which is API Liquid. This is a read-only Calculation Type parameter. Fpv Method Select the compressibility (Fpv) method from the drop-down list. Available Fpv methods are: AGA8 Gross Method 1 - This method uses: Gross Heating Value, Relative Density and CO2. AGA8 Gross Method 2 - This method uses: Relative Density, Nitrogen and Carbon Dioxide. AGA8 Detail 92 - This method basically supports a total analysis. ISO This method supports total analysis as specified in the international standard ISO SGERG88 - This method adheres to the international standard ISO For this method to be viable, one of the following base conditions must exist: 0 C / 32 F and bar / psi 15 C / 59 F and bar / psi Page rev. AA
217 C / 60 F and bar / psi C / 60 F and bar / psi For detailed information on these methods, see the American Gas Association, Report No. 8 / American Petroleum Institute Chapter K-Factor Type Heating Value Method Last Analysis Time Hold Time Out (Seconds) Specify whether input pulses are Volume per Pulse or Pulse per Volume. Select either Volume Based or Mass Based. This tells the software whether to multiply the calculated Volume or Mass times the Heating Value which is found on the Fixed or Live Analysis tabs and provides the total heating value for the period. If using live analysis, this is the time and date that a last good live analysis was received. Sets a time duration (in seconds) that informs the device how long to remain in Hold when the user is in Calibration mode. The default is set to 3600 (1 hr.). This is primarily protection against getting side-tracked and forgetting to take the unit out of Hold. This pertains to any tube that is put in Hold while in Calibration mode. NOTE: Engineering units are established on the Selectable Units Setup tab accessible by clicking on the Station ID. The Station ID is the very top name on the tree-view. Density Base Condition Density Source Select one of three sources to use for the density for base conditions: Calculated from Real Specific Gravity - This selection causes the Specific Gravity to be picked up from the Fixed or Live Analysis data section and used to calculate the density. Calculated from AGA8 Detail - This selection uses the AGA8 Detail Fpv method and requires that the AGA8 Detail Fpv method be used as selected on the General tab. User Entered - If used, the entered value needs to match up with the Real Specific Gravity in the Analysis section. Enter the value in the User Entered Density field as shown below. This selection is not recommended if any of the other methods are viable. Base Condition User Enter the density to be used if User Entered was selected as the Density Entered Density Source for base conditions. Flowing Condition Density Source Select one of four sources to use for the density for flowing conditions: Calculated from Real Specific Gravity - This selection causes the Specific Gravity to be picked up from the Fixed or Live Analysis data section and used to calculate the density Calculated from AGA8 Detail - This selection uses the AGA8 Detail Fpv method and requires that the AGA8 Detail Fpv method be used as selected on the General tab. User Entered - If used, the entered value needs to match up with the Real Specific Gravity in the Analysis section. Enter the value in the User Entered Density field as shown below. This selection is not recommended if any of the other methods are viable. Live Measured - This method assumes density is brought via an external source such as a densitometer. If used, specify the app/array/register for the Live Density Input Register rev. AA Page 217
218 Flowing Condition User Entered Density Live Density Input Register Enter the density to be used if User Entered was selected as the Density Source for flowing conditions. Specify the App/Array/Register for the source of the density value if Live Measured was selected as the Density Source for flowing condition. If an onboard analog input or TFIO module is used for the input, the address can be found under the I/O Interface tree-view item. Current Values Select either Volume/Pulse or Pulses/Volume. When Volume/Pulse is selected, pulses are multiplied by the K-Factor to calculate the uncorrected (actual) Current Uncorrected volume. When Pulses/Volume is selected, pulses are multiplied by the reciprocal of the K-Factor to calculate the uncorrected (actual) volume. Current Mass Flow The Mass Flow Rate is the Mass Volume for the Volume Calculation Period. Rate Current Energy Flow The Indicated Flow Rate times the Heating Value. Rate Updated at the end of each Volume Calculation Period. At the end of each Volume Calculation Period, the counts for the period are multiplied times the K Factor to produce an uncorrected volume which is then multiplied times the Today's Volume currently selected SUAGA-7 factors (See Factors tab under Setup) to produce a Corrected Volume. Each Volume Calculation Period volume is added to the current volume for the duration of the Contract Day. Updated at the end of each Volume Calculation Period. At the end of each Today's Uncorrected Volume Calculation Period, the counts for the period are multiplied times the K Volume Factor to produce an uncorrected volume. Each Volume Calculation Period volume is added to the current volume for the duration of the Contract Day. Updated at the end of each Volume Calculation Period. Each Volume Today's Mass Calculation mass is added to the current mass for the duration of the Contract Day. Updated at the end of each Volume Calculation Period. The sum of energy quantities accumulated since the beginning of the contract day. At the end of Today's Energy each Volume Calculation Period, the energy quantity is calculated by multiplying the Volume Calculation Period volume by the energy content. This is the prior Contract Day's volume. The Contract Day is defined as a 24- Yesterday's Volume hour period that establishes the parameters for a complete day. Yesterday's Prior Contract Day s uncorrected volume. See Today s UC Volume for the Uncorrected Volume calculation procedure. Yesterday's Mass Prior Contract Day s Mass. Yesterday's Energy Prior Contract Day s energy. Accumulated Volume Updated at the end of each Volume Calculation Period. At the end of each Volume Calculation Period, the counts for the period are multiplied times the K Factor to produce an uncorrected volume which is then multiplied times the currently selected SUAGA-7 factors (See Factors tab under Setup) to produce a Corrected Volume. Each Volume Calculation Period corrected volume is then added to the Accumulated Volume. This continues until zeroed by the Reset Volume command or an accumulator rollover happens. Accumulated Updated at the end of each Volume Calculation Period. At the end of each Uncorrected Volume Volume Calculation Period, the counts for the period are multiplied times the K Page rev. AA
219 Factor to produce an uncorrected volume which is added to the Accumulated UC Volume. This continues until zeroed by the Reset Volume command or an accumulator rollover happens. Updated at the end of each Volume Calculation Period. At the end of each Accumulated Mass Volume Calculation Period, the mass is added to the current running total until zeroed by the Reset Volume command or an accumulator rollover happens. Updated at the end of each Volume Calculation Period. At the end of each Accumulated Energy Volume Calculation Period, the energy is added to the current running total until zeroed by the Reset Volume command or an accumulator rollover happens. Last Calculated Volume for the last Volume Calculation Period. Volume Last Calculated Uncorrected Volume for the last Volume Calculation Period. Uncorrected Volume Last Calculated Mass for the last Volume Calculation Period. Mass Last Calculated Energy for the last Volume Calculation Period. Energy Commands Reset Volume Set Uncorrected Volume to > Reset Log Period Set site code Select Yes from the drop-down menu, and click the Send button. The user will be asked to confirm the request. Answer Yes for the request to be carried out. A typical use for this command is just prior to an orifice plate change on a gas orifice meter. The device reacts, as follows, to a Reset Volume: Completes all computations for the present flow file daily record. Stores date/time and partial log period's volume into its historical record. Logs an event with the accumulator value before zeroing the accumulator. Zeroes the total volume accumulator. Begins a new flow file daily record. Enter the provided value of the Uncorrected Volume. Select Yes from the drop-down menu, and click the Send button. The user will be asked to confirm the request. Answer Yes for the request to be carried out. This is similar to a Reset Volume, except the volume accumulator is not zeroed. A typical use for this command is just prior to an orifice plate change on a gas orifice meter. The device reacts, as follows, to a Reset Log Period: Completes all computations for the present flow file daily record. Stores date/time and partial log period's volume into its historical record. Logs an event in the Event file. Begins a new flow file daily record. Enter up to seven numerical digits, and a decimal point is allowed anywhere among the digits. A site code entry enters an event in the event file using the site code number. This number can represent anything to the user as some function performed at the site rev. AA Page 219
220 Fixed Values on Errors Use Fixed Sp on Error Fixed Sp Value Sp High Error Sp Low Error Use Fixed Tf on Error Fixed Tf Value Tf High Error Tf Low Error Select Yes to use or No to not use the Fixed Sp Value if the Static Pressure exceeds the Sp High Error value or drops below the Sp Low Error value. Enter the Static Pressure value to be used if Use Fixed Sp On Error is set to Yes and the Static Pressure has exceeded the Sp High Error or dropped below the Sp Low Error value. Enter the value to be used for the Static Pressure High Error. Enter the value to be used for the Static Pressure Low Error. Select Yes to use or No to not use the Fixed Tf Value if the Flowing Temperature exceeds the Tf High Error value or drops below the Tf Low Error value. Enter the Flowing Temperature value to be used if Use Fixed Tf On Error is set to Yes and the Flowing Temperature has exceeded the Tf High Error or dropped below the Tf Low Error value. Enter the value to be used for the Flowing Temperature High Error. Enter the value to be used for the Flowing Temperature Low Error. Log Capacity Maximum # Daily Records Maximum # Log Period Records Maximum # Event Records Enter the maximum number of Daily Records that the device will store. The default of 50 is recommended. Enter the maximum number of Log Period Records that the device will store. The default of 970 is recommended. 970 allows for 40 days of hourly records. One Log Period Record is used no matter what the Log Period time. Enter the maximum number of Event Records that the device will store. Each entry into the Event file is a record. Limits Sp High Limit Sp Low Limit Tf High Limit Tf Low Limit Flow Rate High Limit Flow Rate Low Limit Uncorr Vol High Limit Uncorr Vol Low Limit This represents the higher limit of the static pressure value that can be sent to the tube application. This represents the lower limit of the static pressure value that can be sent to the tube application. This represents the higher limit of the total flowing temperature value that can be sent to the tube application. This represents the lower limit of the total flowing value that can be sent to the tube application. This represents the higher limit of the flow rate value that can be sent to the tube application. This represents the lower limit of the flow rate value that can be sent to the tube application. At the end of each Volume Calculation Period, the counts for the period are multiplied times the K Factor to produce an uncorrected volume. The High Limit for the uncorrected value is set in this field to specify which values can be sent to the application. At the end of each Volume Calculation Period, the counts for the period are multiplied times the K Factor to produce an uncorrected volume. The Low Limit for the uncorrected value is set in this field to specify which values can be sent to the application. Page rev. AA
221 Adv Setup Adv Setup Static Pressure Pulse Input Temperature Static Pressure Type Use Fixed Static Fixed Static RTD Installed Use Fixed Temp Fixed Temp Displays the current scaled static pressure. If Pulse Input Vol or Pulse Input Mass was selected for the Flow Input Type, enter the pulse input register here. Snapshot of the current flowing temperature. Select whether the static pressure is coming from a Gauge or Absolute pressure device. Select Yes to use the Fixed Static Pressure instead of a measured pressure. Used for AGA-7 tubes when static pressure is not available. Enter a value to be used when the Use Fixed Static is set to Yes. Select Yes if you are using an RTD for flowing temperature. Select Yes to use the Fixed Temperature instead of a measured temperature. Enter a value to be used when the Use Fixed Temperature is set to Yes. The Fixed Temperature will also be used in case of an RTD error if setup on the Fixed Values On Errors tab. No Flow Digital Input DI Action Flow State Specify a digital input register (format 0.0.0) for the Trip on Digital Input option. Select whether an Open Contact or a Closed Contact constitutes a No Flow condition. Displays the Flow State as Flow or No Flow based on the Digital Input specified above and the DI Action selected. Speed of Sound Speed of Sound Calculation Speed of Sound Speed of Sound is calculated based on AGA-10 specifications and is provided to the user to use as they see fit and is not used by the NGC for any subsequent calculations. Pressure and temperature are two additional parameters required for the calculation which are not typically available in the NGC. This screen allows for the entry of registers if the two values are brought via an external source, or permits the user to enter a fixed value for either or both parameters. Displays the calculated value of the Speed of Sound based on AGA-10 specifications. Digital Output Digital Output 1 Digital Output Volume Setpoint Trip on Volume Setpoint Trip on ACF Low Trip on ACF High Specify the output register for Digital Output 1 or Digital Output 2 depending on the tab selected. Enter the Volume Setpoint in MCF for tripping of the digital output by the Volume Setpoint command. If set to Yes, the digital output will be tripped each time the Volume Setpoint is reached. If set to Yes, the digital output will be tripped on the ACF Low alarm. Alarm limits are set in the Limits tab. If set to Yes, the digital output will be tripped on the ACF High alarm. Alarm limits are set in the Limits tab rev. AA Page 221
222 Trip on SP Low Trip on SP High Trip on TF Low Trip on TF High Trip on FR Low Trip on FR High Trip on Charger Low Trip on Digital Input Digital Input DO Action Auto Reset Auto Reset Delay (Sec) Current State Manual Operation If set to Yes, the digital output will be tripped on the SP Low alarm. Alarm limits are set in the Limits tab. If set to Yes, the digital output will be tripped on the SP High alarm. Alarm limits are set in the Limits tab. If set to Yes, the digital output will be tripped on the Flowing Temperature Low alarm. Alarm limits are set in the Limits tab. If set to Yes, the digital output will be tripped on the Flowing Temperature High alarm. Alarm limits are set in the Limits tab. If set to Yes, the digital output will be tripped on the Flow Rate Low alarm. Alarm limits are set in the Limits tab. If set to Yes, the digital output will be tripped on the Flow Rate High alarm. Alarm limits are set in the Limits tab. If set to Yes, the digital output will be tripped on the Low Charger alarm. The Low Charger alarm happens automatically if the charging source is removed or cannot maintain an adequate battery voltage. If set to Yes, the digital output will be tripped if the Digital Input specified below is set to a 1 (senses a closed contact). Specify a digital input register (format 0.0.0) for the Trip on Digital Input option. Select whether the digital output is to act as a Normally Open or Normally Closed contact. If set to Yes, the digital output will reset after the Auto Reset Delay time has elapsed. If set to No, Auxiliary Contact 1 will remain tripped until manually reset. Specify the amount of time in seconds Auxiliary Contact 1 will reset after being opened or closed by some action. Auto Reset must be set to Yes. Displays the current state of the digital output as Open or Closed. This function allows the user to manually operate the digital output. This might be done for testing purposes. If the DO Action parameter above is set to Normally Open, Trip will close the digital output, and Clear will open the digital output. If the DO Action parameter is set to Normally Closed, Trip will open the digital output and Clear will close it. Digital Output 2 (Same as Digital Output 1) K Factor The K Factor specifies the volume of gas in actual cubic feet, represented by a single pulse from the measuring hardware. Therefore, the number of pulses is multiplied by the K Factor to get the actual cubic feet which is known as the uncorrected volume. The uncorrected volume is then multiplied by C' to correct it to base conditions thus corrected volume. This variable can also be entered in the Calibration section. Note: Items that require engineering units have a Variable Group number in the Description column beside the description. The user may need to change units for a particular Variable Group or change the Multiplier for a Variable Group which is done on the Units tree-view item under the corresponding measurement tube. Click on the Units tree-view item, and note that all tabs have a left-hand column that contains the Application, Array, Register numbers (xx.xx.xx), and in this case, the last set of numbers match the associated Variable Group number. If the user needs to change the engineering units, they would click on the Units tree-view item, and look at the left column of each tab to locate the Page rev. AA
223 Variable Group whose last set of numbers as represented by "yy" (xx.xx.yy) match the Group number they are looking for. Keep in mind that changing the Units for a particular Variable Group will typically affect more than one item. After selecting the K Factor tab, the first choice is to determine the K Factor Mode under the General Setup section. Options are either Single Point or Multi Point. In this case the Single Point was selected and displays in the upper right hand corner of the screen (green). The Factor Type is then selected depending on whether the number of pulses is divided by the K Factor (Volume/Pulse) or multiplied by the inverse of the K Factor (Quantity/Pulse). The following information explains the remaining portions of the Single Point page: Single Point K Factor Points This field is read only. There is no access to selecting calibration points unless in Multi Point mode. MultiPoint K Factor Setup Dynamic K - displays the current K factor assuming a successful multipoint calibration has been completed and the multipoint calibration feature has been turned on General Setup The following read/write fields are active and defined in Single Point mode: Multi Point Calibration Enable - the user can elect to enable or cancel a Multi Point calibration K Factor Type - the user can define the K Factor as either Quantity/Pulse or Pulse/Quantity Single Point K Factor The user is enabled to define the K Factor in the Single Point mode If the user selects instead the Multi Point option under the K Factor Mode (General Setup), Multi Point will display (green) in the upper right corner of the screen. Again, the Factor Type is then selected depending on whether the number of pulses is divided by the K Factor (Volume/Pulse) or multiplied by the inverse of the K Factor (Quantity/Pulse). A major change in the Overview part of the screen is that Dynamic K displays in the read-only field where K Factor had displayed previously. The following information explains the remaining portions of the Multi Point page: MultiPoint K Factor Points Up to 11 points can be defined by the user for these fields but the Edit All convention must be used since no single row edits are able to be defined individually only collectively. The two following fields are defined: MultiPoint K Factor Setup Dynamic K - displays the current K factor assuming a successful multipoint calibration has been completed and the multipoint calibration feature has been turned on Calibration Points - displayed as read/write by the user. General Setup The following read/write fields are active and defined in Multi Point mode: Multi Point Enable - the user can elect to enable or cancel a Multi Point calibration rev. AA Page 223
224 K Factor Type - the user can define the K Factor as either Pulse/Quantity or Quantity only Single Point K Factor This field is read only in Multi Point mode. There will also be two buttons available to the user: Abort Calibration (Cancel) and Complete Calibration (Commit). Last Calculated Values The values in the Calc column display the last calculated values of variables that are specific to volume calculations. Updated frequency of the last calculated values is based on the Volume Calculation Period. The data displayed varies depending on the type of device and is for informational purposes only. Some of the information displayed will be familiar to the user, while others will not. As this is the case, the information presented is likely to be more useful to a Totalflow customer service representative than a field user. Volume Displayed in SCF (standard cubic feet) Temperature Correction Factor (Ftc) Displays the average Temperature Correction (Ftc) Factor from the Start Date/Time to the End Date/Time. Uncorrected Volume Sum of all the volume quantities calculated for each Volume Calculation Period during the Contract Day. At the Pressure Correction end of each Volume Calculation Factor (Fpc) Period, the counts for the period are multiplied times the K Factor to produce an uncorrected volume. Displays the average Pressure Correction (Fpc) Factor from the Start Date/Time to the End Date/Time. Mass Displayed in lbm (pounds of mass) Base Compressibility Displays the Compressibility factor which is a factor that is used to account for the deviation of a gas from volumetric ideality (non ideal gas behavior). Three methods are used in the Totalflow NGC. NX-19, AGA 8, AGA5. Energy Displayed in MBtu (thousands of British thermal units) Flowing Compressibility Calculated from the Base Compressibility Real Specific Gravity Displayed as a ratio of the density of the sample to the density of water (Supercompress)^2 The value calculated by the selected fpv method squared (fpv2) to derive the compressibility factor (Fs) for pulse meters Intentionally left blank Intentionally left blank Supercompressibility A factor used to account for the following effect: Boyle's law for gases states that the specific weight of a gas is directly proportional to the absolute Page rev. AA
225 Zbase of Air Live Static Pressure Static Pressure Contract Baro Pressure Pressure Base Temperature Base Z of Air at the contractual values for pressure base and temperature base. The user would enter a value for the Z of Air. This is the compressibility of air at a reference temperature (typically 60 degrees F.) The default standard is Displays last live reading in PSIA (pounds per square inch absolute) Displays last static pressure reading in PSIA (pounds per square inch absolute) The barometric pressure should display PSIA Displayed in PSIA (pounds per square inch absolute) Displayed in Degrees F. Live Displays the value of live Temperature temperature Live Flowing Density Base Density Flowing Density Pulse Count ACF K Factor Dynamic K pressure, the temperature remaining constant. All gases deviate from this law by varying amounts, and within the range of conditions ordinarily encountered in the natural gas industry, the actual specific weight under the higher pressure is usually greater than the theoretical. The factor used to reflect this deviation from the ideal gas law in gas measurement with an orifice meter is called the "Supercompressibility factor" or Fpv. Displays the Live Flowing Density used from the Start Date/Time to the End Date/Time. Displays the Base Density used from the Start Date/Time to the End Date/Time. Measured or Calculated from the provided Base Density. Displays the total pulses from the Start Date/Time to the End Date/Time. Uncorrected Flow converted to Actual Cubic Feet (ACF) for use by the totalflow device K-Factor specifies the number of pulses required per volume of liquid. To get the Indicated Volume, the number of pulses is divided by the K-Factor or multiplied by the inverse of the K- Factor depending on whether the K-Factor Method is set to Quantity/Pulse or Pulse/Quantity. Displays the current K-Factor based on the current pulse frequency when Monitor box is rev. AA Page 225
226 Displays the average Flowing Flowing Temperature from the Start Temperature Date/Time to the End Date/Time. C-Prime The Static Factor value Static Factor displays here. (cp_s) Heating Value Selected Energy Vol Based checked or the Re-read button is clicked. This assumes a successful multipoint calibration has been done and the multipoint calibration feature is turned on. Select either Volume Based or Mass Based. This tells the software whether to multiply the calculated Volume or Mass times the Heating Value which is found on the Fixed or Live Analysis tabs and provides the total heating value for the period. Using the heating value times volume to calculate the energy Intentionally left blank Intentionally left blank Energy Mass Based Using the heating value times mass to calculate the energy C Prime (cp) Constant Pressure (Cp) divided by Constant Volume (Cv) yields the Specific Heat Ratio Air Generally the mole percentage of AIR displayed here is related to the mole percentage of N2 (the chief component of air). This affects both the NGC setup as far as the C6+ split and what C6+ information is sent to an external Modbus device. User Defined C6+ Reported - With this selection, the user specifies the C6+ split percentages for the NGC. Information sent to an external Modbus includes the split values as well as the C6+ value. Pre-defined C6+ Splits - If you select one of the four predefined split percentages, the NGC will use this selection for the split. If information is sent to an external Modbus device, it will include the C6+ value and a code representing the same split percentages. User Defined C6+ Not Reported - With this selection, the user specifies the C6+ split percentages for the NGC. Information sent to an external Modbus device includes the split values but not the C6+ value. Faux Faux defaults to but can be changed in the Constants tab by the user. C6+ (Index Split Mode) Page rev. AA
 that are excited to vibrate at resonant frequency. Coriolis meters are used with liquids and gases.")
227 SU Coriolis Overview Coriolis flow meters can be used for the measurement of natural gas flow. A Coriolis meter is usually one or more pipes with longitudinally or axially displaced section(s) that are excited to vibrate at resonant frequency. Coriolis meters are used with liquids and gases. When the fluid within the displaced section is at rest, both the upstream and downstream portion of the displaced section will vibrate in phase with each other. The frequency of this vibration is determined by the overall density of the pipe (including its contents). This allows the meter to measure the flowing density of the gas in real time. Once the fluid begins to flow, however, the Coriolis effect comes into play. This effect implies a relationship between the phase difference in the vibration of the upstream and downstream sections and the mass flow rate of the fluid contained by the pipe. Again, owing to the amount of inference, analog control and calculation intrinsic to a Coriolis meter, the meter is not complete with just its physical components. There are actuation, sensing, electronic and computational elements that must be present for the meter to function. Coriolis meters can handle a wide range of flow rates and have the unique ability to output mass flow - this gives the highest accuracy of flow measurement currently available for mass flow measurement. Since they measure flowing density, Coriolis meters can also infer gas flow rate at flowing conditions. American Gas Association Report No. 11 provides guidelines for obtaining good results when measuring natural gas with a Coriolis meter. Outside of the United States, requirements for standards of measurement may differ from existing domestic standards in the oil and gas industry. For example DP measured in inh2o here in one market but in another country's market may be measured in kg/cm2 instead. To meet such need in the overseas markets, a Selectable Unit (SU) functionality has been added. Thus the new nomenclature of SU Coriolis is to signify this functionality rev. AA Page 227
228 The user can also use the general information displayed as a snapshot of the current existing values for each parameter listed. There can be up to eight (8) SUAGA-7 measurement applications instantiated per comm channel on the XFCG4 board. The fields displayed here are as follows: Tube Description Enter up to 24 alphanumeric characters for a description of the tube. This is helpful when there is more than one tube application running in a single device. Yesterday's Volume This is the prior Contract Day's volume. The Contract Day is defined as a 24- hour period that establishes the parameters for a complete day. Today's Volume Updated at the end of each Volume Calculation Period. At the end of each Volume Calculation Period, the counts for the period are multiplied times the K Factor to produce an uncorrected volume which is then multiplied times the currently selected AGA-7 factors (See Factors tab under Setup) to produce a Corrected Volume. Each Volume Calculation Period volume is added to the current volume for the duration of the Contract Day. Calculation Type Displays the type of flow calculation. This is a read-only parameter. The user can establish the parameters for the SU Coriolis application using the read/write fields provided. These parameters are as follows: Contract Hour K Factor Flow Period Aux Factor (Faux) Fpv Method The Contract Hour is the start of the day for daily volumes. Enter the Contract Hour in military time (0-23). This specifies the mass flow per pulse. As such, the number of pulses is multiplied by the K-Factor to yield the mass per unit time (i.e., kg/s) Flow Period is a read only window which displays the time period in seconds. Flow Period is used to establish whether flow or no flow conditions exist. If no pulses are received during a flow period, it is considered a period of no flow. Pressure and temperature data accumulated during that period are not included in the log period averages and therefore no volume during that flow period. Flow Period can also be viewed in the Entry Mode under the tube's Setup/General tab. This value is used when the Use Faux parameter is turned on. This is a multiplication factor which directly affects the volume calculation. For example, a value of.9 would cause a 10% reduction in the calculated volume. Can be set to any value to allow for static corrections for site conditions that are not handled by the fundamental equation. An example would be a linear meter calibration shift. Select the supercompressibility (Fpv) method from the drop-down list. Available Fpv methods are: AGA8 Gross Method 1 - This method uses Gross Heating Value, Relative Density and CO2. AGA8 Gross Method 2 - This method uses Relative Density, N 2 and CO2. AGA8 Detail 92 - This method basically supports a total analysis. The six tabs displayed horizontally at the top of the page include important displayed data as well as read/write fields the user would need to set up functions such as Analysis or Calibration. The seventh Page rev. AA
229 (Configuration), eighth (Adv Setup), ninth (Digital Output), tenth (K Factor) and eleventh (Last Calc Values) tabs are accessible by selecting the pulldown arrow to the right of the Calibration tab. The user can re-select the arrow to re-display the Calibration tab (information). Each tab with relevant information is discussed as follows: RealTime Here the color-coordinated parameters are charted either on graph or grid. By clicking on the individual parameter's box below the chart, it will be displayed or removed from the chart as the situation dictates. The Points button is used to set the range of the displayed cycle measured. The View button can be used to either display the parameter in a Graph (default) or a Grid format. There is an option to expand/collapse the Graph view. The Expand button shall expand the graph to full screen. The Collapse button will return the graph to normal view. Day The Day tab displays information for the user that is based on the accumulated daily totals for the meter. The Day button allows the user to set the number of days displayed at one time. The user can select the View button to display the charted information in a Grid (default) or Graph format. The user can hover the mouse cursor over any portion of the graph display to display the value and date/time of the variable reading. (This can also be done for any of the displayed variables on the graph.) There is an option to expand/collapse the Graph view. The Expand button shall expand the graph to full screen. The Collapse button will return the graph to normal view. It is possible to use the mouse to zoom a desired portion of the graph by holding down the left button, rolling the mouse to define the desired area and releasing the left button to capture the area. That portion of the graph will then display proportionately over that area. By selecting the now active House icon to the left of the Expand button, the graph will re-display to its original position. Legends are selectable under graph. In case the graph has more than four parameters, an option is provided on the bottom of the graph to select up to four possible variables for plotting in overlay and once selected, they will be shown on the bottom of the graph as legends (selectable). A minimum of one variable is to be selected. The parameters possible to display from the Options icon are as follows: Count SP TF Volume Mass Energy This field represents the total number of counts for the flow period. This field represents the static pressure. The value shown is the average of one second samples for the day. This field represents the flowing temperature. The value shown is the average of one second samples for the day. The Volume values are the sum of all the volume quantities that are calculated for each Volume Calculation Period during the Contract Day. Uncorrected Mass for the Contract Day. The uncorrected mass for each Volume Calculation Period of the Contract Day is added together to produce a Daily uncorrected Mass. This value represents the sum of energy quantities (MMBTU) that are accumulated since the beginning of the Contract Day. This is updated at the end of each Volume Calculation Period. At the end of the Volume Calculation Period, the energy quantity is calculated by multiplying the Volume Calculation Period volume by the energy content rev. AA Page 229
230 Cnt Min Cnt Max Mass Percent Low Mass Percent Hi SP Min SP Max SP Percent Low SP Percent Hi TF Min TF Max TF Percent Low TF Percent Hi Period Time Flow Time Displays the minimum counts that occurred during any Flow Period during the Contract Day. Displays the maximum counts that occurred during any Flow Period during the Contract Day. Percentage of the time that the Uncorrected Mass is below the Uncorrected Mass Low Limit. Percentage of the time that the Uncorrected Mass is above the Uncorrected Mass High Limit. Minimum Static Pressure recorded during the Contract Day. Maximum Static Pressure recorded during the Contract Day. Displays the percentage of time the Static Pressure was below the low limit during the Contract Day. Displays the percentage of time the Static Pressure was above the high limit during the day. Minimum Temperature recorded during the Contract Day Maximum Temperature recorded during the Contract Day Displays the percentage of time the Temperature was below the low limit during the Contract Day. Displays the percentage of time the Temperature was above the high limit during the Contract Day. If Day Period, enter the frequency at which the trend data is logged. The format is hh:mm:ss in which one second is the fastest allowable time. It is recommended that Log Periods not be set faster than is necessary to conserve the device s processor time. Also, the more frequent the Log Periods, the faster the available memory of the device is used. Number of one second samples where DP is below zero cutoff, divided by the number of one second samples in a day, times 100 (rounded to the nearest.5 seconds). Log The Log tab provides information for the log period records (typically hourly records) for the selected meter. The Day button allows the user to set the number of days displayed at one time. The user can select the View button to display the charted information in a Grid (default) or Graph format. The user can hover the mouse cursor over any portion of the graph display to display the value and date/time of the variable reading. (This can also be done for any of the displayed variables on the graph.) There is an option to expand/collapse the Graph view. The Expand button shall expand the graph to full screen. The Collapse button will return the graph to normal view. It is possible to use the mouse to zoom a desired portion of the graph by holding down the left button, rolling the mouse to define the desired area and releasing the left button to capture the area. That portion of the graph will then display proportionately over that area. By selecting the now active House icon to the left of the Expand button, the graph will re-display to its original position. Legends are selectable under graph. In case the graph has more than four parameters, an option is provided on the bottom of the graph to select up to four possible variables for plotting in overlay and once selected, they will be shown on the bottom of the graph as legends (selectable). A minimum of one variable is to be selected. The parameters displayed in this chart are as follows: Page rev. AA
231 Count SP TF Mass Volume Energy Flow Time Period Time This field represents the total number of counts for the flow period. This field represents the static pressure. This field represents the flowing temperature. This field represents the totalized mass. This field represents the totalized volume. This value represents the sum of energy quantities. Flow Time is a read only window which displays the time period in seconds. Flow Time is used to establish whether flow or no flow conditions exist. If no pulses are received during a flow period, it is considered a period of no flow. Pressure and temperature data accumulated during that period are not included in the log period averages and therefore no volume during that flow period. Flow Period can also be viewed in the Entry Mode under the tube's Setup/General tab. Displays the total seconds from Start Date/Time to End Date/Time when there was flow. Flow is defined as any Flow Period (1 sec.) that contained pulses. Displays the time period in seconds (86400 secs = full day). Event The Event tab provides a table of events from the selected meter. The information is presented as one line per event with a date and time stamp. The Day button allows the user to set the number of days displayed at one time. The parameters displayed in this chart are as follows: Description Old Value New Value SN This field displays the type of event that occurred. This field represents the value or condition that existed prior to the event. For example, using an SP check, this shows the actual reading (manually entered by the technician) when a test pressure is applied. This field represents the value or condition entered by the technician. For example, using an SP check, this is the test pressure applied on the transducer. If displayed, this is a sequence number assigned to each event. The numbers should be in sequence and if there is a gap in the sequence, it could signal a problem. Analysis The Analysis tab provides information on the composition elements and other parameters of either Fixed or Live analysis. The user can opt for either analysis method by selecting the corresponding button. In Fixed analysis, the user can use the left Composition Elements column to edit each or all of the read/write fields to set the individual percentage of each element. The right Gas Properties column has two read/write fields that can be selected and edited as well. These two fields are as follows: Heating Tb and Pb Real Specific Gravity Calculation of Energy is based on Volume or Mass. Energy is calculated by multiplying the Heating Value times the Volume or Mass. This value should be at the contracted pressure and temperature bases. The Others section only has one editable field as follows: rev. AA Page 231
232 FPV Method Select the supercompressibility (Fpv) method from the drop-down list. Available Fpv methods are: AGA8 Gross Method 1 - This method uses Gross Heating Value, Relative Density and CO2. AGA8 Gross Method 2 - This method uses Relative Density, N2 and CO2. AGA8 Detail - This method basically supports a total analysis. In Live analysis, the user relies on real time data as displayed in each field under the Live column. In case of error in real time, data is defaulted to the Fixed column data. The values in the Calc column display the last calculated values of variables that are specific to volume calculations. Update frequency of the last calculated values is based on the Volume Calculation Period. The data displayed varies depending on the type of device and is for informational purposes only. Some of the information displayed will be familiar to the user, while others will not. As this is the case, the information presented is likely to be more useful to a Totalflow customer service representative than a field user. The Advanced Setup is comprised of the Analysis Setup and the Therms Setup. In the Analysis Setup, the first three user defined fields deal with the type and duration of the analysis type selected. The multiple configuration parameters default to use the fixed values although multiple options are available for the user. The Therms Setup allows the user to select the fields to assign required values for the assigned fields. These fields are defined as follows: If using analyzer data from a Master, select the stream number to use. If not using analyzer data, select None. Selecting a stream will cause what is Attached to Stream # referred to as an Attachment. This logs an event in the Event file, sets the analysis period from 0 to 1 hour and sets a bit to tell the unit to use Live Analysis from the analyzer. Enter four numeric numbers to help uniquely define the measurement tube's stream ID (e.g., 1234). Each measurement tube must have a unique stream Stream ID ID. The tube's complete stream ID is composed of the four digit stream ID assigned here, the analyzer Modbus ID and the stream number currently attached (e.g., ). Analyzer Modbus ID or Btu Stream Unit # Stream Source App If this tube application is running on a flow computer, enter the Modbus ID of the external Therms analyzer. If this tube application is running on an NGC and the source of the analysis data is a Btu application, enter the Btu Unit Number. If this tube application is running on an NGC and the source of the analysis data is a Therms application, enter the Modbus ID of the external Therms analyzer. Enter the application number of the application providing the analysis information. This can be a Therms Master, Therms Slave or a Btu Stream application. A Btu Stream application only applies to an NGC. Calibration The Calibration tab provides necessary information to assist the user in completing the calibration process and a resulting report. With the tab selected, the Select Calibration Type button is initially selected to display the desired calibration check. Page rev. AA
 Hold Timeout Calibration Points Do you want to calibrate in")
233 To start the calibration, select the type. Note the display of the Calibration Options fields change depending on the calibration type selected as follows: Tolerance (% Diff) Hold Timeout Calibration Points Do you want to calibrate in Absolute? Barometric Pressure The user selects a tolerance value equal to a desired % of the range; a warning message will display if the difference between the measured value and entered value exceeds this value. (applies to the following calibration checks: DP-SP, Differential Pressure, Static Pressure, Temperature/RTD) When the user elects to move into Calibration mode, the tube immediately moves into Hold Timer mode. The Hold Time Out (seconds) field allows the user to set a time frame (in seconds) from which to take the tube out of hold. The default is set to 3600 seconds (1 hour), but the user can establish a different time frame based on their individual needs. It should be noted that the timer starts as soon as the user moves into Calibration mode. (applies to the following calibration checks: DP-SP, Differential Pressure, Static Pressure, Temperature/RTD) The user would select the number of calibration points from this field. Options are 3 Points or 5 Points. With the setup complete, the 3 or 5 point Target pressure values will be calculated for convenience. These are suggested because of being evenly spaced across the calibration range, but it is not mandatory that these be used. (applies to the following calibration checks: DP-SP, Differential Pressure, Static Pressure, Temperature/RTD) This option is simply an aid for doing Static Pressure checks. Selecting gauge allows the user to enter values directly from the test pressure without having to add the barometric pressure which is automatically included. (applies to the following calibration checks: Static Pressure) This value is subtracted from Absolute pressure readings when calibrating the static pressure in gauge pressure and for displaying the static pressure in gauge on the device s display. This value is also entered on the calibration screen when calibrating in gauge pressure. (applies to the following calibration checks: Static Pressure) rev. AA Page 233
234 Temperature Bias If the user elects to use Temperature/RTD as a calibration method, select the Temperature Bias field under Calibration Options. This allows the user to enter a new value. The RTD's temperature will always be biased by this value. (applies to the following calibration checks: Temperature/RTD) The user would change the value of any of the fields displayed for the check selected as needed. Then the Start Calibration button would be selected to start the process. The tube goes into the Hold state and the hold timer value for that tube is displayed on the right corner of the tab (defaults to 3600 seconds or one hour). The SP Calibrate screen allows for doing checks or doing checks and a calibration. Start with doing checks and then continue with the calibration if needed. The As Found checks are created by applying different test pressures across the calibration range. For each test pressure applied, enter the test pressure in the Test box and click the Check Mark. The live reading will be displayed in the Live/Found box and be captured along with the entered Test value when the Check Mark is clicked. The % difference between the Test value and the live value will also be displayed. Repeat the process to enter the number of points desired. If checks are all that are required, click "Accept and Finish" or "Continue to Calibrate" to do a calibration. If the user chooses to calibrate, the Calibrate screen will display with the points plotted and listed in a table. If a 3-point calibration had been selected in setup but had done more than three checks, the user would have the option to check the boxes of desired points to use for the calibration. If however, Page rev. AA

235 a 3-point calibration was set up and three checks were done, naturally there is no option. Click the Calibrate button to continue rev. AA Page 235
236 If the user is satisfied at this point, the Accept & Finish button is selected. If not satisfied, the user can select the Re-calibrate button until satisfied. Selecting the Accept & Finish button will complete this calibration. If the user wants to start the process over and not accept the entries, the Abort button would be selected instead. The final Calibration Check is the Temperature/RTD. This process is also the same as the SP Calibration Check. With a completed calibration, the appropriate box or boxes would be checked. The user could then select the Generate Report button to generate a report in HTML. Configuration The user can select the Configuration tab to access the read/write and read only fields used to set up data needed for configuration. The following seven (7) areas of fields are accessible to the user: Constants Page rev. AA
237 Commands Fixed Values on Errors Log Capacity Setup Current Values Limits The following information is provided in relation to all parameters and their fields: Constants Fixed SP Value Barometric Pressure Pressure Base (Pb) Temperature Base (Tb) Z Base of Air K Factor Auxiliary Factor (Faux) Use Faux This is the Sp value used in the volume calculations if the Use Fixed Sp value is selected in the Adv Setup or Calibration section. This variable can also be entered in the Calibration Setup screen. This value is subtracted from Absolute pressure readings when calibrating the static pressure in gauge pressure and for displaying the static pressure in gauge on the device s display. This value is also entered on the calibration screen when calibrating in gauge pressure. Enter the Pressure Base in the units specified. A specific Pressure Base value may be required because of contractual agreements. Enter the Temperature Base in the units as specified by the Units column. A specific Temperature Base may be required because of contractual agreements. Z of Air at the contractual values for pressure base and temperature base. The user would enter a value for the Z of Air. This is the compressibility of air at a reference temperature (typically 60 degrees F.) The default standard is This specifies the mass flow per pulse. As such, the number of pulses is multiplied by the K-factor to yield the mass per unit time (i.e., kg/s) This value is used when the Use Faux parameter is turned on below. This is a multiplication factor which directly affects the volume calculation. For example, a value of.9 would cause a 10% reduction in the calculated volume. Can be set to any value to allow for static corrections for site conditions that are not handled by the fundamental equation. Select Yes for the device to use the Faux value entered above. Commands Reset Volume Select Yes from the drop-down menu, and click the Send button. The user will be asked to confirm the request. Answer Yes for the request to be carried out. A typical use for this command is just prior to an orifice plate change on a gas orifice meter. The device reacts, as follows, to a Reset Volume: Completes all computations for the present flow file daily record. Stores date/time and partial log period's volume into its historical record. Logs an event with the accumulator value before zeroing the accumulator. Zeroes the total volume accumulator. Begins a new flow file daily record rev. AA Page 237
238 Reset Log Period Set site code Select Yes from the drop-down menu, and click the Send button. The user will be asked to confirm the request. Answer Yes for the request to be carried out. This is similar to a Reset Volume, except the volume accumulator is not zeroed. A typical use for this command is just prior to an orifice plate change on a gas orifice meter. The device reacts, as follows, to a Reset Log Period: Completes all computations for the present flow file daily record. Stores date/time and partial log period's volume into its historical record. Logs an event in the Event file. Begins a new flow file daily record. Enter up to seven numerical digits, and a decimal point is allowed anywhere among the digits. A site code entry enters an event in the event file using the site code number. This number can represent anything to the user as some function performed at the site. Fixed Values on Errors Use Fixed Sp on Error Fixed Sp Value Sp High Error Sp Low Error Use Fixed Tf on Error Fixed Tf Value Tf High Error Tf Low Error Select Yes to use or No to not use the Fixed Sp Value if the Static Pressure exceeds the Sp High Error value or drops below the Sp Low Error value. Enter the Static Pressure value to be used if Use Fixed Sp On Error is set to Yes and the Static Pressure has exceeded the Sp High Error or dropped below the Sp Low Error value. Enter the value to be used for the Static Pressure High Error. Enter the value to be used for the Static Pressure Low Error. Select Yes to use or No to not use the Fixed Tf Value if the Flowing Temperature exceeds the Tf High Error value or drops below the Tf Low Error value. Enter the Flowing Temperature value to be used if Use Fixed Tf On Error is set to Yes and the Flowing Temperature has exceeded the Tf High Error or dropped below the Tf Low Error value. Enter the value to be used for the Flowing Temperature High Error. Enter the value to be used for the Flowing Temperature Low Error. Log Capacity Maximum # Daily Records Maximum # Log Period Records Maximum # Event Records Enter the maximum number of Daily Records that the device will store. The default of 50 is recommended. Enter the maximum number of Log Period Records that the device will store. The default of 970 is recommended. 970 allows for 40 days of hourly records. One Log Period Record is used no matter what the Log Period time. Enter the maximum number of Event Records that the device will store. Each entry into the Event file is a record. Setup Device/APP ID Enter up to ten alpha-numeric characters for the Device/APP ID. This identifies the specific application or flow calculation. A Station or device can have multiple flow calculations running simultaneously, and each of those will have their own Device/APP ID. Page rev. AA
239 Tube Description Contract Hour Vol Calc Period Log Period Flow Period Calculation Type Fpv Method Heating Value Method Enter alphanumeric characters for a description of the tube. This is helpful when there is more than one tube application running in a single device. Enter the contract hour in military time (0-23). The contract hour is the start of the day for daily volumes. Select the volume calculation period from the drop-down list. Options are 1, 2, 5, 10, 20, 30 and 60 seconds/minutes. This is the rate at which the volume is calculated based on one second averages of SP, DP and Temperature. Unless otherwise required, the default of 60 minutes is recommended. This period can be the same as but should never be greater than the log period. If not the same, the log period should always be an even multiple of the volume calculation period. Select the log period from the drop-down list. Options are 1, 2, 5, 10, 20, 30 and 60 minutes. This is the rate at which the calculated volumes are logged to the historical file. Unless otherwise required, the default of 60 minutes is recommended. This period can be the same as but should never be less than the volume calculation period. If not the same, it should always be an even multiple of the volume calculation period. Flow period is a selectable time period used to establish whether flow or no flow conditions exist. If no pulses are received during a flow period, it is considered a period of no flow. Pressure and temperature data accumulated during that period is not included in the log period averages. This variable can also be entered in the Calibration section. Displays the type of flow calculation. This is a read-only parameter. Select the compressibility (Fpv) method from the drop-down list. Available Fpv methods are: AGA8 Gross Method 1 - This method uses: Gross Heating Value, Relative Density and CO2. AGA8 Gross Method 2 - This method uses: Relative Density, Nitrogen and Carbon Dioxide. AGA8 Detail 92 - This method basically supports a total analysis. ISO This method supports total analysis as specified in the international standard ISO SGERG88 - This method adheres to the international standard ISO For this method to be viable, one of the following base conditions must exist: 0 C / 32 F and bar / psi 15 C / 59 F and bar / psi C / 60 F and bar / psi C / 60 F and bar / psi For detailed information on these methods, see the American Gas Association, Report No. 8 / American Petroleum Institute Chapter Select either Volume Based or Mass Based. The heating method is multiplied times the volume or the mass to calculate the energy. Current Values Current Mass Flow Rate The Mass Flow Rate is the Mass Volume for the Volume Calculation Period rev. AA Page 239
240 Corrected Volume Current Energy Flow Rate Today's Volume Today's Uncorrected Volume Today's Mass Today's Energy Yesterday's Volume Yesterday's Uncorrected Volume Yesterday's Mass Yesterday's Energy Accumulated Volume (see Today's Volume) The Indicated Flow Rate times the Heating Value. Updated at the end of each Volume Calculation Period. At the end of each Volume Calculation Period, the counts for the period are multiplied times the K Factor to produce an uncorrected volume which is then multiplied times the currently selected SUAGA-7 factors (See Factors tab under Setup) to produce a Corrected Volume. Each Volume Calculation Period volume is added to the current volume for the duration of the Contract Day. Updated at the end of each Volume Calculation Period. At the end of each Volume Calculation Period, the counts for the period are multiplied times the K Factor to produce an uncorrected volume. Each Volume Calculation Period volume is added to the current volume for the duration of the Contract Day. Updated at the end of each Volume Calculation Period. Each Volume Calculation mass is added to the current mass for the duration of the Contract Day. Updated at the end of each Volume Calculation Period. The sum of energy quantities accumulated since the beginning of the contract day. At the end of each Volume Calculation Period, the energy quantity is calculated by multiplying the Volume Calculation Period volume by the energy content. This is the prior Contract Day's volume. The Contract Day is defined as a 24- hour period that establishes the parameters for a complete day. Prior Contract Day s uncorrected volume. See Today s UC Volume for the calculation procedure. Prior Contract Day s Mass. Prior Contract Day s energy. Updated at the end of each Volume Calculation Period. At the end of each Volume Calculation Period, the counts for the period are multiplied times the K Factor to produce an uncorrected volume which is then multiplied times the currently selected SUAGA-7 factors (See Factors tab under Setup) to produce a Corrected Volume. Each Volume Calculation Period corrected volume is then added to the Accumulated Volume. This continues until zeroed by the Reset Volume command or an accumulator rollover happens. Accumulated Uncorrected Volume Accumulated Mass Accumulated Energy Updated at the end of each Volume Calculation Period. At the end of each Volume Calculation Period, the counts for the period are multiplied times the K Factor to produce an uncorrected volume which is added to the Accumulated UC Volume. This continues until zeroed by the Reset Volume command or an accumulator rollover happens. Updated at the end of each Volume Calculation Period. At the end of each Volume Calculation Period, the mass is added to the current running total until zeroed by the Reset Volume command or an accumulator rollover happens. Updated at the end of each Volume Calculation Period. At the end of each Volume Calculation Period, the energy is added to the current running total until zeroed by the Reset Volume command or an accumulator rollover happens. Last Calculated Volume Volume for the last Volume Calculation Period. Last Calculated Uncorrected Volume for the last Volume Calculation Period. Uncorrected Volume Page rev. AA
241 Last Calculated Mass Mass for the last Volume Calculation Period. Last Calculated Energy Energy for the last Volume Calculation Period. Limits Sp High Limit This represents the higher limit of the static pressure value that can be sent to the tube application. Sp Low Limit This represents the lower limit of the static pressure value that can be sent to the tube application. Tf High Limit This represents the higher limit of the total flowing temperature value that can be sent to the tube application. Tf Low Limit This represents the lower limit of the total flowing value that can be sent to the tube application. This represents the higher limit of the flow rate value that can be sent to the Flow Rate High Limit tube application. This represents the lower limit of the flow rate value that can be sent to the tube Flow Rate Low Limit application. Uncorr Vol High Limit At the end of each Volume Calculation Period, the counts for the period are multiplied times the K Factor to produce an uncorrected volume. The High Limit for the uncorrected value is set in this field to specify which values can be sent to the application. At the end of each Volume Calculation Period, the counts for the period are multiplied times the K Factor to produce an uncorrected volume. The Low Limit Uncorr Vol Low Limit for the uncorrected value is set in this field to specify which values can be sent to the application. Adv Setup Adv Setup Static Pressure Pulse Input Temperature Static Pressure Type Use Fixed Static Pressure Fixed Static Pressure RTD Installed Use Fixed Temperature Fixed Temperature This is the source register for the live Flowing Pressure. This is the source register for the Pulse Input. On-board pulse input registers can be found on the Digital Inputs tab under the I/O Interface tree-view item. This is the source register for the live Flowing Temperature. Select whether the static pressure is coming from a Gauge or Absolute pressure device. Select Yes to use the Fixed Static Pressure instead of a measured pressure. Used for AGA-7 tubes when static pressure is not available. This is the Static Pressure value used in the flow calculations if the Use Fixed Static is set to Yes. Set to Yes if the Flowing Temperature is brought in live via an outside source such as an RTD, analog input, etc. Yes will cause the Fixed Temperature to be used in flow calculations. Enter a value for the Fixed Temperature which will be used if the Use Fixed Temperature option is set to Yes. No Flow rev. AA Page 241
242 Digital Input DI Action Flow State Specify a digital input register (format 0.0.0) for the Trip on Digital Input option. Select whether an Open Contact or a Closed Contact constitutes a No Flow condition. Displays the Flow State as Flow or No Flow based on the Digital Input specified above and the DI Action selected. Coriolis Setup Coriolis Device Flow Register The Coriolis Device field is a drop-down list where the user will set the device number that corresponds to the Mass Flow Register of that device. For example, if the user has three tubes instantiated, the first tube would have a Coriolis Device selection of Device 1, the second tube would have a Coriolis Device selection of Device 2, etc. In instances where the user elects to have a bidirectional tube, each forward and reverse application tube pair should correspond to one device. Specify the address of the tube's flow rate register. This would typically be the tube's application number above plus the standard Volume Flow Rate register (xx.7.19) Digital Output Digital Output 1 Digital Output Volume Setpoint Trip on Volume Setpoint Trip on ACF Low Trip on ACF High Trip on SP Low Trip on SP High Trip on TF Low Trip on TF High Trip on FR Low Trip on FR High Trip on Charger Low Trip on Digital Input Digital Input Specify the output register for Digital Output 1 or Digital Output 2 depending on the tab selected. Enter the Volume Setpoint in MCF for tripping of the digital output by the Volume Setpoint command. If set to Yes, the digital output will be tripped each time the Volume Setpoint is reached. If set to Yes, the digital output will be tripped on the ACF Low alarm. Alarm limits are set in the Limits tab. If set to Yes, the digital output will be tripped on the ACF High alarm. Alarm limits are set in the Limits tab. If set to Yes, the digital output will be tripped on the SP Low alarm. Alarm limits are set in the Limits tab. If set to Yes, the digital output will be tripped on the SP High alarm. Alarm limits are set in the Limits tab. If set to Yes, the digital output will be tripped on the Flowing Temperature Low alarm. Alarm limits are set in the Limits tab. If set to Yes, the digital output will be tripped on the Flowing Temperature High alarm. Alarm limits are set in the Limits tab. If set to Yes, the digital output will be tripped on the Flow Rate Low alarm. Alarm limits are set in the Limits tab. If set to Yes, the digital output will be tripped on the Flow Rate High alarm. Alarm limits are set in the Limits tab. If set to Yes, the digital output will be tripped on the Low Charger alarm. The Low Charger alarm happens automatically if the charging source is removed or cannot maintain an adequate battery voltage. If set to Yes, the digital output will be tripped if the Digital Input specified below is set to a 1 (senses a closed contact). Specify a digital input register (format 0.0.0) for the Trip on Digital Input option. Page rev. AA
243 DO Action Auto Reset Auto Reset Delay (Sec) Current State Manual Operation Select whether the digital output is to act as a Normally Open or Normally Closed contact. If set to Yes, the digital output will reset after the Auto Reset Delay time has elapsed. If set to No, Auxiliary Contact 1 will remain tripped until manually reset. Specify the amount of time in seconds Auxiliary Contact 1 will reset after being opened or closed by some action. Auto Reset must be set to Yes. Displays the current state of the digital output as Open or Closed. This function allows the user to manually operate the digital output. This might be done for testing purposes. If the DO Action parameter above is set to Normally Open, Trip will close the digital output, and Clear will open the digital output. If the DO Action parameter is set to Normally Closed, Trip will open the digital output and Clear will close it. Digital Output 2 (Same as Digital Output 1) K Factor The K Factor specifies the volume of gas in actual cubic feet, represented by a single pulse from the measuring hardware. Therefore, the number of pulses is multiplied by the K Factor to get the actual cubic feet which is known as the uncorrected volume. The uncorrected volume is then multiplied by C' to correct it to base conditions thus corrected volume. This variable can also be entered in the Calibration section. Note: Items that require engineering units have a Variable Group number in the Description column beside the description. The user may need to change units for a particular Variable Group or change the Multiplier for a Variable Group which is done on the Units tree-view item under the corresponding measurement tube. Click on the Units tree-view item, and note that all tabs have a left-hand column that contains the Application, Array, Register numbers (xx.xx.xx), and in this case, the last set of numbers match the associated Variable Group number. If the user needs to change the engineering units, they would click on the Units tree-view item, and look at the left column of each tab to locate the Variable Group whose last set of numbers as represented by "yy" (xx.xx.yy) match the Group number they are looking for. Keep in mind that changing the Units for a particular Variable Group will typically affect more than one item. After selecting the K Factor tab, the first choice is to determine the K Factor Mode under the General Setup section. Options are either Single Point or Multi Point. In this case the Single Point was selected and displays in the upper right hand corner of the screen (green). The Factor Type is then selected depending on whether the number of pulses is divided by the K Factor (Volume/Pulse) or multiplied by the inverse of the K Factor (Quantity/Pulse). The following information explains the remaining portions of the Single Point page: Single Point K Factor Points MultiPoint K Factor Setup General Setup This field is read only. There is no access to selecting calibration points unless in Multi Point mode. Dynamic K - displays the current K factor assuming a successful multipoint calibration has been completed and the multipoint calibration feature has been turned on The following read/write fields are active and defined in Single Point mode: Multi Point Calibration Enable - the user can elect to enable or cancel a Multi Point calibration rev. AA Page 243
, Multi Point will display (green) in the upper right corner of the screen.")
244 K Factor Type - the user can define the K Factor as either Quantity/Pulse or Pulse/Quantity Single Point K Factor The user is enabled to define the K Factor in the Single Point mode If the user selects instead the Multi Point option under the K Factor Mode (General Setup), Multi Point will display (green) in the upper right corner of the screen. Again, the Factor Type is then selected depending on whether the number of pulses is divided by the K Factor (Volume/Pulse) or multiplied by the inverse of the K Factor (Quantity/Pulse). A major change in the Overview part of the screen is that Dynamic K displays in the read-only field where K Factor had displayed previously. The following information explains the remaining portions of the Multi Point page: MultiPoint K Factor Points Up to 11 points can be defined by the user for these fields but the Edit All convention must be used since no single row edits are able to be defined individually only collectively. The two following fields are defined: MultiPoint K Factor Setup Dynamic K - displays the current K factor assuming a successful multipoint calibration has been completed and the multipoint calibration feature has been turned on Calibration Points - displayed as read/write by the user. General Setup The following read/write fields are active and defined in Multi Point mode: Multi Point Enable - the user can elect to enable or cancel a Multi Point calibration Page rev. AA
245 K Factor Type - the user can define the K Factor as either Pulse/Quantity or Quantity only Single Point K Factor This field is read only in Multi Point mode. There will also be two buttons available to the user: Abort Calibration (Cancel) and Complete Calibration (Commit). Last Calculated Values The values in the Calc column display the last calculated values of variables that are specific to volume calculations. Updated frequency of the last calculated values is based on the Volume Calculation Period. The data displayed varies depending on the type of device and is for informational purposes only. Some of the information displayed will be familiar to the user, while others will not. As this is the case, the information presented is likely to be more useful to a Totalflow customer service representative than a field user. Last Calc Vol Displayed in SCF (standard cubic feet) Last Calc Prime (cp) Displays Constant Pressure (Cp) divided by Constant Volume (Cv) yields the Specific Heat Ratio Last Calc Mass Displayed in lbm (pounds of mass) Last Calc Faux Faux defaults to but can be changed in the Constants tab by the user. Last Calc UMass Displayed in lbm (pounds of mass) Last Calc Temperature Correction Factor (Ftb) Displays the Last Calculated Temperature Base Factor (Ftb) Last Calc Energy Displayed in MBtu (thousands of British thermal units) Last Calc Pressure Correction Factor (Fpb) Displays the Last Calculated Pressure Correction (Fpb) Factor Last Calc Real Gravity Displayed as a ratio of the density of the sample to the density of water Last Calc Base Compressibility Displays the Last Calculated Base Compressibility value Last Calc Zbase of Air Z of Air at the contractual values for pressure base and temperature base. The user would enter a value for the Z of Air. This is the compressibility of air at a reference temperature (typically 60 degrees F.) The default standard is Last Calc Flowing Compressibility Displays the Last Calculated Flowing Compressibility value Last Calc Input AP Displays last live reading in PSIA (pounds per square inch absolute) Last Calculated Displays the Last Calculated (Supercompress)^2 Supercompressibility value Last Calc AP Displays last static pressure reading in PSIA (pounds per square inch absolute) Last Calc Base Density Displays the Last Calculated Base Density value rev. AA Page 245
246 Last Calc Pressure Base Displayed in PSIA (pounds per square inch absolute) Last Calc K Factor Displays the Last Calculated K Factor value Last Calc Temperature Displays in Degrees F. Base Last Calc Input Displays in Degrees F. Temperature Last Calc Flowing Displays in Degrees F. Temperature Last Calc Cp_s Last Calc Pulse Count Heating Value Selected Energy Vol Based Energy Mass Based Gravity Displays the Last Calculated total number of pulses Select either Volume Based or Mass Based. This tells the software whether to multiply the calculated Volume or Mass times the Heating Value which is found on the Fixed or Live Analysis tabs and provides the total heating value for the period. Using the heating value times volume to calculate the energy Using the heating value times mass to calculate the energy The Specific gravity or Base gravity, as it is called in liquid calculations, defaults to.658 but an accurate gravity if known should be entered. SU Liquid Overview Oil and natural gas wells require the removal of liquids as part of the production process. Liquid removal can be accomplished through the use of an electric motor driven pump. Expert monitoring and control of the electric motor is a key requirement to insure the safe and extended operation of the pumping system. Equally important, is the need to measure the produced liquid, the natural gas, and the holding tank levels, and the need to control the gas sales. Outside of the United States, requirements for standards of measurement may differ from existing domestic standards in the oil and gas industry. For example DP measurement (inh2o) but in another country may be measured in kg/cm2 instead. To meet such need in the overseas markets, a Selectable Unit (SU) functionality has been added to the AGA-3 and AGA-7. Thus the new nomenclature of SUAGA-7 is to signify this functionality. Page rev. AA
 SULiquid measurement applications instantiated per comm channel on the XFCG4 board.")
247 The user can also use the general information displayed as a snapshot of the current existing values for each parameter listed. There can be up to eight (8) SULiquid measurement applications instantiated per comm channel on the XFCG4 board. The fields displayed here are as follows: Tube Description Yesterday's Net Standard Volume Today's Net Standard Volume Yesterday's Indicated Volume Today's Indicated Standard Volume Enter up to 24 alphanumeric characters for a description of the tube. This is helpful when there is more than one tube application running in a single device. This is the prior Contract Day's volume. The Contract Day is defined as a 24- hour period that establishes the parameters for a complete day. Displays the total Net Standard Volume from the Start Date/Time to the End Date/Time. Displays Yesterday's total Indicated Volume from the Start Date/Time to the End Date/Time. Displays Today's total Indicated Standard Volume from the Start Date/Time to the End Date/Time Yesterday's Energy Prior Contract Day s energy. Updated at the end of each Volume Calculation Period. The sum of energy quantities accumulated since the beginning of the contract day. At the end of Today's Energy each Volume Calculation Period, the energy quantity is calculated by multiplying the Volume Calculation Period volume by the energy content. Displays the type of flow calculation which is API Liquid. This is a read-only Calculation Type parameter. The user can establish the parameters for the SULiquid application using the read/write fields provided. These parameters are as follows: Contract Hour K Factor The Contract Hour is the start of the day for daily volumes. Enter the Contract Hour in military time (0-23). K Factor specifies the number of pulses required per volume of liquid. To get the Indicated Volume, the number of pulses is divided by the K Factor or multiplied by rev. AA Page 247
248 Meter Factor Flow Period (Seconds) the inverse of the K Factor depending on whether the K Factor method is set to Volume/Pulse or Pulse/Volume. Select whether the turbine meter or device generating the pulses is designed to output pulses based on pulses per volume or volume per pulse and enter that value here. The K-factor for the device is entered in Calibration mode. Flow Period is fixed at one second for API Liquid tubes. If no pulses are received during a flow period, it is considered a period of no flow. Pressure and temperature data accumulated during that period is not included in the log period averages. This variable can also be entered in the Calibration section. The six tabs displayed horizontally at the top of the page include important displayed data as well as read/write fields the user would need to set up functions such as Calibration. The seventh (Adv Setup), eighth (Digital Output), ninth (K Factor) and tenth (Last Calc Values) tabs are accessible by selecting the pulldown arrow to the right of the Configuration tab. The user can re-select the arrow to re-display the Calibration tab (information). Each tab with relevant information is discussed as follows: RealTime Here the color-coordinated parameters are charted either on graph or grid. By clicking on the individual parameter's box below the chart, it will be displayed or removed from the chart as the situation dictates. The Points button is used to set the range of the displayed cycle measured. The View button can be used to either display the parameter in a Graph (default) or a Grid format. There is an option to expand/collapse the Graph view. The Expand button shall expand the graph to full screen. The Collapse button will return the graph to normal view. Day The Day tab displays information for the user that is based on the accumulated daily totals for the meter. The Day button allows the user to set the number of days displayed at one time. The user can select the View button to display the charted information in a Grid (default) or Graph format. The user can hover the mouse cursor over any portion of the graph display to display the value and date/time of the variable reading. (This can also be done for any of the displayed variables on the graph.) There is an option to expand/collapse the Graph view. The Expand button shall expand the graph to full screen. The Collapse button will return the graph to normal view. It is possible to use the mouse to zoom a desired portion of the graph by holding down the left button, rolling the mouse to define the desired area and releasing the left button to capture the area. That portion of the graph will then display proportionately over that area. By selecting the now active House icon to the left of the Expand button, the graph will re-display to its original position. Legends are selectable under graph. In case the graph has more than four parameters, an option is provided on the bottom of the graph to select up to four possible variables for plotting in overlay and once selected, they will be shown on the bottom of the graph as legends (selectable). A minimum of one variable is to be selected. The parameters possible to display from the Options icon are as follows: Pulses PF This field represents the total number of counts for the flow period. This field represents the Flowing Pressure. The value shown is the average of one second samples for the day. Page rev. AA
249 TF Indicated Volume Net Standard Volume Energy Pulse Min Pulse Max IV Percent Low IV Percent Hi PF Min PF Max PF Percent Low PF Percent Hi TF Min TF Max TF Percent Low TF Percent Hi Period time Flow Time This field represents the Flowing Temperature. The value shown is the average of one second samples for the day. Displays the total Indicated Volume for the Contract Day. At the end of each Volume Calculation Period, the counts for the period are multiplied times the K Factor to produce an Indicated Volume. Each Volume Calculation Period volume is added to the current volume for the duration of the Contract Day. Displays the total Net Standard Volume from the Start Date/Time to the End Date/Time. This value represents the sum of energy quantities (MMBTU) that are accumulated since the beginning of the Contract Day. This is updated at the end of each Volume Calculation Period. At the end of the Volume Calculation Period, the energy quantity is calculated by multiplying the Volume Calculation Period volume by the energy content. Displays the minimum recorded pulses in any flow period (1 sec) from the Start Date/Time to the End Date/Time. Displays the maximum recorded pulses in any flow period (1 sec) from the Start Date/Time to the End Date/Time. Percentage of the time that the Indicated Volume is below the Indicated Volume. Percentage of the time that the Indicated Volume is above the Indicated Volume High Limit. Displays the minimum Flowing Pressure recorded by a one second sample during the Contract Day. Displays the maximum Flowing Pressure recorded by a one second sample during the Contract Day. Displays the percentage of time the Flowing Pressure was below the low limit during the Contract Day. Displays the percentage of time the Flowing Pressure was above the high limit during the Contract Day. Minimum Temperature recorded during the Contract Day Maximum Temperature recorded during the Contract Day Displays the percentage of time the Temperature was below the low limit during the Contract Day. Displays the percentage of time the Temperature was above the high limit during the Contract Day. If Day Period, enter the frequency at which the trend data is logged. The format is hh:mm:ss in which one second is the fastest allowable time. It is recommended that Log Periods not be set faster than is necessary to conserve the device s processor time. Also, the more frequent the Log Periods, the faster the available memory of the device is used. Number of one second samples where DP is above zero cutoff, divided by the number of one second samples in a day, times 100 (rounded to the nearest.5 seconds). Log The Log tab provides information for the log period records (typically hourly records) for the selected meter. The Day button allows the user to set the number of days displayed at one time rev. AA Page 249
250 The user can select the View button to display the charted information in a Grid (default) or Graph format. The user can hover the mouse cursor over any portion of the graph display to display the value and date/time of the variable reading. (This can also be done for any of the displayed variables on the graph.) There is an option to expand/collapse the Graph view. The Expand button shall expand the graph to full screen. The Collapse button will return the graph to normal view. It is possible to use the mouse to zoom a desired portion of the graph by holding down the left button, rolling the mouse to define the desired area and releasing the left button to capture the area. That portion of the graph will then display proportionately over that area. By selecting the now active House icon to the left of the Expand button, the graph will re-display to its original position. Legends are selectable under graph. In case the graph has more than four parameters, an option is provided on the bottom of the graph to select up to four possible variables for plotting in overlay and once selected, they will be shown on the bottom of the graph as legends (selectable). A minimum of one variable is to be selected. The parameters displayed in this chart are as follows: Pulses PF TF IV NSV Energy Flow Time Period Time This field represents the total number of counts for the flow period. This field represents the Flowing Pressure. The value shown is the average of one second samples for the day. This field represents the Flowing Temperature. The value shown is the average of one second samples for the day. Displays the total Indicated Volume for the Contract Day. At the end of each Volume Calculation Period, the counts for the period are multiplied times the K Factor to produce an Indicated Volume. Each Volume Calculation Period volume is added to the current volume for the duration of the Contract Day. Displays the total Net Standard Volume from the Start Date/Time to the End Date/Time. This value represents the sum of energy quantities (MMBTU) that are accumulated since the beginning of the Contract Day. This is updated at the end of each Volume Calculation Period. At the end of the Volume Calculation Period, the energy quantity is calculated by multiplying the Volume Calculation Period volume by the energy content. Flow Time is a read only window which displays the time period in seconds. Flow Time is used to establish whether flow or no flow conditions exist. If no pulses are received during a flow period, it is considered a period of no flow. Pressure and temperature data accumulated during that period are not included in the log period averages and therefore no volume during that flow period. Flow Period can also be viewed in the Entry Mode under the tube's Setup/General tab. Displays the total seconds from Start Date/Time to End Date/Time when there was flow. Flow is defined as any Flow Period (1 sec.) that contained pulses. Displays the time period in seconds (86400 secs = full day). Event The Event tab provides a table of events from the selected meter. The information is presented as one line per event with a date and time stamp. The Day button allows the user to set the number of days displayed at one time. The parameters displayed in this chart are as follows: Date/Time Event This field displays the date/time of the event. This field displays the type of event that occurred. Page rev. AA
251 Old Value New Value SN This field represents the value or condition that existed prior to the event. For example, using an SP check, this shows the actual reading (manually entered by the technician) when a test pressure is applied. This field represents the value or condition entered by the technician. For example, using an SP check, this is the test pressure applied on the transducer. If displayed, this is a sequence number assigned to each event. The numbers should be in sequence and if there is a gap in the sequence, it could signal a problem. Calibration The Calibration tab provides necessary information to assist the user in completing the calibration process and a resulting report. With the tab selected, the Select Calibration Type button is initially selected to display the desired calibration check. To start the calibration, select the type. Note the display of the Calibration Options fields change depending on the calibration type selected as follows: Tolerance (% Diff) Hold Timeout Calibration Points Do you want to calibrate in Absolute? Barometric Pressure Temperature Bias The user selects a tolerance value equal to a desired % of the range; a warning message will display if the difference between the measured value and entered value exceeds this value. (applies to the following calibration checks: DP-SP, Differential Pressure, Static Pressure, Temperature/RTD) When the user elects to move into Calibration mode, the tube immediately moves into Hold Timer mode. The Hold Time Out (seconds) field allows the user to set a time frame (in seconds) from which to take the tube out of hold. The default is set to 3600 seconds (1 hour), but the user can establish a different time frame based on their individual needs. It should be noted that the timer starts as soon as the user moves into Calibration mode. (applies to the following calibration checks: DP-SP, Differential Pressure, Static Pressure, Temperature/RTD) The user would select the number of calibration points from this field. Options are 3 Points or 5 Points. With the setup complete, the 3 or 5 point Target pressure values will be calculated for convenience. These are suggested because of being evenly spaced across the calibration range, but it is not mandatory that these be used. (applies to the following calibration checks: DP-SP, Differential Pressure, Static Pressure, Temperature/RTD) This option is simply an aid for doing Static Pressure checks. Selecting gauge allows the user to enter values directly from the test pressure without having to add the barometric pressure which is automatically included. (applies to the following calibration checks: Static Pressure) This value is subtracted from Absolute pressure readings when calibrating the static pressure in gauge pressure and for displaying the static pressure in gauge on the device s display. This value is also entered on the calibration screen when calibrating in gauge pressure. (applies to the following calibration checks: Static Pressure) If the user elects to use Temperature/RTD as a calibration method, select the Temperature Bias field under Calibration Options. This allows the user to enter a new value. The RTD's temperature will always be biased by this value. (applies to the following calibration checks: Temperature/RTD) The user would change the value of any of the fields displayed for the check selected as needed. Then the Start Calibration button would be selected to start the process. The tube goes into the Hold state and the hold timer value for that tube is displayed on the right corner of the tab (defaults to 3600 seconds or one hour) rev. AA Page 251
252 The Flowing Pressure (FP) Calibration Check screen allows for doing checks or doing checks and a calibration. Start with doing checks and then continue with the calibration if needed. The As Found checks are created by applying different test pressures across the calibration range. For each test pressure applied, enter the test pressure in the Test box and click the Check Mark. The live reading will be displayed in the Live/Found box and be captured along with the entered Test value when the Check Mark is clicked. The % difference between the Test value and the live value will also be displayed. Repeat the process to enter the number of points desired. If checks are all that are required, click "Accept and Finish" or "Continue to Calibrate" to do a calibration. Page rev. AA
253 If the user chooses to calibrate, the Calibrate screen will display with the points plotted and listed in a table. If a 3-point calibration had been selected in setup but had done more than three checks, the user would have the option to check the boxes of desired points to use for the calibration. If however, a 3-point calibration was set up and three checks were done, naturally there is no option. Click the Calibrate button to continue rev. AA Page 253

254 If the user is satisfied at this point, the Accept & Finish button is selected. If not satisfied, the user can select the Re-calibrate button until satisfied. Selecting the Accept & Finish button will complete this calibration. If the user wants to start the process over and not accept the entries, the Abort button would be selected instead. The final Calibration Check is the one for Flowing Temperature. This process is also the same as the Flowing Pressure Calibration Check. With a completed calibration, the appropriate box or boxes would be checked. The user could then select the Generate Report button to generate a report in HTML. Configuration The user can select the Configuration tab to access the read/write and read only fields used to set up data needed for configuration. The following eight (8) areas of fields are accessible to the user: Constants Page rev. AA
255 Commands Fixed Values on Errors Log Capacity Setup Current Values Limits Liquids The following information is provided in relation to all parameters and their fields: Constants Barometric Pressure K Factor This value is subtracted from Absolute pressure readings when calibrating the static pressure in gauge pressure and for displaying the static pressure in gauge on the device s display. This value is also entered on the calibration screen when calibrating in gauge pressure. K Factor specifies the number of pulses required per volume of liquid. To get the Indicated Volume, the number of pulses is divided by the K Factor or multiplied by the inverse of the K Factor depending on whether the K Factor method is set to Volume/Pulse or Pulse/Volume. Pipe Diameter (ID) Use Meter Correction Factor User Entered Meter Correction Factor Heating Tb and Pb Inside diameter of the pipe where it is connected to the liquid meter. Pipe diameter is for informational purposes only and is not used in any calculations. Select Yes to use the Meter Correction Factor entered below. A meter s performance will change over time, this change can be due to mechanical wear or to a change in the physical properties of the liquid being metered. Therefore a meter is proved or verified to establish its meter factor (MF), which is used to adjust the indicated volume of a meter during a transfer. If Use Meter Correction Factor was set to Yes, enter the Meter Correction Factor here. The user can enter a heating value or use the default of Heating value is multiplied times either the volume or mass depending on which was selected on the General tab to obtain the energy value. Commands Reset Volume Select Yes from the drop-down menu, and click the Send button. The user will be asked to confirm the request. Answer Yes for the request to be carried out. A typical use for this command is just prior to an orifice plate change on a gas orifice meter. The device reacts, as follows, to a Reset Volume: Completes all computations for the present flow file daily record. Stores date/time and partial log period's volume into its historical record. Logs an event with the accumulator value before zeroing the accumulator. Zeroes the total volume accumulator rev. AA Page 255
256 Begins a new flow file daily record. Reset Log Period Set site code Select Yes from the drop-down menu, and click the Send button. The user will be asked to confirm the request. Answer Yes for the request to be carried out. This is similar to a Reset Volume, except the volume accumulator is not zeroed. A typical use for this command is just prior to an orifice plate change on a gas orifice meter. The device reacts, as follows, to a Reset Log Period: Completes all computations for the present flow file daily record. Stores date/time and partial log period's volume into its historical record. Logs an event in the Event file. Begins a new flow file daily record. Enter up to seven numerical digits, and a decimal point is allowed anywhere among the digits. A site code entry enters an event in the event file using the site code number. This number can represent anything to the user as some function performed at the site. Fixed Values on Errors Use User Entered Select Yes or No on whether to use the User Entered Flowing Pressure Value Flowing Pressure on when a high or low error occurs. Error User Entered Flowing Pressure Value Flowing Pressure High Error If Use User Entered Flowing Pressure On Error is set to Yes, enter a flowing pressure value to be used when a high or low error occurs. Enter a value that will cause a Flowing Pressure High Error condition. Flowing Pressure Low Error Enter a value that will cause a Flowing Pressure Low Error condition. Use User Entered Flowing Temp on Error Select Yes or No on whether to use the User Entered Flowing Temperature Value when a high or low error occurs. User Entered If Use User Entered Flowing Temp On Error is set to Yes, enter a flowing Flowing Temp Value temperature value to be used when a high or low error occurs. Flowing Temperature High Enter a value that will cause a Flowing Temperature High Error condition. Error Flowing Temperature Low Enter a value that will cause a Flowing Temperature Low Error condition. Error NOTE: Engineering units are established on the Selectable Units Setup tab accessible by clicking on the Station ID. The Station ID is the very top name on the tree-view. Liquid Liquid Type Select the type of liquid from the drop-down list. If the liquid being metered does not fit one of the standard categories, Special Appl. can be selected, however, the user must enter a value for the Liquid Thermal Expansion Page rev. AA
257 Factor shown below. Special Applications generally apply to fairly pure products and have been tested to establish a specific thermal expansion factor. Available selections are: Crude Oil - Adheres to API 11.1 Fuel Oil - Adheres to API 11.1 Jet Fuel - Adheres to API 11.1 Transition/Diesel - Adheres to API 11.1 Gasoline - Adheres to API 11.1 Lube Oil - Adheres to API 11.1 Special Appl - Adheres to API 11.1 Water - Adheres to API 11.1 Light Hydros - Adheres to API 11.2 Equilibrium Vapor Pressure Sediment and Water Type Sediment and Water Percentage Thermal Expansion Factor Type (Alpha60) User Entered Thermal Expansion Factor (Alpha60) Density Type User Entered Density Type Enter Density/Gravity As Raw User Entered Density/Gravity Converted Density in User Unit Use Temp Correction Factor (Ctl) Enter a value for the Equilibrium Vapor Pressure. This factor is only used for liquids with an equilibrium vapor pressure greater than atmospheric, the equilibrium vapor pressure will be subtracted from the pressure input values before entering the calculation routines. Select whether the Sediment & Water is Measured or User Entered. If User Entered was selected for the Sediment & Water Type, enter a percentage value for the Sediment & Water content here. Select either Calculated or User Entered. User Entered may be used if the Alpha 60 for the measured liquid is known, but is required if Special Appl was selected above as the Liquid Type. If User Entered was selected for the Thermal Expansion Factor Type, enter a value here. Used typically because the Special Appl. category was selected above and an Expansion Factor has been established for the liquid. Select whether the Density Type is to be Measured or User Entered. If User Entered was selected for the Density Type, select either Base/Standard or Flowing. The Base/Standard condition is a defined combination of temperature and pressure at which liquid volumes are expressed for purposes of custody transfer. Flowing density is a user entered value based on a known or measured temperature and pressure. If User Entered was selected for the Density Type, one of the four Density/Gravity methods (kg/m3, g/cc, Specific Gravity, API Gravity) was selected and will be represented by the Raw User Entered Density/Gravity value below. Setup was on the Liquids tab of Entry mode Setup. If Density Type is User Entered, enter a Density/Gravity value for the liquid representing the units or method as selected above. If Density Type is User Entered, this cell displays the converted units. The Raw User value entered above is converted to system units chosen on the Selectable Units Setup tab.(.e.g., the raw user value could be entered as API Gravity, and the converted value would be displayed as lbm/ft3) if selected in the Selectable Units Setup. Select Yes or No as to whether or not to use the Temperature Correction Factor rev. AA Page 257
258 Temp Correction Factor Type (Ctl) User Entered Temp Correction Factor (Ctl) Use Pressure Correction Factor (Cpl) Pressure Correction Factor Type (Cpl) User Entered Pressure Correction Factor (Cpl) Base Pressure Base Temperature Select whether the Temperature Correction Factor is to be Calculated or User Entered. If you specified above to Use Temp Correction Factor and specified User Entered, enter that value here. Select Yes or No as to whether or not to use the Pressure Correction Factor. Select whether the Pressure Correction Factor Type is to be Calculated or User Entered. If you specified above to Use Pressure Correction Factor and specified User Entered, enter that value here. Select one of the Base pressures from the list. These pressures are from the API 11.1 standards. Select one of the Base temperatures from the list. These temperatures are from the API 11.1 standards. Log Capacity Maximum # Daily Records Maximum # Log Period Records Maximum # Event Records Enter the maximum number of Daily Records that the device will store. The default of 50 is recommended. Enter the maximum number of Log Period Records that the device will store. The default of 970 is recommended. 970 allows for 40 days of hourly records. One Log Period Record is used no matter what the Log Period time. Enter the maximum number of Event Records that the device will store. Each entry into the Event file is a record. Setup Device/APP ID Tube Description Contract Hour Vol Calc Period Log Period Flow Period (Seconds) Calculation Type Enter up to ten alpha-numeric characters for the Device/APP ID. This identifies the specific application or flow calculation. A Station or device can have multiple flow calculations running simultaneously, and each of those will have their own Device/APP ID. Enter up to 24 alphanumeric characters for a description of the tube. This is helpful when there is more than one tube application running in a single device. Enter the contract hour in military time (0-23). The contract hour is the start of the day for daily volumes. This is the frequency at which the volume is calculated based on one second averages of flowing pressure, flowing temperature and one second Flow Period counts. Select the log period from the drop-down list. Options are 1, 2, 5, 10, 20, 30 and 60 minutes. This is the rate at which the calculated volumes are logged to the historical file. Flow Period is fixed at 1 second for API Liquid tubes. If no pulses are received during a flow period, it is considered a period of no flow. Pressure and temperature data accumulated during that period is not included in the log period averages. This variable can also be entered in the Calibration section. Displays the type of flow calculation which is API Liquid. This is a read-only parameter. Page rev. AA
259 K-Factor Type Heating Value Method Ticket Number Meter Body Serial Number Meter Internals Serial Number Select whether the K Factor is based on Quantity per Pulse or Pulse per Quantity. The actual K Factor value is entered on the Constants tab. Select either Volume Based or Mass Based. The heating method is multiplied times the volume or the mass to calculate the energy. This is a manually entered number assigned by an operator to a measurement ticket using the company's numbering system. The measurement ticket is used in a batch mode and is a written acknowledgement of the transfer of a particular amount of liquid and serves as the legal document of transfer. Enter the serial number of the primary metering device. This is the serial number on the body of the meter. Changing this serial number will cause an event in the Events record. Enter the serial number of the internal mechanism. Changing this serial number will cause an event in the Events record. Current Values Today's Indicated Volume Today's Indicated Standard Volume Updated at the end of each Volume Calculation Period. At the end of each Calculation Period, the counts for the period are multiplied times the K Factor to produce an Indicated Volume. Each Volume Calculation Period volume is added to the current volume for the duration of the Contract Day. Updated at the end of each Volume Calculation Period. Indicated Std. Volume = Counts per period x K Factor Indicated Std. Volume = Indicated x Ctl & Cpl Each Volume Calculation Period volume is added to the current volume for the duration of the Contract Day. Today's Gross Standard Volume Today's Net Standard Volume Today's Sediment and Water Volume Updated at the end of each Volume Calculation Period. Indicated Volume = Counts per period x K Factor Indicated Std. Volume = Indicated Volume x Ctl & Cpl Gross Std. Volume = Indicated Std. Volume x Meter Factor Each Volume Calculation Period volume is added to the current volume for the duration of the Contract Day. Updated at the end of each Volume Calculation Period. At the end of each Volume Calculation Period, the counts for the period are multiplied times the K Factor to produce an uncorrected volume which is then multiplied times the currently selected SUAGA-7 factors (See Factors tab under Setup) to produce a Corrected Volume. Each Volume Calculation Period volume is added to the current volume for the duration of the Contract Day. At the end of each Volume Calculation Period, Sediment & Water Volume is calculated using the equation: S&W Volume = GSW-[GSW*(1-(%S&W/100))] GSW=Gross Std. Volume %S&W=user entered % of Sediment & Water. Each Volume Calculation Period volume is added to the current volume for the duration of the Contract Day rev. AA Page 259
260 Today's Mass Today's Energy Updated at the end of each Volume Calculation Period. Each Volume Calculation mass is added to the current mass for the duration of the Contract Day. Updated at the end of each Volume Calculation Period. The sum of energy quantities accumulated since the beginning of the contract day. At the end of each Volume Calculation Period, the energy quantity is calculated by multiplying the Volume Calculation Period volume by the energy content. Yesterday's Indicated Volume Yesterday's Indicated Standard Volume Yesterday's Gross Standard Volume Yesterday's Net Standard Volume Prior Contract Day s Indicated Volume. (See Today s Indicated Volume above for the calculation procedure.) Prior Contract Day s Indicated Standard Volume. (See Today s Indicated Standard Volume above for the calculation procedure.) Prior Contract Day s Gross Standard Volume. (See Today s Gross Standard Volume above for the calculation procedure.) Prior Contract Day s Net Std. Volume. (See Today s Net Std. Vol. for calculation procedure.) Yesterday's Sediment Prior Contract Day s Sediment and Water Volume. (See Today s Sediment and and Water Volume Water Volume above for the calculation procedure.) Yesterday's Mass Prior Contract Day s Mass. Yesterday's Energy Prior Contract Day s energy. Accumulated Indicated Volume Accumulated Indicated Standard Volume Accumulated Gross Standard Volume Accumulated Net Standard Volume Running total of the Indicated Volume which is updated at the end of each Volume Calculation Period. See Today s Indicated Volume above for the calculation procedure. Running total of the Indicated Standard Volume which is updated at the end of each Volume Calculation Period. See Today s Indicated Standard Volume above for the calculation procedure. Running total of the Gross Standard Volume which is updated at the end of each Volume Calculation Period. See Today s Gross Standard Volume above for the calculation procedure. Running total of the Net Standard Volume which is updated at the end of each Volume Calculation Period. See Today s Net Standard Volume above for the calculation procedure. Accumulated Sediment and Water Volume Running total of the Sediment and Water Volume which is updated at the end of each Volume Calculation Period. See Today s Sediment and Water Volume above for the calculation procedure. Accumulated Mass Accumulated Energy Last Calculated Indicated Volume Last Calculated Indicated Standard Volume Updated at the end of each Volume Calculation Period. At the end of each Volume Calculation Period, the mass is added to the current running total until zeroed by the Reset Volume command or an accumulator rollover happens. Updated at the end of each Volume Calculation Period. At the end of each Volume Calculation Period, the energy is added to the current running total until zeroed by the Reset Volume command or an accumulator rollover happens. Volume for the last Volume Calculation Period. Uncorrected Volume for the last Volume Calculation Period. Page rev. AA
261 Last Calculated Gross Standard Volume Last Calculated Net Standard Volume Updated at the end of each Volume Calculation Period: Counts per period x K Factor = Indicated Volume Indicated Volume x Ctl & Cpl = Indicated Std. Volume Indicated Std. Volume x Meter Factor = Gross Std. Volume Updated at the end of each Volume Calculation Period: Counts per period x K Factor = Indicated Volume Indicated Volume x Ctl & Cpl = Indicated Std. Volume Indicated Std. Volume x Meter Factor = Gross Std. Volume Gross Std. Volume x Sediment & Water Factor = Net Std. Volume Last Calculated Sediment and Water Volume At the end of each Volume Calculation Period, Sediment & Water Volume is calculated using the equation: S&W Volume = GSW-[GSW*(1-(%S&W/100))] GSW=Gross Std. Volume %S&W=user entered % of Sediment & Water. At the end of each Volume Calculation Period, Mass is calculated using the equation: Last Calculated Mass Mass = Indicated Volume / Flowing Density The Flowing Density is either calculated or user entered. Last Calculated Energy At the end of each Volume Calculation Period, Energy is calculated using the equation: Energy = Indicated Volume x Heating Value. Limits Flowing Pressure High Limit Flowing Pressure Low Limit Flowing Temp High Limit Flowing Temp Low Limit Gross Flow Rate High Limit Gross Flow Rate Low Limit Ind. Vol. High Limit Ind. Vol. Low Limit This represents the higher limit of the Flowing Pressure value that can be sent to the tube application. This represents the lower limit of the Flowing Pressure value that can be sent to the tube application. This represents the higher limit of the total Flowing Temperature value that can be sent to the tube application. This represents the lower limit of the total Flowing Temperature value that can be sent to the tube application. Displays the Gross Flow Rate High Limit as specified on the Limits tab of Entry mode Setup. Displays the Gross Flow Rate Low Limit as specified on the Limits tab of Entry mode Setup. Enter a high limit value for the Indicated Volume. Only displayed if Flow Input Type is volume based. Enter a low limit value for the Indicated Volume. Only displayed if Flow Input Type is volume based. Adv Setup Adv Setup Flowing Pressure Input Enter the current scaled flowing pressure rev. AA Page 261
262 Use User Entered Flowing Pressure User Entered Flowing Pressure Flowing Pressure Type Flowing Temp Input Use Fixed Flowing Pressure RTD Installed Use User Entered Flowing Temperature User Entered Flowing Temperature Flow Input Type Pulse Input Select Yes if a Flowing Pressure value is to be entered. Enter a value to be used when the Use User Entered Flowing Pressure is set to Yes. Select whether the Flowing Pressure is coming from a Gauge or Absolute pressure device. Enter the current Flowing Temperature value. Select Yes to use the Fixed Flowing Pressure instead of a measured pressure. Select Yes if you are using an RTD for flowing temperature. Select Yes if a Flowing Temperature is to be used. Enter the Flowing Temperature if different than the default of 60 Degrees F. Enter one of the Flow Input Types: (Pulse Input Volume, Pulse Input Mass, Volume Flow Rate, or Mass Flow Rate). If Pulse Input Volume or Pulse Input Mass was selected for the Flow Input Type, enter the pulse input register here. No Flow Digital Input DI Action Flow State Specify a digital input register (format 0.0.0) for the Trip on Digital Input option. Select whether an Open Contact or a Closed Contact constitutes a No Flow condition. Displays the Flow State as Flow or No Flow based on the Digital Input specified above and the DI Action selected. Digital Output Digital Output 1 Digital Output Volume Setpoint Trip on Volume Setpoint Trip on Indicated Vol/Period Mass Low Trip on Indicated Vol/Period Mass High Trip on PF Low Trip on PF High Trip on TF Low Specify the output register for Digital Output 1 or Digital Output 2 depending on the tab selected. Enter the Volume Setpoint in MCF for tripping of the digital output by the Volume Setpoint command. If set to Yes, the digital output will be tripped each time the Volume Setpoint is reached. If set to Yes, the digital output will be tripped on the Indicated Volume or Calculation Period Mass low alarm. If set to Yes, the digital output will be tripped on the Indicated Volume or the Calculation Period Mass high alarm. If set to Yes, the digital output will be tripped on the Flowing Pressure Low alarm. Alarm limits are set in the Limits tab. If set to Yes, the digital output will be tripped on the Flowing Pressure High alarm. Alarm limits are set in the Limits tab. If set to Yes, the digital output will be tripped on the Flowing Temperature Low alarm. Alarm limits are set in the Limits tab. Page rev. AA
263 Trip on TF High Trip on Gross FR Low Trip on Gross FR High Trip on Charger Low Trip on Digital Input Digital Input DO Action Auto Reset Auto Reset Delay (Sec) Current State Manual Operation If set to Yes, the digital output will be tripped on the Flowing Temperature High alarm. Alarm limits are set in the Limits tab. If set to Yes, the digital output will be tripped on the Gross Flow Rate Low alarm. Alarm limits are set in the Limits tab. If set to Yes, the digital output will be tripped on the Gross Flow Rate High alarm. Alarm limits are set in the Limits tab. If set to Yes, the digital output will be tripped on the Low Charger alarm. The Low Charger alarm happens automatically if the charging source is removed or cannot maintain an adequate battery voltage. If set to Yes, the digital output will be tripped if the Digital Input specified below is set to a 1 (senses a closed contact). Specify a digital input register (format 0.0.0) for the Trip on Digital Input option. Select whether the digital output is to act as a Normally Open or Normally Closed contact. If set to Yes, the digital output will reset after the Auto Reset Delay time has elapsed. If set to No, Auxiliary Contact 1 will remain tripped until manually reset. Specify the amount of time in seconds Auxiliary Contact 1 will reset after being opened or closed by some action. Auto Reset must be set to Yes. Displays the current state of the digital output as Open or Closed. This function allows the user to manually operate the digital output. This might be done for testing purposes. If the DO Action parameter above is set to Normally Open, Trip will close the digital output, and Clear will open the digital output. If the DO Action parameter is set to Normally Closed, Trip will open the digital output and Clear will close it. Digital Output 2 (Same as Digital Output 1) K Factor The K Factor specifies the volume of gas in actual cubic feet, represented by a single pulse from the measuring hardware. Therefore, the number of pulses is multiplied by the K Factor to get the actual cubic feet which is known as the uncorrected volume. The uncorrected volume is then multiplied by C' to correct it to base conditions thus corrected volume. This variable can also be entered in the Calibration section. Note: Items that require engineering units have a Variable Group number in the Description column beside the description. The user may need to change units for a particular Variable Group or change the Multiplier for a Variable Group which is done on the Units tree-view item under the corresponding measurement tube. Click on the Units tree-view item, and note that all tabs have a left-hand column that contains the Application, Array, Register numbers (xx.xx.xx), and in this case, the last set of numbers match the associated Variable Group number. If the user needs to change the engineering units, they would click on the Units tree-view item, and look at the left column of each tab to locate the Variable Group whose last set of numbers as represented by "yy" (xx.xx.yy) match the Group number they are looking for. Keep in mind that changing the Units for a particular Variable Group will typically affect more than one item. After selecting the K Factor tab, the first choice is to determine the K Factor Mode under the General Setup section. Options are either Single Point or Multi Point. In this case the Single Point was selected and displays in the upper right hand corner of the screen (green). The Factor Type is then selected depending on whether the number of pulses is divided by the K Factor (Volume/Pulse) or multiplied by the inverse of the K Factor (Quantity/Pulse). The following information explains the remaining portions of the Single Point page: rev. AA Page 263

264 Single Point K Factor Points MultiPoint K Factor Setup This field is read only. There is no access to selecting calibration points unless in Multi Point mode. Dynamic K - displays the current K factor assuming a successful multipoint calibration has been completed and the multipoint calibration feature has been turned on General Setup Single Point K Factor The following read/write fields are active and defined in Single Point mode: Multi Point Calibration Enable - the user can elect to enable or cancel a Multi Point calibration K Factor Type - the user can define the K Factor as either Quantity/Pulse or Pulse/Quantity The user is enabled to define the K Factor in the Single Point mode If the user selects instead the Multi Point option under the K Factor Mode (General Setup), Multi Point will display (green) in the upper right corner of the screen. Again, the Factor Type is then selected depending on whether the number of pulses is divided by the K Factor (Volume/Pulse) or multiplied by the inverse of the K Factor (Quantity/Pulse). A major change in the Overview part of the screen is that Dynamic K displays in the read-only field where K Factor had displayed previously. The following information explains the remaining portions of the Multi Point page: MultiPoint K Factor Points Up to 11 points can be defined by the user for these fields but the Edit All convention must be used since no single row edits are able to be defined individually only collectively. Page rev. AA
265 The two following fields are defined: MultiPoint K Factor Setup Dynamic K - displays the current K factor assuming a successful multipoint calibration has been completed and the multipoint calibration feature has been turned on Calibration Points - displayed as read/write by the user. General Setup Single Point K Factor The following read/write fields are active and defined in Multi Point mode: Multi Point Enable - the user can elect to enable or cancel a Multi Point calibration K Factor Type - the user can define the K Factor as either Pulse/Quantity or Quantity only This field is read only in Multi Point mode. There will also be two buttons available to the user: Abort Calibration (Cancel) and Complete Calibration (Commit). Last Calculated Values The values in the Calc column display the last calculated values of variables that are specific to volume calculations. Updated frequency of the last calculated values is based on the Volume Calculation Period. The data displayed varies depending on the type of device and is for informational purposes only. Some of the information displayed will be familiar to the user, while others will not. As this is the case, the information presented is likely to be more useful to a Totalflow customer service representative than a field user. Indicated Flow Rate The Indicated Flow Rate is the Indicated Volume for the Volume Calculation Period. (See Indicated Volume below.) Pressure Correction Factor Cpl for the Volume Calculation Period depending how it is setup on the Liquids tab is either calculated or is a user entered value. For calculation method see the appropriate API document. Indicated Standard Flow Rate The Indicated Std. Flow Rate is the Indicated Std. Volume for the Volume Calculation Period. Combined T and P Factor (Ctpl) The Combined T & P Factor is calculated by the equation: Ctpl = Ctl x Cpl Gross Standard Flow Rate The Gross Std. Flow Rate is the This is the compressibility factor of Gross Std. Volume for the Volume Compressibility liquid in a meter at normal Calculation Period. (See Gross Std Factor (Fp) operating conditions. Volume below.) Net Standard Flow Rate The Net Std. Flow Rate is the Net Std. Volume for the Volume Calculation Period. Thermal Expansion Factor Thermal expansion factor of the 60 degrees F. Either user entered or calculated. Sediment and Water Flow Rate The Sediment & Water Flow Rate is the Sediment & Water Volume for the Volume Calculation Period. Temperature at 1968 Standard (Tf68) This temperature is the value used in calculating Ctl. Calculations adhering to API standards, use the temperature scale based on the 1968 standard (IPTS-68). Therefore, this temperature is a rev. AA Page 265
266 Mass Flow Rate The Mass Flow Rate is the Mass Volume for the Volume Calculation Period. Temperature at 1990 Standard (Tf90) conversion from the measured temperature which adheres to the 1990 standard (ITS-90). This is the measured temperature. Current temperature measurement devices are calibrated using the 1990 standard (ITS-90 temperature scale) as published by the International Committee for Weights and Measurements. Energy Flow Rate The Indicated Flow Rate as shown times the Heating Value. Base Pressure The accepted base pressure in the U.S. is psia. Indicated Volume Updated at the end of each Volume Calculation Period. Counts per period x K Factor = Indicated Volume Base Temperature The accepted base temperature in the U.S. is 60 degrees F. Indicated Standard Volume Updated at the end of each Volume Calculation Period. Counts per period x K Factor = Indicated Volume Indicated Volume x Ctl & Cpl = Indicated Std. Volume Base Density Calculated from Flowing Density if provided. Updated at the end of each Volume Calculation Period. Gross Standard Volume Counts per period x K Factor = Indicated Volume Indicated Volume x Ctl & Cpl = Indicated Std. Volume Flowing Density Measured or Calculated from the provided Base Density. Indicated Std. Volume x Meter Factor = Gross Std. Volume Updated at the end of each Volume Calculation Period: Net Standard Volume Counts per period x K Factor = Indicated Volume Indicated Volume x Ctl & Cpl = Indicated Std. Volume Indicated Std. Volume x Meter Factor = Gross Std. Volume Pipe Diameter (ID) Entered by user. Gross Std. Volume x Sediment & Water Factor = Net Std. Volume Sediment and Water Volume At the end of each Volume Calculation Period, Sediment & Water Volume is calculated using the equation: Sediment and Water Correction Factor Displays the Sediment & Water Correction Factor (CSW). CSW is calculated by the following formula: CSW = [1 - (%S&W/100)] Page rev. AA
267 S&W Volume = GSW-[GSW*(1- (%S&W/100))] GSW=Gross Std. Volume %S&W=user entered % of Sediment & Water. %S&W is the user entered or measured percent of sediment & water. Mass At the end of each Volume Calculation Period, Mass is calculated using the equation: Mass = Indicated Volume x Flowing Density The Flowing Density is either calculated or user entered. Heating Value Method Volume Based or Mass Based as specified on the General tab. Energy At the end of each Volume Calculation Period, Energy is calculated using the equation: Energy = Indicated Volume x Heating Value. Density Iteration Converged - Calculation of Ctl and/or Cpl had converged within 15 iterations. Not converged - Calculation of Ctl Temperature Correction Factor (Ctl) Ctl for the Volume Calculated Period depending how it is setup on the Liquids tab is either calculated or is a user entered value. For calculation method see the appropriate API document. Volume Correction Error Code 0 - No error 1 - Density out of standards range. 2 - No Alpha60 value. 3 - Temperature out of range. 4 - Pressure out of range. 5 - Alpha60 out of range. NOTE: Engineering units are established on the Selectable Units Setup tab accessible by clicking on the Station ID. The Station ID is the very top name on the tree-view. SU V-Cone Overview The SU V-Cone is a differential pressure type flow meter with a unique design that conditions the flow prior to measurement. Differential pressure is created by a cone placed in the center of the pipe. The cone is shaped so that it flattens the fluid velocity profile in the pipe, creating a more stable signal across wide flow downturns. Flow rate is calculated by measuring the difference between the pressure upstream of the cone at the meter wall and the pressure downstream of the cone through its center. Outside of the United States, requirements for standards of measurement may differ from existing domestic standards in the oil and gas industry. For example DP measured in inh2o here in one market but in another country's market may be measured in kg/cm2 instead. To meet such need in the overseas markets, a Selectable Unit (SU) functionality has been added. Thus the new nomenclature of SU V-Cone is to signify this functionality rev. AA Page 267
 V-Cone measurement applications instantiated per comm channel on the XFCG4 board.")
268 The user can also use the general information displayed as a snapshot of the current existing values for each parameter listed. There can be up to eight (8) V-Cone measurement applications instantiated per comm channel on the XFCG4 board. The fields displayed here are as follows: Yesterday's Volume Today's Volume This is the prior Contract Day's volume. The Contract Day is defined as a 24-hour period that establishes the parameters for a complete day. This value is updated at the end of each Volume Calculation Period. The Volume Calculation Period represents the rate at which the volume is calculated based on one second averages of the static pressure, differential pressure and temperature. At the end of this period, the average value of the extension (portion of the flow rate equation that is integrated each second) is multiplied by other factors in the AGA-3 equation to arrive at the flow rate for the Volume Calculation Period. The flow rate is then multiplied by the Volume Calculation Period. Every Volume Calculation Period volume is added to the current volume for the duration of the Contract Day. The user can establish the parameters for the V-Cone application using the read/write fields provided. These parameters are as follows: This is the user-designated description of the tube. This serves as an aid for the Tube Description user when there is more than one tube application running in a single device. The Contract Hour is the start of the day for daily volumes. Enter the Contract Hour Contract Hour in military time (0-23). From the drop-down list, select the location (upstream, downstream) of the Sp tap SP Tap Location in relation to the orifice plate. V-Cone Diameter Enter the V-Cone diameter size in dimensional units. Pipe Diameter Enter the pipe diameter size in dimensional units. Fpv Method Select the desired supercompressibility method. Page rev. AA
269 The six tabs displayed horizontally at the top of the page include important displayed data as well as read/write fields the user would need to set up functions such as Analysis or Calibration. The seventh (Configuration), eighth (Adv Setup), ninth (Digital Output), tenth (V-Cone), eleventh (V-Cone Sizing) and twelfth (Last Calc Values) tabs are accessible by selecting the pulldown arrow to the right of the Calibration tab. The user can re-select the arrow to re-display the Calibration tab (information). Each tab with relevant information is discussed as follows: RealTime Here the color-coordinated parameters are charted either on graph or grid. By clicking on the individual parameter's box below the chart, it will be displayed or removed from the chart as the situation dictates. The Points button is used to set the value of the displayed cycle measured. The View button can be used to either display the parameter in a Graph (default) or a Grid format. There is an option to expand/collapse the Graph view. The Expand button shall expand the graph to full screen. The Collapse button will return the graph to normal view. Day The Day tab displays information for the user that is based on the accumulated daily totals for the meter. The Day button allows the user to set the number of days displayed at one time. The user can select the View button to display the charted information in a Grid (default) or Graph format. The user can hover the mouse cursor over any portion of the graph display to display the value and date/time of the variable reading. (This can also be done for any of the displayed variables on the graph.) There is an option to expand/collapse the Graph view. The Expand button shall expand the graph to full screen. The Collapse button will return the graph to normal view. It is possible to use the mouse to zoom a desired portion of the graph by holding down the left button, rolling the mouse to define the desired area and releasing the left button to capture the area. That portion of the graph will then display proportionately over that area. By selecting the now active House icon to the left of the Expand button, the graph will re-display to its original position. Legends are selectable under graph. In case the graph has more than four parameters, an option is provided on the bottom of the graph to select up to four possible variables for plotting in overlay and once selected, they will be shown on the bottom of the graph as legends (selectable). A minimum of one variable is to be selected. The parameters possible to display from the Options icon are as follows: DP SP TF Volume Integral Energy This field represents the differential pressure. The value shown is the average of one second samples for the day. This field represents the static pressure. The value shown is the average of one second samples for the day. This field represents the flowing temperature. The value shown is the average of one second samples for the day. The Volume values are the sum of all the volume quantities that are calculated for each Volume Calculation Period during the Contract Day. Within this user-defined field the user can elect to hold the valve closed until the Integral enables. The options available are either Enabled or Disabled. This value represents the sum of energy quantities (MMBTU) that are accumulated since the beginning of the Contract Day. This is updated at the end of each Volume Calculation Period. At the end of the Volume Calculation Period, the rev. AA Page 269
270 DP Min DP Max DP Percent Low DP Percent Hi SP Min SP Max SP Percent Low SP Percent Hi TF Min TF Max TF Percent Low TF Percent Hi Period Time Flow Time Back Flow energy quantity is calculated by multiplying the Volume Calculation Period volume by the energy content. Minimum Differential Pressure recorded during the Contract Day. Maximum Differential Pressure recorded during the Contract Day. Displays the percentage of time the Differential Pressure was below the low limit during the Contract Day. Displays the percentage of time the Differential Pressure was above the high limit during the Contract Day. Minimum Static Pressure recorded during the Contract Day. Maximum Static Pressure recorded during the Contract Day. Displays the percentage of time the Static Pressure was below the low limit during the Contract Day. Displays the percentage of time the Static Pressure was above the high limit during the day. Minimum Temperature recorded during the Contract Day Maximum Temperature recorded during the Contract Day Displays the percentage of time the Temperature was below the low limit during the Contract Day. Displays the percentage of time the Temperature was above the high limit during the Contract Day. If Day Period, enter the frequency at which the trend data is logged. The format is hh:mm:ss in which one second is the fastest allowable time. It is recommended that Log Periods not be set faster than is necessary to conserve the device s processor time. Also, the more frequent the Log Periods, the faster the available memory of the device is used. Number of one second samples where DP is above zero cutoff, divided by the number of one second samples in a day, times 100 (rounded to the nearest.5 seconds). Number of one second samples where DP is at least three inches below zero. Log The Log tab provides information for the log period records (typically hourly records) for the selected meter. The Day button allows the user to set the number of days displayed at one time. The user can select the View button to display the charted information in a Grid (default) or Graph format. The user can hover the mouse cursor over any portion of the graph display to display the value and date/time of the variable reading. (This can also be done for any of the displayed variables on the graph.) There is an option to expand/collapse the Graph view. The Expand button shall expand the graph to full screen. The Collapse button will return the graph to normal view. It is possible to use the mouse to zoom a desired portion of the graph by holding down the left button, rolling the mouse to define the desired area and releasing the left button to capture the area. That portion of the graph will then display proportionately over that area. By selecting the now active House icon to the left of the Expand button, the graph will re-display to its original position. Legends are selectable under graph. In case the graph has more than four parameters, an option is provided on the bottom of the graph to select up to four possible variables for plotting in overlay and Page rev. AA
271 once selected, they will be shown on the bottom of the graph as legends (selectable). A minimum of one variable is to be selected. The parameters displayed in this chart are as follows: DP SP TF Integral Volume Energy Flow Time Period Time This field represents the differential pressure (in H2O). This field represents the static pressure (PSIA). This field represents the flowing temperature (Deg F). The Integral value represents the portion of the flow rate equation that is integrated each second. The volume period computation made by the computer is the product of C and the integrated extension (AGA 1985) or the integral multiplier and the integrated extension (AGA 1992). This field displays the totalized volume (MCF). This value represents the sum of energy quantities (MMBTU). Number of one second samples where DP is above zero cutoff, divided by the number of one second samples in a day, times 100 (rounded to the nearest.5 seconds). Displays the time in seconds for the Contract Day. If the system was functioning continuously with no down time, this number should be Event The Event tab provides a table of events from the selected meter. The information is presented as one line per event with a date and time stamp. The Day button allows the user to set the number of days displayed at one time. The parameters displayed in this chart are as follows: Event Old Value New Value SN This field displays the type of event that occurred. This field represents the value or condition that existed prior to the event. For a DP or SP check, this shows the actual reading (manually entered by the technician) when a test pressure is applied. This field represents the value or condition entered by the technician. For a DP or SP check, this is the test pressure applied on the transducer. If displayed, this is a sequence number assigned to each event. The numbers should be in sequence and if there is a gap in the sequence, it could signal a problem. Analysis The Analysis tab provides information on the composition elements and other parameters of either Fixed or Live analysis. The user can opt for either analysis method by selecting the corresponding option as well as the Advanced Setup option. In Fixed analysis, the user can use the left Composition Elements column to edit each or all of the read/write fields to set the individual percentage of each element. The right Gas Properties column has two read/write fields that can be selected and edited as well. These two fields are as follows: Heating Tb and Pb Real Specific Gravity Calculation of Energy is based on Volume or Mass. Energy is calculated by multiplying the Heating Value times the Volume or Mass. This value should be at the contracted pressure and temperature bases. The Others section only has one editable field as follows: rev. AA Page 271

272 FPV method is then squared (Fpv2) to derive the compressibility factor (Fs) for pulse meters. Available FPV methods are: NX19 fixed FtFp=0 NX19 GCN=2 NX19 GCNM=3 NX19 Auto=1 AGA8 Gross Method92=11 FPV Method AGA8 Detail 92=12 ISO SGERG88 - This method adheres to the international standard ISO For this method to be viable, one of the following base conditions must exist: 0 C / 32 F and bar / psi 15 C / 59 F and bar / psi C / 60 F and bar / psi C / 60 F and bar / psi For detailed information on these methods, see the American Gas Association, Report No. 8 / American Petroleum Institute Chapter 14.2 and/or ISO Standards and Calibration The Calibration tab provides necessary information to assist the user in completing the calibration process and a resulting report. With the tab selected, the Select Calibration Type button is initially selected to display the desired calibration check. The options for the checks are as follows: DP-SP Check Differential Pressure Static Pressure Temperature/RTD To start the calibration, select the type. Note the display of the Calibration Options fields changes depending on the calibration type selected as follows: Page rev. AA
273 Tolerance (% Diff) Hold Timeout Calibration Points Do you want to calibrate in Absolute? Barometric Pressure Temperature Bias The user selects a tolerance value equal to a desired % of the range; a warning message will display if the difference between the measured value and entered value exceeds this value. (applies to the following calibration checks: DP-SP, Differential Pressure, Static Pressure, Temperature/RTD) When the user elects to move into Calibration mode, the tube immediately moves into Hold Timer mode. The Hold Time Out (seconds) field allows the user to set a time frame (in seconds) from which to take the tube out of hold. The default is set to 3600 seconds (1 hour), but the user can establish a different time frame based on their individual needs. It should be noted that the timer starts as soon as the user moves into Calibration mode. (applies to the following calibration checks: DP-SP, Differential Pressure, Static Pressure, Temperature/RTD) The user would select the number of calibration points from this field. Options are 3 Points or 5 Points depending on the desired accuracy of the calibration. With the setup complete, the 3 or 5 point Target pressure values will be calculated for convenience. These are suggested because of being evenly spaced across the calibration range, but it is not mandatory that these be used. (applies to the following calibration checks: DP-SP, Differential Pressure, Static Pressure, Temperature/RTD) This option is simply an aid for doing checks. Selecting gauge allows the user to enter values directly from the test pressure without having to add the barometric pressure which is automatically included. (applies to the following calibration checks: Static Pressure) This value is subtracted from Absolute pressure readings when calibrating the static pressure in gauge pressure and for displaying the static pressure in gauge on the device s display. This value is also entered on the calibration screen when calibrating in gauge pressure. (applies to the following calibration checks: Static Pressure) If the user elects to use Temperature/RTD as a calibration method, select the Temperature Bias field under Calibration Options. This allows the user to enter a new value. The RTD's temperature will always be biased by this value. (applies to the following calibration checks: Temperature/RTD) The user would change the value of any of the fields displayed for the check selected as needed rev. AA Page 273
274 Then the Start Calibration button would be selected to start the process. The tube goes into the Hold state and the hold timer value for that tube is displayed on the right corner of the tab (defaults to 3600 seconds or one hour). The DP-SP Check screen was designed as a troubleshooting tool so that the static pressure could be varied while at the same time, recording the differential pressure. Any significant change in the DP while changing the SP indicates a problem. The applied static pressure will be displayed in the SP window as well as the differential pressure in the DP window. Clicking on the check mark box will accept the pressures. Repeat the process to enter the number of static pressure points desired. If it's decided that a re-zero is needed before any more checks, click the RE-ZERO tab and a screen will appear to allow the user to re-zero the transducer and return to the Checks screen. The buttons with X's can be used to delete the selected entries from the log until the desired entries are input. Select the Accept & Finish button to complete the entry process which will save the checks as the "As Found" and "As Left" and log the check events. The user can now "Abort" to finish or select the "Add to Report & Finish" button to send the data to reports and finish. Page rev. AA
275 Selecting the Add to Report & Finish button will complete this calibration. If the user wants to start the process over and not accept the entries, the Abort button would be selected instead rev. AA Page 275
276 Next select the Differential Pressure Calibration Check and modify the read/write fields if necessary. Then click the Start Calibration to begin. Again the tube goes into the Hold state and the hold timer value for that tube is displayed on the right corner of the tab (defaults to 3600 seconds or one hour). With the Differential Pressure (DP) Calibration Check, the As Found checks are entered by selecting a low, medium and high value. This is done by selecting a test value and selecting a Check mark to enter the value. The % of difference will also display. Repeat the process to enter the number of points desired. If satisfied the Accept & Finish button is selected and the As Found and As Left values are displayed. Page rev. AA
277 The DP Calibrate screen allows for doing checks or doing checks and a calibration. Start with doing checks and then continue with the calibration if needed. The As Found checks are created by applying different test pressures across the calibration range. For each test pressure applied, enter the test pressure in the Test box and click the Check Mark. The live reading will be displayed in the Live/Found box and be captured along with the entered Test value when the Check Mark is clicked. The % difference between the Test value and the live value will also be displayed. Repeat the process to enter the number of points desired. If checks are all that are required, click "Accept and Finish" or "Continue to Calibrate" to do a calibration rev. AA Page 277
278 Page rev. AA
279 If the user is satisfied at this point, the Accept & Finish button is selected. If not satisfied, the user can select the Re-calibrate button until satisfied. Selecting the Accept & Finish button will complete this calibration. If the user wants to start the process over and not accept the entries, the Abort button would be selected instead rev. AA Page 279

280 With the SP Calibration Check, the process is the same as the DP check. The final Calibration Check is the Temperature/RTD. The process is also the same as the DP Calibration Check and the SP Calibration Check. With a completed calibration, the appropriate box or boxes would be checked. The user could then select the Generate Report button to generate a report in HTML. Configuration The user can select the Configuration tab to access the read/write and read only fields used to set up data needed for configuration. The following nine (9) areas of fields are accessible to the user: Page rev. AA
281 Constants Factors Commands Fixed Values on Errors Log Capacity Setup Current Values Limits Water Constants The following information is provided in relation to all parameters and their fields: Constants Enter a value in the units as specified by the Units column. This value is subtracted from Absolute pressure readings when calibrating in Gauge Barometric Pressure pressure and for displaying the Static pressure in Gauge pressure on the device s display. This value can also be entered on the calibration screen when calibrating in Gauge pressure. Enter the value in units as specified. A decimal point is allowed. No volume Dp Zero Cutoff calculations will occur when DP is below this value. Select from the drop-down list, the location (upstream, downstream) of the SP Tap Location SP tap in relation to the V-Cone position. V-Cone Diameter Enter the orifice diameter size in dimensional units as specified. Enter the pipe diameter size in dimensional units as specified in the Units Pipe Diameter column. Enter the Reference Temperature for the V-Cone in the temperature units V-Cone Ref Temp as specified on the Units column. Enter the Reference Temperature for the Pipe in the temperature units as Pipe Ref Temp specified on the Units column. Enter the Pressure Base in the units as specified by the Units column. A Pressure Base (Pb) specific Pressure Base value may be required because of contractual agreements. Enter the Temperature Base in the units as specified by the Units column. A Temperature Base (Tb) specific Temperature Base may be required because of contractual agreements. This value is used when the Faux factor is turned on under the Factors tab. Faux is simply a multiplication factor times the computed gas volume that can be used to correct for a know error condition. This factor is typically Auxiliary Factor (Faux) used for what is referred to as the Full Well Stream Factor which is used to adjust the computed gas volume downward to account for the portion of the measured stream that is liquid. Z of Air Enter a value for the Z of Air. One default standard is Viscosity Enter the Viscosity in the units as specified by the Units column. Enter the Specific Heat Ratio. This is Cp divided by Cv. A typical value is Specific Heat Ratio 1.3 Select the V-Cone material type from the drop-down list. A standard expansion coefficient is used based on the material type. Three standard V-Cone Exp. Coef. material types are provided (Stainless Steel, Monel and Carbon Steel). If an orifice plate is used of a different type material, the user must select Other rev. AA Page 281
282 Pipe Exp. Coef. Fixed Cd A dialog box will display and enable the user to set a pre-defined value or a custom value. Move the decimal point six places to the right, and enter in the format of (x.xx) which is then scaled by the flow computer to x.xx times Select the pipe material type from the drop-down list. A standard expansion coefficient is used based on the material type. Three standard material types are provided (Stainless Steel, Monel and Carbon Steel). If pipe is used of a different type material, the user must select Other. A dialog box will display and enable the user to set a pre-defined value or a custom value. Move the decimal point six places to the right, and enter in the format of (x.xx) which is then scaled by the flow computer to x.xx times E -6. If Use Calc Cd is not selected in the Factors tab, this fixed value for Coefficient of Discharge is used. A typical value is Factors Use Calc Cd Use Y Use Fpv Use Fw Use Faux Coefficient of Discharge factor (Cd) - Select Yes for the flow computer to calculate and use this factor in the volume calculations. Selecting No will cause the flow computer to use a Fixed Cd which is entered on the Constants tab. Expansion factor (Y) - Select Yes for the flow computer to calculate and use this factor in the volume calculations. Compressibility factor - Select Yes for the flow computer to calculate and use this factor based on the Fpv method selected in the General tab. (Not for NIST14) Water Vapor factor - Used to adjust the computed gas volume downward to account for the portion of the measured fluid stream that is water in vapor phase. If enabled, Fw is computed by the flow computer. If supported, see the Water Constants tab for additional setup. Faux - Typically used as a Full Well Stream factor which is used to adjust the computed gas volume downward to account for the portion of the measured fluid stream that is liquid. The user enters a value which will be used as a direct multiplier when calculating C'. For example, a value of 0.9 would result in a volume reduction of 10%. The percentage liquids in the stream is typically determined by a Full Well Stream Test. The Faux factor is entered under the Constants tab. Since Faux is a direct multiplier to the volume, it can be used for any correction to the volume not accounted for in the basic equation. NOTE: Although factors (Faux and Fw) are being used by some companies, they have not been adopted by any standards committee. Commands Reset Volume Select Yes from the drop-down menu, and click the Send button. The user will be asked to confirm the request. Answer Yes for the request to be carried out. A typical use for this command is just prior to an orifice plate change on a gas orifice meter. The device reacts, as follows, to a Reset Volume: Completes all computations for the present flow file daily record. Stores date/time and partial log period's volume into its historical record. Logs an event with the accumulator value before zeroing the accumulator. Zeroes the total volume accumulator. Page rev. AA
283 Begins a new flow file daily record. Reset Log Period Set site code Select Yes from the drop-down menu, and click the Send button. The user will be asked to confirm the request. Answer Yes for the request to be carried out. This is similar to a Reset Volume, except the volume accumulator is not zeroed. A typical use for this command is just prior to an orifice plate change on a gas orifice meter. The device reacts, as follows, to a Reset Log Period: Completes all computations for the present flow file daily record. Stores date/time and partial log period's volume into its historical record. Logs an event in the Event file. Begins a new flow file daily record. Enter up to seven numerical digits, and a decimal point is allowed anywhere among the digits. A site code entry enters an event in the event file using the site code number. This number can represent anything to the user as some function performed at the site. Fixed Values on Errors Use Fixed Sp on Error Fixed Sp Value Sp High Error Sp Low Error Use Fixed DP on Error Fixed DP Value DP High Error DP Low Error Use Fixed Tf on Error Fixed Tf Value Tf High Error Tf Low Error Select Yes to use or No to not use the Fixed Sp Value if the Static Pressure exceeds the Sp High Error value or drops below the Sp Low Error value. Enter the Static Pressure value to be used if Use Fixed Sp On Error is set to Yes and the Static Pressure has exceeded the Sp High Error or dropped below the Sp Low Error value. Enter the value to be used for the Static Pressure High Error. Enter the value to be used for the Static Pressure Low Error. Select Yes to use or No to not use the Fixed DP Value if the Differential Pressure exceeds the Dp High Error value or drops below the Dp Low Error value. Enter the Differential Pressure value to be used if Use Fixed Dp On Error is set to Yes and the DP Pressure has exceeded the DP High Error or dropped below the DP Low Error value. Enter the value to be used for the Differential Pressure High Error. Enter the value to be used for the Differential Pressure Low Error. Select Yes to use or No to not use the Fixed Tf Value if the Flowing Temperature exceeds the Tf High Error value or drops below the Tf Low Error value. Enter the Flowing Temperature value to be used if Use Fixed Tf On Error is set to Yes and the Flowing Temperature has exceeded the Tf High Error or dropped below the Tf Low Error value. Enter the value to be used for the Flowing Temperature High Error. Enter the value to be used for the Flowing Temperature Low Error. Log Capacity Maximum # Daily Records Maximum # Log Period Records Enter the maximum number of Daily Records that the device will store. The default of 50 is recommended. Enter the maximum number of Log Period Records that the device will store. The default of 970 is recommended. 970 allows for 40 days of hourly records. One Log Period Record is used no matter what the Log Period time rev. AA Page 283
284 Maximum # Event Records Enter the maximum number of Event Records that the device will store. Each entry into the Event file is a record. Setup Device/APP ID Tube Description Contract Hour Vol Calc Period Log Period Calculation Type Fpv Method SP/DP Averaging Enter up to ten alpha-numeric characters for the Device/APP ID. This identifies the specific application or flow calculation. A Station or device can have multiple flow calculations running simultaneously, and each of those will have their own Device/APP ID. Enter up to 24 alphanumeric characters for a description of the tube. This is helpful when there is more than one tube application running in a single device. Enter the contract hour in military time (0-23). The contract hour is the start of the day for daily volumes. Select the volume calculation period from the drop-down list. Options are 1, 2, 5, 10, 20, 30 and 60 seconds/minutes. This is the rate at which the volume is calculated based on one second averages of SP, DP and Temperature. Unless otherwise required, the default of 60 minutes is recommended. This period can be the same as but should never be greater than the log period. If not the same, the log period should always be an even multiple of the volume calculation period. Select the log period from the drop-down list. Options are 1, 2, 5, 10, 20, 30 and 60 minutes. This is the rate at which the calculated volumes are logged to the historical file. Unless otherwise required, the default of 60 minutes is recommended. This period can be the same as but should never be less than the volume calculation period. If not the same, it should always be an even multiple of the volume calculation period. This option is only valid in devices supporting the new database (DB2) and when in the Extended Characteristic mode. A default period of one hour is used at all other times. Displays the type of flow calculation which is API Liquid. This is a read-only parameter. Supercompressibility factor (Fpv) - Select Yes for the device to calculate Fpv based on the NX19 method and use it in the volume calculations. Select Linear or Square Root averaging from the drop-down list. The following explanation applies to the Differential Pressure, Static Pressure and Temperature. Linear - Sums the samples and divides by the number of samples. Square Root - Sum of the square root of the samples divided by the number of samples and squared. Last Analysis time Displays the last date/time that a live analysis was received. Heating Value Method Hold Time Out (Seconds) The Heating Value Method parameter field enables the user to select the heating value based on either Volume or Mass calculations. This informs the software whether to multiply the volume or the mass by the heating value. Sets a time duration (in seconds) that informs the device how long to remain in Hold when the user is in Calibration mode. The default is set to 3600 (1 hr.). This is primarily protection against getting side-tracked and forgetting to take the unit out of Hold. This pertains to any tube that is put in Hold while in Calibration mode. Current Values Page rev. AA
285 Displays and/or allows entry of the Static Pressure register used in flow Static Pressure calculations. Displays and/or allows entry of the Differential Pressure register for AGA- Differential Pressure 3 used in flow calculations. Displays and/or allows entry of the Flow Temperature register used in Temperature flow calculations. Estimated flow rate based on the current Integral and the last calculated Flow Rate integral multiplier. The Mass Flow Rate is the Mass Volume for the Volume Calculation Current Mass Flow Rate Period. Current Energy Flow Rate The Indicated Flow Rate times the Heating Value. Updated at the end of each Volume Calculation Period. At the end of each Volume Calculation Period, the counts for the period are multiplied times the K Factor to produce an uncorrected volume which is then Today's Volume multiplied times the currently selected SUAGA-7 factors (See Factors tab under Setup) to produce a Corrected Volume. Each Volume Calculation Period volume is added to the current volume for the duration of the Contract Day. Updated at the end of each Volume Calculation Period. Each Volume Today's Mass Calculation mass is added to the current mass for the duration of the Contract Day. Updated at the end of each Volume Calculation Period. The sum of energy quantities accumulated since the beginning of the contract day. At Today's Energy the end of each Volume Calculation Period, the energy quantity is calculated by multiplying the Volume Calculation Period volume by the energy content. This is the prior Contract Day's volume. The Contract Day is defined as a Yesterday's Volume 24-hour period that establishes the parameters for a complete day. Yesterday's Mass Prior Contract Day s Mass. Yesterday's Energy Prior Contract Day s energy. Updated at the end of each Volume Calculation Period. At the end of each Volume Calculation Period, the counts for the period are multiplied times the K Factor to produce an uncorrected volume which is then multiplied times the currently selected SUAGA-7 factors (See Factors tab Accumulated Volume under Setup) to produce a Corrected Volume. Each Volume Calculation Period corrected volume is then added to the Accumulated Volume. This continues until zeroed by the Reset Volume command or an accumulator rollover happens. Updated at the end of each Volume Calculation Period. At the end of each Volume Calculation Period, the mass is added to the current Accumulated Mass running total until zeroed by the Reset Volume command or an accumulator rollover happens. Updated at the end of each Volume Calculation Period. At the end of each Volume Calculation Period, the energy is added to the current Accumulated Energy running total until zeroed by the Reset Volume command or an accumulator rollover happens. Last Calculated Volume Volume for the last Volume Calculation Period. Last Calculated Mass Mass for the last Volume Calculation Period. Last Calculated Energy Energy for the last Volume Calculation Period rev. AA Page 285
286 Limits Sp High Limit Sp Low Limit Dp High Limit Dp Low Limit RTD High Limit RTD Low Limit Flow Rate High Limit Flow Rate Low Limit This represents the higher limit of the static pressure value that can be sent to the tube application. This represents the lower limit of the static pressure value that can be sent to the tube application. This represents the higher limit of the differential pressure value that can be sent to the tube application. This represents the lower limit of the differential pressure value that can be sent to the tube application. This represents the higher limit of the total flowing temperature value that can be sent to the tube application. This represents the lower limit of the total flowing temperature value that can be sent to the tube application. This represents the higher limit of the flow rate value that can be sent to the tube application. This represents the lower limit of the flow rate value that can be sent to the tube application. Water Constants Use Fixed H2O Fixed H2O Content H2O Bias Last Calculated Fw Select Yes to use the water vapor content value as specified by Fixed H2O Content in lieu of the device calculating the water vapor content. Enter a value that will be used as a fixed value for the water vapor content. The above parameter Use Fixed H2O will need to be set to Yes for the fixed value to be used. Enter an offset for calculation of Fw. If using Fw, but unfamiliar with this bias parameter, use the default value. Displays the Last Fw value calculated by the device. Adv Setup Adv Setup Static Pressure Diff Pressure Temperature Static Pressure Type RTD Installed Use Fixed Temperature Fixed Temperature Enter the App/Array Enter the App/Array Enter the App/Array Enter Absolute or Gauge Enter No Enter Yes Enter Temperature value No Flow Digital Input DI Action Flow State Enter the App/Array Enter Disabled or Enabled Flow displayed Digital Output Page rev. AA
287 Digital Output 1 Digital Output Volume Setpoint Trip on Volume Setpoint Trip on DP Low Trip on DP High Trip on SP Low Trip on SP High Trip on TF Low Trip on TF High Trip on Fr Low Trip on Fr High Trip on Charger Low Trip on Digital Input Digital Input DO Action Auto Reset Auto Reset Delay (Sec) Current State Manual Operation Specify the output register for Digital Output 1 or Digital Output 2 depending on the tab selected. Enter the Volume Setpoint in MCF for tripping of the digital output by the Volume Setpoint command. If set to Yes, the digital output will be tripped each time the Volume Setpoint is reached. If set to Yes, the digital output will be tripped on the DP Low alarm. Alarm limits are set in the Limits tab. If set to Yes, the digital output will be tripped on the DP High alarm. Alarm limits are set in the Limits tab. If set to Yes, the digital output will be tripped on the SP Low alarm. Alarm limits are set in the Limits tab. If set to Yes, the digital output will be tripped on the SP High alarm. Alarm limits are set in the Limits tab. If set to Yes, the digital output will be tripped on the Flowing Temperature Low alarm. Alarm limits are set in the Limits tab. If set to Yes, the digital output will be tripped on the Flowing Temperature High alarm. Alarm limits are set in the Limits tab. If set to Yes, the digital output will be tripped on the Flow Rate Low alarm. Alarm limits are set in the Limits tab. If set to Yes, the digital output will be tripped on the Flow Rate High alarm. Alarm limits are set in the Limits tab. If set to Yes, the digital output will be tripped on the Low Charger alarm. The Low Charger alarm happens automatically if the charging source is removed or cannot maintain an adequate battery voltage. If set to Yes, the digital output will be tripped if the Digital Input specified below is set to a 1 (senses a closed contact). Specify a digital input register (format 0.0.0) for the Trip on Digital Input option. Select whether the digital output is to act as a Normally Open or Normally Closed contact. If set to Yes, the digital output will reset after the Auto Reset Delay time has elapsed. If set to No, Auxiliary Contact 1 will remain tripped until manually reset. Specify the amount of time in seconds Auxiliary Contact 1 will reset after being opened or closed by some action. Auto Reset must be set to Yes. Displays the current state of the digital output as Open or Closed. This function allows the user to manually operate the digital output. This might be done for testing purposes. If the DO Action parameter above is set to Normally Open, Trip will close the digital output, and Clear will open the digital output. If the DO Action parameter is set to Normally Closed, Trip will open the digital output and Clear will close it. Digital Output 2 (Same as Digital Output 1) V-Cone Sizing rev. AA Page 287
288 The user can select the Orifice tab to change the Orifice Plate. The first option would be to ensure all read/write fields have the correct value selected. These fields are as follows: V-Cone Diameter Enter the V-cone diameter size in dimensional units. Pipe Diameter Displays the pipe diameter size in dimensional units. Sp Tap Location Displays the location (upstream, downstream) of the Sp tap in relation to the V- Cone plate. Hold Time Out Default to one hour but can be edited by the user. Once all the fields are showing the desired values, the user must first select the Hold button to set the timer at 60 minutes. The flow pressure is then held for that period of time to allow the user to change the orifice plate. The user then changes the orifice plate. Once finished, the user would select the Flowing button to resume flow. V-Cone V-Tube Type No. of Cd Table Entries Reynold's Number #1 Flow Coefficient #1 Reynold's Number #2 Flow Coefficient #2 Reynold's Number #3 Flow Coefficient #3 Reynold's Number #4 Flow Coefficient #4 Reynold's Number #5 Flow Coefficient #5 Reynold's Number #6 Flow Coefficient #6 Reynold's Number #7 Flow Coefficient #7 Reynold's Number #8 Enter tube type (Precision or Wafer Cone). Specify the number of pairs (Reynolds number and associated Cd numbers) entered when the Use Calc Cd is set to Yes (see Factors). Enter the Reynold's Number value of the first pair (Reynold's Number and Flow Coefficient). Enter the Flow Coefficient value of the first pair (Reynold's Number and Flow Coefficient). Enter the Reynold's Number value of the second pair (Reynold's Number and Flow Coefficient). Enter the Flow Coefficient value of the second pair (Reynold's Number and Flow Coefficient). Enter the Reynold's Number value of the third pair (Reynold's Number and Flow Coefficient). Enter the Flow Coefficient value of the third pair (Reynold's Number and Flow Coefficient). Enter the Reynold's Number value of the fourth pair (Reynold's Number and Flow Coefficient). Enter the Flow Coefficient value of the fourth pair (Reynold's Number and Flow Coefficient). Enter the Reynold's Number value of the fifth pair (Reynold's Number and Flow Coefficient). Enter the Flow Coefficient value of the fifth pair (Reynold's Number and Flow Coefficient). Enter the Reynold's Number value of the sixth pair (Reynold's Number and Flow Coefficient). Enter the Flow Coefficient value of the sixth pair (Reynold's Number and Flow Coefficient). Enter the Reynold's Number value of the seventh pair (Reynold's Number and Flow Coefficient). Enter the Flow Coefficient value of the seventh pair (Reynold's Number and Flow Coefficient). Enter the Reynold's Number value of the eighth pair (Reynold's Number and Flow Coefficient). Page rev. AA
289 Flow Coefficient #8 Reynold's Number #9 Flow Coefficient #9 Reynold's Number #10 Flow Coefficient #10 Reynold's Number #11 Flow Coefficient #11 Reynold's Number #12 Flow Coefficient #12 Reynold's Number #13 Flow Coefficient #13 Reynold's Number #14 Flow Coefficient #14 Reynold's Number #15 Flow Coefficient #15 Reynold's Number #16 Flow Coefficient #16 Enter the Flow Coefficient value of the eighth pair (Reynold's Number and Flow Coefficient). Enter the Reynold's Number value of the ninth pair (Reynold's Number and Flow Coefficient). Enter the Flow Coefficient value of the ninth pair (Reynold's Number and Flow Coefficient). Enter the Reynold's Number value of the tenth pair (Reynold's Number and Flow Coefficient). Enter the Flow Coefficient value of the tenth pair (Reynold's Number and Flow Coefficient). Enter the Reynold's Number value of the eleventh pair (Reynold's Number and Flow Coefficient). Enter the Flow Coefficient value of the eleventh pair (Reynold's Number and Flow Coefficient). Enter the Reynold's Number value of the twelfth pair (Reynold's Number and Flow Coefficient). Enter the Flow Coefficient value of the twelfth pair (Reynold's Number and Flow Coefficient). Enter the Reynold's Number value of the thirteenth pair (Reynold's Number and Flow Coefficient). Enter the Flow Coefficient value of the thirteenth pair (Reynold's Number and Flow Coefficient). Enter the Reynold's Number value of the fourteenth first pair (Reynold's Number and Flow Coefficient). Enter the Flow Coefficient value of the fourteenth pair (Reynold's Number and Flow Coefficient). Enter the Reynold's Number value of the fifteenth pair (Reynold's Number and Flow Coefficient). Enter the Flow Coefficient value of the fifteenth pair (Reynold's Number and Flow Coefficient). Enter the Reynold's Number value of the sixteenth pair (Reynold's Number and Flow Coefficient). Enter the Flow Coefficient value of the sixteenth pair (Reynold's Number and Flow Coefficient). Last Calc Values The values in the Calc column display the last calculated values of variables that are specific to volume calculations. Updated frequency of the last calculated values is based on the Volume Calculation Period. The data displayed varies depending on the type of device and is for informational purposes only. Some of the information displayed will be familiar to the user, while others will not. As this is the case, the information presented is likely to be more useful to a Totalflow customer service representative than a field user. Qm Qv Volume Mass Energy Xpt_Volp Base Mass Base Volume Displayed in SCF (standard cubic feet) Displayed in lbm (pounds of mass) Displayed in MBtu (thousands of British thermal units) Displayed value in H2O.psia/R rev. AA Page 289
290 Real Specific Gravity Specific Heat Ratio Displayed as a ratio of the density of the sample to the density of water. This value should be at the contracted pressure and temperature bases. All Fpv methods. The Specific gravity or Base gravity, as it is called in liquid calculations, defaults to.658 but an accurate gravity if known should be entered. Displayed as a ratio of the density of the sample to the density of water Fluid Viscosity Displayed in cp (centipoise), a unit of viscosity Z of Air at the contractual values for pressure base and temperature base. The user would enter a value for the Z of Air. This is the compressibility of air Zbase of Air at a reference temperature (typically 60 degrees F.) The default standard is Pressure Base Displayed in PSIA (pounds per square inch absolute) Temperature Base Displayed in Degrees F. Base Compressibility Display follows one of four existing base conditions. Flowing Calculated from the Base Compressibility Compressibility A factor used to account for the following effect: Boyle's law for gases states that the specific weight of a gas is directly proportional to the absolute pressure, the temperature remaining constant. All gases deviate from this law by varying amounts, and within the range of conditions ordinarily encountered Super Compressibility in the natural gas industry, the actual specific weight under the higher pressure is usually greater than the theoretical. The factor used to reflect this deviation from the ideal gas law in gas measurement with an orifice meter is called the "supercompressibility factor"or Fpv. Fip (Female Iron Pipe Connection) is the adaptor and will accept the pipe into Fip its fitting Live Static Pressure Displays last live reading in PSIA (pounds per square inch absolute) Displays last static pressure reading in PSIA (pounds per square inch Static Pressure absolute) Live Differential Displays last Live rather than Fixed Differential Pressure (PSIA) Pressure Differential Pressure Displays last differential pressure reading in INH2O (inches of water) Live Temperature Displays last live temperature reading in degrees F. Flowing Temperature Displays last flowing temperature reading in degrees F. Faux Displays faux or fpv (supercompressibility) value Water Vapor Factor Displays the water vapor factor (Fw) (Fw) V-Cone Reference Temperature Pipe Reference Temperature Pipe Expansion Coefficient As temperatures can cause the V-Cone size to change, the V-Cone Reference Temperature represents the actual temperature at which the V- Cone size was measured. As temperatures can cause the pipe size to change, the Pipe Reference Temperature represents the actual temperature at which the pipe size was measured. A standard expansion coefficient is used based on the material type. Three standard material types are available (Stainless Steel, Monel & Carbon Steel). If pipe is used of a different type material, the user must enter an Expansion Coefficient in units. Move the decimal point 6 places to the right, and enter in the format of (x.xx) which is then scaled by the flow computer to x.xx times E-6. Page rev. AA
291 Pipe Inside Diameter Displays pipe inside diameter in inches Temperature The V-Cone Diameter corrected for temperature Corrected V-Cone ID Y Expansion Factor Displays Y (expansion factor), used in volume calculations V-Cone Diameter Displays V-Cone diameter in inches Temperature Corrected V-Cone V-Cone Diameter corrected for temperature Diameter Temperature Corrected Pipe/Orifice The Pipe/Orifice Ratio corrected for temperature Ratio (Beta) Y Expansion Factor Displays Y (expansion factor), used in volume calculations This parameter is often referred to as the velocity of approach factor and dividing the coefficient of discharge by that parameter (as was done above) produces the flow coefficient. Methods also exist for determining the flow coefficient as a function of the beta function and the location of the Velocity of Approach downstream pressure sensing tap. For rough approximations, the flow coefficient may be assumed to be between 0.60 and For a first approximation, a flow coefficient of 0.62 can be used as this approximates to fully developed flow. Defined for different situations where a fluid is in relative motion to a surface Reynold's Number including fluid properties of density and viscosity plus a velocity and an internal diameter Discharge Coefficient (Cd) C-Prime Static Factor (cp_s) C-Prime (cp) Live Flowing Density Base Density Flowing Density Heating Value Select AIR Coefficient of Discharge factor (Cd) - Select Yes for the flow computer to calculate and use this factor in the volume calculations. Selecting No will cause the flow computer to use a Fixed Cd which is entered on the Constants tab. The Static Factor value displays here. The portion of the flow rate equation that is computed each Vol. Calc. Period. Assumes not using fixed data but live data from an external source Displays the Base Density used from the Start Date/Time to the End Date/Time. Displays the average Flowing Density used from the Start Date/Time to the End Date/Time. Select either Volume Based or Mass Based. This tells the software whether to multiply the calculated volume or mass by the heating value which is found on the Fixed or Live Analysis tabs and provides the total heating value for the period. Generally the mole percentage of AIR displayed here is related to the mole percentage of N2 (the chief component of air). C6+ (Index Split Mode) This affects both the NGC setup as far as the C6+ split and what C6+ information is sent to an external Modbus device. User Defined C6+ Reported - With this selection, the user specifies the C6+ split percentages for the NGC. Information sent to an external Modbus includes the split values as well as the C6+ value. Pre-defined C6+ Splits - If you select one of the four predefined split percentages, the NGC will use this selection for the split. If information is sent rev. AA Page 291

292 to an external Modbus device, it will include the C6+ value and a code representing the same split percentages. User Defined C6+ Not Reported - With this selection, the user specifies the C6+ split percentages for the NGC. Information sent to an external Modbus device includes the split values but not the C6+ value. Therms Master Overview Therms is in reference to the analysis being provided by an analyzer which is interfaced to a device called the Master. The Master can use the analysis and/or pass the analysis along to other devices known as Slaves. There are two basic Therms Interfaces or applications: The one that runs on the Master or Host device and the one that runs on the Slave devices. A Modbus Host protocol must be running on the Master device s communication port being used, and a Modbus Slave protocol must be running on the Slave s communication port. These protocols can be Modbus ASCII or Modbus RTU. The Master device receives analysis data from the Totalflow BTU Transmitter or compatible analyzer, saves the analysis in its Live Analysis registers and sends the analysis on to the Slave devices. Communication There are three major sections on the Therms Master main page: Communication, Stream and Slave. On this, the Therms Master section, three tabs (Setup, Statistics and Packet Log) are displayed horizontally across the top of the page. Each tab with its relevant information is discussed as follows: Page rev. AA
293 Setup NOTE: Remember in order to setup communication for Therms Master, please access PCCU. Therms Master Setup Device/APP ID No. of XFCs/XRCs Analyzer Polling Selection Analysis Update Trigger Modbus Address of Analyzer Scan Enable 3001 Scan Enable 7001 Scan Enable 7017 Scan Enable 3058 Scan Enable 7200 Enter either Use New Data Flag or Use Cycle Time Enter the value of the Modbus Address of Analyzer. Enter one of the following: Use ABB BTU 8000 Poll, Use ABB NGC/ Daniel 2251 Poll, Use Daniel 2350A Poll Enter either Use New Data Flag or Use Cycle Time Enter the value of the Modbus Address of Analyzer. If set to Yes, ABB analyzer addresses are polled. If polling a Daniels 2251 compatible analyzer, addresses are polled. If set to Yes, Addresses are polled. If set to Yes, Addresses are polled. If set to Yes, this is a write function to clear the New Data Flag in the external analyzer. If set to Yes, retrieves status information from ABB Totalflow analyzers only. Analysis Setup Use Stream 1 Use Stream 2 Use Stream 3 Use Stream 4 Mole Percent High Limit Mole Percent Low Limit Specific Gravity High Limit Specific Gravity Low Limit Enter either Yes or No (Yes causes the Therms Master application to notify any internal tube application using Stream 1 when updated Stream 1 data is available.) Enter either Yes or No (Yes causes the Therms Master application to notify any internal tube application using Stream 2 when updated Stream 2 data is available.) Enter either Yes or No (Yes causes the Therms Master application to notify any internal tube application using Stream 3 when updated Stream 3 data is available.) Enter either Yes or No (Yes causes the Therms Master application to notify any internal tube application using Stream 4 when updated Stream 4 data is available.) Enter the value of the Mole Percent High Limit (Enables the user to set the mole percent high limit from which to reject analysis prior to being used in measurement tube flow calculations. If any individual component exceeds this limit, the analysis is rejected.) Enter the value of the Mole Percent Low Limit (Enables the user to set the mole percent low limit from which to reject analysis prior to being used in measurement tube flow calculations. If any individual component exceeds this limit, the analysis is rejected.) Enter the value of the Specific Gravity High Limit (Enables the user to set the Specific Gravity high limit from which to reject analysis prior to being used in measurement tube flow calculations. This value should be at the contracted pressure and temperature bases.) Enter the value of the Specific Gravity Low Limit (Enables the user to set the specific gravity low limit from which to reject analysis prior to being used in rev. AA Page 293
294 Heating Value High Limit Heating Value Low Limit Data Error measurement tube flow calculations. This value should be at the contracted pressure and temperature bases.) Enter the value of the Heating Value High Limit (Enables the user set the specific heating value high limit from which to reject analysis prior to being used in measurement tube flow calculations.) Enter the value of the Heating Value Low Limit (Enables the user set the specific heating value low limit from which to reject analysis prior to being used in measurement tube flow calculations.) Displays Yes or No (read only) (Informs the user when a rejection has occurred. If an error does occur, the field is color coded red and will display Yes; otherwise, the field is color coded green and displays No.) Communications Port Port Type Protocol Register Format The Port that will be used for the Therms interface displays depending on the COM assignment as follows: COM2: XFCs have a COM1: and COM2: XRCs have a COM1: COM2: and COM3:. If using TCP/IP, this will be the IP address and port number (e.g., /508). The current Port Type will display from the following list: OnBoard Serial - Select if using one of the serial communication ports located physically on the device's main electronic's board. TCP/IP Client - Select if using the Ethernet port located physically on the device's main electronic's board. The Protocol will need to be set to Modbus/TCP Client. TFIO Serial - Select when using a TFIO communications module referred to as a Communications Interface Module (CIM). These will be mounted on a rail external to the main electronics board. (Not for NGC) The Protocol assigned will display from the following list: Modbus Host (ASCII) - Select when communicating with a Slave using Modbus ASCII protocol. Modbus Host (RTU) - Select when communicating with a Slave using Modbus RTU protocol. Modbus/TCP Client - Select when communication with a Slave via the Ethernet port. The Port Type will need to be set to TCP/IP Client. The Register Format assignment will display from the following list: There are multiple selections as shown below. Typically when a Totalflow device is communicating with another Totalflow device, 32 Bit Totalflow will be employed. If communicating with a third party device that requires a different format, select that format. The important thing to remember is that the Host and Slave is set for the same format. 32 Bit Totalflow - 32 bit values are transferred as a single 32 bit register. Register list entries are biased one greater than standard Modbus (7002 = 7001 Standard). 32 Bit - 32 bit values are transferred as a single 32 bit register. 16 Bit Modicon - 32 bit values are transferred as two consecutive 16 bit registers. 16 Bit Word Swapped - 32 bit values are transferred as two consecutive 16 bit registers and swaps the order of the registers. 16 Bit ROS Modulo Multiplies the floating point number by 1000 and then divides by The integer portion (before the decimal point) goes into the first Page rev. AA
295 16 bit register and the fractional portion (after the decimal point) goes in the second 16 bit register. Interface The interface type is assigned from one of the following selections: RS232 - Select if the port is connected to a radio or an RS232 device. RS485 - Select if communicating via RS485. RS422 - Select if communicating via RS422. Baud Rate A range of the Baud Rate displays from a value of 1200 to Data Bits Displays Number of Data Bits (7 or 8) Parity Displays Parity (None, Even or Odd) Stop Bits Displays Number of Stop Bits (1 or 2) Response Delay (milliseconds) Xmit Key Delay (milliseconds) UnKey Delay (milliseconds) Timeout (milliseconds) Response Delay is a delay that is on the front end of communications between devices. It can be used by the device initiating a request and/or by the device responding to the request. Either way, it delays the start of communication to another device. Set to zero for no delay or enter a delay value in milliseconds. In the case of polling multiple Therms Slaves, there may need to be a short delay to allow one slave to respond before polling another. Typically 10 milliseconds works well when polling multiple slaves. Typically used when communicating via radio but can affect any communications equipment; this is a delay time to allow a radio's transmitter or any transceiver to stabilize after being keyed up before data is transmitted. It can typically be set at approximately 10 milliseconds. Typically used when communicating via radio but can affect any communications equipment; this is a delay time to keep the radio's transmitter keyed up after the last data bit is transmitted. It can typically be set at approximately 10 milliseconds. If having problems communicating, enter a value here typically from milliseconds. This is the largest gap tolerated between characters within a packet. If this time expires, any partial packet is discarded, and the protocol looks for the beginning of a new packet. Switched V- Batt/Operate Retries Trailing Pad Alt Comm Port This parameter selects the mode for how Switched V-Batt and Operate. Both Switched V-Batt and Operate are switched voltage outputs and come from the same source with the exception that Operate has an on-board 500 ohm current limiting resister in series with it. They will turn on and off at the Listen Cycle frequency and is controlled by the communication Schedule if used. Enable - Allows the outputs to switch on and off with the Listen Cycle time and be controlled by the communications Schedule. Disable - Disables the outputs. Always ON - Causes the outputs to be on all the time. When initiating requests, specify the number of times to retry if the initial request fails. Trailing Pad allows the user to add zeroes to the end of a transmission sequence to make sure the transmission is accomplished before the remote device tries to respond. This is more for devices that have a quick turnaround time. This can be used in place of having an Unkey Delay. Select 2 bytes, 3 bytes or 4 bytes from the drop-down list. The Alternate Port feature can be used to communicate with different devices on the same communication port (i.e., COM1, CIM0, etc.). The Coriolis, XMV and Therms Master are the only applications that support the Alternate Port feature rev. AA Page 295
296 For example, if the XMV application has been instantiated and is using CIM0 for the communication path, the Therms Master and Coriolis applications can share that physical port. To add the Coriolis or Therms Master application to the CIM0 port, set the Port to None and the Alternate Port parameter to CIM0. When using the Alternate Port, all the devices MUST communicate using the same protocol (i.e., same protocol, same baud rate, same stop and start bits, same delays and timeouts). NOTE: The main issue in using the Alternate Port feature is that the various devices MUST communicate using the same protocol. Comm Directory Specify a directory and path in the device for Request Block files. Typically, this would be under the directory associated with the communication port being used. Typically a default directory will already be specified. Statistics NOTE: Remember in order to setup communication for Coriolis Interface, please access PCCU. Statistics Previous Poll Loop Displays the last poll loop time. If multiple devices, the time to poll all devices. Time Minimum Poll Loop Keeps the minimum poll loop time of all polls. Time Maximum Poll Loop Keeps the maximum poll loop time of all polls. Time Number of Polls The number of times the device tried to communicate with another device. The number of times the device tried to communicate with another device but Number of Errors was unsuccessful. Number of Late Completions Displays the number of times the communication s poll failed to retrieve data from the device or devices within the scan time allotted. For example, devices such as XMVs may be polled once a second and data must be retrieved within the second. If the user is seeing multiple late completions, try reducing the time slightly on one of the parameters mentioned above. If the Number of Errors start to increase after changing a parameter, increase it until the Number of Errors stop. If Late Completions are still happening, try reducing one of the other parameters using the same scenario. Number of Interrupts Displays the total number of transmit/receive interrupts. Number of Characters Displays a running total of received bytes from the devices. Received Number of Characters Displays a running total of transmitted bytes to the devices. Transmitted Thread Priority Displays the priority of the protocol task. 1ST Priority Displays the priority of the interrupt service thread. Packet Log NOTE: Remember in order to setup communication for Therms Master, please access PCCU. The Packet Log tab is included for troubleshooting purposes only. The information provided has only to do with Totalflow Remote protocol or Modbus protocol. Other than the number of errors and polls that are displayed at the bottom of the screen, the user would need a Totalflow Remote protocol Page rev. AA

297 and/or a Modbus document to understand the information that gets displayed. You might however be asked by a customer service representative for information provided on this screen. The information displayed on the screen is provided from a file maintained in the device. You can specify the number of records that are kept in the file by selecting one of the values for the Log Size from its pulldown menu to ensure only the newest records are kept. To receive any updated information after initially viewing the screen, you will be required to either click the Re-read button or check the Monitor button. The information displayed will only change if additional polls have occurred since the last time the information was read. Stream There are three major sections on the Therms Master main page: Communication, Stream and Slave. The read-only fields on the left side of the page display the percentage of composition of all the listed components. On this, the Therms Master Stream section, four tabs (Stream Info, Stream Data, Component Tables and Cross Ref Index) are displayed horizontally across the top of the page. Each tab with its relevant information is discussed as follows: Stream Info These fields are all read only and display stream only data as follows: Current Stream Call/Analysis Flag Current Stream 1 Time Current Stream 2 Time Stream Number displays Calibration or Analysis Cycle Flag displays Date/Time of Current Stream 1 displays Date/Time of Current Stream 2 displays rev. AA Page 297
298 Current Stream 3 Time Current Stream 4 Time Elapsed Stream 1 Time (mins) Elapsed Stream 2 Time (mins) Elapsed Stream 3 Time (mins) Elapsed Stream 4 Time (mins) Date/Time of Current Stream 3 displays Date/Time of Current Stream 4 displays Date/Time of Elapsed Stream 1 displays (mins) Date/Time of Elapsed Stream 2 displays (mins) Date/Time of Elapsed Stream 3 displays (mins) Date/Time of Elapsed Stream 4 displays (mins) Stream Data The composition of all four streams is displayed in these read only fields. Component Tables Select which set of component indexes to use to map the stream component data. For the Totalflow Btu Transmitter, Index 1-16 is used. For a Danalyzer, either index (1-16 or 17-32) can be used based on a bit setting in a register; therefore, if using a Danalyzer and unsure, refer to the Danalyzer documentation. Component Value Index ( ) Mapping Index ( ) Index ( ) Mapping Index ( ) This column displays the sequence number which is the order the components are received from the analyzer. Displays the value in Mole % read from the analyzer. Displays the component identifier of components in the address range. Displays the index number of the particular component shown in the address range. Displays the component identifier of components in the address range. Displays the index number of the particular component shown in the address range. Cross Ref Index These fields are read/write, allowing the user to key information for each component from the Component Table. The numbered Component row includes Index Mapping and Xref ( ) and Index Mapping and Xref ( ). Component Index Mapping ( ) Xref ( ) Index Mapping ( ) Xref ( ) This column displays the sequence number which is the order the components are received from the analyzer. Displays the component index numbers returned from Modbus addresses of the polled analyzer. These index numbers represent components and are typically standard among analyzers; however, variations can be found. Entry in this column is only required if a component index number or numbers received from the analyzer do not match the standard index numbers used by the Therms Master application. In case of a mismatch, the user would enter the Therms index number here that represents the component that the received number represents. Displays the component index numbers returned from Modbus addresses of the polled analyzer. For ABB analyzers, these will be the same numbers as registers Entry in this column is only required if a component index number or numbers received from the analyzer do not match the standard index numbers used by the Therms Master application. In case of a mismatch, the user would enter the Therms Page rev. AA

299 index number here that represents the component that the received number represents. Slave This information tells the Therms Master application about a slave device. The number of slaves is specified on the Therms Master Setup screen. Each slave will have this setup information. External XFC/XRC Modbus Address Scan Enable Use Stream 1 Use Stream 2 Use Stream 3 Use Stream 4 Enter the Modbus address of the external slave device. Each slave device must have a unique Modbus address. Typically, this is a number from 1 to 247. Must be set to Yes for the Master to send analysis data to this slave device. Set to Yes if the Master is to send Stream 1 data to the slave device whose Modbus address is specified above. Set to Yes if the Master is to send Stream 2 data to the slave device whose Modbus address is specified above. Set to Yes if the Master is to send Stream 3 data to the slave device whose Modbus address is specified above. Set to Yes if the Master is to send Stream 4 data to the slave device whose Modbus address is specified above. Therms Slave rev. AA Page 299

300 Overview Therms is in reference to the analysis being provided by an analyzer which is interfaced to a device called the Master. The Master can use the analysis and/or pass the analysis along to other devices known as Slaves. There are two basic Therms Interfaces or applications: The one that runs on the Master or Host device and the one that runs on the Slave devices. A Modbus Host protocol must be running on the Master device s communication port being used, and a Modbus Slave protocol must be running on the Slave s communication port. These protocols can be Modbus ASCII or Modbus RTU. The Master device receives analysis data from the Totalflow BTU Transmitter or compatible analyzer, saves the analysis in its Live Analysis registers and sends the analysis on to the Slave devices. On the left side of the screen is a read only table for each individual component. The user can scroll up and down to see each individual component and its percentage of the total. Four tabs (Communications, Register Map, Statistics and Packet Log) are displayed horizontally across the top of the page. Each tab with its relevant information is discussed as follows: Communications Modbus Address Port Port Type Enter the Slave Modbus address. Enter the Port that will be used for the Therms interface. This will typically be COM2:. XFCs have a COM1: and COM2:. XRCs have a COM1:, COM2: and COM3:. Select a port type from the drop-down list. Page rev. AA
301 OnBoard Serial - Select if using one of the serial communication ports located physically on the device's main electronic's board. TCP/IP Client - Select if using the Ethernet port located physically on the device's main electronic's board. A TCP Client initiates conversations with the server by asking the server to perform a task. TFIO Serial - Select when using a TFIO communications module referred to as a Communications Interface Module (CIM). These will be mounted on a rail external to the main electronics board. Protocol Select a protocol from the drop-down menu. Modbus Slave (ASCII) - Select when communicating with a Host using Modbus ASCII protocol. Modbus Slave (RTU) - Select when communicating with a Host using Modbus RTU protocol. Modbus/TCP Client - Select when communication with a Slave using Modbus/TCP Client protocol. Select the appropriate format from the drop-down list. There are multiple selections as shown below. Typically when a Totalflow device is communicating with another Totalflow device, 32 Bit Totalflow will be used. If communicating with a third party device that requires a different format, select that format. The important thing to remember is that the Host and Slave must be set for the same format Bit Totalflow - 32 bit values are transferred as a single 32 bit register. Register list entries are biased one greater than standard Modbus (7002 = 7001 Standard). Register Format 32 Bit - 32 bit values are transferred as a single 32 bit register. 16 Bit Modicon - 32 bit values are transferred as two consecutive 16 bit registers. 16 Bit Word Swapped - 32 bit values are transferred as two consecutive 16 bit registers and swaps the order of the registers. 16 Bit ROS Modulo Multiplies the floating point number by 1000 and then divides by The integer portion (before the decimal point) goes into the first 16 bit register and the fractional portion (after the decimal point) goes in the second 16 bit register. Interface Select the interface type from the drop-down list that will be used on this port. Available selections are: RS232 - Select if the port is connected to a radio or an RS-232 device. RS Select if communicating via RS-485. RS Select if communicating via RS-422. Baud Rate Data Bits Parity Stop Bits Response Delay (milliseconds) Click in the Value column, and select the Baud Rate from the drop-down list. Range is from 1200 to Selections are 7 or 8 data bits. Selections are None, Odd and Even. Selections are 1 or 2 stop bits. Response Delay is a delay that is on the front end of communications between devices. It can be used by the device initiating a request and/or by the device responding to the request. Either way, it delays the start of communication to another device. Set to zero for no delay or enter a delay value in milliseconds. The analyzer may turnaround too quickly transmitting data before the external device is ready to receive rev. AA Page 301
302 Xmit Key Delay (milliseconds) UnKey Delay (milliseconds) Timeout (milliseconds) Switched V- Batt/Operate Directory Typically used when communicating via radio but can affect any communication equipment; this is a delay time to allow a radio's transmitter to stabilize after being keyed up before data is transmitted. This can typically be left at the default time of 420 milliseconds. Typically used when communicating via radio but can affect any communication equipment; this is a delay time to keep the radio's transmitter keyed up after the last data bit is transmitted. This can typically be left at the default time of 40 milliseconds. If having problems communicating, enter a value here from milliseconds. This is the largest gap tolerated between characters within a packet. If this time expires, any partial packet is discarded, and the protocol looks for the beginning of a new packet. This parameter selects the mode for how Switched V-Batt and Operate. Both Switched V-Batt and Operate are switched voltage outputs and come from the same source with the exception that Operate has an on-board 500 ohm current limiting resister in series with it. They will turn on and off at the Listen Cycle frequency and is controlled by the communications Schedule if used. Enable - Allows the outputs to switch on and off with the Listen Cycle time and be controlled by the communications Schedule. Disable - Disables the outputs. Always ON - Causes the outputs to be on all the time. Displays the path of the Comm Directory for Request Block files. Register Map NOTE: Remember in order to setup communication for Therms Slave, please access PCCU. Use the pulldown menu to select the correct register file (by year). File Configuration Register Type Map Type Select the data Register Type. Different data types will require a different register map for each data type. Int bit integer. Int bit integer. Float - 32 bit Floating Point. (Typical) Bool - 8 bit Boolean, known as Coils in Modbus protocol. Structure - Generic structure. EnronDayHr - Enron s Daily/Hourly record structure. EnronEvent - Enron s Event record structure. Select the Map Type. List - List assumes the Totalflow registers are not sequential so they must be manually entered. The user must specify a Totalflow register in the Registers area for each Modbus register. The Totalflow register in the first slot will be associated with the first Modbus register entered in Map Start. The Totalflow register listed in Page rev. AA
303 the second slot will be associated with the next sequential Modbus register although the remaining Modbus registers are not shown. Array - When specifying the beginning Totalflow register, it is assumed the remaining Totalflow registers are in sequential order. The remaining registers will not be listed in the Registers area. Enter the Map Start address. This is the starting Modbus register number and subsequent registers sequence from there. For example: if you enter a starting Map Start number of 7001 and enter 5 for the # Registers, the assigned Modbus registers are 7001, 7002, 7003, 7004 & No. of Registers Specifies the number of registers to act upon beginning with the Starting Register. Checking the Buffered box typically comes down to: Check the box if polling a small Buffered List or Array at fast intervals. If not, do not check. Registers Each read only field contains the registry information for the selected year. Information is available from (per individual file year). Standard Therms Slave register map: Register Type = Float Map Type = Array Map Start = 2001 # Registers = 44 In the Register column of the Registers table enter (xx.100.0) for Modbus register 2001, where xx is the Application number. The Application number for Therms in an NGC is typically 19 and 46 for XFC or XRC device. This can be verified by looking at the Applications tab which is on the Station ID (top tree view item in Entry Setup) and Viewing the Advanced mode. Statistics NOTE: Remember in order to set up communication for Therms Slave, please access PCCU. Statistics Number of Polls Number of Interrupts Number of Characters Received Number of Characters Transmitted Thread Priority 1ST Priority The number of times the device tried to communicate with another device. Displays the total number of transmit/receive interrupts. Displays a running total of received bytes from the devices. Displays a running total of transmitted bytes to the devices. Displays the priority of the protocol task. Displays the priority of the interrupt service thread. Packet Log NOTE: Remember in order to set up communication for Therms Slave, please access PCCU rev. AA Page 303

304 The Log Size pulldown menu is used to set the size of individual packet logs. The number of each poll is posted here. As well is listed the Communication Directory. The Packet Log tab is included for troubleshooting purposes only. The information provided has only to do with Totalflow Remote protocol or Modbus protocol. Other than the number of errors and polls that are displayed at the bottom of the screen, the user would need a Totalflow Remote protocol and/or a Modbus document to understand the information that gets displayed. You might however be asked by a customer service representative for information provided on this screen. The information displayed on the screen is provided from a file maintained in the device. You can specify the number of records that are kept in the file by selecting one of the values for the Log Size and only the newest records are kept. To receive any updated information after initially viewing the screen, you will be required to either click the Re-read button or check the Monitor button. The information displayed will only change if additional polls have occurred since the last time the information was read. V-Cone Overview The V-Cone is a differential pressure type flow meter with a unique design that conditions the flow prior to measurement. Differential pressure is created by a cone placed in the center of the pipe. The cone is shaped so that it flattens the fluid velocity profile in the pipe, creating a more stable signal across wide flow downturns. Flow rate is calculated by measuring the difference between the pressure upstream of the cone at the meter wall and the pressure downstream of the cone through its center. Page rev. AA
305 The user can also use the general information displayed as a snapshot of the current existing values for each parameter listed. There can be up to eight (8) V-Cone measurement applications instantiated per comm channel on the XFCG4 board. The fields displayed here are as follows: ID The ID field represents the unique identifier for the device. As devices can have multiple flow calculations (tubes) running simultaneously, each one of these will have their own ID. Description This is the user-designated description of the tube. This serves as an aid for the user when there is more than one tube application running in a single device. Yesterday's Volume This is the prior Contract Day's volume. The Contract Day is defined as a 24-hour period that establishes the parameters for a complete day. Today's Volume This value is updated at the end of each Volume Calculation Period. The Volume Calculation Period represents the rate at which the volume is calculated based on one second averages of the static pressure, differential pressure and temperature. At the end of this period, the average value of the extension (portion of the flow rate equation that is integrated each second) is multiplied by other factors in the AGA-3 equation to arrive at the flow rate for the Volume Calculation Period. The flow rate is then multiplied by the Volume Calculation Period. Every Volume Calculation Period volume is added to the current volume for the duration of the Contract Day. The user can establish the parameters for the V-Cone application using the read/write fields provided. These parameters are as follows: Contract Hour SP Tap Location Calculation Type V-Cone Diameter Pipe Diameter Fpv Method The Contract Hour is the start of the day for daily volumes. Enter the Contract Hour in military time (0-23). From the drop-down list, select the location (upstream, downstream) of the Sp tap in relation to the orifice plate. Select the desired calculation type. Enter the V-Cone diameter size in dimensional units. Enter the pipe diameter size in dimensional units. Select the compressibility (Fpv) method from the drop-down list. Available Fpv methods are: NX19 fixed FtFp - Uses NX19 Gravity, Carbon Dioxide and Nitrogen method but user must manually calculate and enter Ft and Fp. NX19 GCN - Uses NX19 Gravity, Carbon Dioxide and Nitrogen method. NX19 GCNM - Uses NX19 Gravity, Carbon Dioxide, Nitrogen and Methane method rev. AA Page 305
306 NX19 GCN or GCNM - This method automatically switches to GCNM method if Gravity exceeds.75 and/or Carbon Dioxide or Nitrogen exceeds 15%. AGA8 Gross 92 - This is the default method when selecting the AGA equation. This is one of the newer and recommended Fpv methods, assuming only Specific Gravity, Carbon Dioxide and Nitrogen are used. AGA8 Detail 92 - This method supports total analysis. SGERG88 - This method adheres to the international standard ISO For this method to be viable, one of the following base conditions must exist: 0 C / 32 F and bar / psi 15 C / 59 F and bar / psi C / 60 F and bar / psi C / 60 F and bar / psi For detailed information on these methods, see the American Gas Association, Report No. 8 / American Petroleum Institute Chapter 14.2 and/or ISO Standards and The six tabs displayed horizontally at the top of the page include important displayed data as well as read/write fields the user would need to set up functions such as Analysis or Calibration. The seventh (Configuration), eighth (Adv Setup), ninth (Digital Output) and tenth (Orifice) tabs are accessible by selecting the pulldown arrow to the right of the Calibration tab. The user can re-select the arrow to redisplay the Calibration tab (information). Each tab with relevant information is discussed as follows: RealTime Here the color-coordinated parameters are charted either on graph or grid. By clicking on the individual parameter's box below the chart, it will be displayed or removed from the chart as the situation dictates. The Points button is used to set the value of the displayed cycle measured. The View button can be used to either display the parameter in a Graph (default) or a Grid format. There is an option to expand/collapse the Graph view. The Expand button shall expand the graph to full screen. The Collapse button will return the graph to normal view. Day The Day tab displays information for the user that is based on the accumulated daily totals for the meter. The Day button allows the user to set the number of days displayed at one time. The user can select the View button to display the charted information in a Grid (default) or Graph format. The user can hover the mouse cursor over any portion of the graph display to display the value and date/time of the variable reading. (This can also be done for any of the displayed variables on the graph.) There is an option to expand/collapse the Graph view. The Expand button shall expand the graph to full screen. The Collapse button will return the graph to normal view. Legends are selectable under graph. In case the graph has more than four parameters, an option is provided on the bottom of the graph to select up to four possible variables for plotting in overlay and once selected, they will be shown on the bottom of the graph as legends (selectable). A minimum of one variable is to be selected. Page rev. AA
307 The parameters possible to display from the Options icon are as follows: DP SP TF Volume Integral Energy DP Min DP Max DP Percent Low DP Percent Hi SP Min SP Max SP Percent Low SP Percent Hi TF Min TF Max TF Percent Low TF Percent Hi Period Time Flow Time Back Flow This field represents the differential pressure. The value shown is the average of one second samples for the day. This field represents the static pressure. The value shown is the average of one second samples for the day. This field represents the flowing temperature. The value shown is the average of one second samples for the day. The Volume values are the sum of all the volume quantities that are calculated for each Volume Calculation Period during the Contract Day. Within this user-defined field the user can elect to hold the valve closed until the Integral enables. The options available are either Enabled or Disabled. This value represents the sum of energy quantities (MMBTU) that are accumulated since the beginning of the Contract Day. This is updated at the end of each Volume Calculation Period. At the end of the Volume Calculation Period, the energy quantity is calculated by multiplying the Volume Calculation Period volume by the energy content. Minimum Differential Pressure recorded during the Contract Day. Maximum Differential Pressure recorded during the Contract Day. Displays the percentage of time the Differential Pressure was below the low limit during the Contract Day. Displays the percentage of time the Differential Pressure was above the high limit during the Contract Day. Minimum Static Pressure recorded during the Contract Day. Maximum Static Pressure recorded during the Contract Day. Displays the percentage of time the Static Pressure was below the low limit during the Contract Day. Displays the percentage of time the Static Pressure was above the high limit during the day. Minimum Temperature recorded during the Contract Day Maximum Temperature recorded during the Contract Day Displays the percentage of time the Temperature was below the low limit during the Contract Day. Displays the percentage of time the Temperature was above the high limit during the Contract Day. If Day Period, enter the frequency at which the trend data is logged. The format is hh:mm:ss in which one second is the fastest allowable time. It is recommended that Log Periods not be set faster than is necessary to conserve the device s processor time. Also, the more frequent the Log Periods, the faster the available memory of the device is used. Number of one second samples where DP is above zero cutoff, divided by the number of one second samples in a day, times 100 (rounded to the nearest.5 seconds). Number of one second samples where DP is at least three inches below zero. Log The Log tab provides information for the log period records (typically hourly records) for the selected meter. The Day button allows the user to set the number of days displayed at one time rev. AA Page 307
308 The user can select the View button to display the charted information in a Grid (default) or Graph format. The user can hover the mouse cursor over any portion of the graph display to display the value and date/time of the variable reading. (This can also be done for any of the displayed variables on the graph.) There is an option to expand/collapse the Graph view. The Expand button shall expand the graph to full screen. The Collapse button will return the graph to normal view. Legends are selectable under graph. In case the graph has more than four parameters, an option is provided on the bottom of the graph to select up to four possible variables for plotting in overlay and once selected, they will be shown on the bottom of the graph as legends (selectable). A minimum of one variable is to be selected. The parameters displayed in this chart are as follows: DP SP TF Integral Volume Energy Flow Time Period Time This field represents the differential pressure (kg/cm2). This field represents the static pressure (PSIA). This field represents the flowing temperature (Deg F). The Integral value represents the portion of the flow rate equation that is integrated each second. The volume period computation made by the computer is the product of C and the integrated extension (AGA 1985) or the integral multiplier and the integrated extension (AGA 1992). This field displays the totalized volume (MCF). This value represents the sum of energy quantities (MMBTU). Number of one second samples where DP is above zero cutoff, divided by the number of one second samples in a day, times 100 (rounded to the nearest.5 seconds). If Log Period, enter the frequency at which the trend data is logged. The format is hh:mm:ss in which one second is the fastest allowable time. It is recommended that Log Periods not be set faster than is necessary to conserve the device s processor time. Also, the more frequent the Log Periods, the faster the available memory of the device is used. Event The Event tab provides a table of events from the selected meter. The information is presented as one line per event with a date and time stamp. The Day button allows the user to set the number of days displayed at one time. The parameters displayed in this chart are as follows: Event Old Value New Value SN This field displays the type of event that occurred. This field represents the value or condition that existed prior to the event. For a DP or SP check, this shows the actual reading (manually entered by the technician) when a test pressure is applied. This field represents the value or condition entered by the technician. For a DP or SP check, this is the test pressure applied on the transducer. If displayed, this is a sequence number assigned to each event. The numbers should be in sequence and if there is a gap in the sequence, it could signal a problem. Analysis The Analysis tab provides information on the composition elements and other parameters of either Fixed or Live analysis. The user can opt for either analysis method by selecting the corresponding option as well as the Advanced Setup option. Page rev. AA
309 In Fixed analysis, the user can use the left Composition Elements column to edit each or all of the read/write fields to set the individual percentage of each element. The right Gas Properties column has two read/write fields that can be selected and edited as well. These two fields are as follows: Heating Tb and Pb Real Specific Gravity Calculation of Energy is based on Volume or Mass. Energy is calculated by multiplying the Heating Value times the Volume or Mass. This value should be at the contracted pressure and temperature bases. The Others section only has one editable field as follows: FPV Method FPV method is then squared (Fpv2) to derive the compressibility factor (Fs) for pulse meters. Available FPV methods are: AGA8 Gross Method 1 - This method uses Gross Heating Value, Relative Density and Carbon Dioxide. AGA8 Gross Method 2 - This method uses Relative Density, Nitrogen and Carbon Dioxide. AGA8 Detail 92 - This method basically supports a total analysis. ISO This method supports total analysis as specified in the international standard ISO SGERG88 - This method adheres to the international standard ISO For this method to be viable, one of the following base conditions must exist: 0 C / 32 F and bar / psi 15 C / 59 F and bar / psi C / 60 F and bar / psi C / 60 F and bar / psi For detailed information on these methods, see the American Gas Association, Report No. 8 / American Petroleum Institute Chapter 14.2 and/or ISO Standards and In Live analysis, the user relies on real time data as displayed in each field under the Live column. The values in the Calc column display the last calculated values of variables that are specific to volume calculations. Updated frequency of the last calculated values is based on the Volume Calculation Period. The data displayed varies depending on the type of device and is for informational purposes only. Some of the information displayed will be familiar to the user, while others will not. As this is the case, the information presented is likely to be more useful to a Totalflow customer service representative than a field user. The Advanced Setup option includes both the Analysis and Therms Setup. In the Analysis Setup, the first three user defined fields deal with the type and duration of the analysis type selected. The multiple configuration parameters default to use the fixed values although multiple options are available for the user. The Therms Setup allows the user to select the fields to assign required values for the assigned fields. These fields are defined as follows: Attached to Stream # If using analyzer data from a Master, select the stream number to use. If not using analyzer rev. AA Page 309
310 Stream ID Analyzer Modbus ID or Btu Stream Unit # Stream Source App Enter four numeric numbers to help uniquely define the measurement tube's stream ID (e.g., 1234). Each measurement tube must have a unique stream ID. The tube's complete stream ID is composed of the four digit stream ID assigned here, the analyzer Modbus ID and the stream number currently attached (e.g., ). If this tube application is running on a flow computer, enter the Modbus ID of the external Therms analyzer. If this tube application is running on an NGC and the source of the analysis data is a Btu application, enter the Btu Unit Number. If this tube application is running on an NGC and the source of the analysis data is a Therms application, enter the Modbus ID of the external Therms analyzer. Enter the application number of the application providing the analysis information. This can be a Therms Master, Therms Slave or a Btu Stream application. A Btu Stream application only applies to an NGC. Calibration The Calibration tab provides necessary information to assist the user in completing the calibration process and a resulting report. With the tab selected, the Select Calibration Type button is initially selected to display the desired calibration check. The options for the checks are as follows: DP-SP Check Differential Pressure Static Pressure Temperature/RTD To start the calibration, select the type. Note the display of the Calibration Options fields changes depending on the calibration type selected as follows: The user selects a tolerance value equal to a desired % of the range; a warning message will display if the difference between the measured value and entered Tolerance (% Diff) value exceeds this value. (applies to the following calibration checks: DP-SP, Differential Pressure, Static Pressure, Temperature/RTD) When the user elects to move into Calibration mode, the tube immediately moves into Hold Timer mode. The Hold Time Out (seconds) field allows the user to set a time frame (in seconds) from which to take the tube out of hold. The default is set Hold Timer to 3600 seconds (1 hour), but the user can establish a different time frame based on their individual needs. It should be noted that the timer starts as soon as the user moves into Calibration mode. (applies to the following calibration checks: DP-SP, Differential Pressure, Static Pressure, Temperature/RTD) Page rev. AA
311 Calibration Points Do you want to calibrate in Gauge? Barometric Pressure The user would select the number of calibration points from this field. Options are 3 Points or 5 Points depending on the desired accuracy of the calibration. With the setup complete, the 3 or 5 point Target pressure values will be calculated for convenience. These are suggested because of being evenly spaced across the calibration range, but it is not mandatory that these be used. (applies to the following calibration checks: DP-SP, Differential Pressure, Static Pressure, Temperature/RTD) This option is simply an aid for doing checks. Selecting gauge allows the user to enter values directly from the test pressure without having to add the barometric pressure which is automatically included. (applies to the following calibration checks: Static Pressure) This value is subtracted from Absolute pressure readings when calibrating the static pressure in gauge pressure and for displaying the static pressure in gauge on the device s display. This value is also entered on the calibration screen when calibrating in gauge pressure. (applies to the following calibration checks: Static Pressure) Temperature Bias If the user elects to use Temperature/RTD as a calibration method, select the Temperature Bias field under Calibration Options. This allows the user to enter a new value. The RTD's temperature will always be biased by this value. (applies to the following calibration checks: Temperature/RTD) The user would change the value of any of the fields displayed for the check selected as needed. Then the Start Calibration button would be selected to start the process rev. AA Page 311

312 The DP-SP Check screen was designed as a troubleshooting tool so that the static pressure could be varied while at the same time, recording the differential pressure. Any significant change in the DP while changing the SP indicates a problem. The applied static pressure will be displayed in the SP window as well as the differential pressure in the DP window. Clicking on the check mark box will accept the pressures. Repeat the process to enter the number of static pressure points desired. If it's decided that a re-zero is needed before any more checks, click the RE-ZERO tab and a screen will appear to allow the user to re-zero the transducer and return to the Checks screen. The buttons with X's can be used to delete the selected entries from the log until the desired entries are input. Select the Accept & Finish button to complete the entry process which will save the checks as the "As Found" and "As Left" and log the check events. The user can now "Abort" to finish or select the "Add to Report & Finish" button to send the data to reports and finish. Page rev. AA
313 Selecting the Add to Report & Finish button will complete this calibration. If the user wants to start the process over and not accept the entries, the Abort button would be selected instead rev. AA Page 313
 Calibration Check, the As Found checks are entered by selecting a low, medium and high value.")
314 Next select the Differential Pressure Calibration Check and modify the read/write fields if necessary. Then click the Start Calibration to begin. With the Differential Pressure (DP) Calibration Check, the As Found checks are entered by selecting a low, medium and high value. This is done by selecting a test value and selecting a Check mark to enter the value. The % of difference will also display. Repeat the process to enter the number of points desired. If satisfied the Accept & Finish button is selected and the As Found and As Left values are displayed. Page rev. AA
315 The DP Calibrate screen allows for doing checks or doing checks and a calibration. Start with doing checks and then continue with the calibration if needed. The As Found checks are created by applying different test pressures across the calibration range. For each test pressure applied, enter the test pressure in the Test box and click the Check Mark. The live reading will be displayed in the Live/Found box and be captured along with the entered Test value when the Check Mark is clicked. The % difference between the Test value and the live value will also be displayed. Repeat the process to enter the number of points desired. If checks are all that are required, click "Accept and Finish" or "Continue to Calibrate" to do a calibration rev. AA Page 315

316 Page rev. AA
317 If the user is satisfied at this point, the Accept & Finish button is selected. If not satisfied, the user can select the Re-calibrate button until satisfied. Selecting the Accept & Finish button will complete this calibration. If the user wants to start the process over and not accept the entries, the Abort button would be selected instead rev. AA Page 317
318 With the SP Calibration Check, the process is the same as the DP check. The final Calibration Check is the Temperature/RTD. The process is also the same as the DP Calibration Check and the SP Calibration Check. With a completed calibration, the appropriate box or boxes would be checked. The user could then select the Generate Report button to generate a report in HTML. Configuration The user can select the Configuration tab to access the read/write and read only fields used to set up data needed for configuration. Page rev. AA
319 The following seven (7) areas of fields are accessible to the user: Constants Factors Commands Log Capacity Setup Current Values Limits The following information is provided in relation to all parameters and their fields: Constants Barometric Pressure Dp Zero Cutoff SP Tap Location V-Cone Diameter Pipe Diameter Pressure Base (Pb) Temperature Base (Tb) Enter a value in the units as specified by the Units column. This value is subtracted from Absolute pressure readings when calibrating in Gauge pressure and for displaying the Static pressure in Gauge pressure on the device s display. This value can also be entered on the calibration screen when calibrating in Gauge pressure. Enter the value in units as specified. A decimal point is allowed. No volume calculations will occur when DP is below this value. Select from the drop-down list, the location (upstream, downstream) of the SP tap in relation to the V-Cone position. Enter the orifice diameter size in dimensional units as specified. Enter the pipe diameter size in dimensional units as specified in the Units column. Enter the Pressure Base in the units as specified by the Units column. A specific Pressure Base value may be required because of contractual agreements. Enter the Temperature Base in the units as specified by the Units column. A specific Temperature Base may be required because of contractual agreements. Z of Tb and Pb Z of Air at the contractual values for pressure base and temperature base. Enter a value for the Z of Air. This is the compressibility of air at a reference temperature (Typ. 60 degrees). One default standard is Auxiliary Factor (Faux) Viscosity Specific Heat Ratio (cp/cv) V-Cone Exp. Coef. Pipe Coef Exp This value used when the Faux factor is turned on under the Factors tab. This factor is typically used as the Full Well Stream factor. See the 1992 Factors for more information on Faux. Enter the Viscosity in the units as specified by the Units column. Enter the Specific Heat Ratio. This is Cp divided by Cv. A typical value is 1.3 Select the V-Cone material type from the drop-down list. A standard expansion coefficient is used based on the material type. Three standard material types are provided (Stainless Steel, Monel and Carbon Steel). If an orifice plate is used of a different type material, the user must select Other. A dialog box will display and enable the user to set a pre-defined value or a custom value. Move the decimal point six places to the right, and enter in the format of (x.xx) which is then scaled by the flow computer to x.xx times A standard expansion coefficient is used based on the material type. Three standard material types are available (Stainless Steel, Monel & Carbon Steel) rev. AA Page 319
320 If pipe is used of a different type material, the user must enter an Expansion Coefficient in units. Move the decimal point 6 places to the right, and enter in the format of (x.xx) which is then scaled by the flow computer to x.xx times E - 6. Fixed Cd Fixed Ap If Use Calc Cd is not selected in the Factors tab, this fixed value for Coefficient of Discharge is used. The default value is.8 but can be edited. Click in the Fixed Ap field and enter the absolute pressure to be used (14.73 PSIA). This value can be edited by the user. Factors Use Calc Cd Coefficient of Discharge factor (Cd) - Select Yes for the flow computer to calculate and use this factor in the volume calculations. Selecting No will cause the flow computer to use a Fixed Cd which is entered on the Constants tab. Use Y Expansion factor (Y) - Select Yes for the flow computer to calculate and use this factor in the volume calculations. Use Fpv Supercompressibility factor - Select "Yes" for the flow computer to calculate, and use this factor based on the Fpv method selected on the General tab. Use Fw Water Vapor factor - Used to adjust the computed gas volume downward to account for the portion of the measured fluid stream that is water in vapor phase. If enabled, Fw is computed by the flow computer. Use Faux Faux - Typically used as a Full Well Stream factor which is used to adjust the computed gas volume downward to account for the portion of the measured fluid stream that is liquid. The user enters a value which will be used as a direct multiplier when calculating C'. For example, a value of 0.9 would result in a volume reduction of 10%. The percentage liquids in the stream is typically determined by a Full Well Stream Test. The Faux factor is entered under the Constants tab. Since Faux is a direct multiplier to the volume, it can be used for any correction to the volume not accounted for in the basic equation. NOTE: Although factors (Faux and Fw) are being used by some companies, they have not been adopted by any standards committee. Commands Reset Volume Select Yes from the drop-down menu, and click the Send button. The user will be asked to confirm the request. Answer Yes for the request to be carried out. A typical use for this command is just prior to an orifice plate change on a gas orifice meter. The device reacts, as follows, to a Reset Volume: Page rev. AA
321 Completes all computations for the present flow file daily record. Stores date/time and partial log period's volume into its historical record. Logs an event with the accumulator value before zeroing the accumulator. Zeroes the total volume accumulator. Begins a new flow file daily record. Reset Log Period Set site code Select Yes from the drop-down menu, and click the Send button. The user will be asked to confirm the request. Answer Yes for the request to be carried out. This is similar to a Reset Volume, except the volume accumulator is not zeroed. A typical use for this command is just prior to an orifice plate change on a gas orifice meter. The device reacts, as follows, to a Reset Log Period: Completes all computations for the present flow file daily record. Stores date/time and partial log period's volume into its historical record. Logs an event in the Event file. Begins a new flow file daily record. Enter up to seven numerical digits, and a decimal point is allowed anywhere among the digits. A site code entry enters an event in the event file using the site code number. This number can represent anything to the user as some function performed at the site. Log Capacity Maximum # Daily Records Maximum # Log Period Records Maximum # Event Records Enter the maximum number of Daily Records that the device will store. The default of 50 is recommended. Enter the maximum number of Log Period Records that the device will store. The default of 970 is recommended. 970 allows for 40 days of hourly records. One Log Period Record is used no matter what the Log Period time. Enter the maximum number of Event Records that the device will store. Each entry into the Event file is a record. Setup Device/APP ID Tube Description Contract Hour Vol Calc Period Enter up to ten alpha-numeric characters for the Device/APP ID. This identifies the specific application or flow calculation. A Station or device can have multiple flow calculations running simultaneously, and each of those will have their own Device/APP ID. Enter up to 24 alphanumeric characters for a description of the tube. This is helpful when there is more than one tube application running in a single device. Enter the contract hour in military time (0-23). The contract hour is the start of the day for daily volumes. Select the volume calculation period from the drop-down list. Options are 1, 2, 5, 10, 20, 30 and 60 seconds/minutes. This is the rate at which the volume is calculated based on one second averages of SP, DP and Temperature. Unless otherwise required, the default of 60 minutes is recommended. This period can be the same as but should never be greater than the log period. If not the same, the log period should always be an even multiple of the volume calculation period rev. AA Page 321
322 Log Period Fpv Method Vol. Unit - Flow Rate SP/DP Averaging Hold Time Out (Seconds) Select the log period from the drop-down list. Options are 1, 2, 5, 10, 20, 30 and 60 minutes. This is the rate at which the calculated volumes are logged to the historical file. Unless otherwise required, the default of 60 minutes is recommended. This period can be the same as but should never be less than the volume calculation period. If not the same, it should always be an even multiple of the volume calculation period. This option is only valid in devices supporting the new database (DB2) and when in the Extended Characteristic mode. A default period of one hour is used at all other times. Select the compressibility (Fpv) method from the drop-down list. Available Fpv methods are: NX19 fixed FtFp - Uses NX19 Gravity, Carbon Dioxide and Nitrogen method but user must manually calculate and enter Ft and Fp. NX19 GCN - Uses NX19 Gravity, Carbon Dioxide and Nitrogen method. NX19 GCNM - Uses NX19 Gravity, Carbon Dioxide, Nitrogen and Methane method. NX19 GCN or GCNM - This method automatically switches to GCNM method if Gravity exceeds.75 and/or Carbon Dioxide or Nitrogen exceeds 15%. AGA8 Gross 92 - This is the default method when selecting the AGA equation. This is one of the newer and recommended Fpv methods, assuming only Specific Gravity, Carbon Dioxide and Nitrogen are used. AGA8 Detail 92 - This method supports total analysis. SGERG88 - This method adheres to the international standard ISO For this method to be viable, one of the following base conditions must exist: 0 C / 32 F and bar / psi 15 C / 59 F and bar / psi C / 60 F and bar / psi C / 60 F and bar / psi For detailed information on these methods, see the American Gas Association, Report No. 8 / American Petroleum Institute Chapter 14.2 and/or ISO Standards and Select the volume unit and associated flow rate unit from the list. The first unit is the volume and the second is the flow rate unit. Selections are paired as shown: MCF - SCF/Hr MCF - MCF/Day MMCF - MCF/Hr MMCF - MMCF/Day Select Linear or Square Root averaging from the drop-down list. The following explanation applies to the Differential Pressure, Static Pressure and Temperature. Linear - Sums the samples and divides by the number of samples. Square Root - Sum of the square root of the samples divided by the number of samples and squared. Sets a time duration (in seconds) that informs the device how long to remain in Hold when the user is in Calibration mode. The default is set to 3600 (1 hr.). This is primarily protection against getting side-tracked and forgetting to take the unit Page rev. AA
323 out of Hold. This pertains to any tube that is put in Hold while in Calibration mode. Current Values Static Pressure Displays the current Static Pressure value (PSIA) Differential Pressure Displays the current Differential Pressure value (InH2O) Temperature Displays the current Temperature value (Degrees F.) Flow Rate Displays the current Flow Rate for this particular log record (MCF/day). Energy Flow Rate Displays the current Energy Flow Rate value (MBTU/Hr) This value is updated at the end of each Volume Calculation Period. The Volume Calculation Period represents the rate at which the volume is calculated based on one second averages of the static pressure, differential pressure and temperature. At the end of this period, the average value of the Today's Volume extension (portion of the flow rate equation that is integrated each second) is multiplied by other factors in the AGA-3 equation to arrive at the flow rate for the Volume Calculation Period. The flow rate is then multiplied by the Volume Calculation Period. Every Volume Calculation Period volume is added to the current volume for the duration of the Contract Day. Today's Energy At the end of each Volume Calculation Period, Energy is calculated using the equation: Energy = Indicated Volume x Heating Value Each Volume Calculation Period Energy is added to the current Energy for the duration of the Contract Day. Yesterday's Volume Yesterday's Energy Accumulated Volume Last Calculated Period Volume This is the prior Contract Day's volume. The Contract Day is defined as a 24- hour period that establishes the parameters for a complete day. Prior Contract Day s energy. Updated at the end of each Volume Calculation Period. At the end of the Volume Calculation Period, the average value of the Extension is multiplied by the Integral Multiplier resulting in the flow rate for the Volume Calculation Period. The flow rate is then multiplied by the Volume Calculation Period. Each Volume Calculation Period volume is then added to the accumulated volume until zeroed by a Reset Volume command or an accumulator rollover happens. Volume for the last Volume Calculation Period. Limits Sp High Limit Sp Low Limit Dp High Limit Dp Low Limit RTD High Limit This represents the higher limit of the static pressure value that can be sent to the tube application. This represents the lower limit of the static pressure value that can be sent to the tube application. This represents the higher limit of the differential pressure value that can be sent to the tube application. This represents the lower limit of the differential pressure value that can be sent to the tube application. This represents the higher limit of the total flowing temperature value that can be sent to the tube application rev. AA Page 323
324 RTD Low Limit Flow Rate High Limit Flow Rate Low Limit This represents the lower limit of the total flowing temperature value that can be sent to the tube application. This represents the higher limit of the flow rate value that can be sent to the tube application. This represents the lower limit of the flow rate value that can be sent to the tube application. Adv Setup Adv Setup Static Pressure Diff Pressure Temperature Static Pressure Type Use Fixed Static Fixed Static RTD Installed Use Fixed Temperature Fixed Temperature Displays and/or allows entry of the Static Pressure register used in flow calculations. Displays and/or allows entry of the Differential Pressure register for AGA-3 or Pulse Input register for AGA-7 used in flow calculations. Displays and/or allows entry of the Flow Temperature register used in flow calculations. Select whether the static pressure is coming from a Gauge or Absolute pressure device. Select Yes to use the Fixed Static pressure instead of a measured pressure. Used for AGA-7 tubes when static pressure is not available. Enter a value to be used when the Use Fixed Static is set to Yes. Select Yes if you are using an RTD for flowing temperature. Select Yes to use the Fixed Temperature instead of a measured temperature. Enter a value to be used when the Use Fixed Temperature is set to Yes. The Fixed Temperature will also be used in case of an RTD error if setup on the Fixed Values On Errors tab. No Flow Digital Input DI Action Flow State Enter the digital input register address (format 0.0.0). This can be either one of the two on-board digital inputs or a digital input from one of the optional external modules. Select whether an Open Contact or a Closed Contact constitutes a No Flow condition. Displays the Flow State as Flow or No Flow based on the Digital Input specified above and the DI Action selected. Speed of Sound Speed of Sound Calculation Speed of Sound Select either Disabled or Enabled Displayed in meters/second Digital Output Digital Output 1 Page rev. AA
325 Digital Output Volume Setpoint Trip on Volume Setpoint Trip on DP Low Trip on DP High Trip on SP Low Trip on SP High Trip on TF Low Trip on TF High Trip on Fr Low Trip on Fr High Trip on Charger Low Trip on Digital Input Digital Input DO Action Auto Reset Auto Reset Delay (Sec) Current State Manual Operation Specify the output register for Digital Output 1 or Digital Output 2 depending on the tab selected. Enter the Volume Setpoint in MCF for tripping of the digital output by the Volume Setpoint command. If set to Yes, the digital output will be tripped each time the Volume Setpoint is reached. If set to Yes, the digital output will be tripped on the DP Low alarm. Alarm limits are set in the Limits tab. If set to Yes, the digital output will be tripped on the DP High alarm. Alarm limits are set in the Limits tab. If set to Yes, the digital output will be tripped on the SP Low alarm. Alarm limits are set in the Limits tab. If set to Yes, the digital output will be tripped on the SP High alarm. Alarm limits are set in the Limits tab. If set to Yes, the digital output will be tripped on the Flowing Temperature Low alarm. Alarm limits are set in the Limits tab. If set to Yes, the digital output will be tripped on the Flowing Temperature High alarm. Alarm limits are set in the Limits tab. If set to Yes, the digital output will be tripped on the Flow Rate Low alarm. Alarm limits are set in the Limits tab. If set to Yes, the digital output will be tripped on the Flow Rate High alarm. Alarm limits are set in the Limits tab. If set to Yes, the digital output will be tripped on the Low Charger alarm. The Low Charger alarm happens automatically if the charging source is removed or cannot maintain an adequate battery voltage. If set to Yes, the digital output will be tripped if the Digital Input specified below is set to a 1 (senses a closed contact). Specify a digital input register (format 0.0.0) for the Trip on Digital Input option. Select whether the digital output is to act as a Normally Open or Normally Closed contact. If set to Yes, the digital output will reset after the Auto Reset Delay time has elapsed. If set to No, Auxiliary Contact 1 will remain tripped until manually reset. Specify the amount of time in seconds Auxiliary Contact 1 will reset after being opened or closed by some action. Auto Reset must be set to Yes. Displays the current state of the digital output as Open or Closed. This function allows the user to manually operate the digital output. This might be done for testing purposes. If the DO Action parameter above is set to Normally Open, Trip will close the digital output, and Clear will open the digital output. If the DO Action parameter is set to Normally Closed, Trip will open the digital output and Clear will close it. Digital Output 2 (Same as Digital Output 1) Orifice Change rev. AA Page 325
326 The user can select the Orifice tab to change the Orifice Plate. The first option would be to ensure all read/write fields have the correct value selected. These fields are as follows: V-Cone Diameter Pipe Diameter Sp Tap Location Hold Time Out Enter the V-cone diameter size in dimensional units. Displays the pipe diameter size in dimensional units. Displays the location (upstream, downstream) of the Sp tap in relation to the V- Cone plate. Default to one hour but can be edited by the user. Once all the fields are showing the desired values, the user must first select the Hold button to set the timer at 60 minutes. The flow pressure is then held for that period of time to allow the user to change the orifice plate. The user then changes the orifice plate. Once finished, the user would select the Flowing button to resume flow. V-Cone V-Tube Type No. of Cd Table Entries Reynold's Number #1 Flow Coefficient #1 Reynold's Number #2 Flow Coefficient #2 Reynold's Number #3 Flow Coefficient #3 Reynold's Number #4 Flow Coefficient #4 Reynold's Number #5 Flow Coefficient #5 Reynold's Number #6 Flow Coefficient #6 Reynold's Number #7 Flow Coefficient #7 Reynold's Number #8 Enter tube type (Precision or Wafer Cone). Specify the number of pairs (Reynolds number and associated Cd numbers) entered when the Use Calc Cd is set to Yes (see Factors). Enter the Reynold's Number value of the first pair (Reynold's Number and Flow Coefficient). Enter the Flow Coefficient value of the first pair (Reynold's Number and Flow Coefficient). Enter the Reynold's Number value of the second pair (Reynold's Number and Flow Coefficient). Enter the Flow Coefficient value of the second pair (Reynold's Number and Flow Coefficient). Enter the Reynold's Number value of the third pair (Reynold's Number and Flow Coefficient). Enter the Flow Coefficient value of the third pair (Reynold's Number and Flow Coefficient). Enter the Reynold's Number value of the fourth pair (Reynold's Number and Flow Coefficient). Enter the Flow Coefficient value of the fourth pair (Reynold's Number and Flow Coefficient). Enter the Reynold's Number value of the fifth pair (Reynold's Number and Flow Coefficient). Enter the Flow Coefficient value of the fifth pair (Reynold's Number and Flow Coefficient). Enter the Reynold's Number value of the sixth pair (Reynold's Number and Flow Coefficient). Enter the Flow Coefficient value of the sixth pair (Reynold's Number and Flow Coefficient). Enter the Reynold's Number value of the seventh pair (Reynold's Number and Flow Coefficient). Enter the Flow Coefficient value of the seventh pair (Reynold's Number and Flow Coefficient). Enter the Reynold's Number value of the eighth pair (Reynold's Number and Flow Coefficient). Page rev. AA
327 Enter the Flow Coefficient value of the eighth pair (Reynold's Number and Flow Coefficient #8 Flow Coefficient). Enter the Reynold's Number value of the ninth pair (Reynold's Number and Reynold's Number #9 Flow Coefficient). Enter the Flow Coefficient value of the ninth pair (Reynold's Number and Flow Flow Coefficient #9 Coefficient). Enter the Reynold's Number value of the tenth pair (Reynold's Number and Reynold's Number #10 Flow Coefficient). Enter the Flow Coefficient value of the tenth pair (Reynold's Number and Flow Coefficient #10 Flow Coefficient). Enter the Reynold's Number value of the eleventh pair (Reynold's Number Reynold's Number #11 and Flow Coefficient). Enter the Flow Coefficient value of the eleventh pair (Reynold's Number and Flow Coefficient #11 Flow Coefficient). Enter the Reynold's Number value of the twelfth pair (Reynold's Number and Reynold's Number #12 Flow Coefficient). Enter the Flow Coefficient value of the twelfth pair (Reynold's Number and Flow Coefficient #12 Flow Coefficient). Enter the Reynold's Number value of the thirteenth pair (Reynold's Number Reynold's Number #13 and Flow Coefficient). Enter the Flow Coefficient value of the thirteenth pair (Reynold's Number and Flow Coefficient #13 Flow Coefficient). Enter the Reynold's Number value of the fourteenth first pair (Reynold's Reynold's Number #14 Number and Flow Coefficient). Enter the Flow Coefficient value of the fourteenth pair (Reynold's Number and Flow Coefficient #14 Flow Coefficient). Enter the Reynold's Number value of the fifteenth pair (Reynold's Number Reynold's Number #15 and Flow Coefficient). Enter the Flow Coefficient value of the fifteenth pair (Reynold's Number and Flow Coefficient #15 Flow Coefficient). Enter the Reynold's Number value of the sixteenth pair (Reynold's Number Reynold's Number #16 and Flow Coefficient). Enter the Flow Coefficient value of the sixteenth pair (Reynold's Number and Flow Coefficient #16 Flow Coefficient). Calibration Report Overview Under the Calibration tab the user can run calibration and then generate a report from the same screen. Many of the fields are auto-populated during calibration and the user can add the results of a physical examination if required by tube type. Displayed here is an example of a Calibration report with much of the data already included rev. AA Page 327

328 The following are the sections of the Calibration Report: Section 1: Meter - Information provided by the user identifying the individual meter Section 2: Setup - Input provided by the user impacting the calibration data generated Section 3: Calibration Data - the data generated by PCCU as a result of running the calibration Page rev. AA

329 XMV Interface Overview The XMV Interface is an application for accessing an external multiple variable device that provides SP, DP and Temperature data. Communication Some of the parameters on this tab have options that can be selected and some where values can be entered. Where possible, default values are provided and recommended, but some installations may require different settings. Some parameters are fixed and for display purposes only. Parameters displayed may vary depending on the View level displayed. To set up communication for XMV Interface, please access PCCU first. Setup Setup Device/APP ID The user can assign a name to the Device/APP ID or leave it at the default of XMV Interface. This is not like the typical Device/APP ID but rather a name that gets displayed in the tree-view of Entry mode for the user s reference rev. AA Page 329
330 Number of XMV Enter the number of XMV transmitters up to a maximum of 8. Totalflow determined that eight XMV devices was the maximum number allowed per port to reliably return values within a 1 second time frame. AGA standards require that custody transfer applications retrieve values once a second. This being the case, If the user requires more than eight devices, they will need to instantiate an additional XMV Interface application and assign it to a different communications port. XMV Setup Type Select the type of device to display from the XMV Setup screen. Communications Port Port Type Protocol Register Format Type in the serial port that will be used to communicate with the XMVs. The port entered will be determined by the Port Type entered as shown below. Port Type = OnBoard Serial - Enter COM1:, COM2: or COM3: if XRC. Port Type = TFIO Serial - Enter CIM0:, CIM1:, etc. when using a TFIO communication's module. CIM number is based on the module's switch setting. Port Type = TCP/IP - Currently XMVs do not support TCP/IP. The Port Type displays from the following list as shown below: OnBoard Serial - Select if using one of the serial communication ports located physically on the device's main electronic's board. TFIO Serial - Select when using a TFIO communications module referred to as a Communications Interface Module (CIM). These will be mounted on a rail external to the main electronics board. TCP/IP - Select if using the Ethernet port. (XMVs currently do not support Ethernet). Communication with XMVs is via Modbus Host (RTU) protocol. Select the appropriate format from the drop-down list. At the time of this writing, four XMVs were supported (ABB's 266CS, 267CS, Foxboro Invensys IMV25 and Rosemount 3095FB). If communicating with only ABB XMVs, use the default 32 Bit format. If communicating with Foxboro IMV25s, you must select 16 Bit Word Swapped or if you have a mixture that includes the Foxboro, you must select 16 Bit Word Swapped. Also, when using Foxboro units or a mixture that includes Foxboro units, set the Modbus Register to 401 on each XMV Setup tab; as opposed to 21 for the 32 Bit format with the exception of the Rosemount 3095FB which uses 7401 for 32 Bit Bit Totalflow - 32 bit values are transferred as a single 32 bit register. Register list entries are biased one greater than standard Modbus (7002 = 7001 Standard) Bit - 32 bit values are transferred as a single 32 bit register. Page rev. AA
331 8. 16 Bit Modicon - 32 Bit values are transferred as two consecutive 16 bit registers Bit Word Swapped - 32 Bit values are transferred as two consecutive 16 bit registers and swaps the order of the registers Bit ROS Modulo Multiplies the floating point number by 1000 and then divides by The integer portion (before the decimal point) goes into the first 16 bit register and the fractional portion (after the decimal point) goes in the second 16 bit register. Modbus and Modicon are registered trademarks of Schneider Automation, Inc. Foxboro is a registered trademark of the Foxboro Company. Rosemount is a registered trademark of Rosemount Inc. Interface Baud Rate Data Bits Parity Stop Bits Response Delay (milliseconds) Xmit Key Delay (milliseconds) Unkey Delay (milliseconds) Timeout (milliseconds) Set to RS-485 for the XMV Interface. Available selections are: RS Select if the port is connected to a radio or an RS-232 device. RS Select if communicating via RS-485. RS Select if communicating via RS-422. Modem - Select if communicating via modem. Although the range displayed allows Baud Rates up to , the applicable range for XMVs is1200 to The default Baud Rate of 9600 is required for the XMV devices to be polled and data retrieved within the 1 second requirement, especially if there is the full complement of 8 XMVs. The ABB 267/269CS and Rosemount 3095FB are limited to 9600 baud. The ABB 266CS and the Invensys IMV25 are capable of baud. The baud rates for all XMVs must be set the same and match the baud rate set here. Eight (8) data bits for XMV communication. No parity for XMV communication. One (1) Stop Bit for XMV communication. Response Delay is a delay that is on the front end of communications between devices. It can be used by the device initiating a request and/or by the device responding to the request. Either way, it delays the start of communication to another device. Set to zero for no delay or enter a delay value in milliseconds. In the case of polling multiple XMVs, there may need to be a short delay to allow one XMV to respond before polling another XMV. Typically, 10 milliseconds works well when polling multiple XMVs at 9600 baud. Originally used when communicating via radio but can affect any communications equipment; this is a delay time to allow a radio or communication s interface to stabilize after being turned on before data is transmitted. Typically 5 or 10 milliseconds works well for XMVs. Originally used when communicating via radio but can affect any communications equipment; this is a delay time to keep the radio or communication s interface turned on after the last data bit is transmitted. Typically 5 milliseconds works well for XMVs. This value should never be more than the Response Delay on the individual XMV Setup screens. This can be the maximum time tolerated between a request and response from the XMV or the largest gap tolerated between characters within a packet. If this time expires, any partial packet is discarded and the protocol looks for the beginning of a new packet. Typically 100 milliseconds works well for XMVs when rev. AA Page 331
332 using on-board communication ports, but for TFIO communication modules, 150 milliseconds is recommended. Switched V-Batt Operate This parameter selects the mode for how Switched V-Batt, Operate functions. Most devices have a V-Batt and Operate signal with the exception of the XFC6200EX which has Com1sw for Comm Port 1 and Com2sw for Comm Port 2. These are FET outputs which are either open or switched to ground. V-Batt and Operate are switched voltage outputs with the exception that Operate has an on-board 500 ohm current limiting resister in series with it. Enable - Allows the outputs to switch on and off with the Listen Cycle time and be controlled by the communication schedule. Disable - Disables the outputs but does not prohibit the other port from controlling the outputs. Always ON - Causes the outputs to be on all the time. Retries Trailing Pad Alternate Port Comm Directory Always OFF - Causes the outputs to be off all the time. When initiating requests, specify the number of times to retry if the initial request fails. Allow for at least one retry. Trailing Pad allows the user to add zeroes to the end of a transmission sequence to make sure the transmission is completed before the remote device tries to respond. This is more for devices that have a quick turnaround time. This can be used in place of having an Unkey Delay. Select 2 bytes, 3 bytes or 4 bytes from the drop-down list. (Not recommended for communications with XMVs.) The Alternate Port feature can be used to communicate with different devices on the same communication port (i.e., COM1, CIM0, etc.). The Coriolis, XMV and Therms Master are the only applications that support the Alternate Port feature. For example, if the XMV application has been instantiated and is using CIM0 for the communication path, the Therms Master and Coriolis applications can share that physical port. To add the Coriolis or Therms Master application to the CIM0 port, the Port sets to None and the Alternate Port parameter to CIM0. When using the Alternate Port, all the devices MUST communicate using the same protocol (i.e., same protocol, same baud rate, same stop and start bits, same delays and timeouts). NOTE: The main issue in using the Alternate Port feature is that the various devices MUST communicate using the same protocol. Displays a directory/path in the device for Request Block files. Typically, this would be under the directory associated with the communication port being used. The default directory is created based on the Protocol selected on this Setup tab. Statistics Number of Polls Number of Errors Number of Late Completions Displays the number of times the device tried to poll the XMVs. Displays the number of times the device tried to poll the XMVs but was not successful. If the user sees excessive errors, try increasing the time the parameters mentioned above. This will be a trial and error method changing one parameter at a time while monitoring this error count. Displays the number of times the communication polls failed to retrieve data from all the XMVs within one second. The XMVs are polled once a second, and data must be retrieved within the second. If the user is seeing multiple Page rev. AA
333 Previous Poll Loop Time Minimum Poll Loop Time Maximum Poll Loop Time Number of Interrupts Number of Characters Received Number of Characters Transmitted late completions, try reducing the time slightly on one of the parameters mentioned above. If the Number of Errors start to increase after changing a parameter, increase it until the Number of Errors stop. If Late Completions are still happening, try reducing one of the other parameters using the same scenario. Displays the last poll loop time. If multiple devices, displays the time to poll all devices. Keeps the minimum poll loop time of all polls. Keeps the maximum poll loop time of all polls. Displays the total number of transmit/receive interrupts. Displays a running total of received bytes from the devices. Displays a running total of transmitted bytes to the devices. Displays a running total of the number of Parity Errors. Parity errors means Number of Parity Errors the data with parity error was corrupted. Number of Framing Errors Number of Overrun Errors Thread Priority 1st Priority Displays a running total of the number of Framing errors. A framing error occurs when a byte of data is received, but it is not in the format expected. Make sure the communications parameters are the same for the flow computer and the device. Displays a running total of Overrun errors. Overrun errors typically means the flow computer did not or could not handle the amount of traffic coming in. Displays the priority of the protocol task. Displays the priority of the interrupt service thread. Packet Log The Packet Log tab is included for troubleshooting purposes only. The information provided has only to do with Totalflow Remote protocol or Modbus protocol. Other than the number of errors and polls that are displayed at the bottom of the screen, the user would need a Totalflow Remote protocol and/or a Modbus document to understand the information that gets displayed. You might however be asked by a customer service representative for information provided on this screen. The information displayed on the screen is provided from a file maintained in the device. You can specify the number of records that are kept in the file by selecting one of the values for the Log Size and only the newest records are kept. To receive any updated information after initially viewing the screen, you will be required to either click the Re-read button or check the Monitor button. The information displayed will only change if additional polls have occurred since the last time the information was read. XMV Devices Overview The external multivariable transmitter (XMV) provides Differential Pressure, Static Pressure and Temperature values via Modbus protocol to the host device. The XMV transmitter data is typically assigned to existing measurement tube applications. A Modbus Request Block is set up for each XMV transmitter that exists. The Request Blocks are files generated by the Modbus Host Request Block Editor which are then downloaded to the Modbus rev. AA Page 333
334 directory under the Com port being used. The Com port has to be set to Modbus Host (RTU) protocol. The Request Block can run up to once per second to poll and retrieve data from its associated transmitter. Request Blocks can also be setup to write back items to display on the transmitter s display. When the XMV Interface application is turned on from the PCCU Entry Mode, default data locations for five XMV Transmitters are assigned. There are three locations for the Raw Values that are returned from the transmitters and three locations for Scaled Values. Scaled Values have gone through their respective calibrations which were previously configured in the PCCU Calibration Mode. XMV 1 Description No of Polls Select the name of the device from the pulldown menu. Displays the description or name for this particular XMV device. Displays the number of times the device tried to poll the XMVs. No of Errors Displays the number of times the device tried to poll the XMVs but was not successful. If the user sees excessive errors, try increasing the time the parameters mentioned above. This will be a trial and error method changing one parameter at a time while monitoring this error count. Setup Enter up to 24 alphanumeric characters as a description or name for this Description particular XMV device. Modbus Address Enter a unique Modbus address for each XMV device (typically 1-247). Starting register in the XMV for the data that is to be retrieved. This is 21 on ABB XMVs and 401 for Foxboro IMV25. If you have a mixture of ABB and Foxboro Modbus Register units, you must use register 401 and set the Register Format on the "XMV Interface/Communications/Setup" to 16 Bit Word Swapped. Scan Enables or disables scanning of the device. Specify whether the raw data coming back from the XMV is in Metric or English units. For ABB XMVs, the data is typically Metric units and is then scaled to Factory Units English units as shown on the Values tab. Foxboro units typically return data in English units. If the raw data is in English units, no scaling is required, and the English units are passed on. Differential Pressure Static Pressure This is meant as a display flag for which calibration method is being used (Field or Factory). However, the user has the option of selecting Field or Factory calibration data. The selection will default to Factory until the unit has been calibrated in the field. Field can be selected and Sent, but the display will flip back to Factory if no Field calibration has been done. After a Field calibration, Field will be displayed and used but either could then be selected. Factory would typically only be selected for troubleshooting purposes. This is meant as a display flag for which calibration method is being used (Field or Factory). The selection will default to Factory until the unit has been calibrated in the field. Field can be selected and Sent, but the display will flip back to Factory if no Field calibration has been done. After a Field calibration, Field will be displayed and used but either could then be selected. Factory would typically only be selected for troubleshooting purposes. Page rev. AA
335 Temperature Display Scroll Number of Custom Displays This is meant as a display flag for which calibration method is being used (Field, Factory or Bias). The selection will default to Factory until the unit has been calibrated in the field. If only a Bias was added, it displays Bias. If a full calibration was done, it will display Field. If a bias was added after the field calibration, Field will be displayed, but the bias will be added to the Field calibration. By default, Differential, Static and Temperature are written out to the XMV. If this parameter is enabled, the display will scroll through these three items. Disable will turn off the display. Specify the number of display items to potentially be displayed on the XMV s display. Each display item will need to be set up on the Displays tab. The Displays tab is not visible until a non-zero value is entered here and sent. Creating any custom displays will replace the three Differential, Static and Temperature default displays. To display them, the user will need to create a custom display for them as well. Values Status Raw Differential Pressure Raw Static Pressure Raw Temperature Scaled Differential Pressure Displays the status of the selected device. Displays differential pressure value direct from the transmitter and prior to calibration. Displays static pressure value direct from the transmitter and prior to calibration. Displays the temperature value direct from the transmitter and prior to calibration. Displays the calibrated differential pressure value. Scaled Static Pressure Scaled Temperature Displays the calibrated static pressure value. Displays the scaled temperature value after a Centigrade to Fahrenheit conversion (no calibration required. Range Check Range Check Enable Dp Range Ap Range Tf Range Must be set to Enable in order to perform the Range Check procedure from the XMV. Enter the differential pressure range values to establish the range limit checked against incoming readings. Enter the absolute static pressure range values to establish the range limit checked against incoming readings. Enter the temperature range values to establish the range limit checked against incoming readings rev. AA Page 335
336 Write Lock Configuration Modbus Write Lock The Write Lock Configuration tab enables the user to disable the keys on the XMV for configuration only so that configuration data is not reconfigured due to an interruption. Within this tab, the user can elect to have these keys turned on or off. If Write Lock On is selected, the XMV prohibits writing to the configuration registers. The normal read polling continues as normal, but Modbus set polls to the XMV will be ignored, and configuration changes using the buttons will be disallowed. If the user sets the Write Lock Off parameter, configuration changes are allowed. Additionally, there are two status messages. The Write Lock Status Unknown statement will display when the XMV Write Lock status is polled, and the returned state does not agree with the state that the XSeries device is currently set to. In this way, the user can establish that there is a synchronicity issue. The user can set the Write Lock to the desired state, and click Send. If the XMV accepts the change, when the user re-reads the file, the XMV Write Lock state and the XSeries Write Lock state will agree. The Write Lock Comm Error message will display if there is an issue with the communication port connections and/or setup. NOTE: In the XMV Setup, if the Scan is set to Disabled, the Modbus polls to the XMV Write Lock are disabled. As such, to use this function, the user will need to have this parameter (Scan) set to enable to use this feature. Also, the Write Lock mode stays on after a power down/ power up situation. I/O Sub-System Overview This is the application which handles the scanning of all I/O. There will typically only be one instance of I/O Subsystem running and must not be turned off. Page rev. AA
 on the XFC one on the microflo EX with onboard terminals that can be used for any purpose.")
337 XFC I/O Analog Inputs Analog inputs for the XFC and microflo include data for fixed assignments such as differential pressure, static pressure and temperature. Additionally, there are two general purpose analog inputs (AI 1 & AI 2) on the XFC one on the microflo EX with onboard terminals that can be used for any purpose. The XRC has five general purpose analog inputs (AI 1 - AI 5) with on-board terminals that can be used for anything. Description Value Calibration Bias Displays the name of the AI. Fixed inputs on an XFC will be DP, SP and RTD. The two AIs that have onboard terminals and available for use are AI 1 & AI 2. The XRC will have AI 1 - AI 5. Displays the value as read by the input in engineering units based on the range the AI was calibrated. This column can display Factory, Field or Bias. The default will be Factory until a calibration is done in the field. After a field calibration, Field will be displayed and the field calibration data used unless Factory is selected and Sent. Both sets of calibration data are available for use, based on the one selected. A field calibration can be as simple as entering values for Engr Low and Engr High or a full range calibration in the Calibration mode. Bias is simply for display purposes and indicates a bias was entered for the AI in Calibration mode, since a bias cannot be entered here. If Bias is displayed, it also indicates that the AI is using a field calibration. The Bias column will display a value if a bias value was entered in the Calibrate mode. The bias value will only be displayed if Field or Bias is displayed in the Calibration rev. AA Page 337
338 Engr Low and Engr High Overrange column. A bias is not allowed for the factory calibration, thus no bias will be displayed if Factory is selected. Analog inputs such as AI 1 and AI 2 on the XFC, AI 1 on the microflo EX or AI 1 - AI 5 on the XRC are fairly accurate (+/- 2%) as they come from the factory. If the user has an application where this accuracy is sufficient, a value can be entered representing engineering units for Engr Low and Engr High and Sent creating a field calibration of this range. This is in lieu of having to provide a calibration signal and doing a full calibration in the Calibration mode. Any values over the range of the calibration will display. Digital Inputs Digital Inputs Pulse Inputs Debounce The two digital inputs on the XFC and one input on the microflo EX can be used as digital inputs for an open/close condition or as a pulse input for pulses counted over a period of time. The XRC has four digital inputs. The first two inputs (DI1 & DI2) on a G3 XRC can also be either digital inputs or pulse inputs, but the second two (DI3 & DI4) are digital inputs only. On the G4 XRC, all four digital inputs can be used as either digital inputs or pulse inputs. DI1 and DI2 on the XFC and DI1 thru DI4 on the XRC display the status as either Open or Closed when used as digital inputs. Closed means the input sees a low impedance to ground such as a closed contact as opposed to an Open, which is a high impedance to ground or an open contact. When the DIs are used as pulse inputs, there are three different register sets: Current, Previous and Total. The Current count register contains the current counts since the last time the register was read. When read, the Current count register value moves to the Previous count register and gets added to the Total count register. The Current count register is zeroed and begins counting pulses again. The Previous count register always contains the Current count register s last value. The Total count register will continue to add pulses until its capacity is reached, at which time the count will roll-over and start again. When connected to an XFC, a Debounce tab is displayed. This allows the user to turn Debounce on or off. Turning Debounce on connects a capacitor across the input circuitry, which reduces the chance of false signals caused by contact chatter from the source. On XRCs, Debounce is controlled by on-board jumpers. Digital Outputs These outputs display the status of DOs on any device which has digital outputs. Closed would represent low impedance or a contact closure as opposed to Open which would be high impedance or an open contact. The DOs can be manually Opened or Closed. Auxiliary Analog and Digital Auxiliary I/O displays a combination of analog values and digital status conditions. Most are status conditions (read-only) except for the following: G4 XFC LCD power can be turned on or off. G3 XRC Page rev. AA
339 Aux Switched VBatt can be turned on or off. G4 XRC Switched VBatt 1 and Switched VBatt 2 can be turned on or off. Aux Power can be turned on or off. LCD Power can be turned on or off. G4 microflo EX Switched VBatt 1 and Switched VBatt 2 can be turned on or off. LCD Power can be turned on or off. Aux Switched VBatt on the G3 XRC and Aux Power as its called on the G4 XRC are in addition to the Switched VBatts assigned to the communications modules. On the G4 XRC, Switched VBatt 1 & 2 are assigned to communications modules 1 & 2 respectively. Aux Switched VBatt and Aux Power will turn off if the unit goes to Sleep and back on when woke up. It will also return to its last status after a Warm Start. The default condition after a Cold Start is off; however, if a Save/Restore has been done, it will come back up to its status prior to the Save/Restore operation. Switched VBatt 1 & 2 will turn off if the unit goes to Sleep and back to its original status when woke up. Statistics IIC Bus Usage Usage Description Displays the IIC Device or the TFIO Module. Displays as "Channel:Address Description" format. Example - "1:42 DIO Module" or "3:D0 IIC Device". Usage Value Bus Usage for the device or module is average of the percentage of time used by the device based on 1000 millisecond time frames. Reads Writes Errors Status Displays the total number of successful bytes read since the last cold start or Reset Statistics initiated by the user. Displays the total number of successful bytes written since the last cold start or Reset Statistics initiated by the user. Displays the total number of read/write errors since the last cold start or Reset Statistics initiated by the user. Displays the total number of read/write errors since the last cold start or Reset Statistics initiated by the user. There is a Reset Statistics button which can be selected to zero all statistical data and commence recording again. IIC Diagnostics There is a Reset Diagnostics button which can be selected to zero all diagnostic data and commence recording data again rev. AA Page 339
340 AMU Statistics Scans Started Scans Finished Total number of 1 second scans since last cold boot or when zeroed by user. Total number of 1 second scans that were complete since last cold boot or when zeroed by user. Typically this count is 1 behind the Scans Started. A/D Total number of bytes transferred (4 bytes/16 channels) since last cold boot or when Transfers zeroed by user. A/D Total number of A/D end of conversion interrupts since last cold boot or when zeroed Interrupts by user. Interrupt Total number of missed end of conversion interrupts since last cold boot or when Timeouts zeroed by user. A/D Start Failures Previous Scan Interval Minimum Scan Interval The difference between the number of Scans Started and Scans Finished since last cold boot or when zeroed by user. Time of last scan in milliseconds. Needs to be less than 1000 ms. (16 A/D channels scanned) Minimum measured scan interval in milliseconds since last cold boot or when zeroed by user. Needs to be less than 1000 ms. Maximum Maximum measured scan interval in milliseconds since last cold boot or when zeroed Scan by user. Needs to be less than 1000 ms. Interval TFIO Modules This screen displays the total number of TFIO modules and the number of each type connected to the device. The Module List displays the firmware part number/revision of each module. The pulldown menu is used to select any of the following modules: VC Modules The Valve Control module is a software-configurable, combination I/O module specifically tailored for valve control applications. The module incorporates six (6) general purpose DI/DO/PI input/outputs, two source mode digital outputs and one 4-20 ma sink/source mode analog output. AO Modules The Analog Output module is a configurable, 4-point 4-20 ma analog output module. Each point can be configured to either sink or source a 4-20 ma signal using either an internal or external power source. AI Modules The Analog Input module is a configurable, 8-point analog input module. Each point can be configured to be a 0-10V voltage input or a 0-20 ma current input. DI/DO Modules The Combo Digital module is configurable 8-point digital I/O module. Each point can be either a digital input, digital output or a pulse input. Page rev. AA
341 TI Modules Displays the number of both Thermocouple and RTD modules. RTD modules are a 4-point RTD designed to monitor standard 4-wire 100 ohm platinum RTD probes. The thermocouple module is a 4-point module which can be configured to be either J or K type. CI Modules The Communications Interface module is software configurable serial interface capable of communicating via RS-232, RS-422 or RS-485. Gas Lift Overview Gas Lift is an artificial lift technique that is used on wells with liquid loading programs. These problems consist of the gas-to-oil ratio (GOR) not being sufficient to sustain other forms of artificial lift. In its simplest form, gas lift adds externally introduced high pressure gas to the well bore to increase the velocity of the gas in the tubing. This then helps to carry the fluids to the surface. While many variations exist, this typically involves introducing high pressure gas into the tubing annulus. ABB's Gas Lift application is used in either Manual or Critical Rate mode. In Manual mode, the operator notifies the system on how much high gas pressure to add to the system to aid in the lift process. In Critical Rate mode, the system is placed into a more intelligent operating mode. Critical Rate mode monitors the current production rate and compares it to a calculated critical rate. Gas is injected at a user-specified percentage that reflects the difference between the current flow and the shortfall rate. Critical Rate mode is an ongoing calculation and only injects the necessary amount of gas to overcome the current loading situation. Gas Lift can also be combined with other forms of artificial lift, including Plunger Lift. This can help to augment the operation and overcome the challenges of low GOR wells rev. AA Page 341

342 Overview Injection Valve Position Inject (Injection Flow Rate) Target (Injection Setpoint) Displays the injection valve position as a percentage of open. Displays the injection flow rate in MCF/Day as measured by the injection tube application. The tube applications are specified on the Gas Lift Setup tab. Displays the setpoint sent to the Valve Control application. The Production Flow Rate represents the actual gross flow rate as measured by Production Rate the production tube application as specified on the Setup tab. Net Production (Net Displays the Production Flow Rate minus the Injection Flow Rate. Flow Rate) Displays the Hold Status as Hold or Run. The Pad Controller application can put Shutdown Status the status in Hold or the user can click in the Value 1 column and put the system in Hold or Run. Hold causes the injection valve to close. Gas Lift State This read-only field (Gas Lift State) monitors the state of the Gas Lift Assist and then displays that corresponding state. Possible states are as follows: Closed - Closed state indicates that the inject and main valve are closed. Open - Inject valve is closed after opening of the main valve. Arrival - Inject valve is open for Arrival Assist and the system is awaiting the arrival of the plunger. Cleanup - After the plunger has arrived, the Cleanup state signifies the time frame to continue injecting gas to retrieve any residual liquid. Page rev. AA
343 Afterflow - The Afterflow state indicates that the production valve is open, the injection valve is open for Afterflow assist, the plunger has arrived and close conditions are waiting to be met. Manual - The Manual state signifies that the Gas Lift application is in Manual mode. This means that the inputs are being read but no automatic outputs are being triggered. A setpoint for the injection rate would have to be entered and sent by the user. Critical - The Critical state signifies that the system is below the setpoint for the critical rate and the system is awaiting a Closed state. Wait - If Afterflow Assist is disabled, the plunger has arrived, injection valve is closed and the system is waiting for Close condition. Slow - The Slow state indicates that if the plunger is slow and has yet to arrive, the injection valve is open for Slow Arrival Assist.. Hold - Indicates the injection valve is held closed by the Pad Controller application or manually set by the user. Shutdown - Indicates that the Shutdown application has been initialized and holding the injection valve closed. Reset - The Reset state indicates that the device has gone through a warm or cold start and no other state has been activated. Cleanup Close - Cleanup phase has forced the plunger valve to close. Gas Lift Mode There are 6 different modes of operation of the Gas Lift application. Off - The Gas Lift application is not running. Manual - User sets the injection flow rate. Critical - The injection flow rate is automatically adjusted to keep the production flow rate above the critical rate. Plunger - The injection flow rate is automatically adjusted as needed during plunger cycles. Intermittent - Control the injection valve with a programmable On/Off cycle. Step Rate Test - Control the injection valve with a series of programmable on/off cycles. Display General Gas Lift Mode Tube Description This user-defined field has the following modes: OFF - Gas Lift not used Manual - Injection only. User sets the injection flow rate. Critical - Injection only. The flow rate is automatically adjusted to keep it above the critical rate. Plunger - Combination of Gas Lift and Plunger. The flow rate is automatically adjusted as needed during plunger cycles. Intermittent - Controls the injection valve with a programmable On/Off cycle. Step Rate Test - Controls the injection valve with a series of programmable on/off cycles. Displays the tube assigned to this application rev. AA Page 343
344 Today Prod Vol Today Inj Vol Prev Day Prod Vol Prev Day Inj Vol Displays the current day's production volume measured in millions of cubic feet. Displays the current day's injection volume measured in millions of cubic feet. Displays the previous day's production volume measured in millions of cubic feet. Displays the previous day's injection volume measured in millions of cubic feet. Plunger Info Precharge Arrival Assist Slow Arrival Assist Gas Lift Afterflow If enabled, this option injects gas into the casing beginning when the well is closed in and the user specified low pressure is present. Injection continues until the user specified high pressure is reached, at which time production flow commences. If enabled, the inject valve is opened when the main valve is opened, then the inject valve is closed after the plunger arrives plus any Cleanup time. If enabled, this option will open the injection valve to assist the plunger, if it is slow to arrive. If enabled, this option opens the injection valve when the production flow rate falls below the critical flow rate. Graph Poll Type View Select either Historical or Real Time. Select either Graph or Grid display mode. Expand/Collapse Select either button to expand or collapse the graph display. Variables The graph trends three variables: production flow rate, injection flow and critical flow rate. One can remove the display of any variable(s) by selecting its check marked box. Gas Lift The Gas Lift tab is the area where the user can view and also change certain parameter values within the Gas Lift itself. Main Gas Lift Enable Gas Lift State Enables the user to either enable (On) or disable (Off) the Gas Lift application. This read-only field monitors the state of the Gas Lift Assist and then displays that corresponding state. Possible states are as follows: Closed - Closed state indicates that the inject and main valves are closed. Open - Inject valve is closed after opening of the main valve. Arrival - Inject valve is open for Arrival Assist and the system is awaiting the arrival of the plunger. Page rev. AA
345 Cleanup - After the plunger has arrived, the Cleanup state signifies the time frame to continue injecting gas to retrieve any residual liquid. Afterflow - The Afterflow state indicates that the production valve is open, the injection valve is open for Afterflow assist, the plunger has arrived and close conditions are waiting to be met. Manual - The Manual state signifies that the Gas Lift application is in Manual mode. This means that the inputs are being read but no automatic outputs are being triggered. A setpoint for the injection rate would have to be entered and sent by the user. Critical - The Critical state signifies that the system is below the setpoint for the critical rate and the system is awaiting a Closed state. Wait - If Afterflow Assist is disabled, the plunger has arrived, injection valve is closed and the system is waiting for Close condition. Slow - The Slow state indicates that if the plunger is slow and has yet to arrive, the injection valve is open for Slow Arrival Assist.. Hold - Indicates the injection valve is held closed by the Pad Controller application or manually set by the user. Shutdown - Indicates that the Shutdown application has been initialized and holding the injection valve closed. Reset - The Reset state indicates that the device has gone through a warm or cold start and no other state has been activated. Cleanup Close - Cleanup phase has forced the plunger valve to close. Gas Lift Mode Critical Flow Rate Critical Multiplier Hold Status Current Date/Time Production Flow Rate Production Tube Description Inject Flow Rate Injection Setpoint There are 6 different modes of operation of the Gas Lift application. Off - The Gas Lift application is not running. Manual - User sets the injection flow rate. Critical - The injection flow rate is automatically adjusted to keep the production flow rate above the critical rate. Plunger - The injection flow rate is automatically adjusted as needed during plunger cycles. Intermittent - Control the injection valve with a programmable On/Off cycle. Step Rate Test - Control the injection valve with a series of programmable on/off cycles. Displays the Critical Flow Rate after the Critical Multiplier is applied. This multiplier can be modified as needed by the user to create the Critical Flow Rate (see above). Displays the Hold Status as Hold or Run. The Pad Controller application can put the status in Hold or the user can click in the Value 1 column and put the system in Hold or Run. Hold causes the injection valve to close. Displays the current date and time from the device. The Production Flow Rate represents the actual gross flow rate as measured by the production tube application. Description of the Production Tube that measures the gross flow rate. Value 1 column displays the injection flow rate as measured by the Injection Tube application. Value 2 displays the setpoint sent to the Valve Control application. Displays the Injection Setpoint sent to the Valve Control application rev. AA Page 345
346 Injection Tube Description Net Flow Rate Inject Valve Position Inject AP Inject Pressure Prod Line Pressure Casing Pressure Tubing Pressure Measures the Injection Flow Rate. Displays the Production Flow Rate minus the Injection Flow Rate. Displays the injection valve position as percent of open. Displays the Absolute Pressure as measured by the injection tube application. Displays the Absolute Pressure as measured by the injection tube application minus the Barometric Pressure. Displays the Absolute Pressure as measured by the production tube application minus the Barometric Pressure. Displays the current casing pressure. Displays the current tubing pressure. Setup Setup The Setup tab displays and enables the user to setup parameters required by the Gas Lift application. The parameters shown will vary somewhat based on the Gas Lift Mode selected. Gas Lift Mode Displays and/or allows the selection of the different modes of the Gas Lift application. The available selections are as follows: Off - Gas Lift not used. Manual - Injection only. User sets the injection flow rate. Critical - Injection only. The flow rate is automatically adjusted to keep it above the critical rate. Plunger - Combination of Gas Lift and Plunger. The flow rate is automatically adjusted as needed during plunger cycles. Intermittent - Open/Close the Injection valve with a series of settable On/Off cycles. Step Rate Test - Open and close the injection valve via a series of settable On/Off cycle times. Gas Lift Enable Allows the user to either enable (On) or disable (Off) the Gas Lift Application. Sets the number of items to display in the Event log. Any action that causes a Event Log Size state change is logged. Specify the production tube application by entering its application number Production Tube App here. To verify the number, click on the Station ID which is the very top item in the tree-view and click on the Applications tab. Specify the injection tube application by entering its application number here. Injection Tube App To verify the number, click on the Station ID which is the very top item in the tree-view and click on the Applications tab. Specify the Plunger application if used by entering its application number here. Plunger App To verify the number, click on the Station ID which is the very top item in the tree-view and click on the Applications tab. Injector Valve Control App Specify the Valve Control application that will be used to control the injection valve by entering its application number here. To verify the number, click on the Station ID which is the very top item in the tree-view and click on the Applications tab. Page rev. AA
347 Shutdown App Setpoint Time Limit Setpoint Timer Remaining Trend File Name Gas Lift State as String Specify the Shutdown System application if used by entering its application number here. To verify the number, click on the Station ID which is the very top item in the tree-view and click on the Applications tab. Set the frequency as to how often the flow rate setpoint is written to the injection valve control application. Displays the remaining time left. This field enables the user to set the trend file name which would be used in conjunction with the Trend System application. This is a user-entered field and is used for the PCCU Display application. Critical Flow General Gas Lift Mode Gas Lift State Displays and/or allows the selection of the different modes of the Gas Lift application. The available selections are as follows: Off - Gas Lift not used. Manual - Injection only. User sets the injection flow rate. Critical - Injection only. The flow rate is automatically adjusted to keep it above the critical rate. Plunger - Combination of Gas Lift and Plunger. The flow rate is automatically adjusted as needed during plunger cycles. Intermittent - Open/Close the Injection valve with a series of settable On/Off cycles. Step Rate Test - Open and close the injection valve via a series of settable On/Off cycle times. This read-only field monitors the state of the Gas Lift Assist and then displays that corresponding state. Possible states are as follows: Closed - Closed state indicates that the inject and main valve are closed. Open - Inject valve is closed after opening of the main valve. Arrival - Inject valve is open for Arrival Assist and the system is awaiting the arrival of the plunger. Cleanup - After the plunger has arrived, the Cleanup state signifies the time frame to continue injecting gas to retrieve any residual liquid. Afterflow - The Afterflow state indicates that the production valve is open, the injection valve is open for Afterflow assist, the plunger has arrived and close conditions are waiting to be met. Manual - The Manual state signifies that the Gas Lift application is in Manual mode. This means that the inputs are being read but no automatic outputs are being triggered. A setpoint for the injection rate would have to be entered and sent by the user. Critical - The Critical state signifies that the system is below the setpoint for the critical rate and the system is awaiting a Closed state. Wait - If Afterflow Assist is disabled, the plunger has arrived, injection valve is closed and the system is waiting for Close condition rev. AA Page 347
348 Slow - The Slow state indicates that if the plunger is slow and has yet to arrive, the injection valve is open for Slow Arrival Assist.. Hold - Indicates the injection valve is held closed by the Pad Controller application or manually set by the user. Shutdown - Indicates that the Shutdown application has been initialized and holding the injection valve closed. Reset - The Reset state indicates that the device has gone through a warm or cold start and no other state has been activated. Cleanup Close - Cleanup phase has forced the plunger valve to close. Critical Flow Rate Multiplied Critical Flow Rate Raw Displays the Critical Flow Rate Multiplied value. Displays the Critical Flow Rate before being multiplied by the Critical Flow Rate Multiplier. Constants Critical Flow Rate Gas Density Critical Flow Rate Water Density Critical Flow Rate - Gas Gravity Critical Flow Rate - Z at Ref Displays the Gas Density used for Critical Flow Rate calculations. Displays the Water Density used for Critical Flow Rate calculations. Displays the Gas Gravity used for Critical Flow Rate calculations. The Z factor is provided by the production application register source as specified on the Registers tab. STD Constants Critical Flow Rate - K1 Displays the Critical Flow Rate constant for the K1 resistance coefficient. Critical Flow Rate - K2 Displays the Critical Flow Rate constant for the K2 resistance coefficient. Critical Flow Rate - K3 Displays the Critical Flow Rate constant for the K3 resistance coefficient. Setup Plunger Type This information is provided by the Plunger application if enabled. If not, enables the user to select the plunger type. The available options are: Intermitter - This signifies that no plunger is being used. Plunger - This means that there is a physical plunger associated with the well. Page rev. AA
349 Turner Mode Critical Flow Rate Case-Line Limit Tubing Length Tubing ID This information is provided by the Plunger application if enabled. If not, the user can select if either tubing pressure, the difference between the casing and static pressure or the casing pressure alone is used to calculate the Turner flow rate. Casing minus the line pressure limit as entered by the user. The tubing length is provided by the Plunger application if applicable or can be entered by user if Plunger application not used. The tubing ID is provided by the Plunger application if applicable or can be entered by user if Plunger application not used. Inputs Casing Pressure Casing Pressure Register Tubing Pressure Tubing Pressure Register Displays the casing pressure from the source as specified by the register below. Specify the register (app, array, reg) which is the source of the casing pressure. Displays the tubing pressure from the source as specified by the register below. Specify the register (app, array, reg) which is the source of the tubing pressure. Volumes Volumes The Volumes tab is used for information only. The total current (Today Volumes) and previous day volumes are displayed into three columns. The columns are as follows: Production Tube Description This value represents the total amount, measured by tube. Injection Tube Description This value is the measure of gas injected into the well by tube. Yesterday's Production Volume This value represents the previous Production Volume. Yesterday's Injection Volume This value represents the previous Injection Volume. This value represents previous Production Volume minus the previous Yesterday's Net Volume Injection Volume. Today's Production Volume This value represents current Production Volume. Today's Injection Volume This value represents current Injection Volume. Today's Net Volume This value represents Production volume minus the Injection Volume rev. AA Page 349
350 Step Rate Test Step Rate Test Gas Lift Mode This parameter field represents a global on/off switch for all of the options within the Gas Lift application. The available selections are as follows: Off - Gas Lift not used. Manual - Injection only. User sets the injection flow rate. Critical - Injection only. The flow rate is automatically adjusted to keep it above the critical rate. Plunger - Combination of Gas Lift and Plunger. The flow rate is automatically adjusted as needed during plunger cycles. Intermittent - Control the injection valve with a programmable On/Off cycle. Step Rate Test - Control the injection valve with a series of programmable on/off cycles. Gas Lift State Displays the current state of the Gas Lift application. When running Intermittent Cycle or the Step Rate Test, Open and Closed is the only viable states and refers to the state of the injection valve which is controlled by the On and Off Times. Other than these two exceptions, the possible states are as follows: Closed - Closed state indicates that the inject and main valves are closed. Open - Inject valve is closed after opening of the main valve. Arrival - Inject valve is open for Arrival Assist and the system is awaiting the arrival of the plunger. Cleanup - After the plunger has arrived, the Cleanup state signifies the time frame to continue injecting gas to retrieve any residual liquid. Afterflow - The Afterflow state indicates that the production valve is open, the injection valve is open for Afterflow assist, the plunger has arrived and close conditions are waiting to be met. Manual - The Manual state signifies that the Gas Lift application is in Manual mode. This means that the inputs are being read but no automatic outputs are being triggered. A setpoint for the injection rate would have to entered and sent by the user. Critical - The Critical state signifies that the system is below the setpoint for the critical rate and the system is awaiting a Closed state. Wait - If Afterflow Assist is disabled, the plunger has arrived, injection valve is closed and the system is waiting for Close condition. Slow - The Slow state indicates that if the plunger is slow and has yet to arrive, the injection valve is open for Slow Arrival Assist.. Hold - Indicates the injection valve is held closed by the Pad Controller application. Shutdown - Indicates that the Shutdown application has been initialized and holding the injection valve closed. Reset - The Reset state indicates that the device has gone through a warm or cold start and no other state has been activated. Cleanup Close - Cleanup phase has forced the plunger valve to close. Enable Step Rate Select Run to start the test or Stop to stop the test. Test Page rev. AA
351 Number of Steps Step Timer Injection Setpoint Current Step # Injection Flow Rate End of Test Timestamp A Step Number row is provided for the number of steps specified for the Number Of Steps below. On Time, Inject Rate and Off Time are the only user inputs required for each step. The other parameters will update as new data is available and by clicking the Re-read button or checking the Monitor box. Displays the elapsed time for each of the On/Off steps. The timer will reset after each On Time and each Off Time for each step. Displays the injection setpoint during each of the steps. The setpoint will only be displayed for a step when the valve is open. The setpoint will match the Inject Rate for the current step. Displays the currently active step. The current step is also shown as Active in the Step # rows above. Displays the injection flow rate in MCF/Day as measured by the injection tube application. The tube applications are specified on the Gas Lift Setup tab. Displays the Date/Time stamp for when the test has concluded or will show the Date/Time if stopped prematurely. Specify from the drop-down list the mode for Gas Lift to enter after the test has End of Test Mode ended. End of Test Inject Flow Rate Displays the injection flow rate at the end of the End of Test mode. This will not be applicable to all modes. Number of Steps Enter the number of steps of On/Off and Inject rates that the test is to perform. Do this initially and click the Save button. This will cause a row to be displayed for the setup of each step. Registers The Registers tab is for specifying registers required by the Gas Lift application. Registers required are for the following applications. (The addresses should automatically fill based on application numbers entered on the Setup tab.) Production Tube App Injection Tube App Plunger App Injector Valve Control App Events The Events tab displays a log of the latest number of events as specified on the Setup tab. Any state change will create an event. Selectable Units Overview Selectable Units is a feature that allows the user to select the desired engineering units to use as a basis for calculations, local display and protocol output. The engineering unit selections include standard U.S. and Metric system units as well as additional selections depending on the application rev. AA Page 351
 will be displayed for selection in the Tube window and only applications that support Selectable Units will be shown.")
352 Selecting U.S. or Metric will involve a default unit for each different variable group but each group can be modified to the user's liking. Only applications that are turned on (instantiated) will be displayed for selection in the Tube window and only applications that support Selectable Units will be shown. After all settings are made, selecting the Send to Device button relays those changes to the device. A message will appear to remind the user that any historical data will be erased and changes may be required in the tube application setup. Pressure and Temperature calibrations should be required using the new units. The different groupings as shown below such as Differential, Volume, Pressure, etc. are referred to as Variable Groups. Each Variable Group has a set number of units that can be selected by clicking in the window of each group. For reference all the Variable Groups and their engineering units can be viewed in the Selectable Units table. Selectable Units Setup By pulling down the Operator menu and selecting SU Setup, the Selectable Units Setup screen displays. Tube From the Tube pulldown menu, the appropriate Selectable Units (SU) measurement tube can be selected. If choices will apply to all tubes, select the Apply configuration to all tubes box. Custom Setup Regardless of which group of engineering units are selected, the Units pulldown menu default option will change automatically to Custom to inform the user that changes have taken place within the tab and that something other than the default settings have been selected. Also, if the user needs to go into the Advanced setup screens to make changes, the affected variable group will display Advanced in its window. Page rev. AA
353 Advanced Setup In selected variable group menus such as Volume and Pressure, there is an Advanced option available with the other selectable options. When the Advanced option is selected, the variety of options can be changed individually or collectively. These tabs enable the user to fine tune the standard variables that are shown. Miscellaneous The individual Miscellaneous variable values can be changed by the user for any of the displayed groups. If desired, all of these values are also available collectively from the Miscellaneous Edit All option. Selectable Units Table The following table lists the Conversion Groups with their associated Variable Groups and associated engineering Units. Conversion functions made by the Units Conversion application are grouped according to the Conversion Groups listed below. Conversion Groups have a specific set of engineering units assigned to them. Variable Groups are then assigned to specific Conversion Groups and thus use the engineering units assigned to the Conversion Group. The Variable Groups that are grouped together are assigned to the Conversion Group to their left. The engineering units that are grouped together are all selections for each one of the Variable Groups to their left. Conversion Groups Dimensional Dimensional Pressure Variable Groups Units Unit Description AP Transducer Units DP Transducer Units Static Pressure Differential Pressure Barometric Pressure Temperature Temperature Expansion Expansion Millimeters Inches Feet Meters kpa InH2O mbar InHg psia bar mmhg psfa MPa Pa Kg/cm2 Deg C Deg F Deg R Deg K mm/mm-c in/in-f ft/ft-f m/m-c millimeters inches feet meters kilopascals inches of water millibars inches of mercury pounds per square inch absolute bars millimeters of mercury pounds per square feet absolute megapascals Pascals Kilograms per centimeter squared degrees Celsius degrees Fahrenheit degrees Rankin degrees Kelvin millimeters per millimeter deg C inches per inches deg F feet per foot deg F rev. AA Page 353
354 mm-mmk m/m-k meters per meter deg C millimeters per millimeter deg K meters per meter deg K Viscosity Viscosity cp lbm/ft-s Pa-s lbf-s/in2 lbf-s/ft2 kgf-s/m2 dyn-s/cm2 Pa centipoise pound mass per foot second pascal seconds pound force seconds per square inch pound force seconds per square foot kilogram force seconds per square meter dyne force seconds per square centimeter pascals Density Density Water Density kg/m3 lbmft3 lb/us Gallon lb/uk Gallon kg/sdm3 g/cm3 g/m3 kg/kl lbm/mmscf kg/mm3 kilograms per cubic meter pound mass per cubic ft pounds per US gallon pounds per UK gallon kilograms per standard cubic decimeter grams per cubic centimeter grams per cubic meter Kilograms per kiloliter pound mass per million standard cubic feet Kilograms per million cubic meters HVVolume HVVolume MJ/m3 Btu/SCF Btu/MCF Btu/MMCF J/m3 kj/m3 thrm/us Gallon thrm/uk Gallon thrm/cngal Btu/USgal Btu/UKgal Btu/Canadian Gal kcal/m3 ftb/us Gallon kcal/cm3 megajoules per cubic meter Btu per standard cubic feet Btu per thousand cubic feet Btu per million cubic feet joules per cubic meter kilojoules per cubic meter therms per US gallon therms per UK gallon therms per Canadian gallon Btu per US gallon Btu per UK gallon Btu per Canadian gallon kilocalories per cubic meter foot pounds per US Page rev. AA
355 gallon kilocalories per cubic centimeter HVMass HVMass MJ/kg Btu/lbm kj/kg cal/g cal/lbm megajoules per kilogram Btu per pound mass kilojoules per kilogram calories per gram calories per pound mass Mass Base Mass Log Mass Total Mass Base Mass Flow Rate Mass Flow Rate kg lbm kilograms pound mass Volume Base Volume Log Volume Total Volume Base Volume Flow Rate Volume Flow Rate Sm3 SCF bbl Canadian Gallon UK Gallon US Gallon Scm3 SkL standard cubic base conditions standard cubic feet barrels Canadian gallons UK gallons US gallons standard cubic base conditions standard base conditions AVolume Actual Base Volume Actual Log Volume Actual Total Volume Actual Base Volume Flow Rate Actual Volume Flow Rate m3 ACF Abbl ACanadian Gallon AUK Gallon AUS Gallon AkL actual cubic meters actual cubic feet actual barrels actual Canadian gallons actual UK gallons actual US gallons actual kiloliters Energy Base Energy Log Energy Total Energy Base Energy Flow Rate Energy Flow Rate MJ Btu MBtu MMBtu J kj GJ quad therm KW-hour ch-hour CV-hour hp-hour Chu kcal cal ft-lbf ft-pdl erg megajoules Btu thousand Btu million Btu joules kilojoules gigajoules quad therms kilowatt hours ch hours CV hours horse power hours Chu kilocalories calories foot pound force foot poundal erg rev. AA Page 355
356 Mcal Gcal megacalories gigacalories Percent Percent Percent percent Mole Percent Mole Percent Mole Percent mole percent Date/Time Date/Time mdy hms dmy hms ymd hms month/day/year hour:minutes:seconds day/month/year hour:minutes:seconds year/month/day hour:minutes:seconds Time Elapsed Time Seconds Minutes Hours Days Milliseconds Microseconds Seconds Minutes Hours Days One thousandth of a second One millionth of a second Battery Voltage volts microvolts millivolts volts one millionth of a volt one thousandth of a volt Current Current Amps milliamps microamps amps one thousandth of an amp one millionth of an amp Decibel Decibel db decibels Velocity Velocity m in ft miles cm mm meters inches feet miles centimeters millimeters Tree View Overview This Tree View hierarchy is accessed by selecting the Tree View icon from the top of the page. This icon is available on every screen from the same location to facilitate navigation. It also has a toggle function which displays the Tree View or hides it depending on the situation. The initial display will show the following choices: Facility System Apps Communication Apps Unassociated Apps Page rev. AA
, Communication Apps (e.g., Totalflow/TCP) and Unassociated Apps (e.")
357 The Tree View allows the user to view all applications associated with the Facility organization from the Facility to the Sub-Facility to the Station. Also all applications not associated with the Facility hierarchy are available for access to include the following application groups: System Apps (e.g., Trend System), Communication Apps (e.g., Totalflow/TCP) and Unassociated Apps (e.g., AGA-3). The triangular orange icon before any option in the Tree View will point to the right when there are options not displayed. Selecting the triangular orange icon will display those options and the icon will then point down. Selecting any of these hidden options will take the user to the appropriate Facility hierarchy screen. If there is no icon before an option, that option is an application. Selecting it will take the user to its associated application screen. Selecting the triangular icon again will reverse the previous action, (display the open items if they are hidden or hide them if displayed) leaving the icon to point appropriately. Facility If the Facility option were open and the SubFacility 1 and SubFacility 2 closed in Tree View, the following applications (15) are listed as organic to the Facility proper: AGA3-1 SUAGA7-1 PID Control Valve Control Shutdown LevelMaster Therms Master Therms Slave Coriolis Interface Pulse Accumulator Plunger Plunger SU Trends Events Data Points rev. AA Page 357

358 Unassociated Apps With the Unassociated Apps open, the following applications (8) display: XMV Interface SUCOR-1 SUAGA3-1 SUAGA7-1 VCONE-1 AGA7-3 SUVCONE-1 PlungerSU-2 On the Facility Dashboard screen, under the Unassociated tab, the same applications are listed. From this screen are two ways to access the Unassociated Apps: (1) from Tree View or (2) from the Unassociated Apps tab on the Facility Dashboard screen. System Apps With the System Apps open, its following applications (5) display: Facility Management App TFWeb Server I/O Interface Page rev. AA
 is accessible from the Operator pulldown menu.")
359 Analysis Trend File Trend System On the Facility Dashboard screen, under the System Apps tab, three of the same applications are listed (I/O Interface, Analysis Trend File and Trend System). A fourth (Facility Management App) is accessible from the Operator pulldown menu. Again, this underscores two ways to access the System Apps: (1) from Tree View or (2) from the System Apps tab or the Operator pulldown menu on the Facility Dashboard screen. The fifth option (TF WebServer) is only accessible from Tree View. Communication Apps With the Communication Apps open, its following applications (5) display: Totalflow - TCP Totalflow - USB MMI Serial - COM0 TF Remote - COM1 Spare - COM2 The Communication Apps are only accessible from Tree View. Facility Management Overview Facility Management actually applies to the three levels or nodes of the facility hierarchy: Facility Sub-Facility Station rev. AA Page 359
. Enter Yes or No. Enabling this option (Yes) will restore application table data in facility management application and existing configuration will be discarded.")
360 Overview Here are displayed the two read/write fields for the Facility Management application Overview as follows: Facility Name Restore Configuration Enter the Name given to this Facility (up to 31 characters alphanumeric). Enter Yes or No. Enabling this option (Yes) will restore application table data in facility management application and existing configuration will be discarded.* *It's important to note that the Restore function brings over the application table data from PCCU which overwrites the existing configuration in the facility management application. All trend files will be brought over as well. If there is a PAD Controller in PCCU, the Groups will become the Sub-Facility (2nd) level and the Wells will become the Station (3rd) level. There is only one facility and it becomes the first level. If there is no PAD Controller in PCCU, there will be no Group concept. All parents of Applications (on the Applications tab in PCCU) will move to the Sub-Facility (2nd) level. Again, there is only one facility and it becomes the first level. There can only be a maximum of one Facility. Here are displayed the five read-only fields for the Facility Management application Overview as follows: Number of Sub- Facilities Number of Stations Number of Applications Number of Trend Files Displays the number of Sub-Facilities included in this Facility (maximum number of Sub-Facilities is 32). Displays the number of Stations included in this Facility (maximum number of Stations is 64). Displays the number of Applications instantiated at this Facility (maximum number of Applications is 256). Displays the number of Trend Files created for this Facility (maximum of Trend Files is 256). Page rev. AA
361 Number of Data Points Displays the number of Data Points identified for this Facility (maximum number of Data Points is 256). Setup Number of Nodes The following column terms are used for the Number of Nodes section: Number of Sub- Facilities Number of Stations Number of Applications Number of Trend Files Number of Data Points Enter the number of Sub-Facilities included in this Facility. Enter the number of Stations included in this Facility. Enter the number of Applications instantiated at this Facility. Enter the number of Trend Files created for this Facility. Enter the number of Data Points identified for this Facility. Add New Nodes The following column terms are used for the Add New Nodes section: Add New Sub- Facility Node Add New Station Node Add New Application Add New Trend File Node Add New Data Point Node Enter Yes or No depending on whether adding a new Sub-Facility Node. Enter Yes or No depending on whether adding a new Station Node. Enter Yes or No depending on whether adding a new Application. Enter Yes or No depending on whether adding a new Trend File Node. Enter Yes or No depending on whether adding a new Data Point Node. Delete Nodes The following column terms are used for the Delete Nodes section: Delete Sub-Facility Node Enter the number of the Sub-Facility Node to be deleted. Delete Station Node Enter the number of the Station Node to be deleted. Delete Application Node Enter the number of the Application Node to be deleted. Delete Trend File Node Enter the number of the Trend File Node to be deleted. Delete Data Point Node Enter number of the Data Point Node to be deleted rev. AA Page 361
362 Facility The following column terms are used for the Facility tab: Node Name ID# Type Parent Displays the number of the Facility Node. Enter the Name selected for this Facility (square or angular brackets not allowed in the Name of the Node). Displays the ID number of the device. Displays the Type of Node involved (Facility). This is for future use. Sub-Facilities The following column terms are used for the Sub-Facility tab: Node Name ID# Type Parent Displays the number of the Sub-Facility Node. Enter the Name selected for this Sub- Facility (square or angular brackets not allowed in the Name of the Node). Displays the unique identifier of the node (e.g. Station). Displays the Type of Node involved (Sub-Facility). Enter the type of parent if any (Facility). Stations The following column terms are used for the Stations tab: Node Displays the number of the Station Node. Page rev. AA
363 Name ID# Type Parent Enter the Name selected for this Station (square or angular brackets not allowed in the Name of the Node). Displays the ID number of the device. Displays the Type of Node involved (Station). Enter the type of parent if any (Sub-Facility). Applications The following column terms are used for the Applications tab: Node Name ID# Type Parent App Slot Associated App Slot Displays the number of the Application Node. Displays the Name for this Application (square or angular brackets not allowed in the Name of the Node). Displays the ID number of the device. Displays the Type of Node involved (Application). Enter the name of the Parent if any (Assorted: Facility, Sub-Facility, Station). Displays the number of the Application Slot. (For Future Use) Data Points If the number of Data Points are zero, the Data Points tab will not appear. The following column terms are used for the Data Points tab: Node Name ID# Type Parent Register Unit Associated App Slot X Location Y Location Point Type Attribute1 Attribute2 Attribute3 Attribute4 Displays the number of the Data Point Node. Enter the Name of the individual Data Point (square or angular brackets not allowed in the Name of the Node). Displays the ID# of each device. Displays the Type of Application. Enter the name of the Parent if any of each individual Data Point. Enter the app/array/register of each Data Point. Enter up to ten characters for the name of the units. Ten characters assumes nine places for Data and a space between the Data and the Units. In lieu of entering text, a String Register can be entered that contains the text. Enter the Associated App Slot number for each Data Point. Enter the X location for its (Data Point) location on the page. Enter the Y location for its (Data Point) location on the page. Signifies type of Data Point (e.g., string, integer, etc.) (for future use) (for future use) (for future use) (for future use) rev. AA Page 363
364 Trend Files If the number of Trend files are zero, the Trend Files tab will not appear. The following column terms are used for the Trend Files tab: Node Name ID# Type Parent File Name Associated App Slot Displays the number of the Trend File Node. Enter the Name for each Trend File (square or angular brackets not allowed in the Name of the Node). Displays the ID# of each device. Displays the Type of Trend File. Enter the name of the Parent if any of each Trend File. Enter the File Name for each Trend File. Enter the number for each Associated Application Slot. Page rev. AA
 software Help notes v1.0 Technical reference Document No. Rev. Ind. No. of Page 2105166-001 AA 365")
365 Copyright 2014 ABB, All rights reserved Document Title Totalflow products Totalflow Web Interface (TWI) software Help notes v1.0 Technical reference Document No. Rev. Ind. No. of Page AA 365
XC2 Client/Server Installation & Configuration
 XC2 Client/Server Installation & Configuration File downloads Server Installation Backup Configuration Services Client Installation Backup Recovery Troubleshooting Aug 12 2014 XC2 Software, LLC Page 1
Fencing Time Version 4.3
 Fencing Time Version 4.3 Upgrading your Fencing Time Server October 2017 Copyright 2017 by Fencing Time, LLC. All rights reserved. Overview Periodically, a new version of Fencing Time is released. In most
XSeries G4 Plunger Application rev. AA
 Totalflow product line Application Guide XSeries G4 Plunger Application rev. AA Totalflow products Doc name: XSeries G4 Plunger Application File name: 2104945MNAA.docx Status of document: Released Issued
Quick Start Guide. For Gold and Silver Editions
 Quick Start Guide For Gold and Silver Editions Table of Content Introduction... 3 Prerequisites... 3 Installation and Setup... 4 Download and Install QQEvolution 2... 4 Create Users... 8 Create Agent/CSR/Producer...
Swing Labs Training Guide
 Swing Labs Training Guide How to perform a fitting using FlightScope and Swing Labs Upload Manager 3 v0 20080116 ii Swing labs Table of Contents 1 Installing & Set-up of Upload Manager 3 (UM3) 1 Installation.................................
Integrate Riverbed SteelHead. EventTracker v8.x and above
 EventTracker v8.x and above Publication Date: March 27, 2018 Abstract This guide provides instructions to configure a Riverbed SteelHead to send its syslog to EventTracker Enterprise Scope The configurations
FireHawk M7 Interface Module Software Instructions OPERATION AND INSTRUCTIONS
 FireHawk M7 Interface Module Software Instructions OPERATION AND INSTRUCTIONS WARNING THE WARRANTIES MADE BY MSA WITH RESPECT TO THE PRODUCT ARE VOIDED IF THE PRODUCT IS NOT USED AND MAINTAINED IN ACCORDANCE
SCW Web Portal Instructions
 LP & JH 7/21/16 SCW Web Portal Instructions Contents Welcome to the SCW Web Portal!... 1 Accessing the SCW Web Portal... 2 Main SCW Web Portal Page... 4 My Profile... 5 Rounds History... 7 Book a Tee Time...
Heart Foundation Walking Website user guide for Walk Organisers
 Heart Foundation Walking Website user guide for Walk Organisers Proudly supported by Website User Guide for Walk Organisers Contents 1. Introduction... 2 1.1 Finding the HFW website... 2 1.2 Log in on
Steltronic StelPad User Guide
 StelPad User Guide Steltronic StelPad User Guide Contents Contents... 1 About StelPad and its Features... 3 StelPad System Elements... 3 StelPad Computer Integration with Focus... 4 Enable Custom Graphic
uemis CONNECT: Synchronisation of the SDA with myuemis
 uemis CONNECT: Synchronisation of the SDA with myuemis 1 What is myuemis? In myuemis, your private area on the Internet portal www.uemis.com, you can visualise your dives, manage your database and transfer
Table of Content IMPORTANT NOTE: Before using this guide, please make sure you have already set up your settings in
 Quick Start Guide Table of Content Introduction... 3 Prerequisites... 3 How to Open QQEvolution 2... 4 How to do Carrier Downloads... 5 Locating a Client in QQEvolution 2... 7 Adding a New Client... 8
Website User Guide for Walk Organisers
 Website User Guide for Walk Organisers Contents 1. Introduction... 2 1.1 Finding the HFW website... 2 1.2 Log in on the HFW website... 2 2. Your Dashboard Screen... 4 3. Basic Online Profile Features...
[XACT INTEGRATION] The Race Director. Xact Integration
![[XACT INTEGRATION] The Race Director. Xact Integration](/thumbs/95/123601803.jpg "[XACT INTEGRATION] The Race Director. Xact Integration") 2018 The Race Director Xact Integration [XACT INTEGRATION] This document describes the steps in using the direct integration that has been built between Race Director and Xact. There are three primary
2018 The Race Director Xact Integration [XACT INTEGRATION] This document describes the steps in using the direct integration that has been built between Race Director and Xact. There are three primary
FAQs GOLF CANADA KIOSK
 FAQs GOLF CANADA KIOSK WHY THE GOLF CANADA KIOSK? The kiosk web address is generally used at the course because of its basic features and user-friendly interface. There is no password required for entry,
Wickets Administrator
 Wickets Administrator Software For Managing Stored Value Wickets 01/08/2008 Product Details And Operating Instructions Overview This page describes each major function of Wickets Administrator in detail.
The ICC Duckworth-Lewis-Stern calculator. DLS Edition 2016
 The ICC Duckworth-Lewis-Stern calculator DLS Edition 2016 (DLS2-2016) Installation and operating instructions Queries about program operation should be sent to: Steven.Stern@qut.edu.au 2016 International
Operating Manual. SUPREMA Calibration. Software for Fire and Gas Warning Units. Order No.: /01. MSAsafety.com
 Operating Manual Software for Fire and Gas Warning Units Order No.: 10154656/01 MSAsafety.com MSA Europe GmbH Schlüsselstrasse 12 8645 Rapperswil-Jona Switzerland info.ch@msasafety.com www.msasafety.com
Diver-Office. Getting Started Guide. 2007, Schlumberger Water Services
 Diver-Office Getting Started Guide 2007, Schlumberger Water Services Copyright Information 2007 Schlumberger Water Services. All rights reserved. No portion of the contents of this publication may be reproduced
Meter Data Distribution User Manual
 0.1 Meter Data Distribution User Manual February 2016 Public Copyright 2015 Independent Electricity System Operator. All rights reserved. Public Page 2 of 24 Table of Contents Contents 1. Overview... 4
GN21 Frequently Asked Questions For Golfers
 Posting Scores (My Score Center) 1. Click on the Enter Score button to enter an adjusted gross score or click on the Enter Hole-By-Hole Score button to enter your score hole-by-hole. NOTE: to use the Game
GN21 Frequently Asked Questions For Golfers
 Customer Support We are dedicated to offering you the best customer support possible. Our goal is to respond to your requests within 24hrs. 1. On the www.ngn.com homepage there is link labeled Help which
Microsoft Windows Software Manual for FITstep Stream Version 4
 Thank you for purchasing this product from Gopher. If you are not satisfied with any Gopher purchase for any reason at any time, contact us and we will replace the product, credit your account, or refund
Armfield Distillation Column Operation Guidelines
 Armfield Distillation Column Operation Guidelines 11-2016 R.Cox Safety SAFETY GLASSES ARE REQUIRED WHEN OPERATING THE DISTILLATION COLUMN Wear gloves when mixing alcohol feedstock The column will become
User Help. Fabasoft Scrum
 User Help Fabasoft Scrum Copyright Fabasoft R&D GmbH, Linz, Austria, 2018. All rights reserved. All hardware and software names used are registered trade names and/or registered trademarks of the respective
Software Manual for FITstep Pro Version 2
 Thank you for purchasing this product from Gopher. If you are not satisfied with any Gopher purchase for any reason at any time, contact us and we will replace the product, credit your account, or refund
To Logon On to your tee sheet, start by opening your browser. (NOTE: Internet Explorer V. 6.0 or greater is required.)
") 1. Log-On To Logon On to your tee sheet, start by opening your browser. (NOTE: Internet Explorer V. 6.0 or greater is required.) (NOTE: Logon ID s must be 7 characters or more and passwords are case sensitive.)
1. Log-On To Logon On to your tee sheet, start by opening your browser. (NOTE: Internet Explorer V. 6.0 or greater is required.) (NOTE: Logon ID s must be 7 characters or more and passwords are case sensitive.)
The Complete 100 Day Dash Guide Updated May 7, 2013
 The Complete 100 Day Dash Guide Updated May 7, 2013 This guide covers the following topics (click the links to read more): Official Rules Frequently Asked Questions (FAQs) How to Register for the Dash
The Race Director. Race Director Go [RACE DIRECTOR GO] This document describes the implementation of Race Director Go with a beginning to end example.
![The Race Director. Race Director Go [RACE DIRECTOR GO] This document describes the implementation of Race Director Go with a beginning to end example.](/thumbs/80/81747710.jpg "The Race Director. Race Director Go [RACE DIRECTOR GO] This document describes the implementation of Race Director Go with a beginning to end example.") 2018 The Race Director [RACE DIRECTOR GO] This document describes the implementation of with a beginning to end example. Contents Intro... 3 1 Setup... 3 Combining Race Director Divisions... 3 Creating
2018 The Race Director [RACE DIRECTOR GO] This document describes the implementation of with a beginning to end example. Contents Intro... 3 1 Setup... 3 Combining Race Director Divisions... 3 Creating
10 The Performance Assessment Report
 10 The Performance Assessment Report CCQAS 2.8 provides the capability for online generation, completion, and review of a Performance Assessment Report (PAR) for a privileged provider for every privileging
Race Screen: Figure 2: Race Screen. Figure 3: Race Screen with Top Bulb Lock
 Eliminator Competition Stand Alone Mode - Instruction Manual Main Menu: After startup, the Eliminator Competition will enter the Main Menu. Press the right/left arrow buttons to move through the menu.
HyperSecureLink V6.0x User Guide
 HyperSecureLink V6.0x User Guide Note: This software works with the LS-30 Version (06.0x or later) 1, Hardware Installation: 1-1, Connection Diagram for USB or RS-232 Computer Interface To LS-30 CM1 To
AX5000 Operational Manual
 MIYACHI AMERICA CORPORATION The World Leader in Hermetic Sealing Systems AX5000 Operational Manual 0 Document #107-00092-001 Dec, 2013 AX5000 Operational Manual Miyachi America Corporation 1820 S. Myrtle
ITF SCORER ONLINE TRAINING SETUP
 ITF SCORER ONLINE TRAINING SETUP Guidelines for Officials Version 1.2 INTRODUCTION The ITF s Live Scoring System uses handheld wireless electronic devices (smartphone handsets), operated by Chair Umpires,
Click on the menu icon in the left corner to open the menu. From the menu you can:
 The Golf Short Game Tracker App supports two types of measurements: meters and yards/feet. By default the measurements are shown in meters. If you like to use yards/feet go to Settings to change the Distance
PRODUCT MANUAL. Diver-Mobile for Android
 PRODUCT MANUAL Diver-Mobile for Android Contact details: Van Essen Instruments B.V. Van Essen Instruments - Canada Delftechpark 20 630 Riverbend Drive, Suite 100 2628 XH Delft Kitchener, ON, The Netherlands
Team Manager's Manual
 Introduction: Team Managers Duties: Overview Team Manager's Manual Team Manager's Tasks Get your ScoreBook ID and Password from your League Administrator. Enter Your "Team Administration" Page Setting
Tournament Manager: Running a VEX IQ Event - Beginner
 Tournament Manager: Running a VEX IQ Event - Beginner Indiana IQ Event Partner Workshop Agenda 1. Main Window a. Once i. The Main Window has a standard menu bar. ii. A series of tabbed pages filling the
Golf Genius Software
 CARSON VALLEY WOMEN S GOLF CLUB Golf Genius Software On-Line User Manual Kathy Belvel 6/3/2018 User step by step instructions for accessing and using the full array of capabilities available in the Golf
v2.3 USER MANUAL
 v2.3 USER MANUAL www.foresightsports.com Table of Contents 03 04 05 09 12 17 20 21 Activation Getting Started Play Compete Improve Settings Update Manager Glossary 04 11 05 12 03 Activation FSX Activation
Instruction Manual. BZ7002 Calibration Software BE
 Instruction Manual BZ7002 Calibration Software BE6034-12 Index _ Index Index... 2 Chapter 1 BZ7002 Calibration Software... 4 1. Introduction... 5 Chapter 2 Installation of the BZ7002... 6 2. Installation
Maestro 3 rd Party Golf User Guide
 Maestro 3 rd Party Golf User Guide Published Date: November 15 Golf Setup Before Golfing reservations can be made using a 3 rd party Golf Interface, an amount of setup is required. This setup is performed
Touch Screen Guide. OG-1500 and OG Part # T011
 Touch Screen Guide OG-1500 and OG-2000 Part # 9000000.T011 Effective 11/2010 External View Internal View 1. Transducer Banks 2. Oxygen Sensor 3. PLC These are the two manifolds with three (3) transducers
BVIS Beach Volleyball Information System
 BVIS Beach Volleyball Information System Developments in computer science over the past few years, together with technological innovation, has in turn stimulated the development of tailored software solutions
Competition Management Online User Guide for Basketball
 Competition Management Online User Guide for Basketball version 3.0 Acting Manager, Game Development Amy Clarke E: amy.clarke@basketball.net.au P: 03 9697 4315 Account Manager Katherine Bell E: k.bell@foxsportspulse.com
UNITY 2 TM. Air Server Series 2 Operators Manual. Version 1.0. February 2008
 UNITY 2 TM Air Server Series 2 Operators Manual Version 1.0 February 2008 1. Introduction to the Air Server Accessory for UNITY 2...2 1.1. Summary of Operation...2 2. Developing a UNITY 2-Air Server method
CLUB REGISTRATION & SUPPORT / TICKETING
 CLUB REGISTRATION & SUPPORT / TICKETING Version number: 1.0 Account Manager: Kevin Fowler Nemisys Authors: Andy Felton & Paul Keeling Nemisys English Golf Union Customer Name: Club Systems International
The ICC Duckworth-Lewis Calculator. Professional Edition 2008
 The ICC Duckworth-Lewis Calculator Professional Edition 2008 (Version 1.1) Installation and operating instructions Any queries about operating the program should be sent to steven.stern@anu.edu.au 2008
SwimNumber App. Build Custom Smart Workouts Control the Wave Propulsion TM System Achieve Health and Fitness Goals INSTRUCTION MANUAL
 SwimNumber App Build Custom Smart Workouts Control the Wave Propulsion TM System Achieve Health and Fitness Goals INSTRUCTION MANUAL Table of Contents Warning...2 Connecting to Swim Spa...3-7 Swim Spa
Blackwave Dive Table Creator User Guide
 Blackwave Dive Table Creator User Guide Copyright 2002-2009 Blackwave. All rights reserved. These materials (including without limitation all articles, text, images, logos, compilation, and design) are
MyCricket User Manual
 MyCricket User Manual Club Tasks V 2.0, Last Updated: June 10 th 2009 Contents Page ADMINISTRATION TASKS... 3 1. Manage Your Association Details... 3 1.1. First Time Login... 3 1.2. Navigating the Administration
STRIDES USER GUIDE Version September 2014
 STRIDES USER GUIDE Version 3.0 - September 2014 NEW YORK ROAD RUNNERS YOUTH AND COMMUNITY SERVICES 156 W. 56 th Street, New York, NY 10019 youngrunners@nyrr.org 646-758-9651 Copyright 2014 by New York
USER GUIDE USER GUIDE
 1 TABLE OF CONTENTS GETTING STARTED 2 Included in the box 2 Compatible smartphones 2 Accessories: 2 Download Mobitee and PIQ application 2 GET STARTED WITH MOBITEE AND PIQ 3 Create your Account and Login
SQL LiteSpeed 3.0 Installation Guide
 SQL LiteSpeed 3.0 Installation Guide Revised January 27, 2004 Written by: Jeremy Kadlec Edgewood Solutions www.edgewoodsolutions.com 888.788.2444 2 Introduction This guide outlines the SQL LiteSpeed 3.0
Club s Homepage Use this feature to return the club s website.
 The first time the golfer logs into the Internet Golf Reservation System, the member # is the club assigned golfer number, the default password is 1234. The golfer will automatically be transferred to
Inventory User Guide
 Inventory User Guide User Guide ~ Table of Contents ~ Sign On/Select Facility Rates & Inventory Update Tee Times Load Tee Times AutoLoad Schedule Rate Fences Dashboards Revenue At Risk, Rounds & Revenue,
2017 Census Reporting To access the SOI s Census Reporting web site go to:
 To access the SOI s Census Reporting web site go to: https://census.specialolympics.org/login You will need to enter your username (valid email address) and password. If you have not received your password
Understood, Inc. User Guide SCUBA Solutions Version 1.7
 Understood, Inc. User Guide SCUBA Solutions Version 1.7 Table of Contents Revision History... 4 Introduction... 5 Purpose... 5 Scope... 5 Home... 5 Today s Dive Trips [Display]:... 6 Next Dive Trip [Display]:...
Hazard Training Guide
 Hazard Training Guide Using the Main Application v1.5 WHS Version Control Document Title: Hazard Training Guide using the Main Application Document Issue: Version 1.5 Date Issued: 12 Aug 2014 Issue Date
Fastball Baseball Manager 2.5 for Joomla 2.5x
 Fastball Baseball Manager 2.5 for Joomla 2.5x Contents Requirements... 1 IMPORTANT NOTES ON UPGRADING... 1 Important Notes on Upgrading from Fastball 1.7... 1 Important Notes on Migrating from Joomla 1.5x
Competition Management
 Competition Management User Guide for the Basketball Network 2016 version 1.3 Table of Contents CONFIGURATION 4 Passport 4 Access via User Management 4 Club and Team Field Settings 5 Manage Competition
In Response to a Planned Power Outage: PPMS EverCool II Shut Down and Re-start Procedure
 PPMS Service Note 1099-412 In Response to a Planned Power Outage: PPMS EverCool II Shut Down and Re-start Procedure Introduction: Loss of electricity to the PPMS EverCool II should not cause damage to
ACI_Release_Notes.txt VERSION Fixed Tank info for ELITE in Dive section 2. Fixed USB port initializing for old DC VERSION
 VERSION 2.4.0 1. Fixed Tank info for ELITE in Dive section 2. Fixed USB port initializing for old DC VERSION 2.3.9 1. Fixed Dive Computer configuration section error 2. Fixed message for download/upload
Golfshot : Golf GPS Android User Guide
 Golfshot : Golf GPS Android User Guide Version 3.5 Scorecard Version 3.5 QUICK TIPS: New in 3.5: Track Menu Track Menu Press the Golf Ball icon in the upper left corner to slide down the Track Menu. Here
Hot Springs Village Member Portal User Guide
 HOW TO USE THE MEMBER PORTAL: CHECK YOUR ACCOUNT BALANCE, MAKE ACCOUNT PAYMENTS, BOOK GOLF OR TENNIS RESERVATIONS, REPORT VISITORS TO THE EAST AND WEST GATES AND MUCH MORE. Table of Contents Portal Options...
Slide 1 - Welcome to an Overview of the Student Center and New Titan Online
 Slide 1 - Welcome to an Overview of the Student Center and New Titan Online Page 1 of 64 Slide 2 - This web-based tutorial is brought to you by Information Technology and Student Administration Staff.
JETFIRST 150 RTA SYSTEM OPERATING MANUAL Version: 2 Feb 2012
 JETFIRST 150 RTA SYSTEM OPERATING MANUAL Version: 2 Feb 2012 UNIVERSITY OF TEXAS AT ARLINGTON Nanofabrication Research and Teaching Facility TABLE OF CONTENTS 1. Introduction....2 1.1 Scope of Work.....2
APP NOTES Onsight Connect Cisco Integration. July 2016
 APP NOTES Onsight Connect Cisco Integration July 2016 Table of Contents 1. Direct Onsight Device to Cisco Endpoint Calling... 4 2. Onsight Device to Onsight Device (including Cisco Endpoint) Calling...
ROTAX GLOBAL APP GUIDE. (revised ) GRAND FINALS EDITION
 GRAND FINALS EDITION") ROTAX GLOBAL APP GUIDE (revised 16.09.2018) GRAND FINALS EDITION Table of Contents Chap. Content Page Table of Contents 2 Basic Information 3 1. Download Rotax Global App 5 2. Get Internet Connectivity
ROTAX GLOBAL APP GUIDE (revised 16.09.2018) GRAND FINALS EDITION Table of Contents Chap. Content Page Table of Contents 2 Basic Information 3 1. Download Rotax Global App 5 2. Get Internet Connectivity
Software for electronic scorekeeping of volleyball matches, developed and distributed by:
 Software for electronic scorekeeping of volleyball matches, developed and distributed by: Developed for the rules of USports 2017-18 As adopted by Ontario University Athletics for Men s & Women s Volleyball
REMOTE CLIENT MANAGER HELP VERSION 1.0.2
 VERSION 1.0.2 MERCHANT SALES: 800-637-8268 New Merchant Accounts PARTNER PROGRAMS: 800-637-8268 New and existing partnerships CUSTOMER CARE: 800-338-6614 Existing merchant account support Statements and
Hot Springs Village Member Portal User Guide
 Contents Portal Options... 2 Portal Display:... 2 MAIN Options:... 2 E-COMMERCE Options... 2 Annual Registrations... 2 Pets... 2 Boats... 3 Carts... 3 Vehicles... 3 GHIN... 4 Annual Passes... 4 My Transactions...
PEACE RIVER SENIOR MEN'S TENNIS LEAGUE
 PEACE RIVER SENIOR MEN'S TENNIS LEAGUE HANDBOOK FOR CAPTAINS -updated Oct. 15/2016 Table of Contents A. Introductory Remarks...2 B. Peace River Website...2 Teams and Schedules... 2 Setting Team Cookie...
Contents DE LA SALLE COLLEGE OLLIE USAGE GUIDE 2
 OLLIE USAGE GUIDE Contents Setting up your password for Ollie... 3 How to access Ollie and log in... 6 Introduction to Ollie... 7 Viewing your son s timetable... 8 Viewing your son s calendar... 9 Viewing
The MQ Console and REST API
 The MQ Console and REST API Matt Leming lemingma@uk.ibm.com Agenda Existing capabilities What s new? The mqweb server The MQ REST API The MQ Console 1 Existing capabilities Administering software MQ Queue
Navy Guidance and Tips for Using DOEHRS-IH Ventilation NAVY & MARINE CORPS PUBLIC HEALTH CENTER
 Navy Guidance and Tips for Using DOEHRS-IH Ventilation NAVY & MARINE CORPS PUBLIC HEALTH CENTER October 2010 Purpose This document is a supplemental Navy guide to the DOEHRS Student Guide/User Manual Version
For running only the scoresheet application without any video features only some very basic hardware / software requirements have to be fulfilled:
 Digital Scoresheet user manual Requirements For running only the scoresheet application without any video features only some very basic hardware / software requirements have to be fulfilled: Laptop, preferably
[CROSS COUNTRY SCORING]
![[CROSS COUNTRY SCORING]](/thumbs/84/89721527.jpg "[CROSS COUNTRY SCORING]") 2015 The Race Director Guide [CROSS COUNTRY SCORING] This document describes the setup and scoring processes employed when scoring a cross country race with Race Director. Contents Intro... 3 Division
2015 The Race Director Guide [CROSS COUNTRY SCORING] This document describes the setup and scoring processes employed when scoring a cross country race with Race Director. Contents Intro... 3 Division
[CROSS COUNTRY SCORING]
![[CROSS COUNTRY SCORING]](/thumbs/89/99405973.jpg "[CROSS COUNTRY SCORING]") 2018 The Race Director Guide [CROSS COUNTRY SCORING] This document describes the setup and scoring processes employed when scoring a cross country race with Race Director. Contents Intro... 3 Division
2018 The Race Director Guide [CROSS COUNTRY SCORING] This document describes the setup and scoring processes employed when scoring a cross country race with Race Director. Contents Intro... 3 Division
OZCHASE RACING - ONLINE NOMINATIONS USER GUIDE - Ozchase Online Nominations User Guide Page 1 of 28
 OZCHASE RACING - ONLINE NOMINATIONS USER GUIDE - Ozchase Online Nominations User Guide Page 1 of 28 Table of Contents 1.0 Accessing Online Nominations... 3 1.1 Logging On to Online Nominations... 3 1.2
IBM Security IOC Manager 1.0.0
 IBM Security IOC Manager 1.0.0 Table of Contents Overview...1 Installing...1 Install steps...1 Uninstall steps...2 Configuring...2 Creating authorized service token...2 First Time Setup...3 Managing permissions
Quick Start Guide. A. Hardware installation B. Software installation C. Start the software for the first time D. Do your first measurement
 Quick Start Guide This Quick Start Guide describes the hardware and software installation process and the Measurement feature in a simple way. Please follow the sequence of the steps to avoid problems
Center Command Version 3. Operations Manual
 Center Command Version 3 Operations Manual Version: July 26, 2010 Table of Contents OVERVIEW... 2 OVERVIEW OF COMPUTER SCORE CENTER COMMAND... 2 MAIN MENU FUNCTIONS (IF MODULES INSTALLED)... 3 CENTER
We release Mascot Server 2.6 at the end of last year. There have been a number of changes and improvements in the search engine and reports.
 1 We release Mascot Server 2.6 at the end of last year. There have been a number of changes and improvements in the search engine and reports. I ll also be covering some enhancements and changes in Mascot
A GUIDE TO THE LOOSE ENDS HOCKEY LEAGUE WEBSITE PAGE
 A GUIDE TO THE LOOSE ENDS HOCKEY LEAGUE WEBSITE PAGE 1 What Can Be Done Using The League Website: MAIN PAGE: From the main page, click on the man with the newspaper beneath the label News and Archives
BiiSafe Buddy User Guide
 1 BiiSafe Buddy User Guide Guide 2 This guide explains how to set up your BiiSafe Buddy and use all of its features. You will need: 1. Your BiiSafe Buddy 2. Your Mobile device (Apple or Android) 3. Data
Online League Management lta.tournamentsoftware.com. User Manual. Further support is available online at
 Online League Management lta.tournamentsoftware.com User Manual Further support is available online at www.lta.org.uk/leagueplanner Contents Welcome... 3 Using this guide... 3 Further support?... 3 Publishing
CONTENTS... 2 CONFIGURATION... 3 VENUE MANAGEMENT SETTING UP COMPETITIONS TEAM MANAGEMENT FIXTURING PUBLICATION...
 Contents CONTENTS... 2 CONFIGURATION... 3 VENUE MANAGEMENT... 12 SETTING UP COMPETITIONS... 14 TEAM MANAGEMENT... 19 FIXTURING... 20 PUBLICATION... 26 RESULTS... 27 REPORTING... 31 2 P a g e Configuration
Flow Vision I MX Gas Blending Station
 Flow Vision I MX Gas Blending Station Alicat Scientific, Inc. 7641 N Business Park Drive Tucson, Arizona 85743 USA alicat.com 1 Notice: Alicat Scientific, Inc. reserves the right to make any changes and
Quick Guide. SGX-CA500 Cycle Computer SGY-PM Series Power Meters
 Quick Guide SGX-CA500 Cycle Computer SGY-PM Series Power Meters Easy Installation and Advanced Functionality Fast Facts: Pioneer Power Meter Cranksets and arms ship pre-set in the ANT+ Format Simply install
Mac Software Manual for FITstep Pro Version 2
 Thank you for purchasing this product from Gopher. If you are not satisfied with any Gopher purchase for any reason at any time, contact us and we will replace the product, credit your account, or refund
Sport NGIN has two applications, which can be used to score games.
 Sport NGIN Score Keeping Training Notes Sport NGIN is the new CAHA mandated electronic scoring application for all CCYHL games beginning with the 2014-2015 season. Pointstreak is no longer to be used for
Pegas 4000 MF Gas Mixer InstructionManual Columbus Instruments
 Pegas 4000 MF Gas Mixer InstructionManual Contents I Table of Contents Foreword Part I Introduction 1 2 1 System overview... 2 2 Specifications... 3 Part II Installation 4 1 Rear panel connections...
Old Kings Oval Electronic Scoreboard. Scoreboard Operation and Advanced Scoring Instructions
 Old Kings Oval Electronic Scoreboard Scoreboard Operation and Advanced Scoring Instructions 1 Introduction... 3 Primary Contacts... 3 Solid Scoreboards 24/7 Support 0458 LED FIX (0458 533 349)Scoring a
CONTENTS. Welcome to Season Setup in Play Football Setting Up Our Details Setting up Age Groups... 9
 SEASON SETUP 2018 CONTENTS Welcome to Season Setup in Play Football... 2 Setting Up Our Details... 5 Setting up Age Groups... 9 Setting up Fees and Registration Packages... 11 Create a Registration Package...
SafeSeaNet Norway PEC Administration Guide
 SafeSeaNet Norway PEC Administration Guide Kystverket Vest Flathauggata 12 5525 Haugesund Telephone: +47 52 73 32 00 Telefax: +47 52 73 32 01 E-post: vest@kystverket.no Web: http://www.kystverket.no Table
Version 3.1.0: New Features/Improvements: Improved Bluetooth connection on Windows 10
 Version 3.1.0: Improved Bluetooth connection on Windows 10 ***Important notice for Mac Users: Upgrading from Shearwater Desktop 3.0.8 to 3.1.0 will not cause issues. Upgrading from any 2.X.X to any 3.X.X
PC Configuration software for Discovery MkVI v 1.03 User guide
 PC Configuration software for Discovery MkVI v 1.03 User guide This user guide describes the different features included in PC Config software, version 1.03, and how they are used. When referring to this
Setting Up the Ingenico isc250 Pinpad via USB
 One Blue Hill Plaza, 16 th Floor, PO Box 1546 Pearl River, NY 10965 1-800-PC-AMERICA, 1-800-722-6374 (Voice) 845-920-0800 (Fax) 845-920-0880 Setting Up the Ingenico isc250 Pinpad via USB The following
CONSUMER MODEL INSTALLATION GUIDE
 CONSUMER MODEL INSTALLATION GUIDE System requirements Windows System Requirements To use your TOMI and its software, your system should have: A Microsoft Windows compatible PC with a Pentium IV processor