A SYSTEM FOR PROCESSING HYDROGRAPHIC SURVEY DATA
|
|
|
- Brice Knight
- 5 years ago
- Views:
Transcription

1 H Y PO S A SYSTEM FOR PROCESSING HYDROGRAPHIC SURVEY DATA by A. J. K e r r and T. V. E v a n g e l a t o s Canadian H ydrographic Service and D. M a r s h a l l, A G T Systems Ltd, Toronto ABSTRACT The Canadian Hydrographic Service finds that modern technology is perm itting data to be collected at a faster rate than it can be processed using present methods. In an attempt to overcom e this problem, a system call Hypos (Hydrographic Position) has been developed. It is hoped that this system w ill result in a smooth flow of inform ation. Hypos is a set o f programs that are used to control xy digitizers, digital computers and automatic plotters. INTRODUCTION Three years ago, in an endeavour to speed up the introduction o f modern technology, the Canadian H ydrographic Service set up several small technical development groups. The authors of this article form ed one o f these groups. They were given the task of developing a method to process hydrographic data im m ediately after collection and before it is passed to the cartographers. One o f the first stages o f the developm ent involved a study o f the methods used by other organizations. Techniques that are used in other countries have been incorporated in the Hypos system and the authors are indebted to those who have given them assistance. In particular, they wish to mention the Swedish H ydrographic O ffice. At the present time, the methods used to process data in the Canadian Hydrographic Service are m ainly manual. For example, depths are read from the echo sounder graphs by means o f a plastic scale and positions are generally interpolated on a lattice of plotted position lines. The Hypos system resorts m ainly to numerical methods that result in the com putation o f a set o f x, y, z co-ordinates that can be plotted autom atically.

2 An initial consideration in the system design was whether the processing equipment should be on board the collecting vessel or located at some central point ashore. The matter is m ainly one o f economics and it was decided by the w riters that in the prototype system the equipment should be located ashore and that data be transm itted to and from the survey location. It should also be remarked that as more data are collected by launch than by ship in this organization it was decided to place the emphasis on the processing o f data collected by survey launch. A final, but most important point, is that the hydrographer in the field needs to know how his survey is progressing in a very short period o f time. Accordingly, one of the objectives o f the system is that the time between collection of the raw data and receipt o f the processed data in an understandable and useful form must not exceed one week. H O RIZO NTAL POSITION D A T A As it can be seen in figure 1, four types o f navigational inform ation have been considered. These are : horizontal sextant angles, identification on photographs (see figure 2), Hydrodist and H i-f ix (M in i-f ix). The objective is to translate each of these inputs into a common form, nam ely a set of Universal Transverse Mercator co-ordinates referenced by serial numbers. T o achieve this objective each input must be presented to the com puter in a digestible form. A t the present time, the data fro m all except the photographs are recorded on specially designed forms and are then key-punched on to cards. It is expected that the next step w ill be the introduction of automatic logging systems and the manual recording and key punching w ill be by-passed. In the case of the aerial photographs, an x y digitizer, which w ill be described later, is used to obtain co-ordinates of the vessels position and co-ordinates of reference marks on the photographs. These points are autom atically recorded on m agnetic tape. Once the data are on punched cards or tape a digital com puter (CDC 3100 or IBM 360/) is used to compute the rectangular U.T.M. co-ordinates. The co-ordinates with serial reference numbers are then stored on magnetic tape for further processing. A t this stage line-printer listings are also produced for reference and quality control purposes (see figure 8). Conversion to geographic co-ordinates is also available on demand. DEPTH D ATA Before describing the method of processing the depth data it may be useful to describe the versatile Thompson Pencil Follow er that is used for several operations in the Hypos system (see figure 3). The instrument consists o f a flat table (100 cm X 50 cm ), a plastic cursor connected by

3 HYPOS F ig. 1.

4 Fig. 2. Typical aerial photograph with plot offset for comparison. wires passing around pulleys to two encoders, a box of electronics, a magnetic tape recorder and an electric typewriter. A unique method of electromagnetic coupling enables the operator to have a completely free floating cursor. Positions can be digitized in increments of 0.1 mm on both the x and y axis. Recording can be on operator demand, on a time demand or when passing discrete increments on the x axis. The typewriter is used to place reference information in coded form on the output tape. In designing the Hypos system it was decided that initially automatic digital echo sounders would not be included. At the present stage of their development their high cost and unproven reliability limits their use. It is therefore expected to be several years before existing graphical recording sounders will be phased out. As a result it is proposed to process the echo sounder strip charts using the Thompson Pencil Follower. The method is as follows: (see figures 1 and 4). The operator starts by typing in reference data, such as vessel number, date and location. The next step is to digitize the intersection of the zero depth line with the position reference marks. The machine is then switched into either the time demand or the x increment mode and the seabed, as shown on the strip chart, is carefully followed. One sounding line at a time is followed in this manner. The result of these operations is to define the seabed by a set of very closely spaced xy coordinates that is in fact rather similar to the output of a fully digitized echo

5 Fig. 3. Thom pson Pencil Follow er. sounder. However, in this system there is the advantage that the operators can analyse the sea bottom themselves and that one operator appears capable of processing as many as ten vessel/day records a day. The depth data that are now on magnetic tape must undergo a number of operations by the computer. The first of these is to translate the coordinates obtained by the digitizer into actual depth units. As the Canadian Hydrographic Service uses a variety of echo sounders, some of which have curvilinear and others rectilinear graphs and all have different sized depth units and phases, it is necessary to compute the depths in feet, fathoms (or metres). T ID A L AND VELO CITY CORRECTIONS All depths must be reduced to chart datum and in the cases where fixed speed echo sounders are being used, corrections must be applied for the signal propagation. At this time the tidal corrections are handled quite simply. The reductions are referenced directly to the position serial numbers

6 Intersections of position references F ig. 4. Sounding roll digitization. I he two upper fine line curves are replays of the digitized values on a Calcomp plotter for quality control checking. and are key punched on cards that are read by the computer and applied in the program. A more sophisticated method is under development that will use co-tidal information and a time reference. No programming has yet been done for applying propagation corrections as the emphasis has been on variable speed echo sounders used in shallow water. MERGING POSITION AN D DEPTH D ATA T w o types of data are now available. These are the navigational positions and the depths reduced to chart datum. Both forms of data have a common serial reference (see figure 5). These two streams of data are then led into the computer and result in one channel which consists of a large serial set of depths referenced at intervals to a geographical position in the form of UTM co-ordinates.

7 Calculate distance between Axes i n Select depths on fix. and intermediate positions z e : Scan for shallow and Print depths deep points IX _ ^.^ Pick out contour intercepts F ig. 5. Simplified flow diagram of merge process.

8 (A ) Search for major shallow or deep points. replaced by depth of shallow point. search is made for minor shallow or deep points. F ig. 6. Depth selection.

9 Position listing Preliminary Depth listing Ü MCTO E 0 o a Main depth listing Plot 1 ^ / Master 1 vessel track \ file i ^ Plot 3 intercepts Plot 2 Plot 4 shoal and max./min. deep points points r Automatic cartography Fig. 7. Types of output information.
 apart.")
10 SELECTION OF DEPTHS The method of digitization o f echo soundings provides a large number of depths that must be refined into usable inform ation. At present, the accepted method in the Canadian H ydrographic Service is to show soundings on the Field or Smooth Sheet approxim ately 0.2 inches (5 m m ) apart. These are supplemented by significant shallow and deep depths between the regular grid. T h e H ypos system tries to fu lfill this requirem ent and in addition selects depths at points where the vessel track passed pre-selected depth contours (see figure 5). The method o f selecting the regularly spaced depths is as follows. Using the position inform ation, the distance between tw o known points at the desired plot scale is computed. These distances divided by the sounding interval (usually 0.2 inch) determ ine the number o f interm ediate points required. The location o f these interm ediate depth points can then be in terpolated between known positions using the x values w h ich have been obtained previously on the Pencil Follow er. In order to determ ine the logic for locating shallow' and deep depth points the methods used by skilled hydrographers w ere studied carefully. This logic is shown diagram m atically in figure 6. In actual practice it has been found that this logic is more dem anding than that used by a hydrographer and results in a greater number of points. As in the case of the regularly spaced depths, the positions of the shallow and deep points are interpolated lin early between the points o f known position. Finally, the contour intercepts are located by feeding the desired depth contours into the computer program and then scanning each available depths in turn. As each one is located it can be assigned a geographic position in a sim ilar manner to the tw o previous types o f selection. The result o f these various selections is a master file (see figure 7) which contains positions and depths o f all the selected points. PLO TS AN D OTHER OUTPUTS The most useful form in which data can be displayed to the hydrographer is a two dimensional plot. From the advent o f hydrography up to the present day the results of a survey have been shown on a carefu lly drawn plot. This plot is used by the hydrographer in the field to assess his progress and by the cartographer in the office to com pile into the nautical cnart. It appears that although the rntter process m ay change, no substitute fo r the form er exists at present. Therefore, the w riters consider the production o f plots an essential part of the system. A deviation from previous methods has been made in the number of plots made and the fact that the data in a

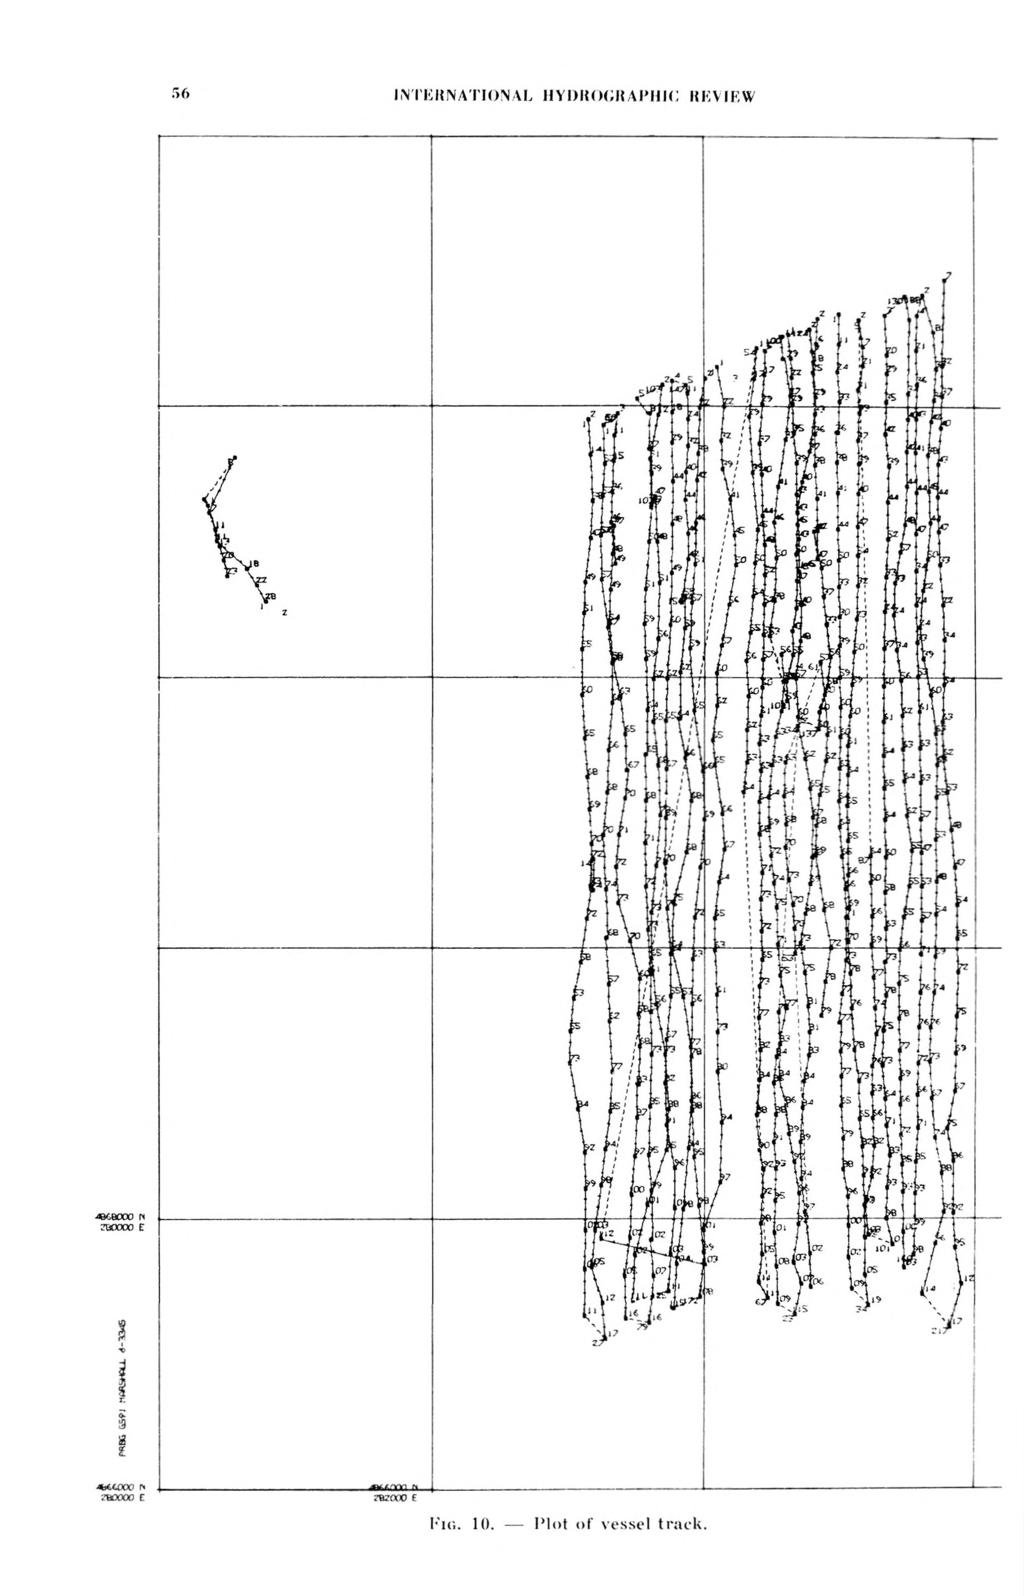
11 ROLL SERIAL FIX CO-OROINATES f r o m s e x t a n t a n g l e C ONVERSION p a g e 12 LEFT REF 1 b l l t OEG 31 MlN 15 MIO REF 5 d e l d e l d e l DEL OEL DEG?? MIN? ? RTGHT REF 14 PRLT 14 PRLT 14 PRLT 14 PRLT 14 PRLT NORTHING ?* * EASTING DEL PRLT « ao DEL PRLT DEL PRLT * * 60 O A 60 an i n Ol 1T BLLT 1 Rl 1T BLLT BLLT BLLT ?n 5 DEL 5 DEL DEL ft \ A <. c nri DEL 5 DFL DEL 3«5 DEL DEL A 5 DFL in 5 DEL 5 DFL 22?3 25?4 24 OA 14 PRLT PRLT * PRLT ) A Af%CC A PRLT? PRLT PRLT T 4 t>ri T PRLT?? ft J4 PRI T 21?n 23 «14 14 PRLT 14 PRI T ( nqn3.?3K ?An644.RAR Rn64n.4^a A «; ?aQ6?0. 40A *»» * b a d g e o m e t r y o n ABOVE FIX RECOMPUTED VALUES ARE ¾ * « DEL PRLT O Q CD CO BAD GEOMETRY ON ABOVE FIX.RECOMPUTED VALUES ARE P ** «149 mn 1 RIIT Q ft 12 4? 6 <î 5 DEL 5 DPI 5 OEL 5 OEL 5 DFL 5 DFL 5 DEL c; r>f( 20?\ 21?? 22?? 22?1 5ft?? 14 PRLT 14 PR T PRLT IP 14 PRLT PRLT 14 PRI T 3 14 PRLT OQ\ T ] ,02o 48706ns.Rn& ?nn473Ti n? Rn446-<9«.A ?Rft4m.A m * * * * * DEL PRLT ft DEL PRLT ft Ie! 5 DFL?\ PRI T 4870R0A.R ln,» Q OEL PRLT L JBLLT 40 J O...5_D i 21 IB _,X.4 RRLJ 48X * OEL PRLT DEL PRLT R « OEL PRLT S F i g. 8. num erical form has been stored on m agnetic tape for experim ents in automated cartography and for posterity. In addition, various tabulations of the depth data are available as line-printer listings for quality control and reference purposes (see figures 8 and 9). At this tim e all plots are produced on a drum type increm ental plotter. The type available has a rather large (0.1 inch) step size and results in some work of a crude appearance. Consequently, these plots do not replace the smooth sheet but assist in its preparation. D uring the next year a new fla t bed plotter w ith a smaller step size (.001 inch) w ill be available and w ill result in m ore accurate and m ore aesthetically appealing work. A ll plots are on the U T M projection and are superimposed w ith a 10 cm rectangular grid.
 67 67 70 69 73 73 76 PAGE 20 115 78 81 81 83 84 116 85 86 85 85 79 00 117 79 79 83 118 70 74 69 69 67 65 76 119 65 69 71 74 78 75 120 78 TIDAL REDUCTIONS FT 121 M 67 67 71")
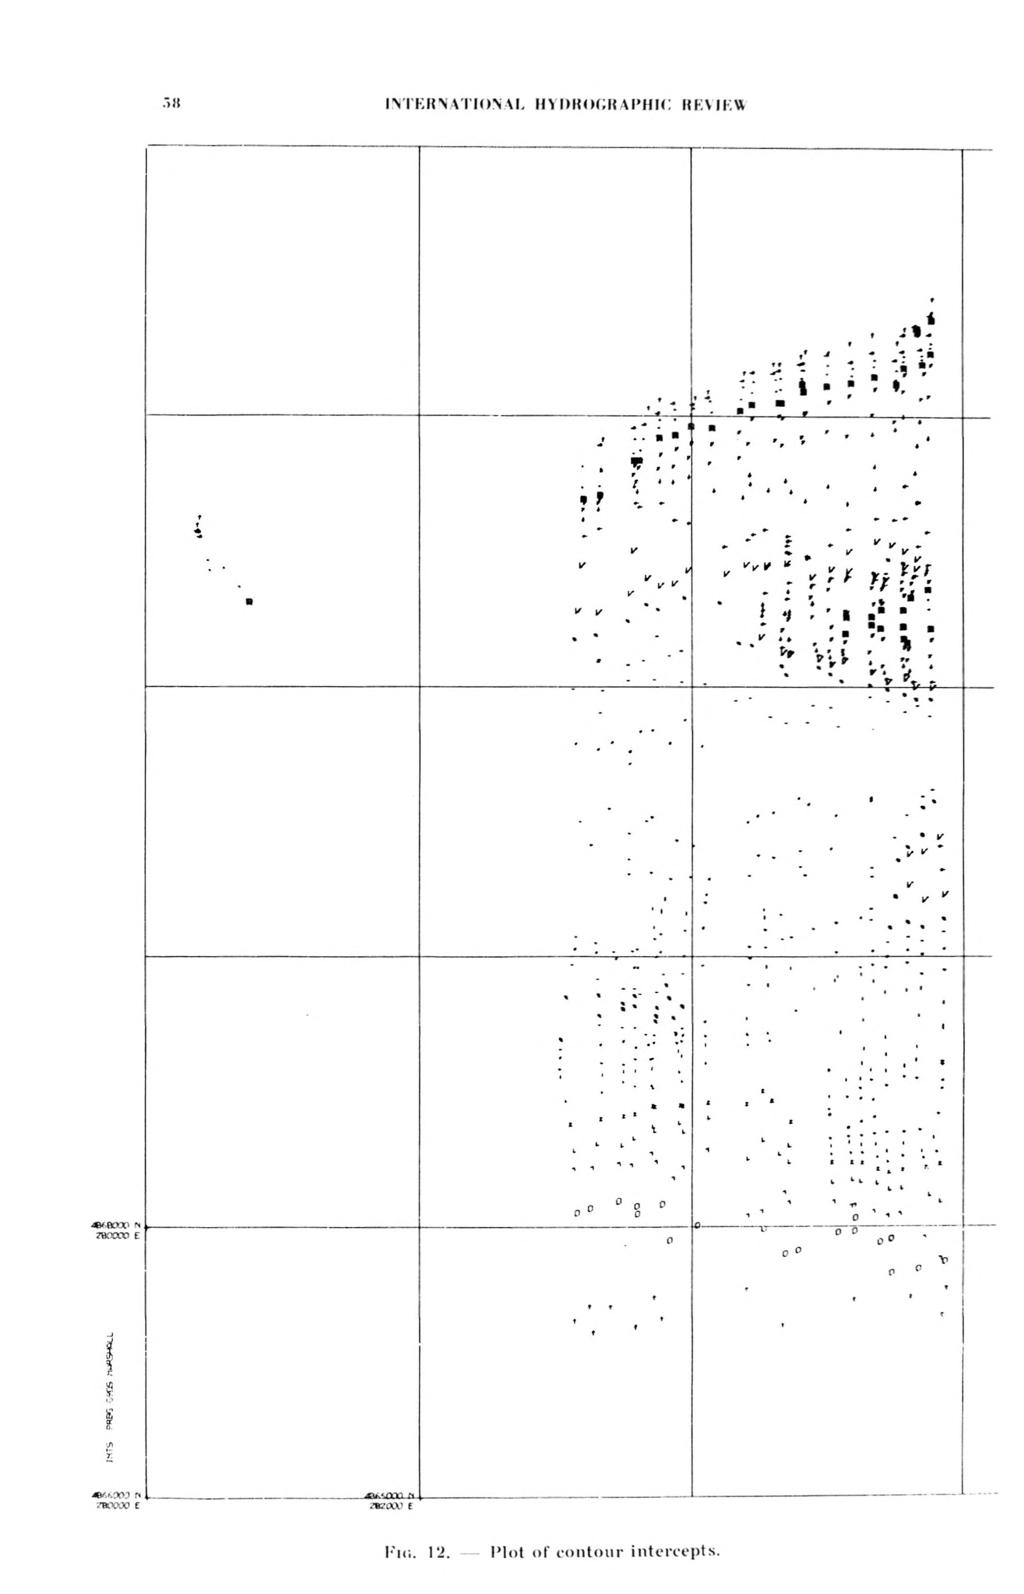
12 EfilAL D-HAC SOUNDING CONVERSION PROGRAM ORTH CARDlNAi PRESQU.LIE SEPT YPE SOUNDER 36AO TIDAL REDUCTION* -3 FT FIX NO. SOUNDING ON FIX ) PAGE TIDAL REDUCTIONS FT 121 M & ? flfi 86 12S H6 8* m 7ft 7 R 7« ? A L29 Si P i g. 9. This relatively small grid minimizes any plotting errors that develop during the drawing. The first plot is a vessel track plot which shows the vessels location at observed positions and shows the track between positions as a fine line. This plot is useful for sorting out erroneous position data and shows gaps in the sounding pattern. The next plot (see figure 10) is sim ilar but in addition shows the location of regular interm ediate depth points by short cross lines and draws the depths themselves at the observed positions. Supplementing this plot is a plot showing all the deep and shallow points (see figure 11). It unfortunately suffers from overprinting problem s which can be prevented in the future by fu rther program m ing. Y et another plot is one which shows
13

14 72B 1, - i. V 4 p s? 17 «,? «4B 23 IS, ; ^ ï. - - «4> «2, «S ^ x s S a 11 * *2? ^ Z-«7B «C S 5» /. 41 /3 æ *» 41 * ««* * S i t i si J7 26 g» 60 n S3 c 64 % * = * *!? 1 «O Î : 51» 73» fee,?. < *? 2 *» 7 7 4» 4 1 ¾ ^ ^ 8 s r S* 64 S7 4 7» si 606* «J *7 62 « ^ S 7Z 46 Si *i «^ % SB 59 0 t a S6 i4 & 64 «f e * 6-4,, *. ^ B8 81 B7 > 4 *»»4» wj 7 4 «Si S7 u * 7 "» * K «g» SS 7A 7S 7» ) QO -r* & i 5 73¾7 «Ï, T O 70 «i? W 77 w bz 8 ^ 7 ^ >0 >18 8 «r *> >4»7 * 1C, >? w 4CK. 401 JOS i,j ^ <ro ** g i 1«J02, œ t 117 *» 415 2KXW0 E accoo Ë
15

16 the contour intercepts by a series of symbols (see figu re 12). These various plots are used in the follow in g manner: The plot of deep and shallow points is used in conju nction w ith the contour intercept plot to qu ickly draw contours o f the bottom topography by hand. It appears that this type o f display can give the hydrographer in the field a clear picture o f the features o f the seabed, in particular the shoal areas. The plot o f shallow and deep points can also be used w ith the plot o f depths at observed positions and w ith a list of all soundings (see figure 9) to help in the hand preparation o f the Smooth or F ield Sheet. The autom atically prepared plots are placed underneath the plastic smooth sheet and aid in the hand inking of soundings on this sheet. Some experim ents have been made to autom atically compute and draw the depth contours. Although the resulting contour lines are rather angular and m ay be displeasing to the eye of the cartographer they do in fact clearly show the bottom features. Other experim ents have been made to draw all soundings on one sheet. Provided the vessel has covered the area regularly, as in an electronic survey, the depth figures can be clearly shown. However, if the survey lines run close together overprinting occurs w ith the present coarse plotter. Using the new plotter and more detailed program m ing it w ill be possible to produce acceptable plots that show all depths and hopefu lly it w ill then be possible to autom atically produce the final smooth sheet itself. In conclusion it may be said that the Hypos system provides a fa irly gentle w ay for an organization to enter the autom ation era. The only m ajor capital expense is the Pencil Follow er. General purpose com puters and small plotters are available nowadays in most large cities on a rental basis. Although most hydrographers w ill prefer to process their data at the survey location it should be pointed out that not only w ill this involve the high cost o f purchasing several small com puters but that at present program m ing sm all com puters is generally more d ifficu lt than program m ing the larger machines.
POLAPLOT : AN AUTOMATIC HYDROGRAPHIC DATA LOGGING AND PROCESSING SYSTEM
 POLAPLOT : AN AUTOMATIC HYDROGRAPHIC DATA LOGGING AND PROCESSING SYSTEM by The H ydrographic Service, Port of London Authority DEVELOPMENT For some years the Port of London s Hydrographic Service had been
THE RAPID DIGITISATION OF TIDE CHART RECORDS
 International Hydrographic Reuiew, Monaco, LV (2), July 1978. THE RAPID DIGITISATION OF TIDE CHART RECORDS by W.R. BLAIN & N.B. W E B B E R Department of Civil Engineering, University of Southampton, U.K.
Road Data Input System using Digital Map in Roadtraffic
 Data Input System using Digital Map in traffic Simulation Namekawa,M 1., N.Aoyagi 2, Y.Ueda 2 and A.Satoh 2 1 College of Management and Economics, Kaetsu University, Tokyo, JAPAN 2 Faculty of Engineering,
INTERNATIONAL HYDROGRAPHIC SURVEY STANDARDS
 INTERNATIONAL HYDROGRAPHIC SURVEY STANDARDS by Gerald B. MILLS 1 I. Background The International Hydrographic Organization (IHO) traces its origin to the establishment of the International Hydrographic
Chartwork Learn the basics for position fixing using a number of techniques and a simple equation for speed, distance and time.
 Chartwork Learn the basics for position fixing using a number of techniques and a simple equation for speed, distance and time. Chartwork Chartwork Tools Accurate chart work is the basis for good navigation.
HYDROGRAPHIC AND TIDAL INFORMATION FOR DEEP DRAUGHT SHIPS IN A TIDAL ESTUARY
 HYDROGRAPHIC AND TIDAL INFORMATION FOR DEEP DRAUGHT SHIPS IN A TIDAL ESTUARY by Lt. Commander J. C. E. W h i t e, R.N., (Retd.) Port o f London A u thority This paper was presented at the XHIth International
AN OFFSHORE TIDE GAUGE
 AN OFFSHORE TIDE GAUGE by Toshio Y a m a d a and Kinji I w a d a Hydrographic Department of Japan 1. INTRODUCTION Between October and December 1970 the Hydrographic Department of Japan carried out jointly
Hydrographic Surveying Methods, Applications and Uses
 Definition: Hydrographic Surveying Methods, Applications and Uses It is the branch of surveying which deals with any body of still or running water such as a lake, harbor, stream or river. Hydrographic
S-44 edition 5 The IHO s New Standard For Hydrographic Surveys Chris Howlett Head of Seabed Data Centre United Kingdom Hydrographic Office
 S-44 edition 5 The IHO s New Standard For Hydrographic Surveys Chris Howlett Head of Seabed Data Centre United Kingdom Hydrographic Office Chairman of IHO Working Group that created S-44 edition 5 S-44
NEED FOR SUPPLEMENTAL BATHYMETRIC SURVEY DATA COLLECTION
 305 West Grand Avenue, Suite 300 Montvale, New Jersey 07645 Phone 201.930.9890 Fax 201.930.9805 www.anchorqea.com M EMORANDUM To: Caroline Kwan and Nica Klaber U.S. Environmental Protection Agency Region
Wade Reynolds 1 Frank Young 1,2 Peter Gibbings 1,2. University of Southern Queensland Toowoomba 4350 AUSTRALIA
 A Comparison of Methods for Mapping Golf Greens Wade Reynolds 1 Frank Young 1,2 Peter Gibbings 1,2 1 Faculty of Engineering and Surveying 2 Australian Centre for Sustainable Catchments University of Southern
AN EVALUATION OF THE BO SUN MULTI-BEAM SONAR SYSTEM
 International Hydrographie Review, M onaco, L I I ( 2 ), J u ly 1975 AN EVALUATION OF THE BO SUN MULTI-BEAM SONAR SYSTEM by R. B u r k e and J. R o b s o n Hydrographie Development Group, Canadian Hydrographie
ENVIRONMENT AGENCY GREAT OUSE AND 100 FT DRAIN QUARTERLY BATHYMETRIC SURVEY DECEMBER 2013 SITE SURVEY REPORT NO. H6787
 ENVIRONMENT AGENCY GREAT OUSE AND 100FT DRAIN QUARTERLY BATHYMETRIC SURVEY DECEMBER 2013 NO. H6787 LONGDIN & BROWNING (SURVEYS) LIMITED CHERRY TREE HOUSE CARMARTHEN ROAD SWANSEA SA1 1HE H6787 1 Measured
METHODS EMPLOYED IN LOCATING SOUNDINGS
 METHODS EMPLOYED IN LOCATING SOUNDINGS The soundings are located with reference to the shore traverse by observations made (i) entirely from the boat, (ii) entirely from the shore or (iii) from both. The
RESOLUTION A.817(19) adopted on 23 November 1995 PERFORMANCE STANDARDS FOR ELECTRONIC CHART DISPLAY AND INFORMATION SYSTEMS (ECDIS)
 adopted on 23 November 1995 PERFORMANCE STANDARDS FOR ELECTRONIC CHART DISPLAY AND INFORMATION SYSTEMS (ECDIS)") A 19/Res.817 15 December 1996 Original: ENGLISH ASSEMBLY 19th session Agenda item 10 RESOLUTION A.817(19) adopted on 23 November 1995 PERFORMANCE STANDARDS FOR ELECTRONIC CHART DISPLAY AND INFORMATION
A 19/Res.817 15 December 1996 Original: ENGLISH ASSEMBLY 19th session Agenda item 10 RESOLUTION A.817(19) adopted on 23 November 1995 PERFORMANCE STANDARDS FOR ELECTRONIC CHART DISPLAY AND INFORMATION
Engineering Surveying - II CE313. Hydrographic Survey Lecture 06 Muhammad Noman
 Engineering Surveying - II CE313 Hydrographic Survey Lecture 06 Muhammad Noman Hydrographic Surveying Hydrographic surveying is the branch of the survey which deal with any body of still or running water
AUTOMATIC DREDGING PROFILE AND CONTOUR CONTROL
 AUTOMATIC DREDGING PROFILE AND CONTOUR CONTROL Jay Wise 1 ABSTRACT Phillips and Jordan, a leading excavating and disaster recovery contractor, was faced with the challenge to manage a civil contract involving
Figure 1 Example feature overview.
 1. Introduction This case focuses on the northeastern region of Onslow Bay, NC, and includes an initial shoreline, regional contour, wave gauges, inlets, dredging, and beach fills. Most of the features
DRAFT. October 17, 2014 File No Mr. Brendhan Zubricki Town Administrator Essex Town Hall 30 Martin Street Essex, MA.
 GZA GeoEnvironmental, Inc. Engineers and Scientists October 17, 2014 File No. 18.0171857.00 Mr. Brendhan Zubricki Town Administrator Essex Town Hall 30 Martin Street Essex, MA. 01929 DRAFT Re: Essex River
VEHICULAR TRAFFIC PROGRESSION TIME-SPACE PLOT PROGRAM
 VEHICULAR TRAFFIC PROGRESSION TIME-SPACE PLOT PROGRAM Texas Highway Department Division of Automation Revised 1973 This program is a modified version of a program written by IBM. The original program made
NIGERIAN NOTICES TO MARINERS November 2017 EDITION PUBLISHED BY THE HYDROGRAPHIC OFFICE LAGOS. Notice 01 November 2017 Supplied Gratis
 NIGERIAN NOTICES TO MARINERS November 2017 EDITION PUBLISHED BY THE HYDROGRAPHIC OFFICE LAGOS Notice 01 November 2017 Supplied Gratis November 2017 CONTENTS I II Explanatory Notes and Index Nigerian Navy
ICES Guidelines for Multibeam Echosounder Data (Compiled September 2006)
") ICES Guidelines for Multibeam Echosounder Data (Compiled September 2006) If you are considering producing a hydrographic survey please read the following information first. Your survey could be used to
ICES Guidelines for Multibeam Echosounder Data (Compiled September 2006) If you are considering producing a hydrographic survey please read the following information first. Your survey could be used to
AC : MEASUREMENT OF HYDROGEN IN HELIUM FLOW
 AC 2010-2145: MEASUREMENT OF HYDROGEN IN HELIUM FLOW Randy Buchanan, University of Southern Mississippi Christopher Winstead, University of Southern Mississippi Anton Netchaev, University of Southern Mississippi
E4014 Construction Surveying. Hydrographic Surveys
 E4014 Construction Surveying Hydrographic Surveys Charts And Maps Hydrographic Chart an information medium and a tool for maritime traffic for the safety and ease of navigation contains information on
PERFORMANCE STANDARDS FOR ELECTRONIC CHART DISPLAY AND INFORMATION SYSTEMS (ECDIS) [IMO Resolutions A.817 (19), MSC.64 (67) and MSC.
 [IMO Resolutions A.817 (19), MSC.64 (67) and MSC.") 1 PERFORMANCE STANDARDS FOR ELECTRONIC CHART DISPLAY AND INFORMATION SYSTEMS (ECDIS) [IMO Resolutions A.817 (19), MSC.64 (67) and MSC.86 (70)] (amended March 1999) Note: The IMO Performance Standards for
1 PERFORMANCE STANDARDS FOR ELECTRONIC CHART DISPLAY AND INFORMATION SYSTEMS (ECDIS) [IMO Resolutions A.817 (19), MSC.64 (67) and MSC.86 (70)] (amended March 1999) Note: The IMO Performance Standards for
Mastering the Mechanical E6B in 20 minutes!
 Mastering the Mechanical E6B in 20 minutes Basic Parts I am going to use a Jeppesen E6B for this write-up. Don't worry if you don't have a Jeppesen model. Modern E6Bs are essentially copies of the original
SIDRA INTERSECTION 6.1 UPDATE HISTORY
 Akcelik & Associates Pty Ltd PO Box 1075G, Greythorn, Vic 3104 AUSTRALIA ABN 79 088 889 687 For all technical support, sales support and general enquiries: support.sidrasolutions.com SIDRA INTERSECTION
PORTS AUSTRALIA. PRINCIPLES FOR GATHERING AND PROCESSING HYDROGRAPHIC INFORMATION IN AUSTRALIAN PORTS (Version 1.5 November 2012)
") PORTS AUSTRALIA PRINCIPLES FOR GATHERING AND PROCESSING HYDROGRAPHIC INFORMATION IN AUSTRALIAN PORTS (Version 1.5 November 2012) PREFACE These Principles have been prepared by the Hydrographic Surveyors
PORTS AUSTRALIA PRINCIPLES FOR GATHERING AND PROCESSING HYDROGRAPHIC INFORMATION IN AUSTRALIAN PORTS (Version 1.5 November 2012) PREFACE These Principles have been prepared by the Hydrographic Surveyors
DQM Annual Hopper QA Checks
 DQM Annual Hopper QA Checks The following document is intended to be a guide for conducting annual Dredge Quality Management quality assurance checks on hopper dredges. The procedures should provide general
Evaluation of the Klein HydroChart 3500 Interferometric Bathymetry Sonar for NOAA Sea Floor Mapping
 Evaluation of the Klein HydroChart 3500 Interferometric Bathymetry Sonar for NOAA Sea Floor Mapping Yuhui Ai, Straud Armstrong and Dean Fleury L-3 Communications Klein Associates, Inc. 11 Klein Dr. Salem,
Search Techniques. Contents
 Search Techniques Contents Overview... 2 1. Developing the Search Plan... 2 1.1 Search Planning Sequence... 2 2. Search Terminology... 3 3. Search Patterns... 6 4. Searching and GPS... 8 5. Search Protocols...
INSTRUMENT INSTRUMENTAL ERROR (of full scale) INSTRUMENTAL RESOLUTION. Tutorial simulation. Tutorial simulation
 INSTRUMENTAL RESOLUTION. Tutorial simulation. Tutorial simulation") Lab 1 Standing Waves on a String Learning Goals: To distinguish between traveling and standing waves To recognize how the wavelength of a standing wave is measured To recognize the necessary conditions
Lab 1 Standing Waves on a String Learning Goals: To distinguish between traveling and standing waves To recognize how the wavelength of a standing wave is measured To recognize the necessary conditions
HYDROGRAPHIC AND SITE SURVEY REPORT
 HYDROGRAPHIC AND SITE SURVEY REPORT Proposed Pen Site at Dounie, Sound of Jura Prepared for: Kames Fish Farming Ltd Kilmelford Argyll PA34 4XA Tel: +44 (0)1631 720699 TransTech Limited www.transtechltd.com
1.1 Berth Alignment Between Long Island Point and BlueScope Jetties
 In May 16 the Special Minister of State asked Infrastructure Victoria to provide advice on the future capacity of Victoria s commercial ports. Specifically, the Minister has asked for advice on when the
Naval Postgraduate School, Operational Oceanography and Meteorology. Since inputs from UDAS are continuously used in projects at the Naval
 How Accurate are UDAS True Winds? Charles L Williams, LT USN September 5, 2006 Naval Postgraduate School, Operational Oceanography and Meteorology Abstract Since inputs from UDAS are continuously used
Energy capture performance
 Energy capture performance Cost of energy is a critical factor to the success of marine renewables, in order for marine renewables to compete with other forms of renewable and fossil-fuelled power generation.
BASELINE SURVEY, VISUAL - SITE SPECIFIC
 BASELINE SURVEY, VISUAL - SITE SPECIFIC Introduction As stated in SEPA s policy and in the Fish Farm Manual (1998), scientific data are required by SEPA in order to assess the existing condition on the
Lat. & Long. Review. Angular distance N or S of equator Equator = 0º Must indicate N or S North pole = 90º N
 Navigation Part 2 1 Lesson Objectives Understand how a ships compass works and how it is used for navigation Measure distances on nautical charts Plot a course on a nautical chart Correct course headings
ANNEX 24 RESOLUTION MSC.232(82) (adopted on 5 December 2006)
 (adopted on 5 December 2006)") RESOLUTION MSC.232(82) (adopted on 5 December 2006) ADOPTION OF THE REVISED PERFORMANCE STANDARDS FOR ELECTRONIC CHART DISPLAY AND INFORMATION SYSTEMS (ECDIS) THE MARITIME SAFETY COMMITTEE, RECALLING Article
RESOLUTION MSC.232(82) (adopted on 5 December 2006) ADOPTION OF THE REVISED PERFORMANCE STANDARDS FOR ELECTRONIC CHART DISPLAY AND INFORMATION SYSTEMS (ECDIS) THE MARITIME SAFETY COMMITTEE, RECALLING Article
Online Scorekeeper Operational Guide ACCESSING YOUR SCOREKEEPER INTERFACE
 The Virtual Scoreboard Network Online Scorekeeper Operational Guide ACCESSING YOUR SCOREKEEPER INTERFACE When you create your game scoreboard on The Virtual Scoreboard Network, you will be provided with
9-METRE SURVEY MOTOR BOATS OF THE HYDROGRAPHIC SERVICE OF THE ROYAL NAVY
 International Hydrographie Review, Monaco, LVIII (1), January 1981 9-METRE SURVEY MOTOR BOATS OF THE HYDROGRAPHIC SERVICE OF THE ROYAL NAVY by Lt. Cdr. R. L. BASHFORTH, R. N. INTRODUCTION The six 35-feet
13. TIDES Tidal waters
 Water levels vary in tidal and non-tidal waters: sailors should be aware that the depths shown on the charts do not always represent the actual amount of water under the boat. 13.1 Tidal waters In tidal
Sontek RiverSurveyor Test Plan Prepared by David S. Mueller, OSW February 20, 2004
 Sontek RiverSurveyor Test Plan Prepared by David S. Mueller, OSW February 20, 2004 INTRODUCTION Sontek/YSI has introduced new firmware and software for their RiverSurveyor product line. Firmware changes
Plot the Path into the Harbor
 Plot the Path into the Harbor By Mary Anne Otten, Rudyard Area Schools and Joan Chadde, Michigan Technological University Subject/Grade: Grade 3 6, Math, Social Studies, Science Duration: 35 minutes Lesson
FREEFORM POOL MEASURING GUIDELINES: HOW TO FILL OUT YOUR FREEFORM FORM!
 FREEFORM POOL MEASURING GUIDELINES: HOW TO FILL OUT YOUR FREEFORM FORM! Read instructions fully and carefully both here and on your Freeform Measurements form. Liners are non-refundable and an error in
PART 5 - OPTIONS CONTENTS 5.1 SYSTEM EXPANSION 5-3
 PART 5 - OPTIONS CONTENTS Para Page 5.1 SYSTEM EXPANSION 5-3 5.2 SENSORS 5-3 5.2.1 Trim Angle Sensor 5-3 5.2.2 Mast Rotation Sensor 5-3 5.2.3 Heel Angle Sensor 5-3 5.2.4 Barometric Pressure Sensor 5-3
Calculation of Trail Usage from Counter Data
 1. Introduction 1 Calculation of Trail Usage from Counter Data 1/17/17 Stephen Martin, Ph.D. Automatic counters are used on trails to measure how many people are using the trail. A fundamental question
SAMPLE MAT Proceedings of the 10th International Conference on Stability of Ships
 and Ocean Vehicles 1 Application of Dynamic V-Lines to Naval Vessels Matthew Heywood, BMT Defence Services Ltd, mheywood@bm tdsl.co.uk David Smith, UK Ministry of Defence, DESSESea-ShipStab1@mod.uk ABSTRACT
Traffic Accident Data Processing
 Traffic Accident Data Processing D o n a l d F. P e t t y Engineer of Traffic Research and Surveys Indiana State Highway Commission The following is a portion of the Highway Safety Program Standards developed
MANUAL. P C - C E N T E R Version Copyright by Dinand van het Reve CONTENTS
 P C - C E N T E R Version 4.00 Copyright 1995-2004 by Dinand van het Reve CONTENTS 1. Introduction 2. Installing PC-CENTER 3. Licence 4. Using PC-CENTER 5. Description of 'Small Windows' 6. Main Menu Description
THE CHALLENGES OF A LARGE-AREA BATHYMETRIC SURVEY
 THE CHALLENGES OF A LARGE-AREA BATHYMETRIC SURVEY Agenda: - Introduction - Tender - Project Planning - Survey - Processing - Delivery - Conclusion 2 Introduction We know less of the oceans at our feet,
Overview. 2 Module 13: Advanced Data Processing
 2 Module 13: Advanced Data Processing Overview This section of the course covers advanced data processing when profiling. We will discuss the removal of the fairly gross effects of ship heave and talk
IEEE RAS Micro/Nano Robotics & Automation (MNRA) Technical Committee Mobile Microrobotics Challenge 2016
 Technical Committee Mobile Microrobotics Challenge 2016") IEEE RAS Micro/Nano Robotics & Automation (MNRA) Technical Committee Mobile Microrobotics Challenge 2016 OFFICIAL RULES Version 2.0 December 15, 2015 1. THE EVENTS The IEEE Robotics & Automation Society
IEEE RAS Micro/Nano Robotics & Automation (MNRA) Technical Committee Mobile Microrobotics Challenge 2016 OFFICIAL RULES Version 2.0 December 15, 2015 1. THE EVENTS The IEEE Robotics & Automation Society
Rule 7 - Risk of collision
 a) Every vessel shall use all available means appropriate to the prevailing circumstances and conditions to determine if risk of collision exists. If there is any doubt such risk shall be deemed to exist.
Cover Page for Lab Report Group Portion. Pump Performance
 Cover Page for Lab Report Group Portion Pump Performance Prepared by Professor J. M. Cimbala, Penn State University Latest revision: 02 March 2012 Name 1: Name 2: Name 3: [Name 4: ] Date: Section number:
GNSS Technology for the Determination of Real-Time Tidal Information
 GNSS Technology for the Determination of Real-Time Tidal Information Benjamin Kidder C-Nav Positioning Solutions European region Outline of Topics Covered Introduction to Tides Past and Present Methods
(fig. 3) must be at the same temperature as the water in this chamber CALORIMETRIC STUDIES OF THE EXTREMITIES
 must be at the same temperature as the water in this chamber CALORIMETRIC STUDIES OF THE EXTREMITIES") CALORIMETRIC STUDIES OF THE EXTREMITIES II. EXPERIMENTAL APPARATUS AND PROCEDURES' By ROY KEGERREIS (Received for publication July 1, 1926) The calorimeter used in these experiments is a modification of
CALORIMETRIC STUDIES OF THE EXTREMITIES II. EXPERIMENTAL APPARATUS AND PROCEDURES' By ROY KEGERREIS (Received for publication July 1, 1926) The calorimeter used in these experiments is a modification of
Preventing Damage to Harbour Facilities and. Ship Handling in Harbours PART 2 INDEX
 Preventing Damage to Harbour Facilities and Ship Handling in Harbours PART 2 INDEX 1 Vessel handling is based on the basic knowledge that a vessel floats in the water and returns to its original position
A PRACTICAL APPROACH TO QUALITY CONTROL AND QUALITY ANALYSIS OF DEPTH DATA
 A PRACTICAL APPROACH TO QUALITY CONTROL AND QUALITY ANALYSIS OF DEPTH DATA ABSTRACT Ulf Olsson, Mats Ericson, Stigbjörn Nilsson, Hans Öiås Hydrographic Office, Swedish Maritime Administration, Sweden Quality
BOTTOM MAPPING WITH EM1002 /EM300 /TOPAS Calibration of the Simrad EM300 and EM1002 Multibeam Echo Sounders in the Langryggene calibration area.
 BOTTOM MAPPING WITH EM1002 /EM300 /TOPAS Calibration of the Simrad EM300 and EM1002 Multibeam Echo Sounders in the Langryggene calibration area. by Igor Kazantsev Haflidi Haflidason Asgeir Steinsland Introduction
OPERATIONS SEAFARER CERTIFICATION GUIDANCE NOTE SA MARITIME QUALIFICATIONS CODE. Deck: Chart Work
 Page 1 of 6 Compiled by Approved by Chief Examiner Syllabus Committee: 26 February 2013 OPERATIONS SEAFARER CERTIFICATION GUIDANCE NOTE SA MARITIME QUALIFICATIONS CODE Deck: Chart Work Page 2 of 6 COLUMN
KS3 Science Practise Test
 KS3 Science Practise Test Name: Class: Date: Time: 40 minutes Marks: 54 marks Comments: Q1. Tea bags are made in different shapes. triangle square circle Some pupils want to find out which shape of tea
Weems & Plath Expanding Square SAR Course Identifier #113
 Weems & Plath Expanding Square SAR Course Identifier #113 A common search pattern used in search and rescue (SAR) operations is called the expanding square pattern, which is just what it says it is. You
EMPA 2017 How can the S-102 Bathymetric Surface Product improve safety in navigation and pilotage?
 EMPA 2017 How can the S-102 Bathymetric Surface Product improve safety in navigation and pilotage? Operated by the Norwegian Mapping Authority, Hydrographic Service FREEDOM TO CHOOSE Content What is the
SHIP FORM DEFINITION The Shape of a Ship
 SHIP FORM DEFINITION The Shape of a Ship The Traditional Way to Represent the Hull Form A ship's hull is a very complicated three dimensional shape. With few exceptions an equation cannot be written that
SPEED PROFILES APPROACHING A TRAFFIC SIGNAL
 SPEED PROFILES APPROACHING A TRAFFIC SIGNAL Robert L. Bleyl*, The University of New Mexico The objective of this study was to examine and compare the speed profiles of traffic approaching a traffic signal
The risk assessment of ships manoeuvring on the waterways based on generalised simulation data
 Safety and Security Engineering II 411 The risk assessment of ships manoeuvring on the waterways based on generalised simulation data L. Gucma Maritime University of Szczecin, Poland Abstract This paper
Project Title: Pneumatic Exercise Machine
 EEL 4924 Electrical Engineering Design (Senior Design) Preliminary Design Report 27 January 2011 Project Title: Pneumatic Exercise Machine Team Members: Name: Gino Tozzi Name: Seok Hyun (John) Yun Email:
CENTER PIVOT EVALUATION AND DESIGN
 CENTER PIVOT EVALUATION AND DESIGN Dale F. Heermann Agricultural Engineer USDA-ARS 2150 Centre Avenue, Building D, Suite 320 Fort Collins, CO 80526 Voice -970-492-7410 Fax - 970-492-7408 Email - dale.heermann@ars.usda.gov
Technical Brief - Wave Uprush Analysis Island Harbour Club, Gananoque, Ontario
 Technical Brief - Wave Uprush Analysis RIGGS ENGINEERING LTD. 1240 Commissioners Road West Suite 205 London, Ontario N6K 1C7 October 31, 2014 Table of Contents Section Page Table of Contents... i List
A real time vessel air gap monitoring system
 Journal of Physics: Conference Series A real time vessel air gap monitoring system To cite this article: D McStay and K Thabeth 2009 J. Phys.: Conf. Ser. 178 012038 View the article online for updates
TOP:001.3 U.S. Fish and Wildlife Service TECHNICAL OPERATING PROCEDURE
 TOP:001.3 March 12, 2015 U.S. Fish and Wildlife Service Marquette Biological Station 3090 Wright Street Marquette, Michigan 49855 U.S.A. and U.S. Fish and Wildlife Service Ludington Biological Station
Opleiding Informatica
 Opleiding Informatica Determining Good Tactics for a Football Game using Raw Positional Data Davey Verhoef Supervisors: Arno Knobbe Rens Meerhoff BACHELOR THESIS Leiden Institute of Advanced Computer Science
Specifications for the CMI 2409 Magnetocardiograph
 Specifications for the CMI 2409 Magnetocardiograph Revision date April 14, 2006 1 518-381-1000 (tel) The CMI-2409 system consists of a holder (A), a patient bed (B) and a workstation (not shown in the
V Complying with IHO S-52/S-63/S-64
 Model FEA-2107/2807 V.06.50 Complying with IHO S-52/S-63/S-64 The software has been upgraded to V.06.50 in accordance with the IHO standards. IHO S-52 Ed. 6.1.1 Specifications for Chart Contents and Display
14/10/2013' Bathymetric Survey. egm502 seafloor mapping
 egm502 seafloor mapping lecture 10 single-beam echo-sounders Bathymetric Survey Bathymetry is the measurement of water depths - bathymetry is the underwater equivalent of terrestrial topography. A transect
GEOL 106: Earthquake Country Activity 08: Discharge Measurements. Name: Date:
 Name: Date: Discharge Calculation Discharge = Velocity X Area or Q = VA Calculate the Discharge for the measurements shown at the right. Q = Discharge Measurement Do not collect water samples in the area
Transportation Engineering II Dr. Rajat Rastogi Department of Civil Engineering Indian Institute of Technology - Roorkee
 Transportation Engineering II Dr. Rajat Rastogi Department of Civil Engineering Indian Institute of Technology - Roorkee Lecture 31 Runway Orientation Dear students, I welcome you back to the lecture series
Anatomy of a Depth Survey
 1 Anatomy of a Depth Survey Part I General Considerations Tom O Donnell, AP Miles River Squadron 2 Why do depth surveys? NOAA, through its Office of Coast Survey, is mandated to keep our nautical charts
THE USE OF SPATIAL STATISTICS IN HYDROGRAPHY
 International Hydrographie Review, Monaco, LXIX(l), March 1992 THE USE OF SPATIAL STATISTICS IN HYDROGRAPHY by Peter KIELLAND 1 and Michel DAGBERT 2 Paper presented at the Canadian Hydrographic Conference
GNX 20/21. Owner s Manual
 GNX 20/21 Owner s Manual March 2016 190-01659-00_0C All rights reserved. Under the copyright laws, this manual may not be copied, in whole or in part, without the written consent of Garmin. Garmin reserves
Note to Shipbuilders, shipowners, ship Managers and Masters. Summary
 MARINE GUIDANCE NOTE MGN 301 (M+F) Manoeuvring Information on Board Ships Note to Shipbuilders, shipowners, ship Managers and Masters This note supersedes Marine Guidance Note MGN 201 (M+F) Summary The
THE CANDU 9 DISTRffiUTED CONTROL SYSTEM DESIGN PROCESS
 THE CANDU 9 DISTRffiUTED CONTROL SYSTEM DESIGN PROCESS J.E. HARBER, M.K. KATTAN Atomic Energy of Canada Limited 2251 Speakman Drive, Mississauga, Ont., L5K 1B2 CA9900006 and M.J. MACBETH Institute for
FIG: 27.1 Tool String
 Bring up Radioactive Tracer service. Click Acquisition Box - Edit - Tool String Edit the tool string as necessary to reflect the tool string being run. This is important to insure proper offsets, filters,
Safety Assessment of Installing Traffic Signals at High-Speed Expressway Intersections
 Safety Assessment of Installing Traffic Signals at High-Speed Expressway Intersections Todd Knox Center for Transportation Research and Education Iowa State University 2901 South Loop Drive, Suite 3100
Real Time Surveying GPS and HYDRO Software for Tide and Swell Compensation
 Real Time Surveying GPS and HYDRO Software for Tide and Swell Compensation by Mr Michael Walker, B.Surv. (Otago) HYDRO Division Trimble Navigation New Zealand Ltd. Abstract This paper focuses on the use
Please contact our Education Officer if you are interested in any of these courses.
 Please contact our Education Officer if you are interested in any of these courses. Lt/Cdr Jack McKinnon, AP 770-365-9576 or Jakmck@frontier.com Elective Courses Six Elective Courses are offered by USPS.
Navigation & Orienteering: Pre- Test
 Name: Class: Answer Key Date: Page 1 of 7 Navigation & Orienteering: Pre- Test There are three sections: Multiple Choice, True/False, and Short Answer. For the multiple choice, please select the BEST answer
Homework 2 Bathymetric Charts [based on the Chauffe & Jefferies (2007)]
![Homework 2 Bathymetric Charts [based on the Chauffe & Jefferies (2007)]](/thumbs/75/72427079.jpg "Homework 2 Bathymetric Charts [based on the Chauffe & Jefferies (2007)]") 1 MAR 110 HW-2 - Bathy Charts Homework 2 Bathymetric Charts [based on the Chauffe & Jefferies (2007)] 2-1. BATHYMETRIC CHARTS Bathymetric charts are maps of a region of the ocean used primarily for navigation
1 MAR 110 HW-2 - Bathy Charts Homework 2 Bathymetric Charts [based on the Chauffe & Jefferies (2007)] 2-1. BATHYMETRIC CHARTS Bathymetric charts are maps of a region of the ocean used primarily for navigation
Homework 2a Bathymetric Charts [based on the Chauffe & Jefferies (2007)]
![Homework 2a Bathymetric Charts [based on the Chauffe & Jefferies (2007)]](/thumbs/73/69074241.jpg "Homework 2a Bathymetric Charts [based on the Chauffe & Jefferies (2007)]") 14 August 2008 MAR 110 HW-2a: ex1bathymetric Charts 1 2-1. BATHYMETRIC CHARTS Homework 2a Bathymetric Charts [based on the Chauffe & Jefferies (2007)] Nautical charts are maps of a region of the ocean
14 August 2008 MAR 110 HW-2a: ex1bathymetric Charts 1 2-1. BATHYMETRIC CHARTS Homework 2a Bathymetric Charts [based on the Chauffe & Jefferies (2007)] Nautical charts are maps of a region of the ocean
NEW SURVEY MOTOR LAUNCHES FOR THE ROYAL AUSTRALIAN NAVY
 International Hydrographic Review, Monaco, LXVI(l), January 1989 NEW SURVEY MOTOR LAUNCHES FOR THE ROYAL AUSTRALIAN NAVY by Commander John LEECH, RAN (*) INTRODUCTION By any standards the task facing the
SAFETY OF NAVIGATION OPERATING ANOMALIES IDENTIFIED WITHIN ECDIS
 E 4 ALBERT EMBANKMENT LONDON SE1 7SR Telephone: +44 (0)20 7735 7611 Fax: +44 (0)20 7587 3210 SN.1/Circ.312 9 July 2012 SAFETY OF NAVIGATION OPERATING ANOMALIES IDENTIFIED WITHIN ECDIS 1 The Sub-Committee
indd indd
 122 Safety silencers 3 124-125 introduction 126-127 overview of our products 128-129 dimensioning guidelines 130-131 sizes 1/8 1/2 132-133 sizes 1 2 134-135 special silencers, accessories 136-137 applications
APPLICATION OF GPS RTK TECHNIQUE TO SHIP HULL TRAJECTORY DETERMINATION DURING LAUNCHING
 POSTER PAPER SESSION APPLICATION OF GPS RTK TECHNIQUE TO SHIP HULL TRAJECTORY DETERMINATION DURING LAUNCHING Zofia Rzepecka, Alojzy Wasilewski Institute of Geodesy, University of Warmia and Mazury in Olsztyn
AC : A LABORATORY EXERCISE TO DEMONSTRATE HOW TO EXPERIMENTALLY DETERMINE THE OPERATING POINT FOR A FAN
 AC 2007-206: A LABORATORY EXERCISE TO DEMONSTRATE HOW TO EXPERIMENTALLY DETERMINE THE OPERATING POINT FOR A FAN Robert Edwards, Pennsylvania State University-Erie Robert Edwards is currently a Lecturer
1. Outline of the newly developed control technologies
 This paper describes a vertical lifting control and level luffing control design for newly developed, fully hydraulicdriven floating cranes. Unlike lattice boom crawler cranes for land use, the floating
MAPPING DESCRIPTIONS AND DRAFTING PARCEL BOUNDARIES FOR CADASTRAL MAPPING
 MAPPING DESCRIPTIONS AND DRAFTING PARCEL BOUNDARIES FOR CADASTRAL MAPPING Chapter 6 2015 Cadastral Mapping Manual 6-0 Another method of describing land, aside from the fractional section method, is called
Basic Chartwork. Necessary Tools. Navigation is the one science in which no margin whatever is left for the faker. - Felix Riesenberg
 Page 1 of 14 www.bananawind.us Navigation is the one science in which no margin whatever is left for the faker. - Felix Riesenberg Basic Chartwork You wouldn't want to attempt open ocean sailing using
Technical Bulletin, Communicating with Gas Chromatographs
 Last Updated: 13- July-2010 TB-080000C Technical Bulletin, Communicating with Gas Chromatographs OMNI FLOW COMPUTERS, INC. 12620 West Airport Boulevard, Suite 100 Sugar Land, Texas 77478 United States
What s Up in Navigation Displays?
 What s Up in Navigation Displays? Captain PAUL CHAPMAN paul.chapman@compassadjuster.com.au 2009 What s up in Navigation Displays? Captain Paul Chapman Situation Awareness When following a passage plan,