State of the Snow Sports Industry August 24, 2012
|
|
|
- Benedict Ford
- 6 years ago
- Views:
Transcription


1 State of the Snow Sports Industry August 24,
2 VISION & MISSION STATEMENT VISION To make North America the best snow sports market in the world. MISSION SnowSports Industries America is a not-for-profit member owned trade association whereby competing product and service suppliers work together for the development and growth of the snow sports industry. In support of this, SIA is committed to: Managing and operating trade shows and/or other solutions to assist our members in bringing their products to market. Providing programs, services and information that will assist members in improving their business operations. Working together with reps, retailers, resorts and other entities for the development of the snow sports industry Promoting awareness and participation in snow sports 2


3 SIA PRESIDENT: David Ingemie Marketing Director President Board Roles: United Ski & Snowboard Association Rails to Trails Conservancy National Ski Hall of Fame and Museum New England Ski Museum International Skiing History Association Member of PSIA Passions: Cycling Skiing Snowboarding First Ski Club: Flopenofen Ski Club, Fitchburg, MA 3
4 INDUSTRY PLAYERS: SNOW SPORTS INDUSTRY ANNUAL REVENUE THANK YOU CONSUMERS Retailers $3.3B Suppliers $1.5B Snow Sports Industry Resorts $7B Source: SIA Snow Sports RetailTRAK, NSAA Economic Analysis of U.S. Ski Areas, SIA Sales Report 4
5 STATE OF THE MARKETPLACE Consumer s Perspective Recovery from the recession very slow for younger workers Wage growth flat Continued lack of vacation time and discretionary income Fuel, food, and apparel prices are rising Snow conditions terrible this season Supplier s Perspective Pre-season equipment orders for equipment for 2012/2013 down 10% to 50% in equipment Marketing strategies meet with mixed success in new social media driven society Manufacturing costs overseas increasing due to labor initiatives, tariffs, materials costs increases, and currency policy Retailer s Perspective Snow not falling, consumers not buying Inventories required deep discounting in February Margins down in all categories Cash flow is a trickle Look to warm weather product to bring in customers and cash Resort s Perspective Skier visits down 5% to 40% at resorts Short season Participants age 25 to 35 have less time and discretionary income Baby boomers leaving the slopes at 150,000 per year with smaller Gen X behind them 5

6 THE SNOW SPORTS MARKET Lack of snow explains the difference between 2010/2011 and 2011/2012 Channels: Specialty, $2B down 14% in units and down 5% in dollars Internet, $733M - up 11% in units and up 12% in dollars Chain Stores, $745M down 19% in units and down 12% in dollars Retail Births and Deaths** As of today, there are 2443 retail managements in the US, representing 4668 storefronts/doors. Source: *SIA RetailTRAK BY The Leisure Trends Group, August to March 2011/2012, **SIA Retail Database


7 MARKET OVERVIEW Total: $3.3b Total: 19.8m
8 PARTICIPATION AND SPENDING Season Alpine Ski and Snowboard Participation Alpine and Snowboard Equipment $ Skier/Rider Visits Avg. Equipment $ per Participant 2006/ m $731.8m 55.1m $ / m $827m 60.5m $ / m $718.5m 57.4m $ / m $738.6m 59.8m $ / m $826.8m 60.5m $ / m $799.1m 50.8m $50.37 Source: SIA RetailTRAK by Leisure Trends Group, NSAA Kottke End of Season Report, SIA Participation Study produced by the PAC 8

9 2012/2013 WEATHER FORECAST Based on current observations and dynamical model forecasts, El Niño conditions will drive winter weather in the 2012/2013 season. Typically, El Nino produces warmer and drier weather north of the Mason-Dixon Line, and cooler and wetter weather in the south. Pacific Northwest The last El Niño could bring wet and warmer than average conditions to the NW. In fact, less than ideal snow conditions during the 2010 Olympics were caused by the El Niño pattern Rocky Mountains: Colorado and Utah may have some abundant early snow followed by a dry period and then lots of spring snow. Midwest: Lake effect snow from the Great Lakes may be hampered by warmer temperatures caused by El Niño. East: El Niño snow years average above normal for the nine largest Northeastern cities particularly in late January to April. December snowstorms and snow over the holidays nationwide could drive snow sports sales up significantly in December and snow across the Appalachian range, cooler temperatures and unusual snowfall as far south as Houston, TX could drive apparel and accessories sales throughout the winter. Mid-Atlantic Higher than average snowfall and below average temperatures January-March. The last El Niño brought what is commonly referred to as Snowmaggedon to the Eastern Seaboard in February Source: National Oceanographic and Atmospheric Administration [NOAA], ENSO Climate.


10 ACORNS! 10
11 11
12 ALPINE SKI EXECUTIVE SUMMARY Alpine ski equipment brought in over $536M this season, up 1% from 2010/2011. Chain Shops: $27M, down 41% in units and down 36% in dollars Specialty Shops: $430M, up 2% in units and dollars Internet Shops: $79M, up 27% in units and up 24% in dollars Poor weather left swollen inventories in retail shops at the end of March 2012, the highest in four seasons with 32% more product in their back rooms. Alpine Skis: up 33% in inventory units and dollars Alpine Boots: up 28% in inventory units, up 23% in inventory dollars Alpine Bindings: up 38% in inventory units, up 35% in inventory dollars Alpine Poles: up 38% in inventory units and dollars Last season 47 brands produced 1,490 models that had measurable sales through retail channels. 12
13 EXECUTIVE SUMMARY (CONTINUED) The majority of casual skiers are ages (21%), while the majority of core skiers are (17%). Serious alpine skiers are more likely to participate beyond age 55 than casual skiers; 15% of core skiers are ages 55+, while only 8% of casual skiers make up this age group. The average alpine skiers makes it to the mountain 7.4 days in a season, which is consistent with last year. Backcountry trails continues to grow in popularity with alpine skiers. 15.8% of alpine skiers skied on resort backcountry/ungroomed trails 4.2% of alpine skiers made it out to non-resort backcountry/ungroomed trails What drove alpine equipment sales through the 2011/2012 season? Reverse/mixed camber skis continue to flourish at retail, adult-specific models finished the season up 84% in units and 80% in dollars, bringing in $77M with over 146,000 pairs sold. Women s-specific flat skis were up 15% this season, while women s-specific systems finished up 5%. Fat skis in both flat and system models continued to do well this season with flat skis >110mm up 41% and systems >110mm up 315%. It looks like snowboarders are looking to get the best of both worlds; 41% of snowboarders reported that they also skied last season (up from 26% in 2009/2010). 13

14 ALPINE SKI MARKET OVERVIEW

15 ALPINE SKI MARKET OVERVIEW
16 ALPINE FLAT SKIS Average Retail Prices By Channel 2011/2012 Average Retail as values Adult Skis (<70mm) Adult Skis (70-79mm) Adult Skis (80-95mm) Adult Skis (95-110mm) Adult Skis (>110mm) Adult Traditional Cut Skis Adult Twintip Skis Junior Skis Carryover Skis Total Flat Skis Chain $ $ $ $ $ $0.00 $ $ $ $ Internet $ $ $ $ $ $0.00 $ $ $ $ Specialty $ $ $ $ $ $ $ $ $ $ All Stores $ $ $ $ $ $ $ $ $ $ Source: SIA Snow Sports RetailTRAK --carryover included. 16
17 ALPINE SKI SYSTEMS Average Retail Prices by Channel 2011/2012 Average Retail as values Adult Ski Systems (<70mm) Adult Ski Systems (70-79mm) Adult Ski Systems (80-95mm) Adult Ski Systems (95-110mm) Adult Ski Systems (>110mm) Adult Twintip Ski Systems Junior Ski Systems Total Ski Systems Chain $ $ $ $0.00 $0.00 $ $ $ Internet $ $ $ $ $ $ $ $ Specialty $ $ $ $ $ $ $ $ All Stores $ $ $ $ $ $ $ $ Source: SIA Snow Sports RetailTRAK --carryover included. 17
18 ALPINE SKI SALES BY GENDER/AGE Unit Sales In All Snow Sports Shops 2008/ / , , , ,000 Units Sold 250, , , ,000 50, / / / /2012 Men's 384, , , ,511 Women's 118, , , ,662 Boys 72,200 72,350 71,816 75,501 Girls 35,814 35,090 33,188 38,385 Overall men s ski sales were the only group that felt a loss, down 6% in units; women s skis were up 6%, boys up 5% and girls up 16%. Source: SIA Snow Sports RetailTRAK --carryover included. 18
19 REVERSE CAMBER ALPINE SKIS Unit Sales Trends 2008/ /2012 Flat Skis Ski Systems 135,805 92,619 80,426 44,302 51, ,001 18, / / / /2012 The reverse/mixed camber trend continues to grow in popularity, with reverse/mixed camber flat skis up 47% and systems up an impressive 333% in units sold. Source: SIA Snow Sports RetailTRAK --carryover not included. 19

20 ALPINE SKIS Best-Selling Adult Models 2011/2012 Alphabetical Order Atomic Cloud 7 w/ XTL (Women s) Atomic Nomad Smoke TI W/XTO Atomic Nomad Smoke W/XTO Rossignol S7 Freeride Volkl Mantra Source: SIA Snow Sports RetailTRAK --carryover included. 20
21 ALPINE BOOTS Average Retail Prices By Channel 2011/2012 Average Retail as values Adult High Performance Boots Adult Sport Performance Boots Adult Recreation Boots Junior Boots Carryover Boots Adult Alpine/AT Boots Chain $ $ $ $ $ $ Internet $ $ $ $ $ $ Specialty $ $ $ $ $ $ All Stores $ $ $ $ $ $ Source: SIA Snow Sports RetailTRAK --carryover included. 21

22 ALPINE BOOTS Best-Selling Adult Models 2011/2012 Alphabetical Order Atomic Hawx 80 Boot Atomic Hawx 80 Boot, Women s Nordica Hot Rod 8.0 Boot Nordica Hot Rod 8.5 Boot, Women s Salomon Impact 100 CS Boot Source: SIA Snow Sports RetailTRAK --carryover included. 22
23 23

24 SNOWBOARD MARKET OVERVIEW

25 SNOWBOARD MARKET OVERVIEW
26 SNOWBOARD EQUIPMENT Average Retail Prices 2010/ /2012 Average Retail 2011/2012 Chain Internet Specialty Snowboards $ $ $ Snowboard Boots $ $ $ Snowboard Bindings $ $ $ Snowboard Equipment $ $ $ Source: SIA Snow Sports RetailTRAK carryover included. 26
27 SNOWBOARDS Reverse Camber (Rocker) Trends Trends In Snowboard Camber 2008/ / , , ,000 Units Sold 200, , ,000 50, / / / /2012 Normal Camber 269, , , ,588 Reverse Camber 152, , , ,558 Source: SIA Snow Sports RetailTRAK carryover not included. 27
28 SNOWBOARDS Best Selling Adult Models 2011/2012 Alphabetical Order Burton, Blunt Series Burton, Clash Series Burton, Custom Flying V Series Burton, Feather Series (Women s) Gnu, Carbon Credit BTX Series Source: SIA Snow Sports RetailTRAK carryover included. 28
29 SNOWBOARD BOOTS Best Selling Adult Models 2011/2012 Alphabetical Order Burton: Invader Boot Burton: Mint Boot (Women s) Burton: Moto Boot Burton: Ruler Boot (Women s) Ride: Anthem Boa Boot Source: SIA Snow Sports RetailTRAK carryover included. 29
30 30

31 Cross Country Market Overview

32 Cross Country Market Overview

33 CROSS COUNTRY EQUIPMENT Average Retail Prices, By Channel 2008/ /2012 Chain Specialty Internet Average Retail as values Nordic Skis Nordic Boots Nordic Binding s Nordic Poles Nordic Skis Nordic Boots Nordic Binding s Nordic Poles Nordic Skis Nordic Boots Nordic Binding s Nordic Poles 2011/2012 $ $97.12 $55.95 $29.64 $ $ $57.08 $45.07 $ $ $59.92 $52.01 Source: SIA Snow Sports RetailTRAK --carryover included. 33
34 34

35 BACKCOUNTRY EXECUTIVE SUMMARY Even those who trekked out to the backcountry this season struggled to find some decent snow, and that was evident at retail. AT/Randonee equipment sales -7% in units, -6% in dollars. AT/Randonee Skis: -27% in units, -26% in dollars AT/Randonee Boots: +2% in units, flat in dollars AT/Randonee Bindings: flat in units, +2% in dollars. 35
36 RANDONEE/AT SKI EQUIPMENT Average Retail Prices 2008/ /2012 Snow Sports and Outdoor Specialty Retailers Average Retail as values 2011/2012 Chain Internet Specialty Randonee/AT Skis $ Randonee/AT Boots $ Randonee/AT Bindings $ Randonee/AT Skis $ Randonee/AT Boots $ Randonee/AT Bindings $ Randonee/AT Skis $ Randonee/AT Boots $ Randonee/AT Bindings $ Outdoor Specialty Randonee/AT Skis $ Randonee/AT Boots $ Randonee/AT Bindings $ Source: SIA Snow Sports RetailTRAK --carryover included and the Leisure Trends Group Outdoor RetailTRAK. 36
37 APPAREL TRENDS 2012/2013 For women - Fitted silhouettes, color blocking and fur trim will bring exciting choices to the market. Warmth and weatherproofing will be considered by Northeast and Mid-Atlantic consumers who will need to deal with more cold and snow this season. Non-participants buy more and more snow sports apparel as casualwear as office attire becomes increasing more casual and a more rugged look becomes popular for well-heeled urban men. 37
38 ACCESSORIES TRENDS 2012/2013 Helmets will continue to gain in popularity on the slopes and more than 1.3M units (the 2011/2012 number) will be sold. Pent-up demand for goggles, gloves, helmets, winter boots, and baselayer will drive accessories sales. All accessories sales will increase with participation more snow = more accessories sales. 38
39 2012 SIA SNOW FASHION AND TRENDS 39

40 LOOKING AHEAD: Threats and Opportunities Fallout from a terrible season: o Smaller orders o Conservative product mix o Bankruptcy retailer and supplier o Consolidation Opportunity to leverage a better snow season in 2012/2013? How will slow downs in the European and Asian economies impact our economy? Will retailers sell through inflated inventories? How can we work together to keep snow sports healthy? 40
41 41
42 SNOW SPORTS PARTICIPATION BY SPORT 14,000 12,000 Participants (000s) 10,000 8,000 6,000 4,000 2, / / / / /2012 Skiing (Cross Country) 3,530 3,848 4,157 4,530 4,318 Skiing (Alpine/Downhill) 10,362 10,346 10,919 11,504 10,201 Skiing (Freestyle) 2,817 2,711 2,950 3,647 3,641 Snowboarding 6,841 7,159 7,421 8,196 7,579 Snowshoeing 2,400 2,922 3,431 3,823 4,111 Telemarking (Downhill) 1,173 1,435 1,482 1,821 2,099 Alpine skiing participation -11% in the 2011/2012 and snowboarding participation -8% despite heavier participation among core snow sports participants. Total participation in snow sports is 21M with another 11M who consider themselves skiers or riders but did not ski or ride in the past two seasons. Source: SIA Participation Study
43 332,386,750 Total Calories Burned Skiing, Snowboarding, and Snowshoeing in 2011/2012 Snowshoeing, 15,827,350 Snowboarding, 109,137,600 Alpine Ski, 153,015,000 XC Ski, 54,406,800 How Many Cheeseburgers Does that Represent? How many Breakfast Burritos? Discipline Total Calories Burned 2011/2012 How Many Beers? How many Pancakes? Alpine Ski 153,015, ,593 1,020, , ,060 XC Ski 54,406,800 77, , , ,627 Snowboarding 109,137, , , , ,550 Snowshoeing 15,827,350 22, ,516 52,758 63,309 Total Snow Sports 332,386, ,838 2,215,912 1,107,956 1,329,547 Sources: SIA Participation Study data produced by the PAC, WebMD Calorie Calculator
44 ALPINE SKIER PROFILE Alpine Ski Participant Profile Total Alpine Ski Participation 10,201,000 (-11.3%) Median Age of Alpine Skiers 23% are ages 6-17, 52% between and 25% are over 45 years old. Just 8% ski after 55 years. Gender of Alpine Skiers Male 61%, Female 39% % with Household Income >$100K 50% % of Core Alpine Skiers with Household Incomes >$100K 49% Bachelor's Degree or Higher 53% States with the Most Alpine Ski Participants CA, TX, NY, CO, PA % of Alpine Skiers that Also Ride a Snowboard 19% Avg. Price Paid for (Flat - bindings sold separately) Skis at a Specialty Shop $ Avg. Price Paid for Ski Systems at a Specialty Shop $ Avg. Price Paid for Alpine Boots at a Specialty Shop $ Avg. Number of Days Alpine Skiing in 2011/ Days Source: SIA/Physical Activity Council 2012 Snow Sports Participation Study 44
45 SNOWBOARDER PROFILE Snowboard Participant Profile Total Snowboard Participation 7,579,000 (-7.5%) 24% of females 17 or younger, 29% of males 17 or younger, 9% of males 45 or older, 6% of Age females 45 or older Gender 65% Male, 35% Female Bachelor s Degree or Higher 38% Avg. Price paid at Specialty for a Snowboard $ Avg. Price paid at Specialty for Snowboard Boots $ Avg. Price paid at Specialty for a Snowboard Bindings $ States with the Most Snowboarders CA, NY, IL, PA, TX, NJ Avg. Number of Days Riding 8 days (down from 11.7 in 2010/2011) % of Riders who also Alpine Ski 41% (up from 26% in 2009/2010) % of Snowboard Riders of Asian/Pacific Island Decent 14% % of Snowboarders of Latino Decent 9% % of Snowboarders of African American/Black Decent 5% Household Income Above $75K per Year 53% Source: SIA/Physical Activity Council 2012 Snow Sports Participation Study 45
46 CROSS COUNTRY SKIER PROFILE Cross Country Participant Profile Total Cross Country Participation 4,318,000 (-4.7%) % of XC Skiers Over Age 35 49% Gender 41% Female, 59% Male Bachelor's Degree or Higher 56% % of XC Skiers who Ski at Public Nordic Centers 28% % of XC Skiers who Ski at Private Nordic Centers 38% % of XC Skiers who Ski Backcountry Terrain 34% Region with the Most XC Participants East North Central (IN, IL, MI, OH, WI) % of XC Skiers Who Also Alpine Ski 51% % of XC Skiers who Also Ride Road Bikes 42% % of XC Skiers of Asian/Pacific Islander Descent 11% % of SX Skiers of Latino Descent 8% % of XC Skiers of African American/Black Descent 7% Household Income Above $75K Per Year 56% Source: SIA/Physical Activity Council 2012 Snow Sports Participation Study. 46
47 ALPINE SKIER CROSSOVER Percentage Of Alpine Skiers Who Also: 25% 20% Percent Crossover 15% 10% 5% 0% Snowboard Cross Country Ski Snowshoe Freestyle Ski Telemark Ski Percent of Alpine Skiers Who: 19% 22% 16% 20% 13% Source: SIA/Physical Activity Council 2012 Snow Sports Participation Study 47
48 ALPINE SKIER PARTICIPATION By Age Group 25% 20% Percent of Total Participants 15% 10% 5% 0% 6 to to to to to to to Core 9+ Days 10% 14% 15% 14% 14% 17% 10% 5% Casual 1+ Days 11% 12% 15% 21% 16% 17% 5% 3% Source: SIA/Physical Activity Council 2012 Snow Sports Participation Study 48
49 SNOWBOARD PARTICIPATION By Age 35% 30% Percent of Total Participation 25% 20% 15% 10% 5% 0% 6 to to to to to to to Snowboard 10% 17% 25% 30% 12% 6% 1% 0% Source: SIA/Physical Activity Council 2012 Snow Sports Participation Study. 49
50 SNOW SPORTS PARTICIPANT Household Income 7% 11% Under $25,000 $25,000 to $49,000 50% $50,000 to $74,999 19% $75,000 to $99,999 $100, % Source: SIA/Physical Activity Council 2012 Snow Sports Participation Study 50
51 SNOW SPORTS PARTICIPANT ETHNICITY 80% 70% Percent of Total Participation 60% 50% 40% 30% 20% 10% 0% Caucasian/White, non-hispanic Asian/Pacific Islander Hispanic African American/Black Alpine Ski 75% 11% 8% 4% 3% Snowboard 66% 15% 10% 6% 3% Cross Country 71% 11% 8% 7% 3% Snowshoe 72% 12% 9% 6% 2% Freestyle 59% 17% 12% 11% 2% Other Source: SIA/Physical Activity Council 2012 Snow Sports Participation Study 51

52 SNOW SPORTS PARTICIPANT EDUCATION DEMOGRAPHICS (AVG) 8th Grade or Less 1-3 Years of High School High School 1-3 Years College College Grad Post-Grad Studies Alpine Ski 13% 11% 7% 16% 33% 19% 1% Snowboard 12% 14% 9% 25% 27% 9% 2% Other Cross Country 7% 8% 8% 20% 33% 23% 0% Snowshoe 8% 5% 8% 20% 40% 17% 1% Freestyle 12% 9% 8% 22% 31% 18% 1% Telemark 8% 10% 4% 25% 36% 15% 2% 10% 10% 7% 21% 33% 17% 1% 52

53 SKIER PARTICIPATION: Density/Per Capita ID 9.3% MT 6.3% ND 6.8% ME 6.7% VT 7.1% NH 14.8% MA 6.9% CT 6.1% UT 7.3% CO 11.7% Percent of U.S. population that skis in each state. Top Ten: NH 14.8%, CO 11.7%, ID 9.3%, UT 7.3%, VT 7.1%, MA 6.9%, ND 6.8%, ME 6.7%, MT 6.3%, CT 6.1%. The Top Ten States represent 56% of total U.S. participation. Source: SIA/Physical Activity Council 2012 Snow Sports Participation Study 53
54 ALPINE SKI AND SNOWBOARD PARTICIPATION By Region 30% 25% Percent of Total Participation 20% 15% 10% 5% 0% New England Mid Atlantic East North West North South Atlantic East South West South Mountain Pacific Alpine Ski 10% 15% 15% 6% 12% 2% 8% 13% 19% Snowboard 5% 18% 16% 5% 11% 2% 4% 11% 27% New England: CT, ME, MA, NH, RI, VT Mid Atlantic: NY, NJ, PA East North Central: IL, IN, MI, OH, WI West North Central: IA, KS, MN, MO, NE, SD South Atlantic: DC, FL, GA, MD, NC, SC, VA, WV East South Central: AL, KY, MS, TN West South Central: AR, LA, OK, TX Mountain: AZ Co, ID, MT, NV, NM, UT, WY Pacific: HI, AK, CA, OR, WA Source: SIA/Physical Activity Council 2012 Snow Sports Participation Study 54
55 WHERE ALPINE SKIERS SKI 100% 90% 80% 70% 60% 50% 40% 30% 20% 10% 0% Resort-Marked Trails Resort- Backcountry/Ungroomed Trails Non-Resort- Backcountry/Ungroomed Trails Venue 91% 16% 4% 5% Other Source: SIA/Physical Activity Council 2012 Snow Sports Participation Study 55
56 AGE GROUPS COMPARED Age Groups for Alpine Skiers, Snowboarders and Ski Club Presidents Compared 2011/ % 30.0% % of total in age group 25.0% 20.0% 15.0% 10.0% 5.0% 0.0% 17 and Under Ski Club Presidents 0.0% 0.0% 5.1% 9.6% 26.3% 25.3% 23.7% Alpine Skiers 23.0% 14.9% 20.5% 16.2% 17.3% 5.4% 2.6% Snowboarders 26.7% 24.7% 29.6% 11.6% 6.2% 0.9% 0.4% 56
57 INDUSTRY CHALLENGES The biggest challenge facing the industry including clubs is growing snow sports participation. Let s take a brief look at why people do and don t get involved. 57
58 58

59 SNOW SPORTS PARTICIPATION Why Didn t They Participate? Source: SIA/Physical Activity Council 2006/ /2012 Snow Sports Participation. 59

60 SNOW SPORTS PARTICIPATION Why Didn t They Return After Their First Time? 83% of first time participants never return I was cold I was frustrated It was painful It was dangerous It was expensive It was hard to access/mountains are too far The boots are uncomfortable (more ski than snowboard) I don t like the pressure (from instructors or peers) 60
 Increase frequency of equipment purchase/replacement among participants")
61 SNOW SPORTS PARTICIPATION Future Growth Opportunities Bring back lapsed participants Create more opportunities to try snow sports Improve conversion of first time participants Correct misperceptions at grassroots level (retail/resort) Increase frequency of equipment purchase/replacement among participants 61


62 SIA CONSUMER OUTREACH TO PARTICIPANTS & POTENTIAL PARTICIPANTS 62
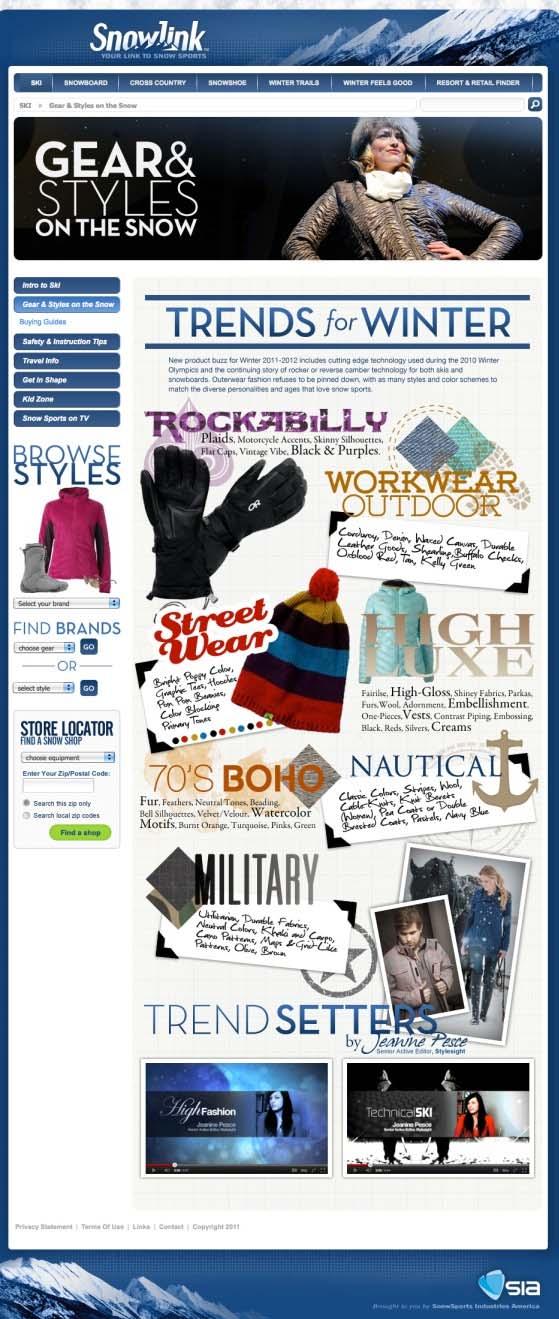
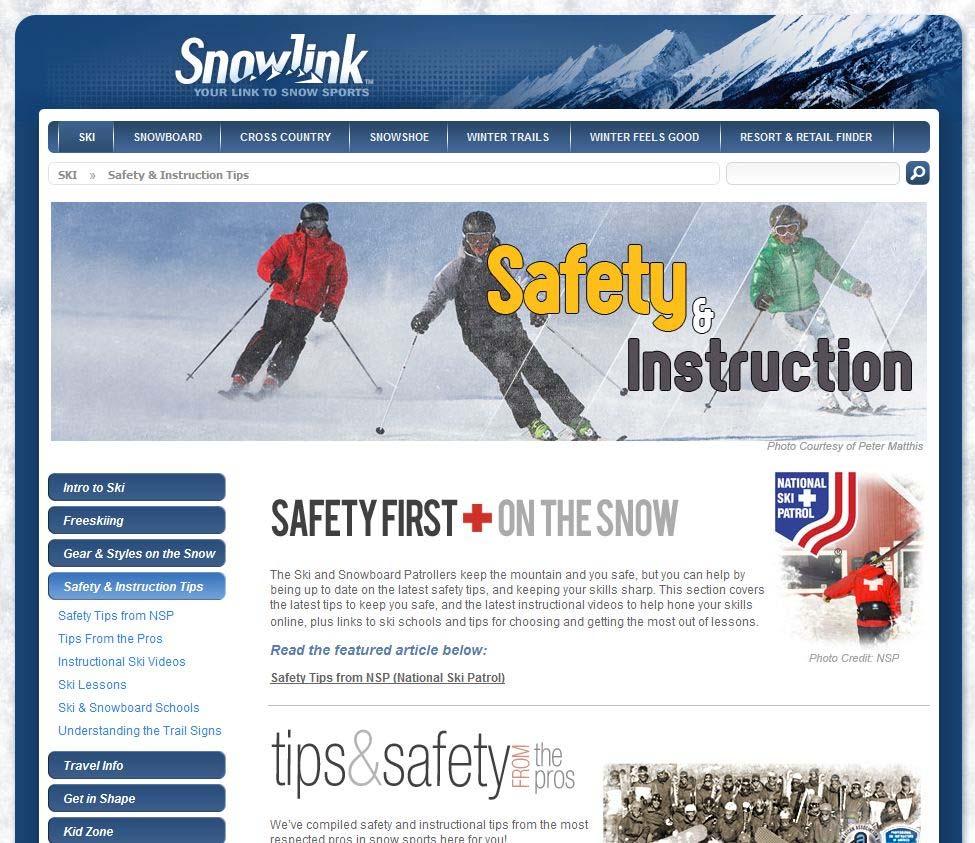
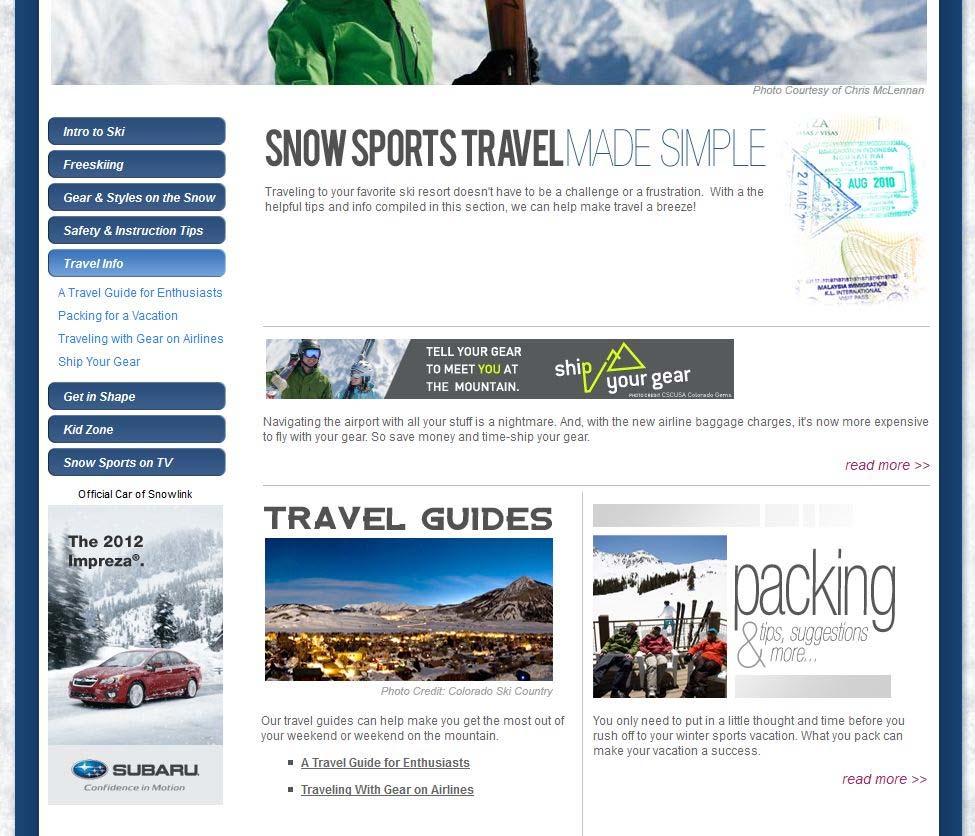
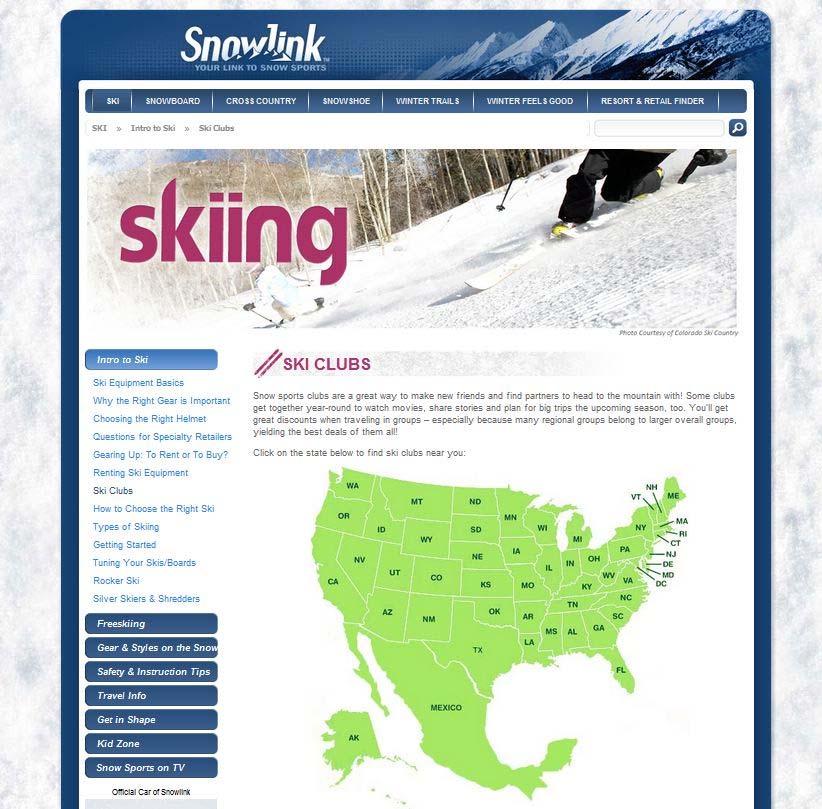
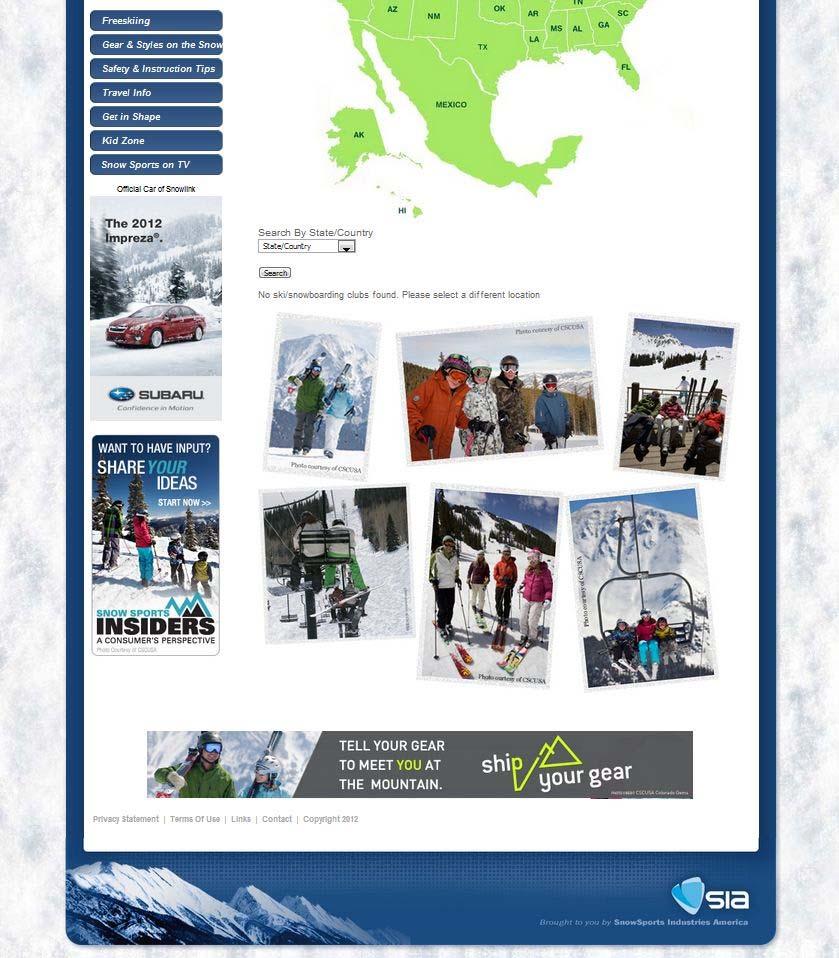
63 SNOWLINK Snowlink.com & Snowlink Facebook Engages Consumers and Media with everything snow sports Sections specific to PSIA/AASI, NSP Safety Tips, Retail + Resort Locator, SIA Member Gear & Styles on the Snow, Freeski, Silver Skier & Shredders, KidZone, How-To s, Ski/Snowboard Clubs, Lesson & Burton LTR listing, Ski/Snowboard/XC Buying Guides, Shop + Resort Locator Banner Ads; World Snowboard Day, Learn to Ski & Snowboard Month, Winter Trails, Subaru, Snow Sports Insiders, Ship Your Gear 63
64 SNOWLINK A Link to All Things Snow Enhanced landing page with dynamic news, photos + videos Women s Snow Boutique section; By Women, For Women USSA & Backcountry sections SIA Member Brand/Product Gallery; Digital Ads + Social + Site Links Increased PPC, Facebook ads, Tripadvisor, Travel sites, Mommy Blogs, PR outreach Integrate Retail to Consumer Shop Snow Program 64

65 SNOWLINK.COM 65
66 66
67 67
68 68
69 69
70 70
71 71

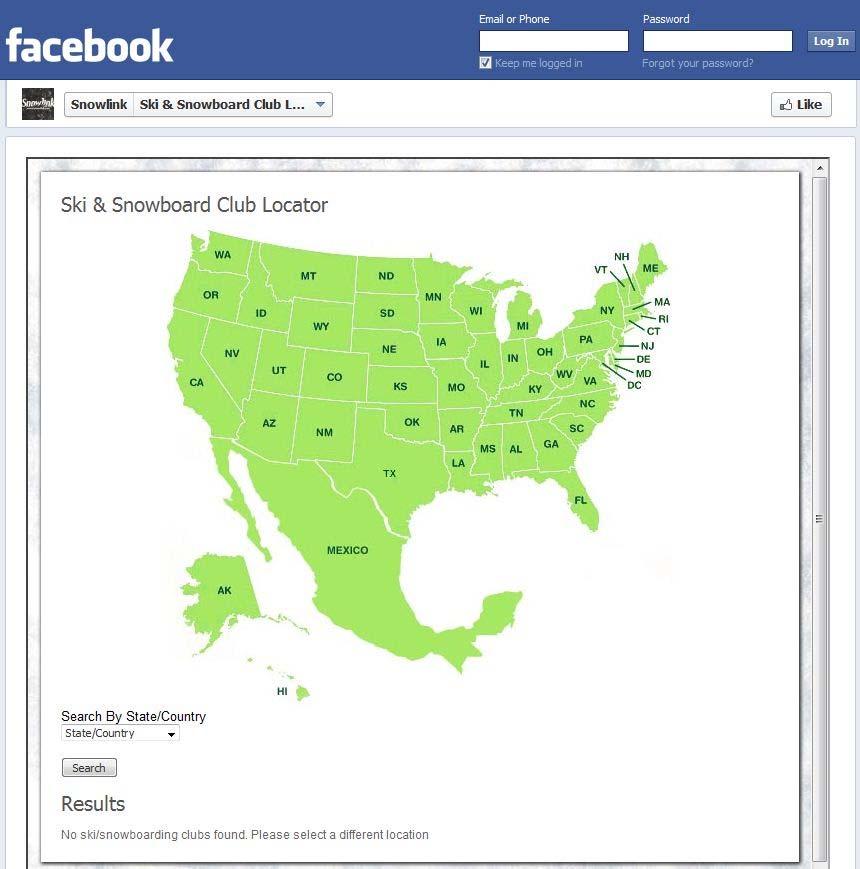
72 SNOWLINK FACEBOOK 72
73 73


74 WINTER TRAILS One day national event getting consumers to try out cross country skiing and snowshoeing for free 100 locations and 10,000 participants* 2013 Dates January 12 (Nationwide) January 19 (Estes Park, CO) *Only 6,000 participants in 2012 due to lack of snow. Every other year there are 10,


75 LEARN TO SKI AND SNOWBOARD MONTH 75


76 WORLD SNOWBOARD DAY DECEMBER 30, 2012 Global Event to Get People Riding! Over 60 Countries Involved 76

77 SHIP YOUR GEAR Consumer awareness program to educate skiers and snowboarders to Ship Their Gear via FedEx Up to 16% Discount on FedEx & Up to 9% Discount on FedEx Ground 77


78 Ship Your Gear materials for shops & ski clubs: 78
79 SKI CHANNEL 22 Minute produced consumer television spot SIA Snow Show Fashion, Trends, Gear September 15 December 15 On-Demand Cable (search local On-Demand) Television short will be sent to all Ski & Snowboard Clubs 4 Minutes 79

80 PSA VIDEOS & BLOG Three PSAs for shops and ski/snowboard clubs Gear Up & Tuning Fashion & Trends Getting on the Mountain & Having Fun! Timing Late September/October Fall Blog post written by Jake Des Roches, will be posted on Snowlink.com and on College Blogs; How to Start a Ski/Snowboard Club at Your College 80

81 Questions Suggestions Comments Tomorrow we will focus on how we can work together to grow participation in club membership. Thank you & think snow! 81
SIA SNOW SPORTS PARTICIPANT STUDY
 2012-2013 SIA SNOW SPORTS PARTICIPANT STUDY TABLE OF CONTENTS Section Page Number Participation Demographics 5 Gender and Age Demographics 27 Income and Education Demographics 38 Ethnic Demographics 54
SEASON FINAL REGISTRATION REPORTS
 Materials Included: 2015-2016 SEASON FINAL REGISTRATION REPORTS 2014-15 & 2015-16 Comparison by Group 2 2015-16 USA Hockey Member Counts 3 2015-16 8 and Under Report 4 2015-16 Players & Girls/Women by
More of the Same; Or now for Something Completely Different?
 More of the Same; Or now for Something Completely Different? C2ER Place cover image here Richard Wobbekind Chief Economist and Associate Dean for Business and Government Relations June 14, 2017 Real GDP
2015/2016 State of Nordic
 2015/2016 State of Nordic CROSS COUNTRY SKI TRENDS Despite anemic snowfall in the East and Midwest, the number of cross country participants grew 12% to 4.6M The number of women participating has grown
Understanding the Regional Divergence in Adult Mortality in the United States
 Understanding the Regional Divergence in Adult Mortality in the United States Andrew Fenelon, PhD University of Maryland, College Park American Life Expectancy 77 76 75 Life Expectancy in Years 74 73 72
Bikes Belong Survey: The Size & Impact of Road Riding Events
 Bikes Belong Survey: The Size & Impact of Road Riding Events November 2009 Recreational road bicycling events are popular all across the United States. Participants are inspired by the opportunities to
State of the SNOWBOARD Market January 2014
 State of the SNOWBOARD Market January 2014 THE SNOW SPORTS MARKET 60K FT VIEW Sales reached $2.3B, up 9% in $ and up 7% in units sold through December 19.3M participants 7M who didn t participate but consider
Zions Bank Economic Overview
 Zions Bank Economic Overview Intermountain Credit Education League May 10, 2018 Dow Tops 26,000 Up 48% Since 2016 Election Jan 26, 2018 26,616 Oct 30, 2016 17,888 Source: Wall Street Journal Dow Around
Anatomy of a Jackpot: Characteristics of Purchasers of Large Jackpot Lottery Tickets
 Anatomy of a Jackpot: Characteristics of Purchasers of Large Jackpot Lottery Tickets The 15 th International Conference on Gambling & Risk Taking May 27-31, 2013 Todd Maki & Don Feeney 1 Although not shown
Target Shooting by Hunters and Their Use of Shooting Ranges: 1975, 1991, and 2011
 U.S. Fish & Wildlife Service Target Shooting by Hunters and Their Use of Shooting Ranges: 1975, 1991, and 2011 Addendum to the 2011 National Survey of Fishing, Hunting, and Wildlife-Associated Recreation
Zions Bank Economic Overview
 Zions Bank Economic Overview Veteran Owned Business Conference May 11, 2018 Dow Tops 26,000 Up 48% Since 2016 Election Jan 26, 2018 26,616 Oct 30, 2016 17,888 Source: Wall Street Journal Dow Around Correction
Zions Bank Economic Overview
 Zions Bank Economic Overview Kenworth National Dealers Conference November 8, 2018 1 National Economic Conditions 2 Volatility Returns to the Stock Market 27,000 Dow Jones Industrial Average October 10,
Zions Bank Economic Overview
 Zions Bank Economic Overview Utah Bankruptcy Lawyers Forum March 20, 2018 National Economic Conditions When Good News is Bad News Is Good News?? Dow Tops 26,000 Up 44% Since 2016 Election Source: Wall
2009 National Pharmacist Workforce Study. Visual Data
 2009 National Pharmacist Workforce Study Visual Data Figure 1.1: National Aggregate g Demand Index Values http://www.pharmacymanpower.com/ 5 4 3 4.28 4.07 Shortage Surplus 4.19 4.07 4.02 3.97 3.92 4.21
Overview of the Regional Economy
 Overview of the Regional Economy Jason Bram, Research Officer Presentation to the Community Depository Institutions Advisory Council (CDIAC) October 13, 2017 The views expressed here are those of the presenter
SUMMARY MEMBERSHIP ANALYSIS FOR THE STATE OF. Trends of first-time 4 to 8 year-old male ice hockey players to
 SUMMARY MEMBERSHIP ANALYSIS FOR THE STATE OF New York Trends of first-time 4 to 8 year-old male ice hockey players 1997-98 to 27-8 p.2 -Background and Methodology p.3 -National Acquisition and Retention
SHOOTING IN AMERICA. An Economic Force for Conservation 2018 EDITION
 TARGET SHOOTING IN AMERICA An Economic Force for Conservation 2018 EDITION INTRODUCTION Target shooting is enjoyed by millions of Americans each year. It is so popular, in fact: More people participate
SUMMARY MEMBERSHIP ANALYSIS FOR THE STATE OF. Trends of first-time 4 to 8 year-old male ice hockey players to
 SUMMARY MEMBERSHIP ANALYSIS FOR THE STATE OF New Mexico Trends of first-time 4 to 8 year-old male ice hockey players 1997-98 to 27-8 p.2 -Background and Methodology p.3 -National Acquisition and Retention
SUMMARY MEMBERSHIP ANALYSIS FOR THE STATE OF. Trends of first-time 4 to 8 year-old male ice hockey players to
 SUMMARY MEMBERSHIP ANALYSIS FOR THE STATE OF Rhode Island Trends of first-time 4 to 8 year-old male ice hockey players 1997-98 to 27-8 p.2 -Background and Methodology p.3 -National Acquisition and Retention
Produce Safety Alliance Course and Trainer Totals through September 19, 2018
 Course and Trainer Totals through 19, 218 Totals: 216 218 Train-the-Trainer Courses Domestic 58 Total TTT Courses since Sept. 216 International 12 Total 7 2,27 Total Trainer Participants 1,716 (Domestic)
SUMMARY MEMBERSHIP ANALYSIS FOR THE STATE OF. New Hampshire. Trends of first-time 4 to 8 year-old male ice hockey players to
 SUMMARY MEMBERSHIP ANALYSIS FOR THE STATE OF New Hampshire Trends of first-time 4 to 8 year-old male ice hockey players 1997-98 to 27-8 p.2 -Background and Methodology p.3 -National Acquisition and Retention
Colorado Counties Treasurers Association
 Colorado Counties Treasurers Association Place cover image here Richard Wobbekind Executive Director, Business Research Division June 21, 2016 Real GDP Growth Quarterly and Annualized Real GDP 1990-2016
Zions Bank Economic Overview
 Zions Bank Economic Overview Logan Rotary Club June 28, 2018 Dow Tops 26,000 Up 48% Since 2016 Election Jan 26, 2018 26,616 Oct 30, 2016 17,888 Source: Wall Street Journal Dow Around Correction Territory
Zions Bank Municipal Conference Economic Overview August 13, 2015
 Zions Bank Municipal Conference Economic Overview August 13, 2015 Overview National Economic Conditions Utah Economic Conditions Utah is One of the Fastest Growing CA 0.9% States in the Country Percent
Zions Bank Economic Overview. December 5, 2017
 Zions Bank Economic Overview December 5, 2017 National Economic Conditions Dow Breaks 24,000 The Trump Bump Dow Reaches New Heights Following U.S. Presidential Election Source: Federal Reserve Bank of
Annual Data Report
 Annual Data Report 2014-2015 A Report of the Association of American Veterinary Medical Colleges 1101 Vermont Avenue, NW 20005 202-371-9195 http://www.aavmc.org As of March 11, 2015 Introduction The membership
Overview of the Regional Economy
 Overview of the Regional Economy Jason Bram, Research Officer Presentation to the Community Depository Institutions Advisory Council (CDIAC) March 5, 2019 The views expressed here are those of the presenter
CREATIVE DESTRUCTION AND THE KNOWLEDGE ECONOMY
 CREATIVE DESTRUCTION AND THE KNOWLEDGE ECONOMY Where people work and how it has changed. Creative Destruction & the Process of Change The Second Industrial Revolution & Agriculture Miracle. The Third Revolution
8:00 am 5:00 pm NASRO Basic Course Music Road Resort Hotel. 8:00 am 5:00 pm NASRO Basic Course - ** Music Road Resort Hotel
 NASRO NATIONAL SCHOOL SAFETY CONFERENCE Smoky Mountains, TN June 23 28, 2019 This event has been approved for UASI reimbursement. Travel, Per Diem, Tuition reimbursement, Backfill and Overtime is at the
Regional Economic Conditions
 Regional Economic Conditions Jason Bram, Research Officer Community Advisory Group Meeting June 27, 2017 The views expressed here are those of the presenter and do not necessarily represent those of the
USA TRIATHLON MEMBERSHIP REPORT TABLE OF CONTENTS
 USA TRIATHLON MEMBERSHIP REPORT This report has been prepared by the Membership Services staff based on active memberships on December 31, 2015. Media requests can be addressed to communications@usatriathlon.org.
Cement & Construction Outlook
 Cement & Construction Outlook Minnesota Concrete Council November 17, 2011 Dave Zwicke, PCA Analytics Manager, Sr. Economist Bottom Line Economy in a slow growth period characterized by tepid job gains.
Zions Bank Economic Overview
 Zions Bank Economic Overview WIB Education Summit September 19, 2017 National Economic Conditions Dow Breaks 22,000 The Trump Bump Dow Reaches New Heights Following U.S. Presidential Election Source: Federal
Minimum Wages By State, Municipality and County
 Compliance Alert January 21 st, 2019 Minimum Wages By State, Municipality and County AL N/A N/A AK $9.89 AZ $11.00 $12.00 - January 1, 2020 Flagstaff $12.00 $13.00 - January 1, 2020 $15.00 - January 1,
Zions Bank Economic Overview Logan Rotary Club. March 16, 2017
 Zions Bank Economic Overview Logan Rotary Club March 16, 2017 National Economic Conditions Dow 20,000 The Trump Bump Dow Reaches New Heights Following U.S. Presidential Election Source: Wall Street Journal
OUTDOOR RECREATION PARTICIPATION REPORT TOPLINE 2013
 OUTDOOR RECREATION PARTICIPATION REPORT TOPLINE 2013 Ages 6+ OUTDOOR PARTICIPATION 12.4 Outdoor Outings 87.4 Average Outings Per Participant More Americans participated in outdoor recreation in than in
Zions Bank Economic Overview West Point Economic Summit. March 30, 2017
 Zions Bank Economic Overview West Point Economic Summit March 30, 2017 National Economic Conditions Dow 20,000 The Trump Bump Dow Reaches New Heights Following U.S. Presidential Election Source: Wall Street
Zions Bank Economic Overview
 Zions Bank Economic Overview UAFS & NAIB Convention September 14, 2017 National Economic Conditions Dow Breaks 22,000 The Trump Bump Dow Reaches New Heights Following U.S. Presidential Election Source:
Zions Bank Economic Overview Utah Bankers Association Emerging Bank Leaders Conference. November 9, 2017
 Zions Bank Economic Overview Utah Bankers Association Emerging Bank Leaders Conference November 9, 2017 National Economic Conditions Dow Breaks 23,000 The Trump Bump Dow Reaches New Heights Following U.S.
Zions Bank Economic Overview
 Zions Bank Economic Overview Utah Manufacturers Association & Associated General Contractors Utah Finance and Economic Summit September 26, 2017 National Economic Conditions Dow Breaks 22,000 The Trump
Zions Bank Economic Overview
 Zions Bank Economic Overview National Assoc of Credit Managers Member Seminar December 12, 2017 National Economic Conditions Dow Breaks 24,000 The Trump Bump Dow Reaches New Heights Following U.S. Presidential
Zions Bank Economic Overview Cache Valley Home Builders Association. April 12, 2017
 Zions Bank Economic Overview Cache Valley Home Builders Association April 12, 2017 National Economic Conditions Dow 20,000 The Trump Bump Dow Reaches New Heights Following U.S. Presidential Election Source:
Zions Bank Economic Overview Coldwell Banker Commercial Group. November 6, 2017
 Zions Bank Economic Overview Coldwell Banker Commercial Group November 6, 2017 National Economic Conditions Dow Breaks 23,000 The Trump Bump Dow Reaches New Heights Following U.S. Presidential Election
Zions Bank Economic Overview Utah Government Finance Officers Assoc. April 21, 2017
 Zions Bank Economic Overview Utah Government Finance Officers Assoc. April 21, 2017 National Economic Conditions Dow 20,000 The Trump Bump Dow Reaches New Heights Following U.S. Presidential Election Source:
Featured Fish-Week ofjuly 16th
 Featured Fish-Week ofjuly 16th 5-6 Premium GradeKoi 25% O f,only$8.21each! 5-6 GinRinMixKoi 15% O f,only$10.41each! 6-8 StandardGradeButerflyKoi Buy1FulCount,Get1FulCount50% O f! 3-4 Yelow CometGoldfish
The Burden of HPV Related Cancers in Kentucky
 The Burden of HPV Related Cancers in Kentucky Presented on November 15, 2017 by Katie Bathje, Kentucky Cancer Consortium Many thanks to: Thomas C. Tucker, PhD, MPH Jaclyn Nee, DrPH 1 % coverage Adolescent
Economic Forecast to Professional Republican Women Association. January 5, 2017
 Economic Forecast to Professional Republican Women Association January 5, 2017 Economic Headwinds National and international uncertainty Continued low energy prices Depressed business investment Unstable
Zions Bank Economic Overview. March 14, 2017
 Zions Bank Economic Overview March 14, 2017 National Economic Conditions Dow 20,000 The Trump Bump Dow Reaches New Heights Following U.S. Presidential Election Source: Wall Street Journal 120.0 110.0 100.0
SECTION SEVEN. Characteristics of People with IDD and Staff in Large Public Residential Facilities
 SECTION SEVEN Characteristics of People with IDD and Staff in Large Public Residential Facilities FY Section 7: Characteristics of People with IDD and Staff in Large State-Operated IDD Facilities This
Participation Topline Report 2012
 outdoor recreation Participation Topline Report 2012 Ages 6 + 2011 Outdoor Participation 11.6 Billion Outdoor Outings 81.9 Average Outings Per Participant In 2011, outdoor recreation among Americans reached
Naples, Marco Island, Everglades Convention and Visitors Bureau May 2018 Visitor Profile
 RESEARCH DATA SERVICES, INC. 777 SOUTH HARBOUR ISLAND BOULEVARD SUITE 260 TAMPA, FLORIDA 33602 TEL (813) 254-2975 FAX (813) 223-2986 Naples, Marco Island, Everglades Convention and Visitors Bureau May
Zions Bank Economic Overview Meridian Chamber of Commerce. May 2, 2017
 Zions Bank Economic Overview Meridian Chamber of Commerce May 2, 2017 National Economic Conditions Dow 20,000 The Trump Bump Dow Reaches New Heights Following U.S. Presidential Election Source: Wall Street
Understanding the New Trump Economy Economic Overview. November 17, 2016
 Understanding the New Trump Economy Economic Overview November 17, 2016 Uncertainty at the Na@onal and Interna@onal Level Source: Bureau of Labor Statistics The Trump Bump Why? National Job Growth 500
PaintBall.com is the premier online
 Editorial Focus PaintBall.com is the world s No. 1 paintball resource - with over 12,000 players and people interested in paintball visiting our online network daily. PaintBall.com is the premier online
Recreation. Participation. Topline Report
 Outdoor Recreation Participation Topline Report 2011 Ages 6 + 2010 Outdoor Participation 10.1 Billion Outdoor Outings 73 Average Outings Per Participant Participation in outdoor recreation in 2010 remained
Helmet Usage and Safety Fact Sheet
 CONTACT: Adrienne Saia Isaac Director of Marketing and Communications aisaac@nsaa.org 720.963.4217 (office) UPDATED: December 2018 Helmet Usage and Safety Fact Sheet Approximately 84 percent of skiers
2018 KENTUCKY FACT BOOK
 2018 KENTUCKY FACT BOOK A statistical guide to the Thoroughbred industry in Kentucky Prepared by The Jockey Club Preface This report has been compiled as an industry service by The Jockey Club with the
Potential Solutions for Mercury Control in the Cement Industry Portland Cement Association Meeting
 Potential Solutions for Mercury Control in the Cement Industry Portland Cement Association Meeting August 24, 2009 Agenda Albemarle Sorbent Technologies Quick Overview Mercury Sorbents Control Options
Habit Formation in Voting: Evidence from Rainy Elections Thomas Fujiwara, Kyle Meng, and Tom Vogl ONLINE APPENDIX
 Habit Formation in Voting: Evidence from Rainy Elections Thomas Fujiwara, Kyle Meng, and Tom Vogl ONLINE APPENDIX Figure A1: Share of Counties with Election-Day Rainfall by Year Share of counties with
June 26 27, Gainesville, Florida
 June 26 27, 2018 Gainesville, Florida Welcome, Introductions + Agenda Chris Craig Introductions Name Agency/organization Number of years you ve worked in traffic safety Agenda DAY 1 DAY 2 Action Plan Group
FARS Acc_Aux Analytical Users Manual
 FARS Acc_Aux Analytical Users Manual The s Included in the 'ACC_AUX' database are produced from definitions defined in the 'NCSA - Analytical Data Classification Manual' The Tables in this Manual Contain
Chapter 2: Visual Description of Data
 Chapter 2: Visual Description of Data El Mechry El Koudous Fordham University January 24, 2018 Meshry (Fordham University) Chapter 2 January 24, 2018 1 / 35 Introduction In this chapter we will cover:
FARS Acc_Aux Analytical Users Manual. The Tables in this Manual Contain Fatal Crash Counts
 FARS Acc_Aux Analytical Users Manual The Tables in this Manual Contain Fatal Crash Counts FARS Acc_Aux File s 2005-2014 ANCHOR Table of Contents 1 A_CRAINJ A_CT A_D15_19 A_D15_20 A_D16_19 A_D16_20 A_D16_24
Zions Bank Economic Overview
 Zions Bank Economic Overview Utah Valley University Business and Economic Forum May 18, 2017 National Economic Conditions Dow 20,000 The Trump Bump Dow Reaches New Heights Following U.S. Presidential Election
P: F:
 Featured Fish-Week ofmay 14th 5-6 Premium GradeKoi BuyOneFulCount,GetA SecondFulCount30% OFF 10-12 Premium Select ImportedKoi $95Each Availableincountsof3/6/8 Staf@BlueRidgeKoi.com P:800-334-5257F:336-784-4306
Gay Gilbert, Administrator Unemployment Insurance USDOL/ETA June 22, 2016
 Gay Gilbert, Administrator Unemployment Insurance USDOL/ETA June 22, 2016 Where is Our Program Today? Most Critical Challenges A Program in Transition Using our Valuable Resources What s Important for
Economic Growth in the Trump Economy
 Economic Growth in the Trump Economy Presented to State Data Center Conference William F. Fox, Director November 18, 2016 GDP Grows, Though Slowly 10.0 8.0 Percentage Change, Previous Qtr, SAAR 6.0 4.0
HOW TO START A KIDS TENNIS LEAGUE. Ages 6 to 18. Official Publication. National Sponsors
 HOW TO START A KIDS TENNIS LEAGUE Ages 6 to 18 Official Publication National Sponsors CONTENTS Welcome.........................................1 Getting Started................................... 2 3 Questions
Traffic Safety Facts. State Traffic Data Data. Overview
 Traffic Safety Facts 2015 Data June 2017 DOT HS 812 412 State Traffic Data Key Findings Traffic fatalities increased by 7 percent from 2014 to 2015 (32,744 to 35,092) for the United States. The fatality
Warm Mix Asphalt in the United States: From Evolution to Revolution
 Warm Mix Asphalt in the United States: From Evolution to Revolution Matthew Corrigan, P.E. Asphalt Pavement Engineer Mobile Asphalt Testing Trailer Technical Manager U.S. DOT Federal Highway Administration
OIT: Lessons from the GL BIOTIC Symposium. Tim Campbell
 OIT: Lessons from the GL BIOTIC Symposium Tim Campbell What this is Broad overview of OIT pathways, issues, and current work What this isn t In-depth analysis of each pathway Go to seagrant.wisc.edu/oit
Office of Science & Technology
 NOAA Fisheries Highlights of FEUS 2015 Highlights from the Annual Report Fisheries Economics of the United States, 2015 Office of Science & Technology Fisheries and the Economy U.S. fisheries provide jobs,
Notes on Presentation by Jim Spring of Leisure Trends Group to the National Ski Council Federation September 10, 2004
 Notes on Presentation by Jim Spring of Leisure Trends Group to the National Ski Council Federation September 10, 2004 Jim s first comment was that he has been involved with SIA (Snowsports Industry of
Federal Regulatory Update WTBA/WisDOT Contractor/Engineer Conference
 Federal Regulatory Update 2019 WTBA/WisDOT Contractor/Engineer Conference by Nick Goldstein ARTBA Vice President of Regulatory & Legal Issues January 17, 2019 How the Public Feels Regulations and Transportation
Rotary Club of Pocatello Economic Overview. April 28, 2016
 Rotary Club of Pocatello Economic Overview April 28, 2016 Economic Headwinds National and international uncertainty Continued low energy prices Depressed business investment Unstable inflation outlook
CYCLE-RAMA MARKETING PLAN
 Disclaimer: Cycle-Rama is a fictional company created by the Maine SBDC to illustrate the major components of the Business Plan. It in no way depicts or represents any known company. CYCLE-RAMA MARKETING
Total Frequency Percent CAPS Graduate Graduate Intensive English
 Total Enrollment Fall, Fall I 2006: 8150 All Students by School All Students By Status CAPS & Traditional UG 4722 57.9 Continuing 5926 72.7 Graduate 3406 41.8 First-time Freshman 911 11.2 Intensive English
Blue Ridge Koi's 2017 Published UPS Rates. # of Boxes In Shipment # of Boxes In Shipment 1 to 3 4 or more 1 to 3 4 or more
 Blue Ridge Koi's 2017 Published UPS Rates # of Boxes In Shipment # of Boxes In Shipment 1 to 3 4 or more 1 to 3 4 or more Price Per Box Price Per Box AL $60.00 $35.00 NC $35.00 $25.00 AR $60.00 $35.00
States. Postal Abbreviations LEARN THE. AND. by Joy A. Miller
 1 States LEARN THE AND Postal Abbreviations by Joy A. Miller http://fivejs.com Learn the States and Postal Abbreviations Copyright 2009 Published by Joy A. Miller http://fivejs.com All rights reserved.
Are Highways Crumbling? State and U.S. Highway Performance Trends,
 Policy Study 407 February 2013 Are Highways Crumbling? State and U.S. Highway Performance Trends, 1989 2008 by David T. Hartgen, Ph.D., P.E., M. Gregory Fields and Elizabeth San José Project Director:
SPROUT SPRINGS SKI AREA
 PHILIP E HIGGINS P.C. Principal Broker OR & WA T 503.793.9039 C 503.793.9039 phiggins@pacificcrestrea.com SECTION 1 PROPERTY INFORMATION OFFERING SUMMARY Sale Price: $1,250,000 PROPERTY OVERVIEW Spout
Wenlin Liu, Senior Economist. Stateof Wyoming. Economic Analysis Division State of Wyoming 1
 WYOMING DEMOGRAPHIC AND ECONOMIC TREND LCCC LIFE Program April 7, 2012 Cheyenne, Wyoming Wenlin Liu, Senior Economist Economic Analysis Division Stateof Wyoming Economic Analysis Division State of Wyoming
Wisconsin Concrete Pavement Association. Ed Sullivan, SVP & Chief Economist
 Wisconsin Concrete Pavement Association Ed Sullivan, SVP & Chief Economist February 2018 I Pewaukee, Wisconsin Labor Markets Net Job Creation Monthly Gain 500 7.0% Unemployment Rate U3 Measurement 400
17t h Ann u a l Re p o r t on th e ( ) POLICY STUDY
 POLICY STUDY") July 2008 17t h Ann u a l Re p o r t on th e Per f o r m a n c e of Stat e Hi g h w a y Sy s t e m s (1984 2006) By David T. Hartgen, Ph.D., P.E., and Ravi K. Karanam Project Director: Adrian T. Moore,
July 2008 17t h Ann u a l Re p o r t on th e Per f o r m a n c e of Stat e Hi g h w a y Sy s t e m s (1984 2006) By David T. Hartgen, Ph.D., P.E., and Ravi K. Karanam Project Director: Adrian T. Moore,
NATIONAL UNEMPLOYMENT INSURANCE PROGRAM UPDATE GAY GILBERT, ADMINISTRATOR UNEMPLOYMENT INSURANCE USDOL/ETA JUNE 27, 2018
 NATIONAL UNEMPLOYMENT INSURANCE PROGRAM UPDATE GAY GILBERT, ADMINISTRATOR UNEMPLOYMENT INSURANCE USDOL/ETA JUNE 27, 2018 UI NATIONAL UPDATE v Program Highlights v Quick Look at the Data v Strategic Investments/Initiative
FANNIE MAE CONVENTIONAL PRODUCTS
 30-Year Fixed Rate 20-Year Fixed Rate 15-Year Fixed Rate CONFORMING 30 YEAR FIXED CONFORMING 20 YEAR FIXED CONFORMING 15 YEAR FIXED 4.000 100.299 100.257 100.207 100.168 3.750 99.960 99.909 99.842 99.787
FANNIE MAE CONVENTIONAL PRODUCTS
 30-Year Fixed Rate 20-Year Fixed Rate 15-Year Fixed Rate CONFORMING 30 YEAR FIXED CONFORMING 20 YEAR FIXED CONFORMING 15 YEAR FIXED 4.000 97.328 97.284 97.240 97.193 3.750 97.322 97.263 97.206 97.159 3.125
2018 ILLINOIS FACT BOOK
 2018 ILLINOIS FACT BOOK A statistical guide to the Thoroughbred industry in Illinois Prepared by The Jockey Club Preface This report has been compiled as an industry service by The Jockey Club with the
SPONSORSHIP OPPORTUNITIES
 JACKSON S OLDEST NONPROFIT SPONSORSHIP OPPORTUNITIES 279 FAMILIES 500 STUDENT-ATHLETES 90+ STAFF & COACHES 53 CLUB SPONSORS 356 CLUB DONORS // SPONSORSHIP LEVELS - EXAMPLES OF EXISTING SPONSORS Olympic
Golf Participation in the U.S Edition
 Golf Participation in the U.S. 2016 Edition Golf Participation in the U.S. 2016 Edition Published by National Golf Foundation 501 N Highway A1A Jupiter, Florida 33477 (561) 744-6006 www.ngf.org April 2016
Sustainable Transportation Planning in the Portland Region
 Sustainable Transportation Planning in the Portland Region Jennifer Dill, Ph.D. Associate Professor School of Urban Studies & Planning jdill@pdx.edu http://web.pdx.edu/~jdill/ Outline Elements of a sustainable
2018 FLORIDA FACT BOOK
 2018 FLORIDA FACT BOOK A statistical guide to the Thoroughbred industry in Florida Prepared by The Jockey Club Preface This report has been compiled as an industry service by The Jockey Club with the intent
Experience the Business behind the Sport
 Experience the Business behind the Sport For more information contact: Harris Kalofonos - Manager of Marketing & Development at: hkalofonos@usawrestling.org or 719-265-3629. Quick glance at what we do
Policy Choices for a Genuine Vermont Economy
 Policy Choices for a Genuine Vermont Economy Jon D. Erickson, Zach Zimmerman, Eric Zencey Gund Institute for Ecological Economics University of Vermont www.uvm.edu/giee Vermont Act 113 An act relating
HOW TO START A KIDS TENNIS LEAGUE. Ages 6 to 18. Official Publication
 HOW TO START A KIDS TENNIS LEAGUE Ages 6 to 18 Official Publication CONTENTS Welcome...1 Getting Started... 2 3 Questions and 1 Phone Call...3-4 Equipment/Format...5 Finding Partners.................................
2018 OKLAHOMA FACT BOOK
 2018 OKLAHOMA FACT BOOK A statistical guide to the Thoroughbred industry in Oklahoma Prepared by The Jockey Club Preface This report has been compiled as an industry service by The Jockey Club with the
The Gold Standard in Calibration Mixtures
 The Gold Standard in Calibration Mixtures Calibration standards are used in a wide variety of industries. The need for accurate and precise standards has become increasingly important because of the consequences
2017 OKLAHOMA FACT BOOK
 2017 OKLAHOMA FACT BOOK A statistical guide to the Thoroughbred industry in Oklahoma Prepared by The Jockey Club Preface This report has been compiled as an industry service by The Jockey Club with the
2018 TEXAS FACT BOOK. A statistical guide to the Thoroughbred industry in Texas. Prepared by The Jockey Club
 2018 TEXAS FACT BOOK A statistical guide to the Thoroughbred industry in Texas Prepared by The Jockey Club Preface This report has been compiled as an industry service by The Jockey Club with the intent
FANNIE MAE CONVENTIONAL PRODUCTS
 30-Year Fixed Rate 20-Year Fixed Rate 15-Year Fixed Rate CONFORMING 30 YEAR FIXED CONFORMING 20 YEAR FIXED CONFORMING 15 YEAR FIXED 4.000 97.840 97.786 97.740 97.696 3.750 97.479 97.424 97.366 97.308 3.125