APPENDIX D W-19 FLUVIAL AND TIDAL HYDRAULIC, SEDIMENTATION, WATER QUALITY AND SEA LEVEL RISE MODELING STUDIES
|
|
|
- Donald French
- 5 years ago
- Views:
Transcription
1 APPENDIX D W-19 FLUVIAL AND TIDAL HYDRAULIC, SEDIMENTATION, WATER QUALITY AND SEA LEVEL RISE MODELING STUDIES Final EIR November 2018 Appendices
2 Executive Summary Background: The San Dieguito Lagoon W19 Restoration Project (proposed project) is located within the San Dieguito River Valley in the City of San Diego, California, east of interstate 5 (I-5), south of County Highway S6, and west of El Camino Real (Figure 1). The proposed project would restore approximately 141 acres to a functional mix of tidal salt marsh, brackish marsh, and transitional/upland habitats. During the Feasibility Study (Dokken Engineering 2011), six options were developed and evaluated. After the Feasibility Study, three alternatives were developed for preliminary engineering studies. Each Alternative included a coastal tidal salt marsh west of the Utility Corridor and a brackish marsh east of the Utility Corridor. All three alternatives are located in the same project study area; however, they vary in the acreage of tidal wetlands created, the overall project footprint, as well as the use, size and location of wetland protecting earth berms. At the beginning of the preliminary engineering in 2012, the Army Corps of Engineers (Corps) raised concerns about the adequacy of the one-dimensional flow model, Fluvial-12, to evaluate the W-19 options with unconfined flow. To address this concern a Modeling Technical Review Committee was set up composed of Dr. Howard Chang, Dr. Joe Letter, Dr. Lesley Ewing, Dr. Weixia Jin, and Dennis Bowling. Gordon Lutes served as the committee facilitator. In the third meeting in 2012 it was agreed to use the Corps two-dimensional AdH flow model rather than Fluvial-12 to model the W-19 options and selected alternatives. The AdH model has been used for both the tidal hydraulic, water quality and sea level rise studies and the fluvial hydraulic and sedimentation study to compare W-19 alternatives and identify the impacts of the W-19 project. The engineering analysis for the project was performed as a cooperative model study between the US Army Engineer Research and Development Center (ERDC), Dokken Engineering, contractor to SANDAG (San Diego Association of Governments) and Moffat & Nichol, subcontractor to Dokken Engineering. The engineering analysis was subdivided into a dry weather tidal hydraulic, water quality and sea level rise (Tidal) study performed by Moffat and Nichol and fluvial hydraulic and sedimentation (River) study performed by ERDC. The Tidal study report entitled Tidal Hydraulic, Water Quality and Sea Level Rise Studies dated July 2018 is included in Attachment A. The River study entitled Numerical Modeling of San Diego River Lagoon Wetland Restoration, dated, is included in Attachment B. Attachment C, entitled Draft Technical Memorandum Elevations of Habitat Breaks for San Dieguito Lagoon Restoration Plan W19 dated August 14, 2014 and revised June 22, 2016 by Nordby Biological Consulting, defines the salt marsh habitat elevation breaks. Attachment D includes the Coastal Sediment Budget Analysis Memorandum, dated July 20, 2018.
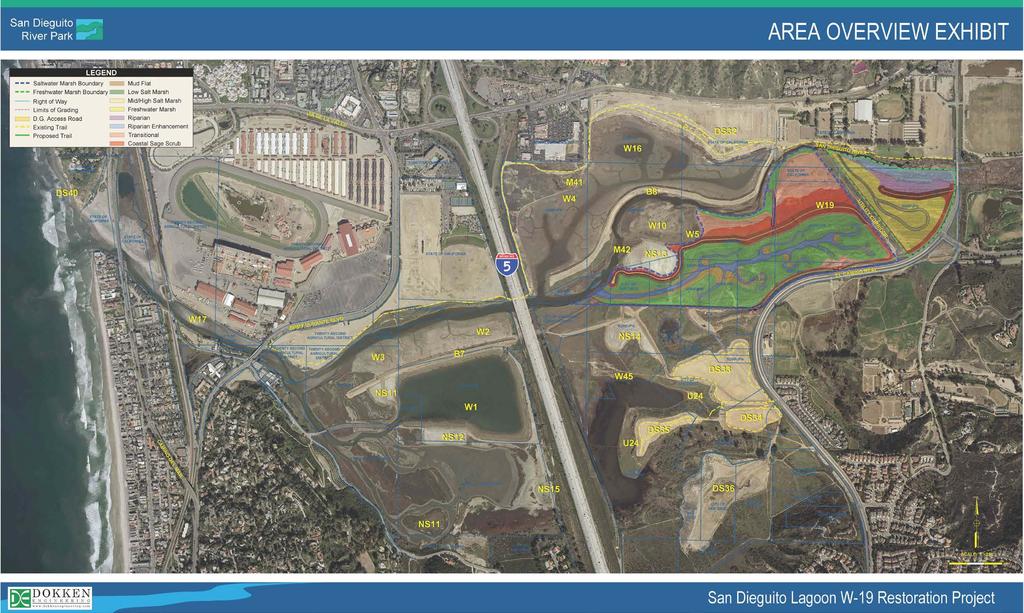
3 FIGURE 1
4 The modeling studies were performed for existing conditions and three proposed alternatives. Tidal modeling studies evaluated existing and proposed wetland hydraulics, tidal circulation efficiency and sea lever rise impacts under dry weather conditions. The River modeling studies provided the flooding impacts, geomorphological response and sediment supply to the coastal zone associated with existing conditions and alternative wetland restoration designs. Evaluation Criteria During the W-19 feasibility stage the following criteria used by Southern California Edison (SCE) for their wetlands project were used to screen options and were used to evaluate alternatives in the preliminary engineering phase: Beach Sand Supply no more than a 2% reduction in river sediment reaching the ocean. Beach sand is an important regional resource. While the major supply of beach sand comes from eroding beach cliffs and as little as 5% comes from the San Dieguito River, an important evaluation criterion in comparing alternatives is maintaining the river sediment supply to the ocean. Sustainable Wetlands no more than 6 sediment deposition after major storms. New wetlands should require limited maintenance or dredging after major storm events. In other saltwater wetlands it has been observed that as little as 3 to 6 of sediment deposition can kill existing habitat. An Alternative with little or no sediment depositing in wetlands over a 100-year storm cycle would require minimum maintenance to sustain wetland habitats and would minimize the loss of river sediment to the ocean. Impacts to SCE Wetlands tidal muting no more than 0.2 ft and no added siltation in wetlands. The tidal inundation range and frequency control the elevations at which marsh habitat will establish. The larger the tidal range, the greater the elevation range over which saltwater marsh habitat can become established. Therefore, minimizing tidal muting from W-19 minimizes any negative impacts of W-19 on the SCE wetlands. Added siltation in the wetlands would require additional maintenance and potential damage to wetlands. Existing Infrastructure/Private Property velocity increase within 0.1 ft/sec. Increased velocity could damage existing infrastructure or private property. Alternatives resulting in greater increases need to be further analyzed for possible impacts. Flood Protection/Floodplain Impacts 100-year water surface elevation increase no more than 0.2 feet. According to Hydrology Guidelines for Determining Significance (County of San Diego, Department of Public Works, 2007), it is considered as a significant hydrology impact for San Dieguito River if the 100-year water surface elevation increases by 0.2 ft or more.
5 Ocean Inlet Opening no increase in frequency of dredging to maintain open inlet. Maintaining an open ocean inlet is critical to the health of the existing lagoon and future created wetlands. Keeping the inlet open is currently the responsibility of SCE. Summary of Modeling Results and Conclusions Tidal Hydraulic, Water Quality and Sea Level Rise Modeling Tidal Modeling Studies The hydrodynamic model was calibrated with measured tides and verified with habitat elevation surveys. The calibrated model was then used for alternative evaluation. Current Sea Level Condition Results The W19 wetland under all alternatives would generally achieve the desired tidal range and inundation frequency to support the proposed saltwater marsh habitat as defined in the table 1. TABLE 1 Target Habitat Elevation Range (ft, NGVD29) Inundation Frequency Transition Zone > % High Marsh +3.0 to %-4% Mid Marsh +1.9 to %-20% Low Marsh +1.4 to %-40% Intertidal Mudflat -0.3 to %-100% Subtidal -2.0 to % W-19 will increase the tidal prism of San Dieguito Lagoon, which increases the flushing of sediment from the ocean inlet, forestalls the tendency of the inlet to close, but at the same time would also bring more littoral sand into the system, thus increases the maintenance dredging quantities. With W-19 restoration, the tidal ebb velocity through the ocean inlet increases, but is not high enough to maintain a stable inlet without maintenance dredging. The entrance channel to the W19 salt water marsh and entrance to the brackish marsh may experience slight sedimentation shortly after construction as a result of morphological adjustment of the channel shape toward an equilibrium condition, but it does not require any regular maintenance and should remain stable under the dry weather condition.

6 The tidal flow velocity within W-19 during dry weather without fluvial stormflow events is too low to raise any scour concerns in the wetlands. The implementation of the W19 wetland would slightly reduce the tidal range in the SCE restored wetlands. The overall impacts of 0.18 feet and 0.05 feet reduction in tidal range for W4/W16 and W1 respectively are within the previously-determined acceptable threshold of 0.2 feet. Exhibit 1 shows the loss of 1.73 Ac and 0.03 Ac of habitat for W4/W16 and W1 respectively assuming no rise in sea level. More important to the health of the wetlands is the maintenance dredging of the ocean entrance channel. The muting effect of the shoal in the ocean entrance channel is much greater than the muting effect caused by restoring the W19 wetlands. EXHIBIT 1
7 Sea Level Rise (SLR): Background: The impact of sea level rise on the performance and sustainability of the wetlands within the San Dieguito Lagoon is a complex issue. The rise in sea level will occur very slowly over time. Over this same time there is a potential for sedimentation and organic productivity within the wetlands to trap material, effectively raising the level of the wetlands and at least partially offset the rising water level. The effectiveness of these processes to offset sea level rise by raising the wetlands will be controlled by sediment supply, the rate of change in sea level and other factors. Note that sediment deposition of greater than 3 to 6 in a single event, while raising the level of the wetlands, would also likely kill the existing wetland vegetation, so there is a limit to how much deposition can be accommodated without loss of the existing vegetation. The actual elevation change of the wetlands is assumed to be bounded by two conditions. First, the accumulation of material on the bottom cannot be such that the depth of water would decrease with sea level rise. This first condition would essentially be raising the bottom bathymetry at the same rate as sea level rise. That is a reasonable assumption for an upper bound. Secondly, the lower bound would be that there is no accumulation and the bottom is held static as sea level increases the overall water depth. The model results for the current conditions supply the upper bound condition. The lower bound discussed below was simulated by just raising the mean water level of the ocean tide and keeping the bathymetry the same as for current conditions. Results: Two sea level rise (SLR) conditions (1.5-feet rise and 5.5-feet rise) were modeled. The results indicate that the tidal range and the intertidal habitat range would increase with SLR. SLR would also increase tidal prism and tidal velocity through the ocean inlet channel, which would lead to a more stable inlet. With the 1.5-feet SLR, the average spring tidal range in the wetlands would increase approximately 0.4 feet, and the intertidal habitat zone would shift upward by 1.3 feet under the dredged condition and 1.1 feet under the shoaled condition. With the 5.5-feet SLR, the average spring tidal range in the wetlands would increase approximately 3.0 feet, and the intertidal habitat would shift upward by 4.2 feet under the dredged condition and 3.9 feet under the shoaled condition. Most intertidal area under the current sea level condition would be converted to subtidal area. Therefore, wetlands would be skewed to subtidal and mudflat areas rather than vegetated marsh.
8 Water Quality Modeling Results: The AdH model simulated the tidal flushing efficiency of water quality constituents in the wetland basins as measured by the residence time. The model assumed that the ocean water is the clean water source. Therefore, the residence time increases with the distance from the ocean entrance. Under the dredged condition tidal flushing is more efficient resulting in a shorter residence time than under the shoaled condition. Below is a summary of residence times at the selected locations: Restoring W-19 is a water quality benefit to the entire system. In the existing wetlands (W1 and W4/W16) the residence time will be shortened by between 1 and 2 days with the implementation of the proposed W19 project, except that in the W1 wetland under the shoaled condition where the residence time will be shortened by 10 days. Within the proposed W19 project, the residence time varies between alternatives, but the most significant factor in the residence time is the ocean inlet condition. Under Alternatives A and B, the residence time varies from 7.8 days under the dredged condition to 21.7 days under the shoaled condition. Under Alternative C, the residence time at the protected wetland area varies from 8.8 to 21.7 days and at the unprotected wetlands areas residence time varies from 12.5 to more than 25 days. Source control of contaminants and maintenance dredging of the ocean inlet and wetland inlets will be critical to maintaining good wetland water quality conditions. Compared to the W4/W16 wetlands, W19 has slightly longer residence time as it is located farther away from the ocean inlet. In the proposed Brackish Marsh, the residence time is longer than the simulation time of 25 days due to its long distance from the ocean inlet. The circulation is relatively poor in this area. Contaminant source control is the most importance measure to maintain good water quality in this area. River Hydraulic and Sedimentation Modeling A numerical sediment transport model was developed for evaluation of alternative wetland restoration designs for the San Dieguito River Lagoon. The sediment transport model was verified against observations before, during and after the January 1993 flood, which was estimated to be a 12-year flood event. The model was then used to screen proposed design alternatives in a three phase testing program. The first phase screened general conceptual designs for a 100-year flood event. During the first phase of screening numerous subtle design variations for the general conceptual designs were evaluated. During the second phase of screening revised conceptual designs were then tested for 10-, 25-, 50- and 100-year flood events. In addition, the second phase screening included a 100-year series simulation designed to approximate the overall sediment transport potential for a 100-year period of flood events.
9 The final phase of screening was performed for three further refined final alternatives, repeating all of the test river flood conditions. The final phase of testing focused on the preferred alternative (Alternative A), which includes a dike/berm protecting the salt and brackish marsh from direct sediment delivery from the river. Summary of Findings Beach Sand Supply/Sediment Delivery The long-term sediment delivery to the ocean is best predicted by the 100-year series AdH model runs, where the 100-year series includes a number of storm events over a 100-yr period. The 100-year series predicted the following reduction in sediment supply downstream of the project compared to existing conditions: 7.6 percent for Alternative A; 25.9 percent for Alternative B; and 10.2 percent Alternative C. Sustainable Wetlands Sediment impacts to SCE Wetlands (100-yr Storm Series) W-19 results in no measurable sediment deposition in SCE s wetlands (W4/W16). W-19 has no significant impact on sediment deposition at the inlet to W4 (It was noted that with or without W-19, the inlet to W-4 will need to be cleared of sediment after major storm events). SCE s W5/W10 will be severely impacted by larger storm events with or without W-19. Sediment impacts to W19 Wetlands (Various Storms) The wetland surface changes from sediment deposition after a 25-year or greater flood event. The following is a summary of the sediment deposition by storm frequency for the proposed project (Alternative A) and other two alternatives. Table 2 below shows the volume (cy) of river sediment deposited by storm by area for the project and two alternatives. 25-yr Storm o The project and alternatives receive small amounts of deposition in the inlets to the wetlands o Alternative B receives some deposition in the brackish marsh o Alternative C receives a large volume of sediment in the riverside marsh 50-year Storm o Larger volumes of sediment deposited in the inlets o The project receives small amount of sediment in salt marsh and brackish marsh o Alternative B receives large amount of sediment in both salt and brackish marsh
10 o Alternative C receives no significant sediment in protected salt and brackish marsh, but over 150,000 cy in riverside marsh 100-year Storm o The project salt marsh and brackish marsh both receive significant volume of sediment. Salt marsh receives sediment from flood waters flowing over the utility corridor from the brackish marsh o Alternative B salt marsh is more than 50% covered by sediment and the brackish marsh is more than 2/3 covered by sediment o Alternative C has the least volume of sediment deposits in the protected salt marsh and brackish marsh, but the riverside marsh is almost covered by more than four feet of sediment TABLE 2. SEDIMENT DEPOSITION VOLUME (CY) BY ALTERNATIVE BY STORM FREQUENCY Alternative/Wetland Area Project (Alternative A) Alternative B Alternative C 25-yr Storm 50-yr Storm 100-yr Storm 25-yr Storm 50-yr Storm 100-yr Storm 25-yr Storm 50-yr Storm 100-yr Storm Inlets 7,000 24,000 19,000 3,000 20,000 27,000 7,000 23,000 12,000 Salt Marsh 0 5,000 30, , , ,000 Brackish Marsh 0 8,000 28,000 16,000 44,000 62, ,000 Riverside Marsh (Alt C) NA NA NA NA NA NA 53, , ,000 Total Sediment Volume (cy) 7,000 37,000 77,000 19, , ,000 60, , ,000
11 The proposed project and Alternative C protective salt marsh and brackish marsh are separated from the river by natural appearing earth berms resulting in reduced flooding and sediment deposition. In addition to the sediment removal planned for the inlets, the interior area of the salt marsh and brackish marsh for the proposed project and Alternative C will receive adaptive management to insure habitat areas are restored as required. Without maintenance removing the sediment and assuming no sea level rise, areas with greater than 3 to 6 inches of sediment will likely kill the existing habitat. In addition, sediment deposition reduces the frequency of tidal inundation for the area covered with sediment and can reduce or totally block tidal flows to interior wetlands. Tidal areas where sediment reduces the frequency of tidal inundation are expected to convert over time to the habitat supported by the reduced frequency of inundation. Table 3 below shows how the unmaintained wetlands habitat for Alternatives B and C will convert assuming only inlet maintenance for Alternative B and no maintenance for the riverside wetlands in Alternative C. Table 3 assumes that isolated wetland areas without tidal flows will convert to high marsh.
12 HABITAT WETLAND AREA SOUTH OF MAINTENANCE ROAD INITIAL AREA (AC) WETLAND AREA NORTH OF MAINTENANCE ROAD & BRACKISH MARSH (Alt B) TABLE 3. HABITAT CONVERSION HABITAT AREA CONVERSION TABLE FOR ALTERNATIVES B AND C WETLAND AREA SOUTH OF MAINTENANCE ROAD AFTER 100-YR STORM EVENT AREA (AC) DIFFERENCE 1) AREA (AC) DIFFERENCE 1) AREA (AC) DIFFERENCE 1) AREA (AC) DIFFERENCE 1) ALTERNATIVE B OPEN WATER (-2.0-(-0.3)) MUD FLAT ((-0.3)-1.4) LOW SALT MARSH ( ) MID SALT MARSH ( ) HIGH SALT MARSH ( ) SUBTOTAL WETLAND SUBTOTAL BRACKISH MARSH ( ) ALTERNATIVE C WETLAND AREA NORTH OF MAINTENANCE ROAD & BRACKISH WETLAND AREA SOUTH OF MAINTENANCE ROAD AFTER 50-YR STORM EVENT WETLAND AREA NORTH OF MAINTENANCE ROAD & BRACKISH OPEN WATER (-2.0-(-0.3)) MUD FLAT ((-0.3)-1.4) LOW SALT MARSH ( ) MID SALT MARSH ( ) HIGH SALT MARSH ( ) SUBTOTAL WETLAND HABITAT WETLAND AREA SOUTH OF MAINTENANCE ROAD INITIAL AREA (AC) WETLAND AREA NORTH OF MAINTENANCE ROAD & BRACKISH MARSH (Alt B) WETLAND AREA SOUTH OF MAINTENANCE ROAD AFTER 25-YR STORM EVENT AREA (AC) DIFFERENCE 1) AREA (AC) DIFFERENCE 1) AREA (AC) DIFFERENCE 1) AREA (AC) DIFFERENCE 1) ALTERNATIVE B OPEN WATER (-2.0-(-0.3)) MUD FLAT ((-0.3)-1.4) LOW SALT MARSH ( ) MID SALT MARSH ( ) HIGH SALT MARSH ( ) SUBTOTAL WETLAND SUBTOTAL BRACKISH MARSH ( ) ALTERNATIVE C OPEN WATER (-2.0-(-0.3)) MUD FLAT ((-0.3)-1.4) LOW SALT MARSH ( ) MID SALT MARSH ( ) HIGH SALT MARSH ( ) SUBTOTAL WETLAND NOTE: Difference 1) = Habitat wetland area (ac) after storm event - Initial habitat area (ac) before storm event Habitat type defined by inundation frequency. Where wetland area below elevation 4.5 is isolated from tidal inundation by sediment deposition after storm event, assumed wetland area converted to high marsh WETLAND AREA NORTH OF MAINTENANCE ROAD & BRACKISH WETLAND AREA SOUTH OF MAINTENANCE ROAD AFTER 10-YR STORM EVENT WETLAND AREA NORTH OF MAINTENANCE ROAD & BRACKISH
13 W-19 Impact on Others SCE Wetlands: as mentioned above W-19 results in no measurable sediment deposition in SCE s wetlands W4/W16, but would slightly reduce the tidal range in the SCE restored wetlands resulting in a potential loss of 1.73 Ac. of habitat. Existing Infrastructure/Private Property along the river: Water Surface Profile: The results showed that W-19 will result in a water surface profile at or below the existing for all alternatives for all storm events modeled. Velocity: In general there is a slight increase in the flow velocity with W-19, which is consistent with a slight lowering of the water surface profile. W-19 does not introduce a new hazard to existing infrastructure or private property along the river. All existing infrastructure with erosive velocities with W-19, have similar erosive velocities under existing conditions. Modeling Summary The two-dimensional ADH numerical model developed for this project is appropriate to the complexity of the geomorphological response of the system for the proposed alternatives and the dynamics of the river hydrology. The general performance of Alternative A to erosion and deposition over the range of conditions tested is closest to the performance of the existing conditions and is therefore the preferred alternative. Below is a summary comparing the alternatives with the screening criteria.
14 100-year Water Level 100-year Velocity at Infrastructure Sediment Delivery to Ocean Tide Muting in W4 (SCE) Wetlands Sustainability Tide Range in W19 (SANDAG) Summary Design Criteria Proposed Project (Alternative A) Within 0.2 foot increase of existing flood El Camino Real (ECR) Within 0.1 fps increase of existing flood velocities Within 2% of existing conditions for 100-yr storm series Both high and low tide elevations to be within 0.2 feet of existing Yes No No 8% reduction Yes Alternative B Yes No No 26% reduction Yes Deposition in Wetland area to be less than 3-6 inches (100-yr storm) Yes modeling shows some wetland areas next to the utility corridor will receive greater than 6 of sediment, but adaptive management will maintain wetlands habitat No Deposition of 4 or greater over large areas w/o planned maintenance to restore habitat. Mimic SCE W4 Yes Yes Preferred Alternative based on sediment delivery to the ocean and wetlands sustainability River sediment will destroy significant area of brackish marsh after a 25-yr storm event and significant area of tidal marsh with 50-yr storm event. The 100-yr storm destroys over half the wetlands. Alternative C Yes No No 10% reduction Yes Yes Protected Salt Marsh and Brackish Marsh similar to proposed project. No Unprotected riverside Salt Marsh is mostly covered with sediment Yes Interesting combination of A & B, while an improvement on B, it is inferior to A in terms of sediment delivery to the ocean and wetlands sustainability Comments All Alternatives were at or below existing 100-yr flood El Camino Real Velocities were generally slightly higher, but no additional scour at infrastructure is anticipated Beach sand supply study states that sediment from the River is a small, but important contributor. Maintenance dredging study identifies mitigation for Project. Shoaling of the ocean entrance has a much larger impact on SCE tidal range than W-19 All Alternatives will require some maintenance of inlets after 25-yr storm W-19 tidal range equal or greater than SCE W-4 tidal range Unprotected wetlands will become low flow channel after major event destroying wetlands.
15 Conclusions of Fluvial Hydraulic and Sedimentation Studies The existing conditions over the reach of the river where the proposed wetlands are to be built had already reached a point in the evolution of the geomorphology of the system that the offchannel flood plain was filled to an elevation controlled by the flood levels themselves. Adding alternatives that lower the flood plain elevation puts the system back into a morphological state when the river is seeking the most hydraulically efficient path-way to the ocean. At extreme flood levels the most efficient pathway without berms or dikes to control the flow becomes splitting off a portion of the flow and diverting it through the wetland as seen with Alternative B. This process of flows splitting off is the natural optimization that occurs within all riverine deltaic systems. The general performance of the project (Alternative A) to erosion and deposition over the range of conditions tested is closest to the performance of the existing conditions and therefore is the preferred alternative. The magnitude of the maintenance volumes is essentially the same for Alternatives A and C for the protected salt and brackish marsh without considering the unprotected riverside marsh in Alternative C. The maintenance volumes for Alternative B are meaningless because they only include the inlets and do not include the unmaintained interior wetland buried by sediment. All alternatives meet the flood level criteria with no increase. River channel erosion at the utility corridor is an existing problem and the W-19 project does not add to the problem. None of the alternatives considered pose any additional erosion threat in the lower portion of the system west of the Interstate 5 Bridge that isn't present in the existing conditions. There is the potential for flanking erosion at several bridge abutments for existing conditions as well as with W-19 project and alternatives.
16 ATTACHMENT A TIDAL HYDRAULIC, WATER QUALITY AND SEA LEVEL RISE STUDIES
17 San Dieguito Lagoon W-19 Restoration Project San Diego Association of Governments Tidal Hydraulic, Water Quality and Sea Level Rise Studies Prepared for: Dokken Engineering Prepared by: 3780 Kilroy Airport Way Suite 600 Long Beach, CA 90806
18 EXECUTIVE SUMMARY San Dieguito Lagoon is located within the San Dieguito River Valley in the City of San Diego, San Diego County, California. The (proposed project) would be located within San Dieguito Lagoon, east of lnterstate 5 (I-5), south of County Highway S6, and west of El Camino Real. The proposed project would restore approximately 141 acres to a functional mix of tidal salt marsh, brackish/freshwater marsh, and transitional/upland habitats. After the Feasibility Study (Dokken Engineering 2011), three alternatives were developed for preliminary engineering studies. Each Alternative includes a coastal tidal salt marsh west of the utility corridor and a brackish/freshwater marsh east of the utility corridor. All three alternatives are located in the same project study area; however, they vary in the amount of tidal wetlands created, the overall project footprint, as well as size and location of berms. This Tidal Hydraulic, Water Quality and Sea Level Rise Studies report was prepared to support the preliminary engineering study and environmental document. The AdH numerical model was used for the tidal hydraulic, water quality and sea level rise (SLR) modeling. The modeling was performed for existing conditions and three proposed alternatives to evaluate wetland hydraulics, tidal circulation efficiency under dry weather conditions, and impacts of SLR to wetland habitat transition and acreages. Tidal Hydraulic Modeling Results The hydrodynamic model was calibrated with measured tides and verified with habitat elevation surveys. The calibrated model was then used for alternative evaluation. The modeling results under the current sea level condition indicate: The W-19 wetland under all alternatives would generally achieve the desired tidal range and inundation frequency to support the proposed saltwater marsh habitat. The tidal prism of San Dieguito Lagoon would increase about 30% and tidal flow velocity through the ocean tidal inlet would increase approximately 10% with the restoration of the W-19 wetlands. Increasing the tidal prism and tidal velocity will increase the flushing of sediment from the ocean inlet, forestalling the tendency of the inlet to close and potentially reducing the frequency of maintenance dredging required. However, it could also bring more sediment into the system, thus increasing the ultimate maintenance dredging quantities. The tidal ebb velocity through the tidal inlet is less than 3 fps under the shoaled condition and approximately 3 fps under the dredged condition. This velocity is not high enough to maintain a stable inlet without maintenance dredging. The entrance channel to W-19 may experience slight sedimentation shortly after construction as a result of morphological adjustment of the channel shape toward an equilibrium condition, but it does not require any regular maintenance and should remain stable under the dry weather condition. The tidal flow velocity during dry weather without fluvial stormflow events varies throughout the hydraulic system. The velocity is higher in the confined channels under Tidal Hydraulic, Water Quality and SLR Studies i
19 bridge crossings and lower in the wetland areas. Overall, the dry weather tidal flow velocity is too low to raise any scour concerns in the wetlands. The implementation of the W-19 wetland would slightly reduce the tidal range in the SCE restored wetlands. However, the overall impacts are small and within the previouslydetermined threshold of 0.2 feet. Maintenance dredging of the ocean entrance channel is an important action as the muting effect of restoring the W-19 wetlands is much less than the muting effect caused by the shoal in the ocean entrance channel. Sea Level Rise Modeling Results Two SLR conditions (1.5-foot rise and 5.5-foot rise) were modeled. The results indicate that the tidal range and the intertidal habitat range would increase with SLR. With SLR, the acreage of vegetated habitats would decrease while those of mudflat and subtidal habitats would increase. SLR would also increase tidal prism and tidal flow velocity through the ocean inlet channel, which would lead to a more stable inlet. With the 1.5-foot SLR scenario, the average spring tidal range in the wetlands would increase approximately 0.4 feet, and the intertidal habitat would shift upward by 1.3 feet under the dredged condition and 1.1 feet under the shoaled condition. With the 5.5-foot SLR scenario, the average spring tidal range in the wetlands would increase approximately 3.0 feet, and the intertidal habitat would shift upward by 4.2 feet under the dredged condition and 3.9 feet under the shoaled condition. Most intertidal area under the current sea level condition will be converted to subtidal area. Therefore, wetlands will be skewed toward being subtidal and mudflat areas rather than vegetated marsh. Water Quality Modeling Results The AdH model was used to simulate the tidal flushing efficiency of water quality constituents in the wetland basins under dry weather conditions. The tidal flushing efficiency is measured by the residence time. The residence time is affected by the ocean inlet shoal conditions. The tidal flushing is more efficient and the residence time is shorter under the dredged condition than under the shoaled condition. Also, the residence time increases with distance from the ocean entrance since it is assumed that ocean water is the clean water source. Below is a summary of residence times at the selected gage locations: In the existing wetlands of W4/W16, the residence time varies from 6.8 days under the ocean inlet dredged condition to 8.9 days under the shoaled condition. Obviously shoaling significantly influences residence time. Due to the differences caused by dredged or shoaled conditions, residence time values will be relayed with a designation of dredged or shoaled in parentheses in this report. Similarly, the W1 basin under the shoaled condition has a long residence time of 18.7 days. The residence time in W1 is relatively long because it is influenced by older water from more distant reaches upstream that enter it during site drainage during ebbing tides. The residence times in W4 and W16 will be shortened by between 1 and 2 days with the implementation of the proposed W-19 project, and the residence time in the W1 wetland under the shoaled condition will be Tidal Hydraulic, Water Quality and SLR Studies ii
20 shortened by 10 days. This is a water quality benefit, or improvement, to the entire system. Although the residence time in the W1 wetland is nearly 20 days under the shoaled existing condition, there are no known problematic water quality conditions in the W1 wetland. Residence time is a relative measure of the circulation, not a direct measure of water quality conditions. The water quality condition can still be relatively good even with a long residence time when there are no ambient pollutant sources. The San Dieguito River hydraulic system is more natural compared to other hydraulic systems that receive more dry weather nuisance flows and have greater impacts from urbanization. Therefore, although the numbers indicate water residence time is relatively long, there are no recorded significant problems with water quality in W1during the dry weather conditions. In the proposed W-19 salt marsh project area, the residence time varies between alternatives and for varying ocean inlet shoal conditions. Under Alternatives A and B, the residence time varies from 7.8 days (dredged) to 21.7 days (shoaled). Under Alternative C, the residence time at the protected wetland area varies from 8.8 (dredged) to 21.7 days (shoaled) and in the unprotected wetland areas residence time varies from 12.5 days (dredged) to more than 25 days (shoaled). Similar to W1, the ocean inlet shoal condition has a significant impact on the residence time in the W-19 wetlands. Maintenance dredging will be critical to wetland circulation conditions. Compared to the W4/W16 wetlands, W-19 has slightly longer residence time as its connection to the main channel is farther upstream and farther away from the ocean inlet. Due to this situation combined with the artifact caused by older upstream water entering the site during ebbing tides, the residence time in the unprotected part of the W-19 wetland is longer than that in the protected part of the W-19 wetland for Alternative C. The best reference sites for the proposed W-19 salt water wetlands are the existing wetlands at W1, W4, and W16 in the San Dieguito River hydraulic system. The residence times in the proposed W-19 wetlands are very similar to those in the W1 wetland under existing conditions. Therefore, water quality conditions in the proposed W-19 wetlands are expected to be similar to that of the W1 wetland, and little stagnation is expected. In the proposed brackish marsh, the residence time at the entrance to the brackish marsh is longer than the model simulation duration of 25 days under both the existing and proposed project conditions. There are no known problematic water quality conditions in the river at the entrance to the brackish marsh under dry weather conditions. The dry weather water quality condition is expected to be improved over existing conditions, due to overall enhanced circulation under proposed conditions. The entrance channel to the brackish marsh will receive daily tidal circulation and no stagnation is expected. In the loop channel of the brackish marsh, the channel is graded to remain elevated and to have a hydraulic gradient resulting in net one-way flow from the brackish marsh to the river. The marsh bed is graded to be higher than the groundwater table in the dry season to prevent standing water and any vector issues. In summary, the proposed W-19 project would slightly improve the dry weather circulation and reduce residence times in the existing marshes and river, and hence, improve the dry weather Tidal Hydraulic, Water Quality and SLR Studies iii
21 water quality conditions. The water quality condition in the proposed W-19 salt water wetlands is expected to be similar to the W1 wetland. The brackish marsh is graded to promote one-way net flow and prevent the stagnation and vector issues. Qualitatively, the proposed W-19 project would not change or worsen wet weather water quality conditions in the San Dieguito River, as the proposed project would not change the stormflow hydrograph or increase pollutant loads. In other words, proposed alternatives will not degrade water quality standards or beneficial uses, or generate pollutants compared to existing conditions. Effects of Proposed Wetland Restorations of W6 and Southern Overflow Lot in Fairground Southern California Edison (SCE 2015) is proposing to restore a one-acre site (W6) immediately upstream of the I-5 Bridge and south of the river. The site is currently non-tidal. SCE is proposing to restore the site to a salt marsh by lowering the site to 0.5 feet NGVD to receive tidal influence. The 22 nd District Agricultural (22 nd Ag District) Association (2014) is proposing to restore the South Overflow Lot (SOL) in Del Mar Fairground. The SOL site is bounded by Jimmy Durante Boulevard to the north and the San Dieguito River to the south and west. The site is currently non tidal at an elevation of approximately 5 feet NGVD. The restoration has been divided into two phases. Phase I includes the restoration of subtidal and intertidal marsh, as well as some transitional upland habitat within the southwestern portion of the SOL. The total acreage for Phase I is 3.18 acres. Phase II includes the restoration of 1.46 acres of low marsh, 2.73 acres of mid-marsh habitat, and 2.19 acres of high marsh habitat, as well as, 1.92 acres of upland habitat restoration. An additional 0.03 acre of subtidal habitat, 0.42 acre of frequently flooded mudflat habitat, and 0.83 acre of frequently exposed mudflat habitat will also be restored. The salt marsh habitat composition of these two small projects is similar to that of W-19. The tidally-influenced area of the SOL project is 3.18 acres and that of the Phase II restoration is 7.66 acres, so the combined tidally-influenced areas are approximately 10 acres. This compares to the area of the proposed W-19 restoration project, which is 141 acres. The total combined area of proposed 22 nd Ag District restoration is less than 10% of the W-19 restoration area. As the proposed W-19 restoration project is so much larger than these two smaller projects and it would result only 0.2 feet of tidal muting, the two small projects combined would have less impact to tidal muting, and that muting is expected to be less than 0.02 feet. Therefore, the two proposed restoration projects would result in indiscernible impacts while enhancing the overall circulation of the San Dieguito Lagoon hydraulic system. Tidal Hydraulic, Water Quality and SLR Studies iv
22 TABLE OF CONTENTS 1.0 INTRODUCTION SCOPE OF WORK Tidal Hydraulic Study Water Quality Study Evaluation of Potential Impacts to SCE Project WETLAND RESTORATION ALTERNATIVES No Project - Existing Conditions Alternative A Alternative B Alternative C ADAPTIVE HYDRAULICS MODEL DEVELOPMENT Model Selection and Description Model Setup Model Area Bathymetry Finite Element Mesh Boundary Conditions Tides Modeling Tidal Series Sea Level Rise Model Calibration for Existing Tidal Conditions Model Setup for Calibration Calibration Results Verification Results Model Verification of Habitat Elevation Breaks in W4/W TIDAL HYDRAULIC MODELING RESULTS Tidal Hydraulic Results Without SLR Tidal Flow Velocities Tidal Flow Velocity at the Ocean Inlet Tidal Flow Velocities at the Entrances to Internal Wetlands Potential Scour during Dry Weather Tidal Elevations and Tide Ranges Dredged Condition Shoaled Condition Summary Tidal Prism Tidal Inundation Frequency Tidal Hydraulic Results with 1.5-Foot of Sea Level Rise (SLR) Tidal Flow Velocities Tidal Flow Velocity at the Ocean Inlet Tidal Flow Velocity at Entrance to Wetlands Potential Scour during Dry Weather Tidal Elevations and Tide Ranges Dredged Condition Shoaled Condition Tidal Prism...55 Tidal Hydraulic, Water Quality and SLR Studies v
23 5.2.4 Tidal Inundation Frequency Tidal Hydraulic Results with 5.5-Foot of SLR Tidal Flow Velocities Tidal Flow Velocity at the Ocean Inlet Tidal Flow Velocity at Entrances to Wetlands Potential Scour During Dry Weather Tidal Elevations and Tide Ranges Dredged Condition Shoaled Condition Tidal Prism Tidal Inundation Frequency Summary WATER QUALITY MODELING RESULTS Methodology Model Calibration Residence Time Results Overall Water Quality Conditions Summary CONCLUSIONS REFERENCES LIST OF FIGURES Figure 1-1: Project Vicinity Map... 2 Figure 1-2: Project Site... 3 Figure 3-1: Alternative A... 7 Figure 3-2: Alternative B... 9 Figure 3-3: Alternative C...11 Figure 4-1: Numerical Modeling Area...13 Figure 4-2: Existing Bathymetry/Topography for the Inland Modeling Area...14 Figure 4-3: AdH Model Mesh East of the I-5 Freeway for Existing Conditions...15 Figure 4-4: AdH Model Mesh East of the I-5 Freeway for Alternative A...16 Figure 4-5: AdH Modeling Mesh East of the I-5 Freeway for Alternative B...16 Figure 4-6: AdH Modeling Mesh East of the I-5 Freeway for Alternative C...17 Figure 4-7: Modeling Tidal Series...19 Figure 4-8: AdH Model Calibration Gage Locations...20 Figure 4-9: AdH Model Calibration Results for the Shoaled Condition at the I-5 Bridge...21 Figure 4-10: AdH Model Verification Results for Dredged Conditions at I-5 Bridge...22 Figure 4-11: AdH Model Verification Results for Dredged Conditions at TS Figure 5-1: Velocity Gage Locations...25 Figure 5-2: Tidal Velocity at HW101 - Dredged Condition...25 Figure 5-3: Tidal Velocity at HW101 Shoaled Condition...26 Figure 5-4: Peak Flood Tide Current Comparison Between Existing and Alt A...28 Figure 5-5: Peak Ebb Tide Current Comparison Between Existing and Alt A...29 Figure 5-6: Peak Flood Tide Velocity Contours for Existing Conditions...31 Figure 5-7: Peak Ebb Tide Velocity Contours for Existing Conditions...32 Figure 5-8: Peak Flood Tide Velocity for Alternatives A & B...33 Figure 5-9: Peak Ebb Tide Velocity for Alternatives A & B...34 Tidal Hydraulic, Water Quality and SLR Studies vi
24 Figure 5-10: Peak Flood Tide Velocity for Alternative C...35 Figure 5-11: Peak Ebb Tide Velocity for Alternative C...36 Figure 5-12: WSE Gage Locations for Existing Conditions and Alternatives...37 Figure 5-13: Tidal Elevations at W-19 Wetland Dredged Condition...39 Figure 5-14: Tidal Elevations at the Brackish Marsh Mouth Dredged Condition...40 Figure 5-15: Tidal Elevations at the W4 Wetland Dredged Condition...40 Figure 5-16: Tidal Elevations at W-19 Wetland Shoaled Condition...43 Figure 5-17: Tidal Elevations at Brackish Marsh Shoaled Condition...43 Figure 5-18: Tidal Elevations at W4 Wetland Shoaled Condition...44 Figure 5-19: W-19 Wetland Inundation Frequency, Alternatives A& B...45 Figure 5-20: W-19 Wetland Inundation Frequency, Alternative C...46 Figure 5-21: Tidal Velocity at HW101 - Dredged Condition with 1.5-foot of SLR...47 Figure 5-22: Tidal Velocity at HW101 - Shoaled Condition with 1.5-foot of SLR...48 Figure 5-23: Tidal Elevations at W-19 Wetland Dredged Condition with 1.5-foot of SLR...51 Figure 5-24: Tidal Elevations at W4 Wetland Dredged Condition with 1.5-foot of SLR...51 Figure 5-25: Tidal Elevations at Brackish Marsh Mouth Dredged Condition with 1.5-foot of SLR...52 Figure 5-26: Tidal Elevations at W-19 Wetland Shoaled Condition with 1.5-foot of SLR...54 Figure 5-27: Tidal Elevations at W4 Wetland Shoaled Condition with 1.5-foot of SLR...54 Figure 5-28: Tidal Elevations at Brackish Marsh Shoaled Condition with 1.5-foot of SLR...55 Figure 5-29: W-19 Wetland Inundation Frequency, Alternatives A & B with 1.5-foot of SLR...56 Figure 5-30: W-19 Wetland Inundation Frequency, Alternative C with 1.5-foot of SLR...56 Figure 5-31: Tidal Velocity at HW101 - Dredged Condition with 5.5-foot of SLR...58 Figure 5-32: Tidal Velocity at HW101 - Shoaled Condition with 5.5-foot of SLR...59 Figure 5-33: Tidal Elevations at W-19 Wetland Dredged Condition with 5.5-foot of SLR...62 Figure 5-34: Tidal Elevations at W4 Wetland Dredged Condition with 5.5-foot of SLR...62 Figure 5-35: Tidal Elevations at Brackish Marsh Mouth Dredged Condition with 5.5-foot of SLR...63 Figure 5-36: Tidal Elevations at the W-19 Wetland Shoaled Condition with 5.5-foot of SLR 65 Figure 5-37: Tidal Elevations at the W4 Wetland Shoaled Condition with 5.5-foot of SLR...66 Figure 5-38: Tidal Elevations at Brackish Marsh Mouth Shoaled Condition with 5.5-foot of SLR...66 Figure 5-39: W-19 Wetland Inundation Frequency, Alternatives A & B with 5.5-foot of SLR...68 Figure 5-40: W-19 Wetland Inundation Frequency, Alternative C with 5.5-foot of SLR...68 Figure 6-1: Example of a Residence Time Plot...73 Figure 6-2: Tidal Series for Residence Time Modeling...74 Figure 6-3: Comparison of Eddy Viscosity Methods, W1 Wetland...75 Figure 6-4: Comparison of Eddy Viscosity Methods, W4 Wetland...76 Figure 6-5: Gage Locations for Residence Time Output...78 Figure 6-6: Existing Conditions Residence Time Series in Wetlands Dredged Condition...79 Figure 6-7: Existing Conditions Residence Time Series in Wetlands Shoaled Condition...79 Figure 6-8: Alternatives A&B Residence Time Series in Wetlands Dredged Condition...80 Figure 6-9: Alternatives A&B Residence Time Series in Wetlands Shoaled Condition...80 Figure 6-10: Alternative C Residence Time Series in Wetlands Dredged Condition...81 Figure 6-11: Alternative C Residence Time Series in Wetlands Shoaled Condition...81 Figure 6-12: Water Quality Sampling Locations...83 Tidal Hydraulic, Water Quality and SLR Studies vii
25 LIST OF TABLES Table 4-1: Model Mesh Elements and Nodes...17 Table 4-2: Recorded Water Levels at La Jolla ( Tidal Epoch)...18 Table 4-3: Calibrated Roughness Coefficients...20 Table 4-4: Comparison of Habitat Elevation Breaks at the W4/W16 Marsh...23 Table 5-1: Tidal Flow Velocities (fps) Upstream of the Ocean Inlet...26 Table 5-2: Tidal Flow Velocities (fps) at Entrance to Wetlands...30 Table 5-3: Comparison of Average Spring High Tide (ft, NGVD29) Dredged Condition...38 Table 5-4: Comparison of Average Spring Low Tide (ft, NGVD29) Dredged Condition...38 Table 5-5: Comparison of Average Spring Tide Range (ft) Dredged Condition...38 Table 5-6: Comparison of Average Spring High Tide Shoaled Condition...42 Table 5-7: Comparison of Average Spring Low Tide Shoaled Condition...42 Table 5-8: Comparison of Average Spring Tide Range Shoaled Condition...42 Table 5-9: Habitat Elevation Breaks in the W-19 Wetland...45 Table 5-10: Tidal Flow Velocities (fps) Upstream of the Ocean Inlet with 1.5-foot of SLR...48 Table 5-11: Tidal Flow Velocity (fps) at Entrance to Wetlands with 1.5-foot of SLR...49 Table 5-12: Comparison of Average Spring High Tide (ft, NGVD29) Dredged Condition with 1.5-foot of SLR...50 Table 5-13: Comparison of Average Spring Low Tide (ft, NGVD29) Dredged Condition with 1.5-foot of SLR...50 Table 5-14: Comparison of Average Spring Tide Range (ft) Dredged Condition with 1.5-foot of SLR...50 Table 5-15: Comparison of Average Spring High Tide (ft, NGVD29) Shoaled Condition with 1.5-foot of SLR...53 Table 5-16: Comparison of Average Spring Low Tide (ft, NGVD29) Shoaled Condition with Table 5-17: 1.5-foot of SLR...53 Comparison of Average Spring Tide Range (ft, NGVD29) Shoaled Condition with 1.5-foot of SLR...53 Table 5-18: Habitat Elevation Breaks in the W-19 Wetland with a 1.5-foot SLR...57 Table 5-19: Tidal Flow Velocities (fps) at the Ocean Inlet with 5.5-foot of SLR...58 Table 5-20: Tidal Flow Velocities (fps) at Entrance to Wetlands with 5.5-foot of SLR...59 Table 5-21: Table 5-22: Table 5-23: Table 5-24: Table 5-25: Table 5-26: Comparison of Average Spring High Tide (ft, NGVD29) Dredged Condition with 5.5-foot of SLR...61 Comparison of Average Spring Low Tide (ft, NGVD29) Dredged Condition with 5.5-foot of SLR...61 Comparison of Average Spring Tide Range (ft) Dredged Condition with 5.5-foot of SLR...61 Comparison of Average Spring High Tide (ft, NGVD29) Shoaled Condition with 5.5-foot of SLR...64 Comparison of Average Spring Low Tide (ft, NGVD29) Shoaled Condition with 5.5-foot of SLR...64 Comparison of Average Spring Tide Range (ft) Shoaled Condition with 5.5-foot of SLR...65 Table 5-27: Habitat Elevation Breaks in W-19 Wetland with a 5.5-foot of SLR...67 Table 5-28: Habitat Areas in W-19 Wetland...71 Table 6-1: Summary of Residence Times in Days...78 Table 6-2: Measured Bacteria Concentrations in San Dieguito River...82 Tidal Hydraulic, Water Quality and SLR Studies viii
26 LIST OF APPENDICES Appendix A Appendix B Habitat Distribution Areas with 1.5-Foot Sea Level Rise Habitat Distribution Areas with 5.5-Foot Sea Level Rise Tidal Hydraulic, Water Quality and SLR Studies ix
27 1.0 INTRODUCTION This Tidal Hydraulic, Water Quality and Sea Level Rise (SLR) Studies report was prepared to support the preliminary engineering study and environmental document for the San Dieguito Lagoon Restoration W-19 Project in San Diego County (see Figures 1-1, 1-2). The San Diego Association of Governments (SANDAG), in conjunction with the San Dieguito River Park Joint Powers Authority (JPA), the California Department of Transportation (Caltrans), and the City of San Diego (City), proposes to create coastal wetlands, which will be used as mitigation for transportation projects within the coastal corridor of north San Diego County and will partially offset wetland losses within the San Dieguito system. The proposed project would restore approximately 141 acres to a functional mix of tidal salt marsh, brackish/freshwater marsh, and transitional/upland habitats. Tidal salt marsh habitat would be created west of the existing utility corridor and brackish Marsh habitat east of the utility corridor. Upland/transitional habitats would be placed adjacent to wetland habitat to support ecological function of the restoration project. Dokken Engineering commissioned this tidal hydraulic, water quality and SLR studies to quantify the tidal range, tidal muting and inundation frequency, and SLR impacts for existing conditions and three restoration alternatives. These results will then be used with other information in the determination of a preferred alternative. The project must be designed and implemented in a manner that does not adversely impact SCE s restoration project. Therefore, impacts to SCE s restoration project will be assessed. Numerical modeling was done using the model AdH, and all work and results are presented herein. In two separate efforts, SCE is proposing to restore the W6 wetland located immediately upstream of the I-5 Bridge and south of the river; and the 22 nd District Agricultural Associate is proposing to restore the Southern Overflow Lot (SOL) in Del Mar Fairground. The SOL is bounded by Jimmy Durante Boulevard to the north and San Dieguito River to the south and west. The proposed grading plans were received after the modeling analyses for this study. Therefore, they are not included in the current numerical models. The proposed restorations are relatively small compared to the W-19 restoration. Therefore, their effect on W-19 and the lagoon will be minor as qualitatively discussed in the executive summary. Tidal Hydraulic, Water Quality and SLR Studies 1

28 Figure 1-1: Project Vicinity Map Tidal Hydraulic, Water Quality and SLR Studies 2

29 Figure 1-2: Project Site Tidal Hydraulic, Water Quality and SLR Studies 3
30 2.0 SCOPE OF WORK The scope of work consists of two tasks: (1) conducting a tidal hydraulic study; and (2) conducting a water quality study. Both tasks include the evaluation of potential impacts to SCE s project. 2.1 Tidal Hydraulic Study The contracted scope of work requires that the team perform tidal simulations with the AdH model for existing conditions and three proposed alternatives with the 2-week average spring-neap tidal series to quantify wetland hydrology including tidal elevation, range, and inundation frequency such that acreages of marshes to be created can be calculated. Also, the team is to assess potential scour areas during the dry weather, and compare results with project against those under existing conditions to assess impacts to the SCE restored wetlands. Detailed scope items include: 1. Prepare AdH Grid Meshes Create meshes for use in tidal hydraulic modeling as well as flood hydraulics/sediment transport modeling being conducted by the United States Army Corps of Engineers (USACE). 2. Model Tides - Perform tidal hydrodynamic analyses to determine the tidal range and muting. Tidal flow velocities will also be determined by the model to indicate any potential of dry weather scour. 3. Perform Tidal Inundation Frequency Analyses - Analyze the tidal inundation frequency for the existing conditions and three alternatives to help determine the acreages of tidal salt marsh created. 4. Test Sea Level Rise Scenarios - Perform AdH tidal hydrodynamic modeling to determine the tidal range, muting in the lagoon and tidal velocity in the inlet connections for two Sea Level Rise (SLR) scenarios (1.5 and 5.5 feet). The tidal inundation frequency in the lagoon under the SLR scenarios will also be analyzed. 2.2 Water Quality Study Perform AdH water quality modeling and analyze residence times (tidal flushing frequency) in the lagoon for the existing conditions and three alternatives. Water quality will be assessed in terms of circulation efficiency of the proposed alternatives compared to the existing conditions. 2.3 Evaluation of Potential Impacts to SCE Project Tidal hydraulic and water quality results will be analyzed to determine impacts to the SCE project in terms of tidal hydraulics, inundation frequency, and tidal circulation (residence time). Tidal Hydraulic, Water Quality and SLR Studies 4
31 3.0 WETLAND RESTORATION ALTERNATIVES After the Feasibility Study (Dokken Engineering 2011), three alternatives were developed for preliminary engineering studies. Each Alternative includes a coastal tidal wetlands system west of the utility corridor and a brackish wetlands system east of the utility corridor. All three Alternatives are located in the same project study area; however, they vary in the amount of tidal wetlands created, the overall project footprint, as well as size and location of berms. Implementation of all proposed alternatives would require relocation of an existing 69 kilovolt electrical line and poles that extend through the W-19 site. The City of San Diego is planning to underground that segment within existing and planned roadways in the future, but if timing requires relocation prior to that planned implementation, the proposed project would coordinate the relocation to incorporate the line along the existing utility corridor, either within the corridor easement or by increasing the easement up to 20 feet, if necessary. The electrical line would then be redirected along El Camino Real west to reconnect with the system extending south of the W-19 site. Habitat restoration activities would include excavation of material to lower elevations and opening of the area to tidal and/or river influence. Excavated material and excess sediment removed during restoration would be transported for disposal either onsite or offsite. There are two potential disposal sites; one site is on City of San Diego land south of the project (onsite) and the other site is Miramar Landfill (offsite). The proposed alternatives would also include construction of a new trail adjacent to El Camino Real. This new trail would extend north from the existing Dust Devil Nature Trail (previously identified as the Mesa Loop Trail) to provide increased recreational opportunities in the lagoon. ln addition, a maintenance road extending west from the utility corridor would be constructed to provide access to the existing least tern nesting island. 3.1 No Project - Existing Conditions Under the No Project Alternative, no restoration of the W-19 site would occur and additional wetlands would not be created on the site to complement adjacent restoration projects. Regional coastal wetlands would not be increased and the identification of alternative mitigation areas for the North Coast Corridor and El Camino Real Realignment Project would be required. The Park Master Plan would not be expanded, and benefits associated with increased tidal system and public access would not be realized. Vegetation on the site would continue to be dominated by disturbed scrub and non-native grasslands, and invasive species within existing riparian areas would continue to encroach along the river. It is assumed that SDG&E would continue to maintain vegetation along the existing utility corridor to facilitate operations and maintenance of the various utilities traversing the site. Since no excavation of material would occur under the No Project Alternative, no material would require disposal onsite or offsite, and while a trail connection would not be constructed along El Camino Real between the Dust Devil and Coast to Crest trails, the addition of trails in the site would not be precluded. The JPA could pursue individual trail projects independently in the project area in the future. Similarly, relocation of the electrical line traversing the W-19 site would not be required if the proposed project is not implemented. The City of San Tidal Hydraulic, Water Quality and SLR Studies 5
32 Diego has plans identifying relocation of the electrical line as part of an undergrounding program that would move the line into existing and proposed street segments, although specific timing for implementation of that program has not been set. Either the City or SDG&E could therefore pursue relocation in the future if desirable. 3.2 Alternative A This alternative would restore approximately 141 acres to a functional mix of tidal salt marsh, brackish marsh, and transitional/upland habitats. Tidal salt marsh habitat would be created west of the existing utility corridor and brackish marsh habitat east of the utility corridor. Upland/transitional habitats would be placed adjacent to wetland habitat to support ecological function of the restoration project. The existing San Diego Gas & Electric (SDG&E) utility corridor would be enhanced (e.g., through planting with transitional habitat consisting of low-growing, native species that would be maintained by SDG&E) as part of the proposed project. As part of the proposed alternative, approximately 60 acres of tidal salt marsh would be created west of the existing utility corridor and south of the river. Tidal connection with the San Dieguito River would be constructed at the west end of the project site in the vicinity of the existing least tern nesting island. An upland terrace berm planted with a mix of transitional and upland habitat would be constructed between the salt marsh and the San Dieguito River channel to protect the wetlands from damage due to flood and sedimentation, and to maintain sand movement through the river channel. Figure 3-1 depicts the approximate boundaries of habitat that would be created by the proposed project. Protection from erosion within the site would be provided along the utility corridor as well as at the outlet of the existing stormwater culvert extending under El Camino Real. East of the existing utility corridor, approximately 15 acres of brackish marsh would be created as part of the proposed alternative. An open water channel from the San Dieguito River would be constructed through the brackish marsh area. Similar to the salt marsh area, an upland terrace berm planted with coastal sage scrub would be constructed between created brackish marsh habitats and the San Dieguito River channel. The upland terrace berm would be designed to protect the wetlands from damage due to flood and sedimentation, and to maintain sand movement to the ocean. Tidal Hydraulic, Water Quality and SLR Studies 6
33 Figure 3-1: Alternative A Tidal Hydraulic, Water Quality and SLR Studies 7
34 3.3 Alternative B Under Alternative B, the habitat distribution would be very similar to that under Alternative A. Approximately 60 acres of tidal salt marsh would be created west of the existing utility corridor, with a western tidal connection to the San Dieguito River south of the existing least tern nesting island. The proposed upland terrace berm area would be planted with a mix of transitional and coastal scrub species, but the elevation of the upland berm would be much lower than that identified for Alternative A. Rather than an ultimate elevation of 20 feet, under Alternative B the upland terrace berm habitat areas would have an elevation of approximately 10 feet and be overtopped during a 25-year or larger stormflow event. This differs from Alternative A, which would create a system primarily influenced by tidal exchange and would remain relatively protected from fluvial processes (e.g., sedimentation or channel migration) from up to a 100-year stormflow event. Figure 3-2 depicts the approximate boundaries of habitat that would be created under Alternative B. Similar to Alternative A, protection from erosion within the site would be provided along the utility corridor, as well as at the outlet of the existing stormwater culvert extending under El Camino Real. Under Alternative B, the existing SDG&E utility corridor would also be enhanced (e.g., through planting with transitional habitat to be maintained by SDG&E) as described for the proposed project. East of the existing utility corridor, approximately 15 acres of brackish marsh would be created as part of Alternative B. Similar to Alternative A, an open water channel from the San Dieguito River would be constructed through the brackish marsh area. An upland terrace berm would be created between the brackish marsh habitat and the San Dieguito River channel at an elevation of 8 to 11 feet; much lower than the 22-foot elevation of the upland terrace berm under Alternative A, and it is anticipated that this lower berm would be overtopped during a 10-year or greater stormflow event. Tidal Hydraulic, Water Quality and SLR Studies 8
35 Figure 3-2: Alternative B Tidal Hydraulic, Water Quality and SLR Studies 9
36 3.4 Alternative C Under Alternative C, the habitat distribution would consist of two separate tidal channel systems, one directly adjacent to the San Dieguito River, and one separated from the river by an upland terrace berm. Approximately 70 acres of tidal salt marsh would be created west of the existing utility corridor, with approximately one third of that (22 acres) located adjacent to the river and two thirds (47 acres) protected by the upland terrace berm. The protected portion of the site would have a western tidal connection to the San Dieguito River south of the existing least tern nesting island. The portion of the site adjacent to the river would connect to the river east of the nesting site, but would be anticipated to evolve from wetlands to transitional upland over time as stormflows from the river deposit river sediment on the site. The proposed upland terrace area would be planted with a mix of transitional and coastal scrub species, and would be at an elevation of 20 feet, similar to that identified for Alternative A. Figure 3-3 depicts the approximate boundaries of habitat that would be created under Alternative C. Alternative C would provide systems representative of both Alternative A and Alternative B; the area protected by the upland terrace berm would be primarily tidally-influenced, similar to Alternative A, while the area adjacent to the river would be initially influenced both by tidal and fluvial processes; however, after major storms of 25-year or greater frequency, the unprotected wetlands area would be filled with river sediment (similar to Alternative B). Similar to Alternative A, protection from erosion within the site would be provided along the utility corridor, as well as at the outlet of the existing stormwater culvert extending under El Camino Real. Under Alternative C, the existing utility corridor would also be enhanced (e.g., through planting with transitional habitat to be maintained by SDG&E) as described for the proposed project. East of the existing utility corridor, the brackish portion of the site would be created as discussed under Alternative A. Approximately 15 acres of brackish marsh would be created as part of Alternative C, with an open water channel through the site. Similar to the salt marsh area, an upland terrace berm planted with coastal sage scrub would be constructed at an elevation of approximately 22 feet between the created brackish marsh habitats and the San Dieguito River channel. The upland terrace berm would protect the wetlands from damage due to flood and sedimentation, and to maintain sand movement to the ocean. Tidal Hydraulic, Water Quality and SLR Studies 10

37 Figure 3-3: Alternative C Tidal Hydraulic, Water Quality and SLR Studies 11
38 4.0 ADAPTIVE HYDRAULICS MODEL DEVELOPMENT Numerical modeling of tidal hydraulics was performed for the existing conditions and three proposed alternatives to evaluate wetland hydraulics under dry weather conditions. The model is described below. 4.1 Model Selection and Description The hydraulic complexity in the project area requires a two-dimensional (2-D) model, and the project requires simulations of hydrodynamics, sediment transport and water quality (residence time) for the hydraulic system; therefore, the Adaptive Hydraulics (AdH) Modeling system was selected to use in this project. The AdH model was developed by the USACE. It is a finite element modeling package that can describe both saturated and unsaturated groundwater, overland flow, 3-D Navier-Stokes and 3-D shallow water problems, in addition to a 2-D shallow water module. AdH uses adaptive numerical meshes that can be employed to improve model accuracy without sacrificing efficiency. It also allows for the rapid convergence of flows to steady-state solutions. AdH contains other essential features such as wetting and drying, completely coupled sediment transport, constituents transport (temperature and salinity), and wind effects. The 2-D shallow water formulation was used for this project. The salinity modeling feature is used to simulate the residence time. A series of modularized libraries make it possible for AdH to include vessel movement and friction descriptions, as well as a host of other crucial features. 4.2 Model Setup The setup for the tidal hydraulic model for existing conditions and three alternatives included determination of the model area, bathymetry, wetland habitat area, mesh selection, and boundary conditions. For this study, a new AdH model was created for this site. The AdH model setup includes all areas of interest and areas potentially under tidal influence, and contains the most current topographic and bathymetry data. The horizontal coordinate system for the modeling work is North American Datum (NAD) 83, California State Plane Zone 6, and the vertical datum is NGVD 1929, which is equivalent to Mean Sea Level (MSL) at that time. As sea level has risen since 1929, NGVD is lower than existing MSL by approximately 0.44 feet. The reason that the vertical datum is NGVD is that the existing topographic survey of the site is referenced to NGVD. Both horizontal and vertical units are in feet Model Area The numerical model area, shown in Figure 4-1, covers the nearshore ocean, the area below the +10 foot NGVD contour line for the area west of the I-5 Bridge, and the area below the +20 foot NGVD contour line for the area east of the I-5 Bridge. The ocean boundary is approximately 1.5 miles from the shoreline; the side boundaries of the offshore area are also approximately 1.5 miles from the inlet location. Tidal Hydraulic, Water Quality and SLR Studies 12

39 Figure 4-1: Numerical Modeling Area Bathymetry The ocean bathymetry used in the model was downloaded from National Oceanic and Atmospheric Administration (NOAA) website (2005). The mesh of the lagoon area is based on an aerial photography data file generated by PDC Consultants in 2003, and on a topographic survey commissioned by Dokken Engineering performed by Aguirre & Associates with Photo Geodetic Corporation in February The survey covers all areas of interest in 1-foot contours. Figure 4-2 shows the existing bathymetry/topography of the inland modeling area. Tidal Hydraulic, Water Quality and SLR Studies 13

40 Figure 4-2: Existing Bathymetry/Topography for the Inland Modeling Area Finite Element Mesh The AdH modeling system requires that the estuarial system be represented by a network of nodal points and elements, points defined by coordinates in the horizontal plane and by water depth, and areas made up by connecting these adjacent points, respectively. Nodes can be connected to form 2-D elements, having from three to four nodes. The resulting nodal/element network is commonly called a finite element mesh and provides a computerized representation of the estuarial geometry and bathymetry. It is noted that evaluations discussed herein correspond to 2-D analyses. Each alternative was sufficiently dissimilar that a unique finite element mesh was developed to reflect the bathymetry/topography and wetland boundaries for each alternative considered. The two important aspects to consider when designing a finite element mesh are: (1) determining the level of detail necessary to adequately represent the estuary; and (2) determining the extent or coverage of the mesh. Accordingly, the bathymetric features of the estuary generally dictate the level of detail appropriate for each mesh. These concerns present trade-offs for the modeler to consider. Too much detail can lead the model to run slowly or even become unstable and crash. Too little detail renders the results less useful. For this project, a balance was achieved with a stable and efficient model that yields the level of detail required for identifying possible project impacts and comparing alternatives. The model described in this section is numerically robust and capable of simulating tidal elevations, flows, and constituent transport with reasonable resolution. There are several factors used to decide the boundary of each mesh. First, it is desirable to extend mesh open boundaries to areas that are sufficiently distant from the proposed areas of change Tidal Hydraulic, Water Quality and SLR Studies 14

41 so as to be unaffected by that change. Additionally, mesh boundaries must be located along sections where conditions can reasonably be measured and described to the model. Finally, mesh boundaries can be extended to an area where conditions have been previously collected to eliminate the need to interpolate between the boundary conditions from other locations. The finite element meshes for the calibration and model runs for existing conditions and the alternatives are shown in Figure 4-3 through Figure 4-6. Each mesh contains a section of ocean sufficiently large enough to eliminate potential model boundary effects. The wetland portion of the mesh is bounded by the ocean and dry land considered to be at the outermost extents of tidal influence. The proposed W-19 wetland is located east of the I-5 Bridge; therefore, the mesh nearshore and that west of the I-5 Bridge is the same for all modeling alternatives and is shown in Figure 4-1. For all alternatives, only the mesh area east of the I-5 freeway is shown so more details of the project area can be seen. The meshes for Alternatives A and B are the same for the tidal influenced areas because they have the same wetland footprint, with their differentiator being the storm flood berm included in Alternative A and excluded in Alternative B. Alternative C has a different mesh for tidal influenced areas than the other two alternatives. The mesh for the brackish marsh is the same for all alternatives (except without a protective flood berm for Alternative B). Figure 4-3: AdH Model Mesh East of the I-5 Freeway for Existing Conditions Tidal Hydraulic, Water Quality and SLR Studies 15


42 Figure 4-4: AdH Model Mesh East of the I-5 Freeway for Alternative A Figure 4-5: AdH Modeling Mesh East of the I-5 Freeway for Alternative B Tidal Hydraulic, Water Quality and SLR Studies 16

43 Figure 4-6: AdH Modeling Mesh East of the I-5 Freeway for Alternative C The entire modeling area (ocean and inland), approximately 5.14 square miles, is represented as a finite element mesh consisting of elements and nodes detailed in Table 4-1. Table 4-1: Model Mesh Elements and Nodes Alternative Number of Elements Number of Nodes Existing Conditions 25,768 13,344 Alternative A 40,552 21,006 Alternative B 39,863 20,456 Alternative C 39,297 20, Boundary Conditions Tides Since there are no tide stations at Del Mar, the nearest, the La Jolla gage (NOAA Station ID: ), was used to represent the ocean tide at the project site, as shown in Table 4-2. The diurnal tide range is approximately 5.33 feet from Mean Lower Low Water (MLLW) to Mean Higher High Water (MHHW), and Mean Sea Level (MSL) is at feet MLLW. Water level data records provide astronomical tides and other components including barometric pressure, tide, wind setup, seiche, and the El Niño Southern Oscillation. Tidal variations can be resolved into a number of sinusoidal components having discrete periods. The longest significant periods, called tidal epochs, are approximately 19 years. In addition, seasonal variations in MSL can reach amplitudes of 0.5 feet in some areas. Superimposed on this cycle is a 4.4-year variation in the MSL that may increase the amplitude by as much as 0.25 feet. Water level gage records are typically analyzed Tidal Hydraulic, Water Quality and SLR Studies 17
44 over a tidal epoch to account for these variations and to obtain statistical water level information (e.g., MLLW and MHHW). Table 4-2: Recorded Water Levels at La Jolla ( Tidal Epoch) Description Elevation Elevation (feet, MLLW) (feet, NGVD29) Extreme High Water (11/13/1997) Mean Higher High Water (MHHW) Mean High Water (MHW) Mean Tidal Level (MTL) Mean Sea Level (MSL) National Geodetic Vertical Datum 1929 (NGVD) Mean Low Water (MLW) North America Vertical Datum 1988 (NAVD) Mean Lower Low Water (MLLW) Extreme Low Water (12/17/33) Modeling Tidal Series The tide series used for modeling was a representative period from June 7 to 21, Modeling long-term hydrologic conditions is typically done using a synthetic (artificially-created) tide series that represents average spring tide conditions over the most recent 19-year tidal epoch, referred to as a Tidal Epoch Analysis (TEA) tide series. The benefit of using a statistical tide is that the long-term condition can be modeled over a shorter time period with less computation time. A TEA tide does not exist for this site, and significant effort (beyond the scope of this study) is required to prepare a new TEA tide for this site. Therefore, a real tide series available from NOAA (2011) was used that closely matched average spring tide data and served the purpose of a TEA tide. Replacing a statistical TEA tide with a recorded tide series is not a constraint for modeling if the recorded data possess the same necessary characteristics. To determine whether the recorded tide data possess the needed characteristics of a TEA tide, the modeler evaluated existing tide data from NOAA for San Diego at Scripps Pier (NOAA, 2011). NOAA began publishing spring high and spring low tidal elevations of all tidal cycles in January of The modeler averaged the spring high and spring low tidal elevations of all tidal cycles from January of 2008 through July of 2011 (42 months), then examined the existing data to identify an actual recorded 2-week tidal cycle that matched them. Tides during the period of June 7 through June 21, 2011 reached nearly the exact same spring high and spring low tidal elevations of NOAA s longer 42-month record. Also, the average tidal elevation of that June 7 through June 21, 2011 period was compared with the average tidal elevation of the 19-year tidal epoch and was within 0.01 feet. The modeler concluded that tides during the period of June 7 through June 21, 2011 sufficiently matched longterm tides at the site, and possessed the approximate characteristics of a TEA tide. Therefore, use of this record is appropriate for analyzing tidal hydraulics, hydrology and ramifications on habitat designs and analyses. The modeling tide includes both spring and neap tidal ranges, as shown in Figure 4-7. Tidal Hydraulic, Water Quality and SLR Studies 18

45 Figure 4-7: Modeling Tidal Series Sea Level Rise Sea level rise is projected to occur worldwide in the mid- and long-term future. The SLR projections for the region south of Cape Mendocino based on the June 2012 NRC report on SLR are between 1.4 feet to 5.5 feet for the year For the San Dieguito Lagoon hydraulic analysis, a lower bound of 1.5 feet (18-inches) and the upper bound of 5.5 feet (66-inches) are selected for modeling for the year For AdH model boundary input, the statistical tidal series (plotted in Figure 4-7), is elevated using the SLR projection values to create elevated tidal series. 4.3 Model Calibration for Existing Tidal Conditions AdH calibration involves matching model predictions with measured data by selecting appropriate input variable values (e.g., Manning s roughness coefficient (n) and eddy viscosity) to the model. The eddy viscosity is estimated by the program based on the water depth, the depth averaged velocity, and the drag coefficient. The method estimates the eddy viscosity with two separate terms: an isotropic term that accounts for turbulent mixing (EVI), and an additional anisotropic term in the direction of flow that accounts for streamwise dispersion (SDA). The equation for turbulent mixing (EVI) is taken from Webel and Schatzmann (1984). The model was calibrated using measured tides for the existing tidal hydraulic system of San Dieguito Lagoon. Tidal elevations measured at both the I-5 Bridge (TS-12) and the River channel upstream of I-5 (TS14) in the late summer of 2011 were used for the calibration. The calibration data were measured and provided by Coastal Environments in The gage locations are shown in Figure 4-8. Verification was performed for a subsequent time period. Tidal Hydraulic, Water Quality and SLR Studies 19
 is a function of the physics of the hydraulic system and represents the roughness of the channel bed.")
46 TS12 TS14 Figure 4-8: AdH Model Calibration Gage Locations Model Setup for Calibration The value of the Manning s roughness coefficient (n) is a function of the physics of the hydraulic system and represents the roughness of the channel bed. As discussed in Chaudhry (1993), values can range from to or higher for natural rivers and estuaries. Relatively high values (0.04 to 0.05) are specified for rough surfaces such as channels with cobbles, large boulders, or heavy vegetation. Mid-range values (0.03) represent clean and straight natural streams. The roughness coefficient is higher in an area with a shallow water depth and lower for an area with a deep water depth. The calibrated parameters are presented in Table 4-3. Table 4-3: Calibrated Roughness Coefficients Modeling Area/Reach Model Sub-Area Manning s n Offshore Area Offshore Area Nearshore Area Nearshore Area 0.04 Main Channel Inlet to Jimmy Durante Blvd Intertidal Area 0.04 Jimmy Durante Blvd to I-5 Bridge I-5 Bridge to El Camino Real Above tidal Area Main Channel Intertidal Area 0.04 Above tidal Area Main Channel Intertidal Area 0.04 Above tidal Area Tidal Hydraulic, Water Quality and SLR Studies 20
47 4.3.2 Calibration Results Model calibration was done for the time period representing shoaled conditions within the tidal entrance channel from November 6 to 21, Shoaled conditions refer to the tidal entrance channel condition prior to it being cleared by SCE in 2011 (the dredged condition). Model predictions of tidal elevations were compared to measured tides at the I-5 Bridge and are shown in Figure 4-9. Tidal elevations simulated by the model correspond reasonably well with those measured, both in terms of tidal phase (timing) and range (elevation). The accuracy of calibration results are limited by the fact that ocean inlet bathymetry was not measured on the same day the tidal elevations were measured. However, for purposes of comparing alternatives for this study, the model can reasonably replicate (predict) the existing tidal conditions in the wetlands as compared with measured values, and is, therefore, suitable for alternative simulations Ocean West of I5 West of I5 Elevation (ft, NGVD29) /06/10 11/11/10 11/16/10 11/21/10 Figure 4-9: AdH Model Calibration Results for the Shoaled Condition at the I-5 Bridge Verification Results Model verification was performed with numerical model parameters determined in the model calibration. The verification period was for the dredged tidal entrance channel condition from June 13 to 25, 2011, corresponding when tidal elevations were measured in the lagoon as part of the monitoring of the SCE project. Model verification results are shown in Figure 4-10 and Figure Tidal Hydraulic, Water Quality and SLR Studies 21

48 Tidal Elevation (ft, NGVD29) Ocean West of I5 West of I /13/2011 6/15/2011 6/17/2011 6/19/2011 6/21/2011 6/23/2011 Figure 4-10: AdH Model Verification Results for Dredged Conditions at I-5 Bridge Figure 4-11: AdH Model Verification Results for Dredged Conditions at TS-14 Tidal Hydraulic, Water Quality and SLR Studies 22
49 In general, predicted tidal range in the lagoon matched well with the measured data; phasing matched as well. The verification accuracy is limited by the lack of simultaneous bathymetry survey data available for the inlet and the I-5 Bridge section. However, the model verification is considered adequate to demonstrate reasonable model predictions of tidal range, lags, and phasing for the purposes of preliminary engineering analyses and relative comparison of alternatives Model Verification of Habitat Elevation Breaks in W4/W16 As a part of the model calibration/verification process, tidal elevations in the W4/W16 marsh were simulated by the AdH model under the existing conditions for both dredged and shoaled ocean inlet conditions. The tidal inundation frequency at the W4/W16 marsh was developed based on the modeling results under the statistical TEA tidal series. Habitat elevation breaks corresponding to frequencies shown in Column 2 of Table 4-4 are determined for both dredged and shoaled conditions and are shown in Columns 4 and 5, respectively. The model inundation frequency breaks for marsh communities were based on similar past restoration projects in the San Diego region. In 2012 and 2013, the California Coastal Commission analyzed the SONGS mitigation project to determine if it was meeting their habitat-based goals. A number of transects were established extending from low marsh through the upper distribution of high marsh in the surveys. The results of the surveys for the W4/W16 marsh are presented in Column 3 of Table 4-4. Comparison between model-predicted and measured survey results indicate that the surveyed habitat breaks are within modeled-predicted ranges for shoaled conditions, and close to those for dredged conditions. This serves as an additional model verification and further confirms that the AdH model is well calibrated for use in W-19 marsh design. Table 4-4: Comparison of Habitat Elevation Breaks at the W4/W16 Marsh Habitat Model Inundation Frequency (%) Based on 2013 Survey AdH-Predicted Dredged Condition AdH-Predicted Shoaled Condition Transitional 0% No data > +3.8 > +3.4 Mid-high Marsh (Pickleweed) 0% - 20% +1.8 ~ ~ ~ +3.4 Low Marsh (Cordgrass) 20% - 40% +1.4 ~ ~ ~ Mudflat 40% - 100% No Data +0.6 ~ ~+1.4 Subtidal 100% No Data < +0.6 < +0.9 Tidal Hydraulic, Water Quality and SLR Studies 23
50 5.0 TIDAL HYDRAULIC MODELING RESULTS Modeling simulations were performed for tidal flows for existing conditions and three proposed alternatives under the dry weather and measured tidal conditions discussed in Section The roughness coefficients calibrated for existing conditions were assigned for the alternative modeling. Three sea level scenarios, including the current time horizon and two projected Sea Level Rise (SLR) scenarios were modeled. The two SLR scenarios are 1.5 feet and 5.5 feet, corresponding to the low and high projections in year 2100, respectively. The hydraulic analyses were applied to determine the ability of the three alternatives to meet design criteria for tidal wetland hydraulics under the three SLR scenarios. Specifically, the following was determined using the model: Tidal Flow Velocities Tidal Elevations and Tide Ranges Tidal Prism Tidal Inundation Frequency Each of the above will be discussed by SLR scenario starting with tidal conditions today with no SLR. 5.1 Tidal Hydraulic Results Without SLR The section summarizes the AdH tidal modeling results for existing conditions and three alternatives under the current time horizon without SLR condition. In other words, it represents the post-w-19 project restoration condition. The modeling results include expected tidal prism changes, tidal velocities through various tidal connections, and tidal elevations at various wetland locations as well as potential impacts of the proposed W-19 wetland to the SCE restored wetlands Tidal Flow Velocities This section summarizes the tidal flow velocity at the ocean inlet (ocean entrance channel), under major crossings, and at entrance channels to wetland basins under the dry weather and average spring tide conditions. It also identifies the potential scour areas during the dry weather conditions. Increased tidal prism within the entire wetland system at San Dieguito Lagoon will lead to modified tidal flow velocities at the ocean entrance channel. Tidal flow velocities serve to both deliver sand to the entrance channel (during flooding tides) and to expel sand from the entrance channel (during ebbing tides). Therefore, the ocean inlet stability is assessed by comparing tidal flow velocities under existing conditions to these under the proposed project alternative conditions Tidal Flow Velocity at the Ocean Inlet Figure 5-1 shows locations where velocity time series are extracted from the AdH modeling results. Velocity time series at the ocean inlet (Highway 101 [HW101], The HW101 is also called Camino Del Mar) under both dredged and shoaled conditions are plotted in Figure 5-2 and Figure 5-3, respectively. Locations shown from west to east are: Highway 101 (HW101), the Railroad Bridge Tidal Hydraulic, Water Quality and SLR Studies 24


51 (RR), Jimmy Durante Bridge (JDB), W1, I-5, Tide Station-12 (TS-12), W4, W-19, and Tide Station- 14 (TS-14). Table 5-1 shows peak flood and ebb tide flow velocities under the average spring tide condition at various crossings for existing and future conditions (with the proposed wetland in place). Figure 5-1: Velocity Gage Locations Figure 5-2: Tidal Velocity at HW101 - Dredged Condition Tidal Hydraulic, Water Quality and SLR Studies 25

52 Figure 5-3: Table 5-1: Tidal Velocity at HW101 Shoaled Condition Tidal Flow Velocities (fps) Upstream of the Ocean Inlet Inlet HW101 RR JDB I5 West TS-14 Alternative Condition Flood Ebb Flood Ebb Flood Ebb Flood Ebb Flood Ebb Dredged Existing Shoaled Dredged Alts A & B Shoaled Dredged Alt C Shoaled At the entrance channel from HW101 through Jimmy Durante Boulevard, the peak flood tidal flow velocity increases about 11% and the peak ebb tidal flow velocity increases about 7% as a result of increased tidal prism related to the proposed project implementation. Similarly, the flood and ebb velocities at the Railroad Bridge would increase 9% and 6%, respectively. The percentages of velocity increase are very similar between the dredged and shoaled conditions. Higher ocean inlet velocities will improve the entrance channel stability and may lead to less frequent entrance channel dredging. However, the slight increase in the flood tide velocity may also lead to an increase in the volume of flood shoal. Overall, ebb flow velocities within the tidal entrance channel are between 2.7 feet per second (fps) under the shoaled condition and 3.1 fps under the dredged condition, and should not induce significant scour or sedimentation, but may serve to expel sand from the inlet that is delivered during a flooding tide. Flow velocities of 3 fps are required to mobilize and transport sand, so future tidal flow velocities are slightly lower than required to flush the channel under the shoaled Tidal Hydraulic, Water Quality and SLR Studies 26
53 condition. The flood tidal flow velocity is consistently higher than the ebb velocity under both the existing and proposed conditions, so the tidal hydraulic system is flood dominant and more sediment is expected to be transported into the system than expelled over time. Therefore, manual maintenance clearing of sand from the tidal entrance channel is required in the future to sustain tidal flushing and create the desired tidal inundation in the wetland basins. However, the frequency of maintenance is expected to be reduced with increase in the tidal velocity. The peak tide velocity distribution patterns west of HW101 in the beach area are compared between existing and proposed project conditions. Tide currents vary between the shoaled and dredged conditions and are the highest under the post dredged condition. Alternatives A and B have slightly higher tide currents than that of Alternative B; hence, comparison was made between existing and Alternative A project conditions for the dredged conditions. The peak flood and ebb current comparison are presented in Figure 5-4 and Figure 5-5, respectively. The velocity distribution patterns between existing and Alternative A are very similar. There will not be any perceptible difference to beach users. Also, the duration of the high velocity is very short, on the order of approximately an hour. Tidal Hydraulic, Water Quality and SLR Studies 27

54 8 20:48 Figure 5-4: Peak Flood Tide Current Comparison Between Existing and Alt A Tidal Hydraulic, Water Quality and SLR Studies 28
55 9 2:12 Figure 5-5: Peak Ebb Tide Current Comparison Between Existing and Alt A Tidal Hydraulic, Water Quality and SLR Studies 29
56 Tidal Flow Velocities at the Entrances to Internal Wetlands Tidal flow velocities at entrances to wetland basins shown in Figure 5-1 are summarized in Table 5-2. The implementation of proposed wetland restoration has little impact to the entrance velocity to W1 and W4/W16 wetlands. Both peak flood and ebb velocities are lower than 2 fps and therefore are not high enough to expel sand from the entrance channel. The entrance channel to W1 may require some maintenance due to its proximity to the ocean inlet. The entrance channel to W-19 may experience slight sedimentation shortly after construction as a result of morphological adjustment of the channel shape toward an equilibrium condition, but it does not require any regular maintenance under the dry weather condition and should remain stable. However, local maintenance dredging may be required after major fluvial storm events. Table 5-2: Tidal Flow Velocities (fps) at Entrance to Wetlands Alternative Existing Alts A & B Alt C Inlet W1 W4/W16 W19 Condition Flood Ebb Flood Ebb Flood Ebb Dredged N/A N/A Shoaled N/A N/A Dredged Shoaled Dredged Shoaled Potential Scour during Dry Weather The tidal flow velocity during dry weather without fluvial storm events varies throughout the hydraulic system. The velocity is higher in the confined channels under bridge crossings and lower in the wetland areas. Also, the velocity generally increases along the river from upstream to downstream with the increase in the tidal prism. Figure 5-4 through Figure 5-9 show the peak flood and ebb velocity spatial distributions in the tidal hydraulic system. The velocity is highest at HW101 and lowest in the wetland basins. As shown in Table 5-1, the peak flood tidal flow velocity would reach 4 fps under the HW101 Bridge. This tidal velocity is much lower than the velocity during the fluvial stormflow events, and it is not expected to cause any scour concerns at the HW101 Bridge because of the abundant supply of marine sand, as proven by the need for regular maintenance dredging of the inlet. The tidal velocity under other bridge crossings are less than the 3 fps threshold required to maintain a stable ocean entrance channel. The tidal flow velocities away from the bridge crossings, especially in the wetland basins, are much lower. The velocities at entrances to W1, W4 and W-19 wetlands are less than 2 fps, and those at wetland basins are no more than 0.5 fps. No scour is expected in those areas. Tidal Hydraulic, Water Quality and SLR Studies 30

57 Figure 5-6: Peak Flood Tide Velocity Contours for Existing Conditions Tidal Hydraulic, Water Quality and SLR Studies 31
58 Figure 5-7: Peak Ebb Tide Velocity Contours for Existing Conditions Tidal Hydraulic, Water Quality and SLR Studies 32

59 Figure 5-8: Peak Flood Tide Velocity for Alternatives A & B Tidal Hydraulic, Water Quality and SLR Studies 33

60 Figure 5-9: Peak Ebb Tide Velocity for Alternatives A & B Tidal Hydraulic, Water Quality and SLR Studies 34

61 Figure 5-10: Peak Flood Tide Velocity for Alternative C Tidal Hydraulic, Water Quality and SLR Studies 35

62 Figure 5-11: Peak Ebb Tide Velocity for Alternative C Tidal Hydraulic, Water Quality and SLR Studies 36
63 5.1.2 Tidal Elevations and Tide Ranges Tidal elevations and tide range vary primarily between conditions of a dredged ocean inlet and a shoaled ocean inlet. SCE will have to regularly dredge the ocean inlet channel of sand to maintain adequate tidal flushing. The dredged (cleared) condition leads to an increased tidal range and different tidal elevations than a condition of the inlet being shoaled with sand. Both conditions are modeled and discussed. Figure 5-10 shows water surface elevation (WSE) gage locations where hydraulic results are analyzed for existing conditions and Alternatives A, B, and C. The brackish marsh gage is located in the main channel adjacent to the entrance to the brackish marsh. These locations are fixed for all modeling scenarios except for W-19. The W-19 gage station location varies slightly by Alternative. The gage location is placed at the center of the saltwater wetland, so the station location shifts depending on the configuration of the saltwater wetland. The tidal hydraulics are the same between Alternatives A and B as the tidally-influenced wetland grading is the same for each Alternative. Therefore, the hydraulic results from Alternative A are applicable to Alternative B. Figure 5-12: WSE Gage Locations for Existing Conditions and Alternatives Dredged Condition Table 5-3 through Table 5-5 summarize the average spring high tide, the average spring low tide, and the average spring tide range at various locations from the nearshore ocean to the proposed W-19 wetlands. The lower portion of these three tables shows the difference in the spring high tide, low tide, and tidal range in the existing tidal hydraulics system as the result of the proposed W-19 restoration. Tidal elevations remain muted relative to ocean tides. Tidal muting occurs from the effects of distance from the ocean and hydraulic restrictions imposed by the San Dieguito Tidal Hydraulic, Water Quality and SLR Studies 37
64 River channel between the ocean and the proposed wetland. The low tide in the wetland is higher than the low tide in the ocean due to hydraulic restrictions imposed by the river channel over its length to the ocean. The high tide in the wetland is lower than that in the ocean for the same reason. Table 5-3: Comparison of Average Spring High Tide (ft, NGVD29) Dredged Condition Nearshore HW101 RR W1 I-5 W4 W16 W19 Freshwater Marsh Existing N/A 3.68 Alts A & B Alt C Difference Compared to Existing Conditions (ft) Alts A & B N/A 0.15 Alt C N/A 0.16 Table 5-4: Comparison of Average Spring Low Tide (ft, NGVD29) Dredged Condition Inlet HW101 RR W1 I-5 W4 W16 W19 Freshwater Marsh Existing N/A 1.23 Alts A & B Alt C Difference Compared to Existing Conditions (ft) Alts A & B N/A 0.82 Alt C N/A 0.83 Table 5-5: Comparison of Average Spring Tide Range (ft) Dredged Condition Inlet HW101 RR W1 I-5 W4 W16 W19 Freshwater Marsh Existing N/A 2.46 Alts A & B Alt C Difference Compared to Existing Conditions (ft) Alts A & B N/A Alt C N/A Note: N/A-not applicable Tidal Hydraulic, Water Quality and SLR Studies 38
65 5 4 3 Ocean Alts A & B Alt C Tidal muting Elevation (ft, NGVD29) Tidal muting Time (hour) Figure 5-13: Tidal Elevations at W-19 Wetland Dredged Condition Comparison of tidal hydraulic results under the dredged condition indicates: In W-19 Wetland - The maximum tide range during spring tides is from +3.5 to +0.3 feet NGVD29, for a range of approximately 3.2 feet for all three alternatives. These tidal elevations and the range are very similar to those in the W4 wetland and are sufficient to provide hydrologic conditions conducive to formation and establishment of tidal wetland habitat at the site. The differences between alternatives are very small, although the tidal range in Alternative C is slightly less. In the Brackish Marsh Mouth - Figure 5-12 shows tidal elevations in the River at the entrance to the brackish marsh. The gage location is shown in Figure The comparison indicates that the tidal response and inundation are identical between alternatives. The spring tidal range is 3.1 feet varying from +3.5 to +0.4 feet NGVD29 under the dredged condition. Impacts to SCE Wetlands - The high and low tide mutings resulting from the creation of the proposed W-19 Wetland are relatively small. The maximum muting is 0.2 feet for Alternative C. Therefore, under dredged conditions, the degree of high or low tide muting does not exceed the criterion of 0.2 feet specified for acceptability. The overall tidal range change is about 0.3 feet in the W4/W16 wetland area and 0.2 feet in the W1 wetland area, as shown in Table 5-5 and Figure Tidal Hydraulic, Water Quality and SLR Studies 39
66 Figure 5-14: Tidal Elevations at the Brackish Marsh Mouth Dredged Condition 5 Ocean Existing Alts A & B Alt C 4 3 Elevation (ft, NGVD29) Time (hour) Figure 5-15: Tidal Elevations at the W4 Wetland Dredged Condition Tidal Hydraulic, Water Quality and SLR Studies 40
67 Shoaled Condition Table 5-6 through Table 5-8 summarize the average spring high tide, the average spring low tide, and the average spring tide range at various locations from beach to the proposed W-19 Wetlands. The lower portion of these three tables shows the difference in the spring high tide, low tide, and tidal range in the existing tidal hydraulics system as the result of the proposed W-19 restoration. Tidal elevations without dredging of the ocean entrance channel show tides muted even more than for the dredged condition. This shows the importance of periodic dredging of the inlet entrance channel. In W-19 Wetland - The maximum tide range during spring tides is from +3.2 to +0.8, for a range of approximately 2.4 feet for all alternatives. The difference between alternatives, shown in Figure 5-14, is very small and is less than 0.1 feet. Although tidal muting is greater under Alternative C, these tidal elevations and the range are almost the same as those in W4 wetland and are still sufficient to provide hydrologic conditions conducive to formation and establishment of tidal wetland habitat at the site. In the Brackish Marsh - Figure 5-15 shows tidal elevations in the River at the entrance to the brackish marsh, as shown in Figure The comparison indicates that the tidal response and inundation are identical between alternatives. The tidal range is 2.3 feet varying from 0.9 to 3.2 feet NGVD29 under the shoaled condition. The tidal range increases slightly from the existing due to the grading adjacent to the entrance to the brackish marsh. Impacts to SCE wetlands The lower portion of the tables summarize the additional high and low tide muting as a result of the creation of the proposed W-19 wetland. The additional muting is less than that under the entrance channel dredged condition. The high tides are muted less than 0.2 feet and the low tides are muted less than 0.1 feet in the existing hydraulics system including SCE wetlands, as shown in Figure Therefore, under shoaled conditions, the degree of high or low tide muting also meets the criterion of 0.2 feet specified for acceptability. The average tidal range change is 0.2 feet in W4/W16 wetlands Summary In summary, installation of the proposed W-19 wetland will slightly increase tidal muting within the SCE wetland areas. The additional muting on both spring high and low tides does not exceed 0.2 feet. The degree of muting in the SCE wetlands is primarily controlled by the condition of the ocean entrance channel. If the entrance channel to the ocean is shoaled, tides in the SCE wetlands are muted to a greater degree than if the channel is dredged. This indicates that dredging of the tidal entrance channel is an important component of the future maintenance of the area. Tidal Hydraulic, Water Quality and SLR Studies 41
68 Table 5-6: Comparison of Average Spring High Tide Shoaled Condition Inlet HW101 RR W1 I-5 W4 W16 W19 Freshwater Marsh Existing N/A 3.34 Alts A & B Alt C Difference Compared to Existing Conditions (ft) Alts A & B N/A Alt C N/A Table 5-7: Comparison of Average Spring Low Tide Shoaled Condition Inlet HW101 RR W1 I-5 W4 W16 W19 Freshwater Marsh Existing N/A 1.23 Alts A & B Alt C Difference Compared to Existing Conditions (ft) Alt A & B N/A 0.38 Alt C N/A 0.40 Table 5-8: Comparison of Average Spring Tide Range Shoaled Condition Inlet HW101 RR W1 I-5 W4 W16 W19 Freshwater Marsh Existing N/A 2.11 Alts A & B Alt C Difference Compared to Existing Conditions (ft) Alts A & B N/A Alt C N/A Note: N/A-not applicable Tidal Hydraulic, Water Quality and SLR Studies 42

69 5 4 3 Ocean Alts A & B Alt C High tidal muting Elevation (ft, NGVD29) Low tidal muting Time (hour) Figure 5-16: Tidal Elevations at W-19 Wetland Shoaled Condition Figure 5-17: Tidal Elevations at Brackish Marsh Shoaled Condition Tidal Hydraulic, Water Quality and SLR Studies 43
70 5 4 Ocean Existing Alts A & B Alt C 3 Elevation (ft, NGVD29) Time (hour) Figure 5-18: Tidal Elevations at W4 Wetland Shoaled Condition Tidal Prism Adding the proposed W-19 Wetland restoration to the existing conditions at San Dieguito Lagoon, would increase the overall tidal prism of the lagoon by approximately 4 million cubic feet over the existing value of 13 million cubic feet, for an increase of 30%. This will increase the flushing of sediment from the ocean inlet, forestalling the tendency of the inlet to close and potentially reducing the frequency of maintenance dredging required. However, an increase in tidal prism may result in reduced tidal range Tidal Inundation Frequency The inundation frequency dictates the elevations at which specific marsh habitat will establish, which, in turn, determines the areas of wetland habitat and the habitat distribution. Inundation frequency is an important factor for habitat design and distribution because specific plants become established at particular inundation frequencies. Figure 5-17 and Figure 5-18 present predicted inundation frequencies at the proposed W-19 wetland for Alternative A and Alternative C, respectively. Alternatives A and B have similar grading for the proposed wetland area; therefore, they would experience similar wetland hydrology and inundation frequencies under the dry weather conditions. For Alternative C, the hydrology in the protected and unprotected wetland areas is very similar except that the spring low tide in the protected wetland is 0.1 feet lower than that under the unprotected area. For Alternative C, the two wetlands show the same inundation frequencies under both shoaled and Tidal Hydraulic, Water Quality and SLR Studies 44

71 dredged conditions. The variable that causes a significant change to inundation frequency is the shoaled or dredged condition of the channel. Table 5-9 shows the habitat elevation breaks in the proposed W-19 wetland. The vertical zonation of intertidal habitat is maximized under dredged conditions. Tidal muting from shoaling would constrain the tidal range and distribution of habitats, indicating maintenance dredging would be important in preserving habitat areas. Table 5-9: Habitat Elevation Breaks in the W-19 Wetland Tidal Habitat Elevation Breaks (feet, NGVD29) Habitat Inundation Alts A & B Alt C Frequency Dredged Shoaled Dredged Shoaled (%) Transitional 0% > 4.5 >4.5 > 4.5 >4.5 High Marsh 4% - 0% Mid Marsh 20% - 4% Low Marsh 40% - 20% Mudflat 100% - 40% Subtidal 100% < -0.3 < 0.4 < -0.3* < 0.4 *: This value is -0.2 feet in the unprotected W-19 wetland. Figure 5-19: W-19 Wetland Inundation Frequency, Alternatives A& B Tidal Hydraulic, Water Quality and SLR Studies 45
72 Open Water 100% W19-Protected-Dredged W19-Unprotected-Dredged Inundation Frequency (%) Mud Flat % Low Marsh 20-40% Mid Marsh 4-20% W19-Protected-Shoaled W19-Unprotected-Shoaled High Marsh <4% Transitional Elevation (ft, NGVD29) Figure 5-20: W-19 Wetland Inundation Frequency, Alternative C 5.2 Tidal Hydraulic Results with 1.5-Foot of Sea Level Rise (SLR) This section summarizes AdH tidal modeling results for existing conditions and three alternatives under the 1.5 foot SLR condition. The modeling results include expected tidal prism changes, tidal velocities through various tidal connections and tidal elevations at various wetland locations as well as potential impacts of the proposed W-19 wetland to the SCE restored wetlands Tidal Flow Velocities This section summarizes the tidal flow velocity at the ocean inlet (ocean entrance channel), under major crossings, and at entrance channels to wetland basins under the dry weather conditions of average spring tide with 1.5-foot of SLR. With the SLR, the tidal range in the hydraulic system will increase, which would lead to the tidal prism increasing and higher tidal velocities at the ocean entrance channel and other connection channels Tidal Flow Velocity at the Ocean Inlet Figure 5-1 shows locations where the velocity time series is extracted from the AdH modeling results. The velocity time series at the ocean inlet (HW101) under both dredged and shoaled conditions are plotted in Figure 5-19 and Figure 5-20, respectively. The velocities are very similar between alternatives; therefore, the lines are on top of each other in Figure 5-19 and Figure Table 5-10 shows peak tidal flood and ebb tide flow velocities under the average spring tide Tidal Hydraulic, Water Quality and SLR Studies 46
73 condition at various crossings for existing conditions and proposed project alternatives with a 1.5- foot SLR condition. At the tidal inlet (HW101), the peak flood velocity increases about 11% and the peak ebb velocity increases about 4% as a result of increased tidal prism related to the proposed project implementation. Similarly, the flood and ebb tidal flow velocities at the RR and Jimmy Durante Boulevard would increase compared to existing conditions. The percentages of velocity increase are very similar between the dredged and shoaled conditions. Both the peak ebb and flood velocities are higher than 3 fps required to mobilize and transport sand. Higher ocean inlet velocities will improve the entrance channel stability and lead to a longer entrance channel dredging cycle. The flood tidal velocity is consistently higher than the ebb velocity under both the existing and proposed conditions, so the tidal hydraulic system is flood dominant and more sediment is expected to be transported into the system than expelled. Therefore, manual maintenance clearing of sand from the tidal entrance channel is required in the future to sustain tidal flushing and create the desired tidal inundation in the wetland basins. Compared to the without SLR condition, the peak flood tidal velocity increases 12% for the dredged condition and 22% for the shoaled condition, and the peak ebb velocity increases 22% for the dredged condition and 25% for the shoaled condition. In general, the increase in ebb velocity is higher than that of the flood tidal velocity. All these indicate that the tidal inlet will be more stable under the 1.5-foot SLR condition than the present time. 5 Flood 4 Existing Alts A & B Alt C 3 2 Velocity (fps) Ebb Time (hour) Figure 5-21: Tidal Velocity at HW101 - Dredged Condition with 1.5-foot of SLR Tidal Hydraulic, Water Quality and SLR Studies 47
74 5 Flood 4 Existing Alts A & B Alt C 3 2 Velocity (fps) Ebb Time (hour) Figure 5-22: Tidal Velocity at HW101 - Shoaled Condition with 1.5-foot of SLR Table 5-10: Tidal Flow Velocities (fps) Upstream of the Ocean Inlet with 1.5-foot of SLR Inlet HW101 RR JDB I5 West TS-14 Alternative Condition Flood Ebb Flood Ebb Flood Ebb Flood Ebb Flood Ebb Dredged Existing Shoaled Dredged Alts A & B Shoaled Dredged Alt C Shoaled Tidal Flow Velocity at Entrance to Wetlands Tidal velocities at the entrance to wetland basins shown in Figure 5-1 are summarized in Table The implementation of proposed wetland restoration has little impact to the entrance velocity to W1 and W4/W16 wetlands. Both peak flood and ebb tidal velocities are lower than 2 fps and not high enough to expel sand from the entrance channel. The entrance channel to W1 may require some maintenance due to its proximity to the ocean inlet. The entrance channel to W-19 does not require any maintenance and should remain stable under the dry weather conditions. However, local maintenance dredging may be required after major fluvial stormflow events for all wetland entrances. Tidal Hydraulic, Water Quality and SLR Studies 48
75 Table 5-11: Alternative Existing Alts A & B Alt C Tidal Flow Velocity (fps) at Entrance to Wetlands with 1.5-foot of SLR Inlet W1 W4/W16 W19 Condition Flood Ebb Flood Ebb Flood Ebb Dredged N/A N/A Shoaled N/A N/A Dredged Shoaled Dredged Shoaled Potential Scour during Dry Weather Similar to the present condition, the tidal velocities away from the bridge crossings and wetland connections are very low. The velocity at the entrance to W1, W4, and W-19 wetlands is less than 2 fps, and that within wetland basins is less than 0.5 fps. No scour is expected in wetland areas under the dry weather condition Tidal Elevations and Tide Ranges Dredged Condition Tables 5-12 through Table 5-14 summarize the average spring high tide, the average spring low tide, and the average spring tide range at various locations under the 1.5-foot SLR condition. The lower portion of these three tables shows the difference in the spring high tide, low tide, and tidal range in the SCE Wetlands as results of the proposed W-19 restoration. The AdH model-predicted tidal series at W-19 and W4 wetlands are shown in Figure 5-21 and Figure 5-22, respectively. Both high and low tidal elevations in the wetlands remain muted relative to ocean tides under the 1.5-foot SLR condition. However, the overall tidal range in wetlands with the 1.5-foot of SLR is larger than under that under the present condition without SLR. In W-19 Wetland - The maximum tide range during spring tides increases from 3.2 to 3.56 feet for all alternatives. The differences between alternatives, shown in Figure 5-21, are very small and are less than 0.1 feet. Although tidal muting is greater under Alternative C, these tidal elevations and the ranges are almost the same as those in the W4 wetland and provide hydrologic conditions conducive to formation and establishment of tidal wetland habitat at the site. In the Brackish Marsh Mouth - Figure 5-23 shows tidal elevations in the River at the entrance to the brackish marsh, shown in Figure The comparison indicates that the tidal response and inundation frequency are identical between alternatives. The tidal range is 3.6 feet, varying from 1.7 to 5.2 feet NGVD29 under the dredged condition. Compared to present condition, the tidal range increases 0.5 feet with the 1.5-foot of SLR. Impacts to SCE Wetlands The lower portion of tables summarize the additional high and low tide muting as a result of the creation of the proposed W-19 wetland. The high tides are muted approximately 0.2 feet and the low tides are muted approximately 0.3 feet at Tidal Hydraulic, Water Quality and SLR Studies 49
76 W-4, as shown in Figure The average tidal range reduction is 0.4 feet in W4/W16 wetlands. Table 5-12: Comparison of Average Spring High Tide (ft, NGVD29) Dredged Condition with 1.5-foot of SLR Nearshore HW101 RR W1 I-5 W4 W16 W19 Freshwater Marsh Existing Alts A & B Alt C Difference Compared to Existing Conditions (ft) Alts A & B N/A 0.19 Alt C N/A 0.25 Table 5-13: Comparison of Average Spring Low Tide (ft, NGVD29) Dredged Condition with 1.5-foot of SLR Inlet HW101 RR W1 I-5 W4 W16 W19 Freshwater Marsh Existing Alts A & B Alt C Difference Compared to Existing Conditions (ft) Alts A & B N/A Alt C N/A Table 5-14: Comparison of Average Spring Tide Range (ft) Dredged Condition with 1.5-foot of SLR Inlet HW101 RR W1 I-5 W4 W16 W19 Freshwater Marsh Existing Alts A & B Alt C Difference Compared to Existing Conditions (ft) Alts A & B N/A 0.35 Alt C N/A 0.47 Note: N/A-not applicable Tidal Hydraulic, Water Quality and SLR Studies 50
77 6 5 4 Elevation (ft, NGVD29) Ocean Alts A & B Alt C Time (hour) Figure 5-23: Tidal Elevations at W-19 Wetland Dredged Condition with 1.5-foot of SLR Elevation (ft, NGVD29) Ocean Existing Alts A & B Alt C Time (hour) Figure 5-24: Tidal Elevations at W4 Wetland Dredged Condition with 1.5-foot of SLR Tidal Hydraulic, Water Quality and SLR Studies 51
78 Figure 5-25: Tidal Elevations at Brackish Marsh Mouth Dredged Condition with 1.5- foot of SLR Shoaled Condition Table 5-15 through Table 5-17 summarize the average spring high tide, the average spring low tide, and the average spring tide range at various locations from the beach to the proposed W-19 wetlands with shoaled condition at entrance. The lower portion of these three tables shows the muting in the spring high tide, low tide, and tidal range in the existing tidal hydraulics system as the result of the proposed W-19 restoration. Tidal elevations without dredging of the ocean entrance channel show tides muted more than those for the dredged condition. This muting shows the importance of periodic dredging of the inlet entrance channel in the future with the projected 1.5-foot of SLR. The tidal range for the W-19 saltwater wetlands increases from 2.4 feet to 3.0 feet with SLR. In W-19 Wetland - The maximum tide range during spring tides is approximately from +5.0 to +2.0, for a range of approximately 3.0 feet. The difference between alternatives, shown in Figure 5-24, is very small. Although tidal muting is slightly greater under Alternative C, these tidal elevations and the range are almost the same as those in the W4 wetland and are still sufficient to provide hydrologic conditions conducive to formation and establishment of tidal wetland habitat at the site. In the Brackish Marsh - Figure 5-26 shows tidal elevations in the River at the entrance to the brackish marsh, as shown in Figure The comparison indicates that the tidal response and inundation are identical between alternatives. The spring tidal range is 3.1 feet varying from 1.9 to 4.0 feet NGVD29 under the shoaled condition. The spring tidal range increases from 2.4 to 3.1 feet with the 1.5-foot of SLR. Tidal Hydraulic, Water Quality and SLR Studies 52
79 Impacts to SCE Wetlands (W1/W4/W16) the lower portion of tables summarize the additional high and low tide muting as a result of the creation of the proposed W-19 wetland. The additional muting is less than that under the entrance channel dredged condition. For the preferred Alternative A, the high tides are muted less than 0.2 feet and the low tides are muted less than 0.1 feet, as shown in Figure The average tidal range reduction is 0.2 feet in W4/W16 wetlands for Alternatives A and B and 0.3 feet for Alternative C. However, the tidal range in the W4/W16 wetlands under this SLR scenario increases about 0.7 feet compared to that under the present condition. Table 5-15: Comparison of Average Spring High Tide (ft, NGVD29) Shoaled Condition with 1.5-foot of SLR Inlet HW101 RR W1 I-5 W4 W16 W19 Freshwater Marsh Existing Alts A & B Alt C Difference Compared to Existing Conditions (ft) Alts A & B N/A 0.14 Alt C N/A 0.21 Table 5-16: Comparison of Average Spring Low Tide (ft, NGVD29) Shoaled Condition with 1.5-foot of SLR Inlet HW101 RR W1 I-5 W4 W16 W19 Freshwater Marsh Existing Alts A & B Alt C Difference Compared to Existing Conditions (ft) Alts A & B N/A 0.14 Alt C N/A 0.21 Table 5-17: Comparison of Average Spring Tide Range (ft, NGVD29) Shoaled Condition with 1.5-foot of SLR Inlet HW101 RR W1 I-5 W4 W16 W19 Freshwater Marsh Existing Alts A & B Alt C Difference Compared to Existing Conditions (ft) Alts A & B N/A 0.21 Alt C N/A 0.30 Note: N/A-not applicable Tidal Hydraulic, Water Quality and SLR Studies 53
80 6 5 4 Elevation (ft, NGVD29) Ocean Alts A & B Alt C Time (hour) Figure 5-26: Tidal Elevations at W-19 Wetland Shoaled Condition with 1.5-foot of SLR Elevation (ft, NGVD29) Ocean Existing Alts A & B Alt C Time (hour) Figure 5-27: Tidal Elevations at W4 Wetland Shoaled Condition with 1.5-foot of SLR Tidal Hydraulic, Water Quality and SLR Studies 54

81 Figure 5-28: Tidal Elevations at Brackish Marsh Shoaled Condition with 1.5-foot of SLR Tidal Prism Under the 1.5-foot SLR condition, the tidal range in the hydraulic system increases about 10% compared to the present condition, and the water surface area is slightly bigger at a higher elevation with the SLR than that under the present condition; hence, the tidal prism would increase at least 10%. Therefore, the ocean entrance channel is expected to be more stable under the SLR condition than the present time Tidal Inundation Frequency As the sea level gradually rises, both the tide and the tidal range increase, consequentially the habitat elevation breaks shift upward. This section summarizes the inundation frequency results with 1.5-foot of SLR. Figure 5-27 and Figure 5-28 present predicted inundation frequencies at the proposed W-19 wetland for Alternative A and Alternative C, respectively. Alternatives A and B have similar grading for the proposed wetland area; therefore, they would experience similar wetland hydraulics under the dry weather conditions. For Alternative C, the hydraulics in the protected and unprotected wetland areas are very similar, except that the spring low tide in the protected wetland is 0.1 feet lower than that in the unprotected area. The difference is due to the fact that the river connection to the protected area is located further downstream and closer to the ocean entrance. Tidal Hydraulic, Water Quality and SLR Studies 55
82 Open Water 100% W19-Dredged W19-Shoaled Inundation Frequency (%) Mud Flat % Low Marsh 20-40% 10 Mid Marsh 4-20% 0-10 High Marsh <4% Transitional Elevation (ft, NGVD29) Figure 5-29: W-19 Wetland Inundation Frequency, Alternatives A & B with 1.5-foot of SLR Open Water 100% W19-Protected-Dredged W19-Unprotected-Dredged Inundation Frequency (%) Mud Flat % Low Marsh 20-40% Mid Marsh 4-20% W19-Shoaled-Protected W19-Unproteced-Shoaled High Marsh <4% Transitional Elevation (ft, NGVD29) Figure 5-30: W-19 Wetland Inundation Frequency, Alternative C with 1.5-foot of SLR Tidal Hydraulic, Water Quality and SLR Studies 56
83 Table 5-18 shows the habitat elevation breaks in the proposed W-19 wetland. The vertical zonation of intertidal habitat is maximized under dredged conditions, especially for mudflat and subtidal habitats. Tidal muting from shoaling would still constrain the tidal range and distribution of habitats, indicating maintenance dredging in the future with the 1.5-foot SLR condition would still be important in preserving habitat areas. For the purpose of assessing the wetland acreage changes as a result of the SLR, the average habitat elevation breaks of the dredged and shoaled conditions are used, and the resulting habitat distributions are included in Appendix A. Table 5-18: Habitat Elevation Breaks in the W-19 Wetland with a 1.5-foot SLR Inundation Habitat Elevation Breaks (feet, NGVD29) Habitat Frequency Alts A & B Alt C (%) Dredged Shoaled Average Dredged Shoaled Average Transitional 0% > 6.0 > 6.0 >6.0 > 6.0 > 6.0 > 6.0 High Marsh 4% - 0% Mid Marsh 20% - 4% Low Marsh 40% - 20% Mudflat 100% - 40% Subtidal 100% < 1.0 < 1.5 < 1.2 < 0.9* < 1.5 <1.2 *Note: This value is 1.0 feet in the unprotected W-19 wetland. 5.3 Tidal Hydraulic Results with 5.5-Foot of SLR This section summarizes AdH tidal modeling results for existing conditions and three alternatives under the 5.5-foot SLR condition. The modeling results include tidal velocities through various tidal connections, tidal elevations and range at various wetland locations, expected tidal prism changes, and tidal inundation frequency as well as potential impacts of the proposed W-19 wetland to the SCE restored wetlands Tidal Flow Velocities Tidal Flow Velocity at the Ocean Inlet Figure 5-1 shows locations where velocity time series are extracted from the AdH modeling results. Velocity time series at the ocean inlet (HW101) under both dredged and shoaled conditions are plotted in Figure 5-29 and Figure 5-30, respectively. Table 5-19 shows peak flood and ebb tide flow velocities under the average spring tide condition at various crossings for existing conditions and proposed project alternatives with 5.5-foot SLR condition. At the tidal inlet (HW101), the peak flood tidal velocity increases about 7% under the dredged condition and 12% under the shoaled conditions as a result of increased tidal prism related to the proposed project implementation. The ebb velocity does not change much with the proposed project. Both the peak ebb and flood velocities are higher than the 3 fps required to mobilize and transport sand. Higher ocean inlet velocities will improve the entrance channel stability and may lead to less frequent entrance channel dredging. Tidal Hydraulic, Water Quality and SLR Studies 57
84 Compared to the without SLR condition, the most noticeable change is the increase in ebb velocity at HW101. The peak ebb velocity increases from less than 3 fps to 4 fps. Under the shoaled condition, the system changes from flood dominant to ebb dominant. This change indicates that the tidal inlet will be more stable under the 5.5-foot SLR condition than both the present time and the 1.5-foot SLR condition. Table 5-19: Tidal Flow Velocities (fps) at the Ocean Inlet with 5.5-foot of SLR Inlet HW101 RR JDB I5 West TS-14 Alternative Condition Flood Ebb Flood Ebb Flood Ebb Flood Ebb Flood Ebb Dredged Existing Shoaled Dredged Alts A & B Shoaled Dredged Alt C Shoaled Flood 4 Existing Alts A & B Alt C 3 2 Velocity (fps) Ebb Time (hour) Figure 5-31: Tidal Velocity at HW101 - Dredged Condition with 5.5-foot of SLR Tidal Hydraulic, Water Quality and SLR Studies 58
85 5 Flood 4 Existing Alts A & B Alt C 3 2 Velocity (fps) Ebb Time (hour) Figure 5-32: Tidal Velocity at HW101 - Shoaled Condition with 5.5-foot of SLR Tidal Flow Velocity at Entrances to Wetlands Tidal velocities at entrances, to wetland basins shown in Figure 5-1, are summarized in Table The implementation of proposed wetland restoration has little impacts to the entrance velocity to the W1 and W4/W16 wetlands. Both peak flood and ebb tidal velocities are lower than 2 fps and not high enough to expel sand from the entrance channel. The entrance channel to W1 may require some maintenance due to its proximity to the ocean inlet. The entrance channel to W-19 does not require any maintenance and should remain stable under the dry weather condition. However, local maintenance dredging may be required after major fluvial stormflow events. Table 5-20: Alternative Existing Alts A & B Alt C Tidal Flow Velocities (fps) at Entrance to Wetlands with 5.5-foot of SLR Inlet W1 W4/W16 W19 Condition Flood Ebb Flood Ebb Flood Ebb Dredged N/A N/A Shoaled N/A N/A Dredged Shoaled Dredged Shoaled Tidal Hydraulic, Water Quality and SLR Studies 59
86 Potential Scour During Dry Weather Similar to that under the current time horizon and the 1.5-foot SLR condition, the tidal velocities away from the bridge crossings and wetland connections are very low. The velocity at entrances to W1, W4 and W-19 wetlands is less than 1.5 fps, and that at wetland basins is less than 0.5 fps. No scour is expected in wetland areas under the dry weather condition Tidal Elevations and Tide Ranges Dredged Condition Tables 5-21 through Table 5-23 summarize the average spring high tide, the average spring low tide, and the average spring tide range at various locations under the 5.5-foot SLR condition. The lower portion of these three tables shows the difference in the spring high tide, low tide, and tidal range in the SCE wetlands as the result of the proposed W-19 restoration. The AdH modelpredicted tidal series at W-19 and W4 wetlands are shown in Figure 5-31 and Figure 5-32, respectively. The high tide is no longer muted for all alternatives, although the low tide in the wetlands remains muted relative to ocean tides under the 5.5-foot SLR condition. However, the overall tidal range in wetlands with 5.5-foot of SLR is larger than that under the current time horizon and the 1.5-foot SLR condition. In W-19 Wetland - The maximum tide range during spring tides increases from 3.2 to 6.3 feet for alternatives with 5.5-foot of SLR. The difference between alternatives, shown in Figure 5-31, is very small and is less than 0.05 feet. Although tidal muting is slightly more under Alternative C than Alternatives A and B, these tidal elevations and the ranges are almost the same as those in W4 wetland. In the Brackish Marsh Mouth - Figure 5-33 shows tidal elevations in the River at the entrance to the brackish marsh, shown in Figure The comparison indicates that the tidal response and inundation frequency are very similar between alternatives. The tidal range is 6.2 feet varying from 3.7 to 10.0 feet NGVD29 under the dredged condition. Compared to the present time, the tidal range increases 3.1 feet with the 5.5-foot SLR condition. Impacts to SCE Wetlands The lower portion of tables summarize the high and low tide muting as a result of the creation of the proposed W-19 wetland. The high tides are no longer muted and the low tides are muted less than 0.1 feet in the SCE wetlands for Alternative A, as shown in Figure 5-32 and Table The average tidal range change is less than 0.1 feet in W4/W16 wetlands. Therefore, the impacts are negligible under the 5.5-foot SLR condition. Tidal Hydraulic, Water Quality and SLR Studies 60
87 Table 5-21: Comparison of Average Spring High Tide (ft, NGVD29) Dredged Condition with 5.5-foot of SLR Nearshore HW101 RR W1 I-5 W4 W16 W19 Freshwater Marsh Existing Alts A & B Alt C Difference Compared to Existing Conditions (ft) Alts A & B N/A Alt C N/A Note: N/A-not applicable Table 5-22: Comparison of Average Spring Low Tide (ft, NGVD29) Dredged Condition with 5.5-foot of SLR Inlet HW101 RR W1 I-5 W4 W16 W19 Freshwater Marsh Existing Alts A & B Alt C Difference Compared to Existing Conditions (ft) Alts A & B N/A 6.27 Alt C N/A 6.19 Note: N/A-not applicable Table 5-23: Comparison of Average Spring Tide Range (ft) Dredged Condition with 5.5-foot of SLR Inlet HW101 RR W1 I-5 W4 W16 W19 Freshwater Marsh Existing Alts A & B Alt C Difference Compared to Existing Conditions (ft) Alts A & B N/A 0.02 Alt C N/A 0.08 Note: N/A-not applicable Tidal Hydraulic, Water Quality and SLR Studies 61
88 Figure 5-33: Tidal Elevations at W-19 Wetland Dredged Condition with 5.5-foot of SLR Figure 5-34: Tidal Elevations at W4 Wetland Dredged Condition with 5.5-foot of SLR Tidal Hydraulic, Water Quality and SLR Studies 62
89 Figure 5-35: Tidal Elevations at Brackish Marsh Mouth Dredged Condition with 5.5- foot of SLR Shoaled Condition Tables 5-24 through Table 5-26 summarize the average spring high tide, the average spring low tide, and the average spring tide range at various locations from the beach to the proposed W-19 wetlands. The lower portion of these three tables shows the difference in the spring high tide, low tide, and tidal range in the existing tidal hydraulics system as a result of the proposed W-19 restoration. Tidal elevations without dredging of the ocean entrance channel show tides muted more than those for the dredged condition. This shows the importance of periodic dredging of the inlet entrance channel even in the future with the projected 5.5-foot of SLR. However, the tidal range in wetlands increase from 2.4 feet to around 5.5 feet with the 5.5-foot of SLR. Compared to the other sea level conditions, the difference between alternatives is largest under the 5.5-foot SLR condition. In W-19 Wetland - The maximum tide range during spring tides is approximately from +9.8 to +4.2 for Alternatives A and B and to +4.4 for Alternative C, for a range of approximately 5.7 feet for Alternatives A and B and +5.4 for Alternative C. The difference between alternatives, shown in Figure 5-34, is small and is less than 0.3 feet. Although tidal muting is slightly greater under Alternative C, these tidal elevations and the range are almost the same as those in the W4 wetland and are still sufficient to provide hydrologic conditions conducive to formation and establishment of tidal wetland habitat at the site if site elevations are high enough in elevation for wetland to transgress upward. In the Brackish Marsh Mouth - Figure 5-36 shows tidal elevations in the River at the entrance to the brackish marsh, as shown in Figure The comparison indicates that Tidal Hydraulic, Water Quality and SLR Studies 63
90 the tidal response and inundation are very similar between alternatives. The spring tidal range is 5.4 feet varying from 4.4 to 9.8 feet NGVD29 under the shoaled condition. The spring tidal range increases from 2.4 to 5.4 feet with 5.5-foot of SLR. Impacts to SCE Wetlands Lower portion of tables summarize the additional high and low tide muting as a result of the creation of the proposed W-19 wetland. The additional muting is less under the entrance channel dredged condition. The high tides are muted less than 0.1 feet and the low tides are muted less than 0.3 feet in the SCE wetlands, as shown in Figure 5-35 and Table The average tidal range change in the W4/W16 wetlands is 0.2 feet with Alternatives A and B and 0.4 feet with Alternative C. However, the tidal range in the W4/W16 wetlands under this SLR scenario increases more than 3.0 feet compared to the shoaled condition under the present time. Table 5-24: Comparison of Average Spring High Tide (ft, NGVD29) Shoaled Condition with 5.5-foot of SLR Inlet HW101 RR W1 I-5 W4 W16 W19 Freshwater Marsh Existing Alts A & B Alt C Difference Compared to Existing Conditions (ft) Alts A & B N/A 0.00 Alt C N/A 0.08 Note: N/A-not applicable Table 5-25: Comparison of Average Spring Low Tide (ft, NGVD29) Shoaled Condition with 5.5-foot of SLR Inlet HW101 RR W1 I-5 W4 W16 W19 Freshwater Marsh Existing Alts A & B Alt C Difference Compared to Existing Conditions (ft) Alt A & B N/A Alt C N/A Note: N/A-not applicable Tidal Hydraulic, Water Quality and SLR Studies 64


91 Table 5-26: Comparison of Average Spring Tide Range (ft) Shoaled Condition with 5.5-foot of SLR Inlet HW101 RR W1 I-5 W4 W16 W19 Freshwater Marsh Existing Alts A & B Alt C Difference Compared to Existing Conditions (ft) Alts A & B N/A 0.18 Alt C N/A 0.43 Note: N/A-not applicable Figure 5-36: Tidal Elevations at the W-19 Wetland Shoaled Condition with 5.5-foot of SLR Tidal Hydraulic, Water Quality and SLR Studies 65
92 Elevation (ft, NGVD29) Ocean Existing Alts A & B Alt C Time (hour) Figure 5-37: Tidal Elevations at the W4 Wetland Shoaled Condition with 5.5-foot of SLR Figure 5-38: Tidal Elevations at Brackish Marsh Mouth Shoaled Condition with 5.5-foot of SLR Tidal Hydraulic, Water Quality and SLR Studies 66
93 5.3.3 Tidal Prism The tide range in the wetland areas would be doubled under the 5.5-foot SLR condition, hence, the tidal prism would also be doubled. This dramatic increase in tide prism would significantly improve the ocean entrance stability Tidal Inundation Frequency This section summarizes the inundation frequency results with 5.5-foot of SLR. Figure 5-37 and Figure 5-38 present predicted inundation frequencies at the proposed W-19 wetland for Alternative A and Alternative C, respectively. Alternatives A and B have similar grading for the proposed wetland area; therefore, they would experience similar wetland hydraulics under the dry weather conditions. For Alternative C, the hydraulics in the protected and unprotected wetland areas are similar. Table 5-27 shows the habitat elevation breaks in the proposed W-19 wetland. The vertical zonation of intertidal habitat is maximized under dredged conditions, especially for mudflat and subtidal habitats. Tidal muting from shoaling would still constrain the tidal range and distribution of habitats; however, the difference in the low tide muting reduces to 0.4 feet. As the sea level gradually rises, both the tide and the tidal range increase; consequentially, the tidal inundation frequency adjust and the habitat elevation breaks shift upward. With 5.5-foot of SLR, the average spring tidal range in the wetlands would increase approximately 3.0 feet, and the intertidal habitat would shift upward by 4.2 feet under the dredged condition and 3.9 feet under the shoaled condition. Most intertidal area under the current sea level condition will be converted to subtidal area. Overall, wetlands will be skewed to subtidal and mudflat areas rather than vegetated marsh. For the purpose of assessing the wetland acreage changes as a result of the SLR, the average habitat elevation breaks of the dredged and shoaled conditions are used, and the resulting habitat distributions are included in Appendix A. Table 5-27: Habitat Elevation Breaks in W-19 Wetland with a 5.5-foot of SLR Inundation Habitat Elevation Breaks (feet, NGVD29) Habitat Frequency Alts A & B Alt C (%) Dredged Shoaled Average Dredged Shoaled Average Transitional 0% > 10.0 > 10.0 > 10.0 > 10.0 > 10.0 > 10.0 High Marsh 4% - 0% Mid Marsh 20% - 4% Low Marsh 40% - 20% Mudflat 100% - 40% Subtidal 100% < 3.8 < 4.2 < 4.0 < 4.0 < 4.4 < 4.2 Tidal Hydraulic, Water Quality and SLR Studies 67


94 Figure 5-39: W-19 Wetland Inundation Frequency, Alternatives A & B with 5.5-foot of SLR Figure 5-40: W-19 Wetland Inundation Frequency, Alternative C with 5.5-foot of SLR Tidal Hydraulic, Water Quality and SLR Studies 68
95 5.4 Summary The AdH model was applied in the simulation of tidal hydraulics. The model was calibrated with measured tides and verified with habitat elevation surveys. This section summarizes the modeling results for three sea level conditions (no rise, 1.5-foot rise, and 5.5-foot rise) modeled with the existing conditions and with the proposed project alternatives. Alternatives A and B have similar wetlands grading and would experience similar tidal hydraulics; therefore, only one alternative was modeled. Unless stated otherwise, the summary is for the no SLR condition. The Proposed W-19 Wetlands: the goal of the design is to mimic the tidal hydraulics in the SCE W4/W16 wetland. The modeling results indicate that the W-19 wetland under all alternatives would generally achieve that design goal, within certain acceptable tidal muting thresholds. The tidal range under Alternatives A and B is approximately 0.05 feet larger than that under Alternative C. For Alternative C, the tidal hydraulics are very similar between protected and unprotected areas of the W-19 wetlands. Tidal Prism: The tidal prism would increase about 30% with the restoration of W-19 wetlands. Increase in the tidal prism will increase the flushing of sediment from the ocean inlet, forestalling the tendency of the inlet to close and potentially reducing the frequency of maintenance dredging required. However, it could also bring more sediment into the system, thus increasing the ultimate maintenance dredging quantities. Tidal Velocity at HW101: The tidal flood velocity is consistently higher than the ebb velocity (except during SLR of 5.5-foot) and the system is flood dominant, indicating that more sediment is being brought into the entrance during the flood tide than is being expelled during the ebb tide. The ebb velocity is less than 3 fps under the shoal condition and approximately 3 fps under the dredged condition. The tidal inlet velocity would increase about 10% with the implementation of the proposed W-19, which would lead to a more stable inlet and longer maintenance dredging cycle; however, the velocity is not high enough to maintain a stable inlet without maintenance dredging. Tidal Velocity at Entrance to Wetlands: The implementation of proposed wetland restoration has little impacts to the entrance velocity to the W1 and W4/W16 wetlands. Both peak flood and ebb velocities are lower than 2 fps and not high enough to expel sand from the entrance channel. The entrance channel to W1 may require some maintenance due to its proximity to the ocean inlet. The entrance channel to W-19 may experience slight sedimentation shortly after construction, but it does not require any regular maintenance and should remain stable under the dry weather condition. Tidal Inundation Frequency: The wetlands generally possess and retain an adequate tidal inundation frequency condition for establishment and colonization of salt marsh wetland habitat. Potential Scour during Dry Weather: The tidal flow velocity during dry weather without fluvial stormflow events varies throughout the hydraulic system. The velocity is higher in the confined channels under bridge crossings and lower in the wetland areas. Also, the velocity generally increases along the river from upstream to downstream with the increase in the tidal prism. However, the velocity is too low to raise any scour concerns in the wetlands. Tidal Hydraulic, Water Quality and SLR Studies 69
96 Impacts to SCE Wetlands: The implementation of the W-19 wetland would slightly reduce tidal range in the SCE restored wetlands. However, the overall impacts are small and within the previously-determined threshold of 0.2 feet. The spring high tide would be muted less than 0.05 feet in W1 and 0.2 feet in W4/W16, and the spring low tide would be muted less than 0.12 feet in W1 and 0.16 feet in W4/W16. The overall tide range will be reduced less than 0.34 feet. The muting effect of the W-19 restoration would be slightly less under the shoaled ocean entrance condition. This muting effect of W-19 is much less than the muting effect caused by the shoal in the ocean entrance. SLR Impacts: The tidal range and intertidal habitat range would increase with SLR. The tidal range in the wetlands and intertidal habitat range would increase approximately 0.5 feet with 1.5-foot of SLR and 3.1 feet with 5.5-foot of SLR. With 5.5-foot of SLR, wetlands will be skewed to subtidal and mudflat areas rather than vegetated marsh. SLR would also increase tidal prism and tidal velocity through the inlet, which would lead to a more stable inlet. Table 5-28 summarizes acreages of each habitat type for the three proposed alternatives under the three different sea level scenarios modeled. With SLR, both brackish/riparian habitat and transitional/upland habitat would gradually convert to salt marsh habitat for all three alternatives. Therefore, the acreage of both and transitional/upland habitat would decrease while the acreage of salt marsh would increase. For example for Alternative A: The total acreage of brackish/riparian habitat would decrease from acres postconstruction (current time horizon) to acres with 1.5-foot of SLR and to none with 5.5-foot SLR; Salt marsh area would increase from acres post-construction to acres with 1.5-foot of SLR and to acres with 5.5-foot SLR; and The transitional/upland marsh area would decrease from acres post-construction to acres with 1.5-foot of SLR and to acres with 5.5-foot SLR. Tidal Hydraulic, Water Quality and SLR Studies 70
97 Table 5-28: Habitat Areas in W-19 Wetland Habitat Alt A Alt B Alt C Initial SLR 1.5 SLR 5.5 Initial SLR 1.5 SLR 5.5 Initial SLR 1.5 SLR 5.5 Brackish Marsh Riparian Riparian Enhancement > > > > > > Brackish/Riparian Subtotal High Marsh Mid Marsh Low Marsh Mudflat Subtidal (-0.3) < < (-0.3) < < (-0.3) < < Wetlands Subtotal Transitional/Upland > 4.5 > 6.0 > 10.0 > 4.5 > 6.0 > 10.0 > 4.5 > 6.0 > Total TABLE LEGEND: Elevation Range of habitat (ft. NGVD29) Area in Acres of habitat Tidal Hydraulic, Water Quality and SLR Studies 71
98 6.0 WATER QUALITY MODELING RESULTS 6.1 Methodology The AdH model is used to simulate the tidal flushing efficiency of water quality constituents in the wetland basins. The salinity modeling feature is coupled with the AdH hydrodynamic model. Constituent concentrations in a water body reflect a balance between the rate of constituent supply and the rate of constituent removal by tidal flushing. Residence time (i.e., average time a particle resides in a hydraulic system such as a wetland basin) provides a useful measure of the rate at which waters in the hydraulic system are renewed. Accordingly, residence time provides a means for indirectly assessing the water quality of the hydraulic system as a first-order approximation. Consider the reduction of a tracer concentration in a tidal embayment due to flushing after being released (Fisher et al., 1979), in which C 0 is initial concentration, K is a reduction coefficient and C(t) is the concentration at time t. C Kt ( t) = C 0 e (6.1) The residence time of the tracer in the embayment is determined from t C( t) dt 0 1 T r = = C( t) dt K 0. (6.2) Since the concentration at t = T r is 1 C ( T ) = C0e = (6.3) e C r 0 T r can be calculated from the tracer concentration time series computed by the numerical model AdH. Based on the above methodology, the general procedure of computing the residence times for different parts of a tidal embayment is as follows: Assign an initial constituent concentration of one over the entire embayment element mesh (wetlands for this study) and a value of zero at the open water boundaries to simulate an instantaneous release of a new constituent into an embayment. Run the numerical model AdH for an adequate number of tidal cycles until substantial reduction of constituent concentrations have occurred due to tidal flushing at the locations of interest. Analyze the computed concentration results, and find the last time step when the relative concentration dropping below 1/e. Tidal Hydraulic, Water Quality and SLR Studies 72

99 Figure 6-1 shows an example of how the method works, where the zigzag solid green line shows the direct results from AdH. Arrow shows the path of finding the residence time, which is approximately 184 hours for this case. This method was used in the project study for all alternatives. Figure 6-1: 6.2 Boundary Conditions Example of a Residence Time Plot Hydraulic Input The measured tidal series, representing the average spring and neap tidal cycle, as described in Section , was taken as the offshore driving tide. Under the shoaled condition the residence time is longer than two weeks, so a longer time series shown in Figure 6-2 was used for the residence time modeling. No runoff from the fresh water boundary was considered, as the base flow is negligibly small. The initial water surface elevation of the model run is mean sea level (0.44 ft NGVD29). Tidal Hydraulic, Water Quality and SLR Studies 73

100 Figure 6-2: Concentration Input Tidal Series for Residence Time Modeling An initial constituent concentration of one was specified for the entire basin, which is tidallyinfluenced and below the elevation of 4.0-feet NGVD29. No constituent concentration was assigned at the open water boundaries. Also, it was assumed that ocean water is clean and does not supply additional constituents, or contaminants. 6.2 Model Calibration The purpose of model calibration is to determine modeling parameters. The constituent transport is coupled with the hydrodynamic model. The hydrodynamic model calibration is discussed in Section 4.3. The additional calibration parameter for the constituent transport is the constituent turbulent diffusion coefficient (or eddy viscosity). Two methods are available to assign this coefficient: Constant Eddy Viscosity (EVS) and Estimated Eddy Viscosity (EEV). For the EVS method, the diffusion rate must be specified by the user for each material and constituent. For the EEV method, the eddy viscosity will be calculated by the program based on the water depth and velocity and the user is only required to input a scale factor. Data for calibrating the turbulent diffusion coefficient are not available, so a comparison between two methods was made for Alternative C. For the EVS method, the coefficients were determined based on values calibrated for an RMA4 model from similar hydraulic systems. For the EEV method, a default scale factor value is used. Figure 6-3 and Figure 6-4 show a comparison of modeling results at the W1 and W4 wetlands from the above two methods. Gage locations of W1 and W4 are shown in Figure The comparison indicates that modeling results are very consistent. The results diffuse a little faster with the EVS values from the RMA4 model, which is consistent with the fact that the Tidal Hydraulic, Water Quality and SLR Studies 74

101 RMA4 model uses a fixed mesh and the diffusion would need to be a bit higher to handle numerical issues, and the AdH model uses an adaptive mesh (automatic mesh refinement) which overcomes that limitation. This comparison shows that the modeling results are reasonable for the purpose of alternative comparison. Figure 6-3: Comparison of Eddy Viscosity Methods, W1 Wetland Tidal Hydraulic, Water Quality and SLR Studies 75

102 Figure 6-4: Comparison of Eddy Viscosity Methods, W4 Wetland 6.3 Residence Time Results AdH transport modeling was performed for existing conditions and proposed alternatives. Alternatives A and B have similar tidal hydraulics, so they would have similar hydraulic circulation efficiency. Figure 6-5 shows locations where residence time results were extracted from the model. These results provide information for relative alternative comparison as the residence time at a specific location is a function of its distance to the ocean entrance. Table 6-1 summarizes the residence time in wetland basins. Figure 6-6 through Figure 6-11 show the residence time series in the wetlands. The simulation duration for existing dredged conditions is 16 days, as this duration is long enough to determine the residence time, and that for the remaining modeling scenarios is 25 days; therefore, the duration of the time series plot for the existing dredged conditions is different from the other conditions shown herein. In the W4/W16 wetlands, the residence time is around 6.8 to 8.9 days under existing conditions. The W1 wetland under the shoaled condition has a longer residence time of 19 days. The relative concentration shown in Figure 6-7 bounces back under the shoaled condition during the neap tidal cycle around time step 432 hours, shown in Figure 6-7 and Figure 6-2. Otherwise, the residence time is about 2 days shorter under the dredged condition than that under the shoaled condition. With the implementation of the proposed W-19 project, the residence time is reduced at least 1 day as a result of more tidal flow being drawn into the entrance channel. The residence time in the W1 marsh under the shoaled condition is shortened by 10 days. This is a water quality benefit Tidal Hydraulic, Water Quality and SLR Studies 76
103 to all areas. Although the residence time in the W1 marsh is 19 days under the shoaled existing condition, there are no known problematic water quality conditions in W1 marsh since the residence time is a relative measure of the circulation, not a direct measure of water quality conditions. The water quality condition can still be good even with a long residence time when there are no ambient pollutant sources. The San Dieguito River hydraulic system is more natural compared to other hydraulic systems that receive more dry weather nuisance flows and have greater impacts from urbanization. Therefore, although the numbers indicate this long time duration for water residence, there are no recorded problems with water quality in the river channel during the dry weather conditions. In the W-19 wetland, the residence time is about 7.8 to 8.8 days (dredged) and 21.7 days (shoaled). This long residence time under the shoaled condition is largely a result of the methodology used for calculating the residence time, and may not be indicative of water quality. As shown in Figure 6-9 and Figure 6-11, the relative concentration does not drop during the neap tidal cycle, and, in fact, increases due to the higher concentration being transported to the location of interest from areas further upstream, where the concentration is even higher. The water quality conditions in the proposed W-19 wetland are expected to be similar to that of the W1 marsh, which has a similar long residence time under the shoaled condition. The residence time differences between Alternative A and Alternative C are very small. In the proposed brackish marsh, the residence time at the entrance to the brackish marsh is longer than the model simulation duration of 25 days under both the existing and proposed project conditions. The water quality condition is expected to be improved over the existing condition, due to overall enhanced circulation under the proposed condition. In the entrance channel to the brackish marsh, it will receive daily tidal circulation as shown in Figure 5-12 and Figure 5-15, so the condition there should be very similar to the current condition in the river where the brackish marsh will connect. In addition, groundwater seepage into the brackish marsh may drive circulation through the channel. The groundwater level varies from 3.5 feet during dry months to 5.5 feet NGVD29 following wet months (Geocon Incorporated 2012). The groundwater is generally higher than the tidal elevations, which vary from 0.5 to 3.0 feet under the shoaled condition and 0.0 to 3.5 feet under the dredged condition. There will likely be a slow net flow from the brackish marsh to the river due to high groundwater table, which is beneficial to avoid standing water. In the loop channel of the brackish marsh, the channel invert elevation is graded to vary from +3.5 feet NGVD29 in the northwest end to +5.5 feet NGVD29 to the southeast end to prevent standing water, hence preventing the potential vector issue in the brackish marsh. Tidal Hydraulic, Water Quality and SLR Studies 77
104 Figure 6-5: Gage Locations for Residence Time Output Table 6-1: Summary of Residence Times in Days Existing Alts A& B Alt C Location Dredged Shoaled Dredged Shoaled Dredged Shoaled W (9.81*) W W W-19-Protected N/A N/A W-19-Unprotected N/A N/A N/A N/A >25.0 N/A Not Applicable * the residence time will be 9.81 days without the bounce back during the neap tide. Tidal Hydraulic, Water Quality and SLR Studies 78
 Figure 6-6: Existing Conditions Residence Time Series in Wetlands Dredged Condition Figure 6-7:")
105 1.2 Relative Concentration (C/Co) W1 W4 W16 1/e Time (hour) Figure 6-6: Existing Conditions Residence Time Series in Wetlands Dredged Condition Figure 6-7: Existing Conditions Residence Time Series in Wetlands Shoaled Condition Tidal Hydraulic, Water Quality and SLR Studies 79


106 Figure 6-8: Alternatives A&B Residence Time Series in Wetlands Dredged Condition Figure 6-9: Alternatives A&B Residence Time Series in Wetlands Shoaled Condition Tidal Hydraulic, Water Quality and SLR Studies 80


107 Figure 6-10: Alternative C Residence Time Series in Wetlands Dredged Condition Figure 6-11: Alternative C Residence Time Series in Wetlands Shoaled Condition Tidal Hydraulic, Water Quality and SLR Studies 81
108 6.4 Overall Water Quality Conditions The San Dieguito River is listed as impaired on the CWA Section 303 (d) list (SWRCB 2015) for indicator bacteria. San Diego Coastkeeper (2015) measured Enterococcus, E. coli, and total coliform concentrations from the San Dieguito River upstream of the W-19 restoration site from January 2013 to August The measured range of instantaneous bacteria concentrations are listed in Table 6-2. The majority of Enterococcus measurements were below 104 MPN/100 ml, the State AB 411 standard for a single sample. All E. coli measurements were below 400 MPN/100 ml, with the exception of one sample collected in December The majority of the highest measurements occurred during the winter months. The 2- year monitoring results indicate that the bacteria standards were exceeded during the winter storm months. The proposed project would not change any storm flows or pollutant input; therefore, the proposed project would not change or degrade the wet weather water quality conditions. However, the proposed project would slightly reduce residence time in the existing marshes and river, hence improve the dry weather water quality conditions. Table 6-2: Measured Bacteria Concentrations in San Dieguito River Indicator Enterococcus E. Coli Total Coliform Measured Range (MPN/100 ml) 10 9, , ,192 AB 411 Single Sample Standard ,000 The San Dieguito Lagoon Foundation (2015) measured temperature, salinity, and dissolved oxygen from 2013 to 2015 at three sampling stations, shown in Figure 6-2. The monitoring results indicate that average temperature ranged from degrees C ( C) during the winter months and from C during the summer months. The proposed project may slightly lower the summer month temperature in the existing wetland system due to improved circulation. The temperature in the proposed W-19 wetland is expected to be similar to that in W16 marsh. Salinity in the San Dieguito hydraulic system is primarily affected by the winter storms. The proposed project would not change the existing salinity variation patterns. The DO measurements indicate that the DO level was lower in the CDFW tidal basin and higher in the W1 marsh with better tidal circulation. The DO level in the proposed W-19 marsh is expected to be similar to that in the W1 or W16 marshes since the W-19 wetland has a similar range of residence time as the W1 and W16 marshes. San Diego Coastkeeper (2015) measured ph, conductivity, nutrients, and turbidity in the San Dieguito River upstream of the W-19 restoration site from January 2013 to August The measuring results indicate typical wetland conditions. The proposed project would not change any of these water quality parameters. Tidal Hydraulic, Water Quality and SLR Studies 82

109 Figure 6-12: Water Quality Sampling Locations 6.5 Summary The AdH model is used to simulate the tidal flushing efficiency of water quality constituents in the wetland basins. The tidal flushing efficiency is measured by the residence time. The residence time is affected by the ocean inlet shoal conditions and its distance to the ocean inlet. The tidal flushing is more efficient and the residence time is shorter under the dredged condition than that under the shoaled condition. Also, the residence time increases with its distance to the ocean inlet. The residence time is a measure of circulation, not a direct measure of water quality conditions. The water quality condition can still be good even with a relative long residence time if there are no pollutant sources. The best reference site for this situation is the W1 marsh. There are no known problematic water quality conditions in W1 marsh although the residence time in the W1 marsh is relatively long for the shoaled existing inlet condition. The residence time in the existing wetlands (W4/W16) varies from 6.8 days (dredged) to 8.9 days (shoaled). The W1 wetland has a residence time of 19 days (shoaled). The residence times at W4/W16 will be shortened by at least 1 day with the implementation of the proposed W-19 project, no matter which alternative is implemented. The residence time at W1 decreases by 10 days with the W-19 project. This is a water quality benefit to the entire system. The residence time in the proposed W-19 project varies from alternatives and the ocean inlet shoal conditions. Under Alternatives A and B, the residence time varies from 7.8 days (dredged) to 21.7 days (shoaled). Under Alternative C, the residence time at the protected wetland area varies from 8.8 to 21.6 days and that at the unprotected wetlands areas varies from 12.5 to 25 Tidal Hydraulic, Water Quality and SLR Studies 83
APPENDIX C. Fluvial and Tidal Hydraulics Report
 APPENDIX C Fluvial and Tidal Hydraulics Report BUENA VISTA LAGOON ENHANCEMENT PROJECT FLUVIAL AND TIDAL HYDRAULICS ANALYSES Prepared for: SANDAG 401 B Street, Suite 800 San Diego, California 92101 Contact:
HURRICANE SANDY LIMITED REEVALUATION REPORT UNION BEACH, NEW JERSEY DRAFT ENGINEERING APPENDIX SUB APPENDIX D SBEACH MODELING
 HURRICANE SANDY LIMITED REEVALUATION REPORT UNION BEACH, NEW JERSEY DRAFT ENGINEERING APPENDIX SUB APPENDIX D SBEACH MODELING Rev. 18 Feb 2015 1 SBEACH Modeling 1.0 Introduction Following the methodology
Impact of Dredging the Lower Narrow River on Circulation and Flushing
 Impact of Dredging the Lower Narrow River on Circulation and Flushing Craig Swanson Ph.D. Swanson Environmental Alex Shaw Ocean Engineering, URI Prof. Malcolm L. Spaulding Ocean Engineering, URI 29 January
OFFICE OF STRUCTURES MANUAL FOR HYDROLOGIC AND HYDRAULIC DESIGN CHAPTER 11 APPENDIX B TIDEROUT 2 USERS MANUAL
 OFFICE OF STRUCTURES MANUAL FOR HYDROLOGIC AND HYDRAULIC DESIGN CHAPTER 11 APPENDIX B TIDEROUT 2 USERS MANUAL APRIL 2011 APRIL 2011 Page 1 Preface TIDEROUT 2, Build 1.22 dated June 29, 2006 is the current
Request Number IR1-12: Flow Passage. Information Request
 Request Number IR1-12: Flow Passage Information Request Provide additional information about the 100 metre flow passage channel scenario between the Westshore Terminals and the proposed Project terminal
Inlet Management Study for Pass-A-Grille and Bunces Pass, Pinellas County, Florida
 Inlet Management Study for Pass-A-Grille and Bunces Pass, Pinellas County, Florida Final Report Submitted By Ping Wang, Ph.D., Jun Cheng Ph.D., Zachary Westfall, and Mathieu Vallee Coastal Research Laboratory
3.3 OCEANOGRAPHY/COASTAL PROCESSES
 3.3 OCEANOGRAPHY/COASTAL PROCESSES Beaches are dynamic and conditions vary based on the onshore/offshore movement of sand both seasonally and annually. Sand also moves alongshore within a generally defined
RE: Hurricane Matthew Beach Damage Assessment and Recommendations [CSE 2416]
![RE: Hurricane Matthew Beach Damage Assessment and Recommendations [CSE 2416]](/thumbs/83/87675702.jpg "RE: Hurricane Matthew Beach Damage Assessment and Recommendations [CSE 2416]") October 25, 2016 Iris Hill Town Administrator Town of Edisto Beach 2414 Murray St Edisto Beach SC 29438 RE: Hurricane Matthew Beach Damage Assessment and Recommendations [CSE 2416] Dear Iris, Hurricane
October 25, 2016 Iris Hill Town Administrator Town of Edisto Beach 2414 Murray St Edisto Beach SC 29438 RE: Hurricane Matthew Beach Damage Assessment and Recommendations [CSE 2416] Dear Iris, Hurricane
HABITAT RESTORATION USING DREDGED MATERIAL PLACEMENT
 HABITAT RESTORATION USING DREDGED MATERIAL PLACEMENT WITHIN THE LOWER COLUMBIA RIVER AT WOODLAND ISLANDS, WA 237 237 237 217 217 217 200 200 200 Hans Moritz Matt Fraver Logan Negherbon 255 0 163 131 Mike
City of Del Mar Local Coastal Plan (LCP) Amendment for Sea Level Rise and Coastal Flooding
 Amendment for Sea Level Rise and Coastal Flooding") City of Del Mar Local Coastal Plan (LCP) Amendment for Sea Level Rise and Coastal Flooding 6/22/17 Presentation to Sea Level Rise Stakeholder- Technical Advisory Committee (STAC) Nick Garrity, P.E. Lindsey
City of Del Mar Local Coastal Plan (LCP) Amendment for Sea Level Rise and Coastal Flooding 6/22/17 Presentation to Sea Level Rise Stakeholder- Technical Advisory Committee (STAC) Nick Garrity, P.E. Lindsey
CLAM PASS ANNUAL RESTORATION & MANAGEMENT PLAN TIDAL ANALYSIS ELEMENT REPORT NO. 13
 CLAM PASS ANNUAL RESTORATION & MANAGEMENT PLAN TIDAL ANALYSIS ELEMENT REPORT NO. 13 Submitted to: Pelican Bay Services Division Prepared by: Humiston & Moore Engineers H&M File No. 13-078 November 2012
Follets Island Nearshore Beach Nourishment Project
 Coast & Harbor Engineering A division of Hatch Mott MacDonald Follets Island Nearshore Beach Nourishment Project Arpit Agarwal, P.E. April 1, 2016 Project Site!"#$% &'(% &)*+% )#,'-+% Shoreline Erosion
Tanya M. Beck. Kelly Legault. Research Physical Scientist Coastal & Hydraulics Lab, ERDC Vicksburg, MS
 Inlet And Adjacent Shoreline Processes at Cascading Time Scales Using the Coastal Modeling System and GenCade Tanya M. Beck Research Physical Scientist Coastal & Hydraulics Lab, ERDC Vicksburg, MS Kelly
CALCASIEU SALINITY STRUCTURES. HYDRODYNAMIC MODELING (To Support Design of Salinity Barriers)
") CALCASIEU SALINITY STRUCTURES HYDRODYNAMIC MODELING (To Support Design of Salinity Barriers) Presentation Overview 1 2 3 4 5 Project Overview and CEA Circulation Modeling Vessel Hydrodynamics Modeling
CALCASIEU SALINITY STRUCTURES HYDRODYNAMIC MODELING (To Support Design of Salinity Barriers) Presentation Overview 1 2 3 4 5 Project Overview and CEA Circulation Modeling Vessel Hydrodynamics Modeling
Assateague Island National Seashore North End Restoration Project Timeline
 Assateague Island National Seashore North End Restoration Project Timeline Date Event Some information provided in the Project Introduction document. Detailed events are available in a timeline compiled
Sediment Management Plan Rehoboth Bay
 Sediment Management Plan Rehoboth Bay STAC Meeting November 16, 2007 Goals of the Study Improve planning for future dredging needs Reduce the dependency on dredging Study Tasks Environmental data Historical
COUPLED MANAGEMENT STRATEGY LAKE CATHIE ESTUARY & COAST
 Lake Cathie Progress Association Inc. ABN 28 251 433 854 P.O. Box 247 Lake Cathie NSW 2445 PHONE/FAX: 02 6584 8211 EMAIL: r3packag@bigpond.com 20 th October 2009 Port Macquarie Hastings Council PO Box
CLAM PASS RESTORATION AND MANAGEMENT PLAN BATHYMETRIC MONITORING REPORT NO. 7 Including Interior Bay Dredge Cuts and Tidal Data
 CLAM PASS RESTORATION AND MANAGEMENT PLAN BATHYMETRIC MONITORING REPORT NO. 7 Including Interior Bay Dredge Cuts and Tidal Data Submitted to: Florida Department of Environmental Protection DEP File No.
MOREHEAD CITY HARBOR, NC. Dredged Material Management Plan (DMMP)
") MOREHEAD CITY HARBOR, NC Dredged Material Management Plan (DMMP) Public Meeting/Info Session 15 January 2014 US Army Corps of Engineers Morehead City Harbor DMMP Presentation Topics Morehead City Harbor
MOREHEAD CITY HARBOR, NC Dredged Material Management Plan (DMMP) Public Meeting/Info Session 15 January 2014 US Army Corps of Engineers Morehead City Harbor DMMP Presentation Topics Morehead City Harbor
Evaluation of Placement Alternatives for Matagorda Ship Channel Bottleneck Removal
 Evaluation of Placement Alternatives for Matagorda Ship Channel Bottleneck Removal James Rosati III Ashley E. Frey CPT Grays Harbor, WA Wood Wood chips Flour Other CMS Shark River Inlet, NJ US Army Corps
Response of a Newly Created Marsh-Wetland Affected by Tidal Forcing, Upland Discharge, and Groundwater Interaction
 Response of a Newly Created Marsh-Wetland Affected by Tidal Forcing, Upland Discharge, and Groundwater Interaction Mouth of Columbia River, Cape Disappointment State Park, Washington 12 Hans R. Moritz
SSO 700 Integrated Watershed Action Plan: Continuous Calibration of a Model
 SSO 700 Integrated Watershed Action Plan: Continuous Calibration of a Model 5 Cities Plus August 16, 2017 Presented by Matt Spidare, P.E MSDGC Victoria Berry, P.E. CH2M Overview of Presentation Project
Plan B Dam Breach Assessment
 Plan B Dam Breach Assessment Introduction In support of the Local Sponsor permit applications to the states of Minnesota and North Dakota, a dam breach analysis for the Plan B alignment of the Fargo-Moorhead
The Blue Heron Slough Conservation Bank
 1 The Blue Heron Slough Conservation Bank CONSERVATION BANKING July 19-23, 2010 CASE STUDY SERIES The Blue Heron Slough Conservation Bank (Washington) I. OVERVIEW & BACKGROUND: Location: Snohomish River
APPENDIX C VEGETATED EMERGENCY SPILLWAY. VERSION 1.0 March 1, 2011
 APPENDIX C VEGETATED EMERGENCY SPILLWAY VERSION 1.0 March 1, 2011 [NOTE: Could use a better photo more clearly showing the emergency spillway in the context of the dam.] SECTION C-1: DESCRIPTION OF PRACTICE
BOLSA CHICA WETLANDS RESTORATION INLET DESIGN. Weixia Jin 1 and Michael McCarthy 1
 BOLSA CHICA WETLANDS RESTORATION INLET DESIGN Weixia Jin 1 and Michael McCarthy 1 Bolsa Chica Wetlands is one of a few recently restored large wetlands in Southern California of the United States. The
THE HYDRAULIC AND MORPHOLOGICAL RESPONSE OF A LARGE COASTAL LAKE TO RISING SEA LEVELS
 THE HYDRAULIC AND MORPHOLOGICAL RESPONSE OF A LARGE COASTAL LAKE TO RISING SEA LEVELS Mr Evan K Watterson 1 Dr Joanna M Burston 1 Ms Heather Stevens 2 Mr Dan J Messiter 1 1 Author affiliation: WorleyParsons
County of Santa Barbara Permit Option Analysis Goleta Beach JULY 13, 2017
 County of Santa Barbara Permit Option Analysis Goleta Beach JULY 13, 2017 Introduction 2 Goleta Beach Park welcomes 1.5 million visitors annually Amenities include: Picnic Areas and Group Areas w/bbqs
Technical Report Culvert A Hydraulic Analysis
 DATE: November 3, 2011 Technical Report Culvert A Hydraulic Analysis TO: FROM: RE: Jim Reiser, P.E. Project Manager Parsons Brinckerhoff, Inc. Kurt Killian, P.E., CFM Parsons Brinckerhoff, Inc. Design
APPENDIX A Hydrodynamic Model Qualicum Beach Waterfront Master Plan
 Page 1 of 21 CLIENT: Town of Qualicum Beach PROJECT: SIGNATURE DATE CONTRIBUTORS : M. Marti Lopez REVIEWED BY : P. St-Germain, EIT APPROVED BY: J. Readshaw, P.Eng ISSUE/REVISION INDEX Issue Details Code
SACO RIVER AND CAMP ELLIS BEACH SACO, MAINE SECTION 111 SHORE DAMAGE MITIGATION PROJECT APPENDIX F ECONOMIC ASSESSMENT
 SACO RIVER AND CAMP ELLIS BEACH SACO, MAINE SECTION 111 SHORE DAMAGE MITIGATION PROJECT APPENDIX F ECONOMIC ASSESSMENT Department of the Army New England District, Corps of Engineers 696 Virginia Road
Australian Coastal Councils Conference
 Australian Coastal Councils Conference Kiama March 2019 Where Has My Beach Gone? (and what can I do about it?) Dr Andrew McCowan Water Technology Where Has My Beach Gone? Where Has My Beach Gone? Where
Suitable Applications Check dams may be appropriate in the following situations: To promote sedimentation behind the dam.
 Categories EC Erosion Control SE Sediment Control TC Tracking Control WE Wind Erosion Control Non-Stormwater NS Management Control Waste Management and WM Materials Pollution Control Legend: Primary Category
UPDATE OF RESTORED SAN DIEGUITO LAGOON INLET CHANNEL EXCAVATION AND DREDGING PLAN. (Previously submitted on 30 March 2006 as CE Reference # 04-19c)
") UPDATE OF RESTORED SAN DIEGUITO LAGOON INLET CHANNEL EXCAVATION AND DREDGING PLAN (Previously submitted on 30 March 2006 as CE Reference # 04-19c) Prepared for Southern California Edison Company 2244 Walnut
UPDATE OF RESTORED SAN DIEGUITO LAGOON INLET CHANNEL EXCAVATION AND DREDGING PLAN (Previously submitted on 30 March 2006 as CE Reference # 04-19c) Prepared for Southern California Edison Company 2244 Walnut
Coastal Environments Oceanographic and Engineering Expertise
 Coastal Environments Oceanographic and Engineering Expertise Coastal Environments La Jolla, CA www.coastalenvironments.com 14 May 2004 CE Ref. No. 04-05 EcoSystems Management Associates, Inc. Carlsbad,
Coastal Sediment Transport Modeling Ocean Beach & San Francisco Bight, CA
 1 Coastal Sediment Transport Modeling Ocean Beach & San Francisco Bight, CA Honghai Li and Lihwa Lin Engineering Research and Development Center U.S. Army Corps of Engineers Frank Wu, Lisa Andes, and James
APPENDIX M DREDGED MATERIAL MANAGEMENT PLAN (DMMP) FINAL INTEGRATED FEASIBILITY REPORT AND ENVIRONMENTAL ASSESSMENT
 FINAL INTEGRATED FEASIBILITY REPORT AND ENVIRONMENTAL ASSESSMENT") APPENDIX M DREDGED MATERIAL MANAGEMENT PLAN (DMMP) Brazos Island Harbor, Texas Channel Improvement Study FINAL INTEGRATED FEASIBILITY REPORT AND ENVIRONMENTAL ASSESSMENT This page is intentionally left
APPENDIX M DREDGED MATERIAL MANAGEMENT PLAN (DMMP) Brazos Island Harbor, Texas Channel Improvement Study FINAL INTEGRATED FEASIBILITY REPORT AND ENVIRONMENTAL ASSESSMENT This page is intentionally left
Modeling Sediment Transport Along the Upper Texas Coast
 Modeling Sediment Transport Along the Upper Texas Coast David B. King Jr. Jeffery P. Waters William R. Curtis Highway 87 roadbed, Jefferson County Galveston District Corps Sabine Pass to San Luis Pass
SURGE SUPPRESSION ACHIEVED BY DIFFERENT COASTAL SPINE (IKE DIKE) ALIGNMENTS. Bruce A. Ebersole, Thomas W. Richardson and Robert W.
 ALIGNMENTS. Bruce A. Ebersole, Thomas W. Richardson and Robert W.") SURGE SUPPRESSION ACHIEVED BY DIFFERENT COASTAL SPINE (IKE DIKE) ALIGNMENTS Abstract Bruce A. Ebersole, Thomas W. Richardson and Robert W. Whalin, Jackson State University, Jackson, Mississippi The primary
SURGE SUPPRESSION ACHIEVED BY DIFFERENT COASTAL SPINE (IKE DIKE) ALIGNMENTS Abstract Bruce A. Ebersole, Thomas W. Richardson and Robert W. Whalin, Jackson State University, Jackson, Mississippi The primary
Evaluation of June 9, 2014 Federal Emergency Management Agency Flood Insurance Study for Town of Weymouth, Norfolk, Co, MA
 Evaluation of June 9, 2014 Federal Emergency Management Agency Flood Insurance Study for Town of Weymouth, Norfolk, Co, MA Prepared For: Woodard & Curran 95 Cedar Street, Suite 100 Providence, RI 02903
PLAQUEMINES PARISH BARRIER ISLAND RESTORATION & SUSTAINABILITY. MVD/Gulf Coast Regional Dredging Meeting November 5, 2013
 PLAQUEMINES PARISH BARRIER ISLAND RESTORATION & SUSTAINABILITY MVD/Gulf Coast Regional Dredging Meeting November 5, 2013 OVERVIEW 1. Barrier Island Restoration Projects in Plaquemines Parish 2. Plaquemines
Nearshore Placed Mound Physical Model Experiment
 Nearshore Placed Mound Physical Model Experiment PURPOSE: This technical note describes the migration and dispersion of a nearshore mound subjected to waves in a physical model. The summary includes recommendations
APPENDIX J HYDROLOGY AND WATER QUALITY
 APPENDIX J HYDROLOGY AND WATER QUALITY J-1 Technical Report on Airport Drainage, Northern Sector Airport and Ordinance Creek Watershed / Preliminary Creek Constructed Natural Channel Culvert J-2 Preliminary
Reading Material. Inshore oceanography, Anikouchine and Sternberg The World Ocean, Prentice-Hall
 Reading Material Inshore oceanography, Anikouchine and Sternberg The World Ocean, Prentice-Hall BEACH PROCESSES AND COASTAL ENVIRONMENTS COASTAL FEATURES Cross section Map view Terminology for Coastal
Comparison of Predicted and Measured Shoaling at Morro Bay Harbor Entrance, California
 Comparison of Predicted and Measured Shoaling at Morro Bay Harbor Entrance, California by Edward F. Thompson, Inocencio P. DiRamos, and Robert R. Bottin, Jr. PURPOSE: This Coastal and Hydraulics Engineering
Hydrodynamic Modeling of Tides and Hurricane Storm Surge for Pre- and Post-Dredging Conditions in the Lower St. Johns River, Florida
 Hydrodynamic Modeling of Tides and Hurricane Storm Surge for Pre- and Post-Dredging Conditions in the Lower St. Johns River, Florida Matthew V. Bilskie 1 1 PhD Student, University of Central Florida, Department
RESILIENCE THROUGH RESTORATION
 RESILIENCE THROUGH RESTORATION RECLAMATION DISTRICT NO. 1601 TWITCHELL ISLAND SAN JOAQUIN RIVER SETBACK LEVEE PROJECT TWITCHELL ISLAND BASICS Nearly 12 miles of levee Storm drainage facilities Protects
VENICE LOCAL COASTAL PROGRAM UPDATE: COASTAL HAZARDS WELCOME
 VENICE LOCAL COASTAL PROGRAM UPDATE: COASTAL HAZARDS WELCOME 1 Introducing the Team Hosted by the Department of City Planning and grant funded in part by the California Coastal Commission 2 Workshop Purpose
Hydraulic Modeling Analysis
 Final Report Photograph: http://www.newington-dover.com Newington to Dover, New Hampshire Prepared for: Vanasse Hangen Brustlin, Inc. 6 Bedford Farms Drive, Suite 607 Bedford, New Hampshire 03110-6532
Volume and Shoreline Changes along Pinellas County Beaches during Tropical Storm Debby
 Volume and Shoreline Changes along Pinellas County Beaches during Tropical Storm Debby Ping Wang and Tiffany M. Roberts Coastal Research Laboratory University of South Florida July 24, 2012 Introduction
What happens to Oregon s tidal wetlands with sea level rise?
 What happens to Oregon s tidal wetlands with sea level rise? Laura Brophy Estuary Technical Group Institute for Applied Ecology Corvallis, OR Laura@appliedeco.org Project maps future tidal wetlands, predicts
Mouth of the Columbia River Jetties Three-Phase Construction Plan
 Mouth of the Columbia River Jetties Three-Phase Construction Plan Project Overview October 9, 2012 US Army Corps of Engineers MCR Jetties Major Rehabilitation Sand Island pile dikes 1930-1935 Columbia
North Shore of Long Island, Feasibility Study
 North Shore of Long Island, Asharoken New York Asharoken, Feasibility Study Asharoken, NY Public Meeting June 30, 2015 US Army Corps of Engineers US Army Corps of Engineers New York BUILDING STRONG BUILDING
Tide Gate Modifications for Fish Passage and Water Quality Enhancement
 Tide Gate Modifications for Fish Passage and Water Quality Enhancement Tillamook Bay National Estuary Project 613 Commercial St. PO Box 493 Garibaldi, OR 97118 Phone (503) 322-2222 Fax (503) 322-2261 Jay
STUDY ON TSUNAMI PROPAGATION INTO RIVERS
 ABSTRACT STUDY ON TSUNAMI PROPAGATION INTO RIVERS Min Roh 1, Xuan Tinh Nguyen 2, Hitoshi Tanaka 3 When tsunami wave propagation from the narrow river mouth, water surface is raised and fluctuated by long
Building Coastal Resiliency at Plymouth Long Beach
 Building Coastal Resiliency at Plymouth Long Beach Department of Marine and Environmental Affairs March 30, 2017 Introducing Green Infrastructure for Coastal Resiliency Plymouth Long Beach & Warren s Cove
Figure 1. Schematic illustration of the major environments on Mustang Island.
 STOP #1: PACKERY CHANNEL BEACH TO BAY We will start this field guide near the north jetty of Packery Channel and hike across the island to Corpus Christi Bay (fig. 1). The island emerges from the Gulf
Nearshore Dredged Material Placement Pilot Study at Noyo Harbor, CA
 1 Nearshore Dredged Material Placement Pilot Study at Noyo Harbor, CA Noyo Cove N 2011 National Conference on Beach Preservation Technology 9-11, February 2011 Lihwa Lin, Honghai Li, Mitchell Brown US
Chapter 6: Santander case
 6 Santander case 6.1 Introduction Port activity in Santander dates back more than 2,000 years ago. Throughout this period, the sea and the port have been the fundamental elements of a community which,
PROFILE OF SACRAMENTO RIVER, FREEPORT TO VERONA, CALIFORNIA,
 PROFILE OF SACRAMENTO RIVER, FREEPORT TO VERONA, CALIFORNIA, FLOOD OF FEBRUARY 1986 By J.C. Blodgett and J.B. Lucas U.S. GEOLOGICAL SURVEY Open-File Report 88-82 CO CM I m r-h CM Sacramento, California
3.10 TRAFFIC AND CIRCULATION
 3.10 TRAFFIC AND CIRCULATION Implementation of the Enhancement Project would require use of the local circulation system for construction activities and operations. This traffic analysis considers the
APPENDIX H LAKE OKEECHOBEE FLOOD ROUTINES
 1 2 3 APPENDIX H LAKE OKEECHOBEE FLOOD ROUTINES 1 2 3 4 5 6 7 8 9 10 11 12 13 14 15 16 17 18 19 20 21 22 23 24 25 26 27 28 29 30 31 32 33 34 35 36 37 38 39 40 41 42 43 44 45 LAKE OKEECHOBEE FLOOD ROUTINGS
Leaning Into Adaptation
 www.marinslr.org Leaning Into Adaptation GFNMS Ocean Summit, May 17, 2016 Jack Liebster, Planning Manager, Marin County Marin County C-SMART Sea Level Rise Adaptation Process Evaluate Science Info. Implement
Warm-up # 7 A day 5/17 - B day 5/18 UPDATE YOUR TABLE OF CONTENTS
 Warm-up # 7 A day 5/17 - B day 5/18 UPDATE YOUR TABLE OF CONTENTS Question: List all examples of surface water on Earth. Answer: Rivers and streams, lakes and reservoirs, (ponds) wetlands, estuaries and
APPENDIX D-2. Sea Level Rise Technical Memo
 APPENDIX D-2 Sea Level Rise Technical Memo 2185 N. California Blvd., Suite 500 Walnut Creek, CA 94596 (925) 944-5411 Fax: (925) 944-4732 www.moffattnichol.com DRAFT MEMORANDUM To: From: Neil Nichols,
Bob Battalio, PE Chief Engineer, ESA September 8, 2016
 RELATING FUTURE COASTAL CONDITIONS TO EXISTING FEMA FLOOD HAZARD MAPS Technical Methods Manual Bob Battalio, PE Chief Engineer, ESA September 8, 2016 FMA 2016 Sacramento, California DWR-OST-SIO PILOTING
Complete Street Analysis of a Road Diet: Orange Grove Boulevard, Pasadena, CA
 Complete Street Analysis of a Road Diet: Orange Grove Boulevard, Pasadena, CA Aaron Elias, Bill Cisco Abstract As part of evaluating the feasibility of a road diet on Orange Grove Boulevard in Pasadena,
MEMORANDUM. To: 1.0 PURPOSE
 MEMORANDUM To: Scott Holland, Elements Architecture From: Brian Grover, Dudek Date: July 16, 2014 1.0 PURPOSE In response to the November 4, 2013 request (RE: Incomplete Application Southern California
Boothbay Harbor Rotary Club May 12, 2016
 Mapping Potential Sea Level Rise and Storm Surge in Boothbay Harbor, ME Boothbay Harbor Rotary Club May 12, 2016 Peter A. Slovinsky, Marine Geologist Maine Geological Survey S.M. Dickson, MGS Quickly,
Tidal River Management (TRM)-An Innovative Scientific Approach for Sustainable Sediment Management
-An Innovative Scientific Approach for Sustainable Sediment Management") Paper ID: WRE-029 954 International Conference on Recent Innovation in Civil Engineering for Sustainable Development () Department of Civil Engineering DUET - Gazipur, Bangladesh Tidal River Management
Paper ID: WRE-029 954 International Conference on Recent Innovation in Civil Engineering for Sustainable Development () Department of Civil Engineering DUET - Gazipur, Bangladesh Tidal River Management
STORM RESPONSE SIMULATION
 APPENDIX V STORM RESPONSE SIMULATION Final Environmental Impact Statement Village of Bald Head Island Shoreline Protection Project Brunswick County, North Carolina Delft3D Storm Response Simulations With
X.B WETLANDS ROGUE RIVER ESTUARY
 X.B WETLANDS ROGUE RIVER ESTUARY The Rogue River has a drainage area of 5,100 square miles, yet the estuary of the Rogue River is one of the smallest in Oregon, measuring approximately 1,880 acres during
4. ENVIRONMENTAL IMPACT ANALYSIS 9. TRANSPORTATION AND TRAFFIC
 4. ENVIRONMENTAL IMPACT ANALYSIS 9. TRANSPORTATION AND TRAFFIC 4.9.1 INTRODUCTION The following section addresses the Proposed Project s impact on transportation and traffic based on the Traffic Study
Figure 4, Photo mosaic taken on February 14 about an hour before sunset near low tide.
 The Impact on Great South Bay of the Breach at Old Inlet Charles N. Flagg and Roger Flood School of Marine and Atmospheric Sciences, Stony Brook University Since the last report was issued on January 31
EVALUATION OF BEACH EROSION UP-DRIFT OF TIDAL INLETS IN SOUTHWEST AND CENTRAL FLORIDA, USA. Mohamed A. Dabees 1 and Brett D.
 EVALUATION OF BEACH EROSION UP-DRIFT OF TIDAL INLETS IN SOUTHWEST AND CENTRAL FLORIDA, USA Mohamed A. Dabees 1 and Brett D. Moore 1 The paper discusses the analysis of up-drift beach erosion near selected
SHORE PROTECTION AND HABITAT CREATION AT SHAMROCK ISLAND, TEXAS ABSTRACT
 SHORE PROTECTION AND HABITAT CREATION AT SHAMROCK ISLAND, TEXAS M. Cameron Perry, P.E., and Daniel J. Heilman, P.E. Coastal Engineer Shiner Moseley & Associates., Inc. 555 N. Carancahua Corpus Christi,
Feasibility Study for Restoration of Titlow Lagoon Fish Passage. South Puget Sound Salmon Enhancement Group
 Feasibility Study for Restoration of Titlow Lagoon Fish Passage South Puget Sound Salmon Enhancement Group January 2010 Feasibility Study for Restoration of Titlow Lagoon Fish Passage Prepared for South
CMS Modeling of the North Coast of Puerto Rico
 CMS Modeling of the North Coast of Puerto Rico PRESENTED BY: Dr. Kelly Rankin Legault, Ph.D., P.E. 1 Dr. Alfredo Torruella, Ph.D. 2 1 USACE Jacksonville District 2 University of Puerto Rico October 2016
Applications of ELCIRC at LNEC
 stratification in the Guadiana estuary tidal propagation in the Óbidos lagoon Lígia Pinto Anabela Oliveira André B. Fortunato 2 O utline Stratification in the Guadiana estuary The Guadiana estuary Objectives
BEACH PROCESSES AND COASTAL ENVIRONMENTS
 BEACH PROCESSES AND COASTAL ENVIRONMENTS COASTAL FEATURES Cross section Map view TOPICS: Terminology Waves Beach Morphology Barriers Coastal Migration Tides Tidal Flats and Marshes Sediment Budgets Human
Preliminary Wake Wash Impact Analysis Redwood City Ferry Terminal, Redwood City, CA
 Technical Memorandum Preliminary Wake Wash Impact Analysis Redwood City Ferry Terminal, Redwood City, CA 1. Introduction The following preliminary wake wash impact analysis was initiated by the Port of
MARSH DEGRADATION AT THE MOUTH OF MOORE CREEK
 MARSH DEGRADATION AT THE MOUTH OF MOORE CREEK Hunter Winstanley, Department of Earth Sciences, University of South Alabama, Mobile, AL 36688. E-Mail: hcw501@jaguar1.usouthal.edu. Moore Creek is located
LOCAL COASTAL PROGRAM UPDATE
 LOCAL COASTAL PROGRAM UPDATE Agenda Meeting #1 General Information (1 1:45 pm) Introductions and Background Grants involved What is a Local Coastal Program? What is required? LCP Update tasks and schedule
Roundabout Feasibility Memorandum
 Roundabout Feasibility Memorandum To From Gwen Pipkin Bill Howell Date June 18, 2013 Subject Roundabout Feasibility Study SR 29 PD&E Study From Oil Well Road to SR 82 Collier County, FL FPID 417540-1-22-01
DUNE STABILIZATION AND BEACH EROSION
 DUNE STABILIZATION AND BEACH EROSION CAPE HATTERAS NATIONAL SEASHORE NORTH CAROLINA ROBERT DOLAN PAUL GODFREY U. S. DEPARTMENT OF INTERIOR NATIONAL PARK SERVICE OFFICE OF NATURAL SCIENCE WASHINGTON, D.
Project Incorporation of Sea Level Rise City of Newport Beach Approach for Balboa Islands, City of Newport Beach, California
 Project Incorporation of Sea Level Rise City of Newport Beach Approach for Balboa Islands, City of Newport Beach, California Ying Poon, Everest International Consultants, Inc. CMANC Annual Winter Meeting
DEAD-ENDCHANNELFLUSHINGINHARBORS
 DEAD-ENDCHANNELFLUSHNGNHARBORS PURPOSE: The purpose of this technical note is to present some design con- siderations which benefit dead-end channel flushing. Some of these factors can also be used to
DRAFT. October 17, 2014 File No Mr. Brendhan Zubricki Town Administrator Essex Town Hall 30 Martin Street Essex, MA.
 GZA GeoEnvironmental, Inc. Engineers and Scientists October 17, 2014 File No. 18.0171857.00 Mr. Brendhan Zubricki Town Administrator Essex Town Hall 30 Martin Street Essex, MA. 01929 DRAFT Re: Essex River
Case Studies. Georg Umgiesser and Natalja Čerkasova KU, Lithuania
 Case Studies Georg Umgiesser and Natalja Čerkasova KU, Lithuania Case 1: A beach in the Curonian Lagoon Beach Current situation in Curonian lagoon Beach in Kintai In the past, especially in Baltic inner
ALTERNATIVES FOR COASTAL STORM DAMAGE MITIGATION
 ALTERNATIVES FOR COASTAL STORM DAMAGE MITIGATION Dave Basco Old Dominion University, Norfolk, Virginia, USA National Park Service Photo STRUCTURAL (changes to natural, physical system) hardening (seawalls,
Louisiana CPRA SJB Group, Baton Rouge Coastal Engineering Consultants U.S. Army Corps of Engineers Federal and State PDT Members
 Louisiana CPRA SJB Group, Baton Rouge Coastal Engineering Consultants U.S. Army Corps of Engineers Federal and State PDT Members Project Setting and Background Island Restoration Plans Pre-Screening Analysis
LITTLE LAGOON & LITTLE LAGOON PASS: RESEARCH UPDATES & DIRECTIONS
 LITTLE LAGOON & LITTLE LAGOON PASS: RESEARCH UPDATES & DIRECTIONS Bret M. Webb, PhD, PE, DCE Professor Department of Civil, Coastal, and Environmental Engineering October 19, 2017 LLPS Meeting Acknowledgments
CORPS FACTS. Harbor Dredging U.S. ARMY CORPS OF ENGINEERS BUILDING STRONG
 CORPS FACTS Harbor Dredging U.S. ARMY CORPS OF ENGINEERS BUILDING STRONG Disaster Response Sedimentation in the channel is caused by the normal cycle of silt movement, erosion from high water or heavy
COASTAL ENVIRONMENTS. 454 lecture 12
 COASTAL ENVIRONMENTS Repeated movement of sediment & water constructs a beach profile reflecting the balance between average daily or seasonal wave forces and resistance of landmass to wave action Coasts
APPENDIX L DETAILED ANALYSIS OF EAST AND LATERAL RUNWAY SAFETY AREA ALTERNATIVES ON TIDAL CHANNEL GEOMORPHOLOGY
 APPENDIX L DETAILED ANALYSIS OF EAST AND LATERAL RUNWAY SAFETY AREA ALTERNATIVES ON TIDAL CHANNEL GEOMORPHOLOGY MEMORANDUM TO: Sheri Ellis (SWCA), Patti Sullivan (FAA), Allan Heese (JNU), Randy Vigil (ACOE),
Tidally influenced environments. By Alex Tkaczyk, Henrique Menezes, and Isaac Foli
 Tidally influenced environments By Alex Tkaczyk, Henrique Menezes, and Isaac Foli Goals and aims Describe the role of tidal influence in depositional environments. - Deltas - Estuaries Provide an overview
Southern California Beach Processes Study
 Southern California Beach Processes Study Torrey Pines Field Site 5th Quarterly Report 31 May 22 to California Resources Agency and California Department of Boating and Waterways R.T. Guza 1, W.C. O Reilly
ALTERNATIVES FOR COASTAL STORM DAMAGE MITIGATION AND FUNCTIONAL DESIGN OF COASTAL STRUCTURES
 The University of the West Indies Organization of American States PROFESSIONAL DEVELOPMENT PROGRAMME: COASTAL INFRASTRUCTURE DESIGN, CONSTRUCTION AND MAINTENANCE A COURSE IN COASTAL DEFENSE SYSTEMS I CHAPTER
Memorandum. Dr. Wilbert Odem, Dr. Paul Trotta, and Mr. Justin Ramsey. From: Timothy Mahon, Patrick Belsheim, and Ali Alrayyes.
 Memorandum To: Dr. Wilbert Odem, Dr. Paul Trotta, and Mr. Justin Ramsey From: Timothy Mahon, Patrick Belsheim, and Ali Alrayyes Date: 10/17/2013 Re: Routes Decision Matrix Decision Matrix Methodology The
SELECTION OF THE PREFERRED MANAGEMENT OPTION FOR STOCKTON BEACH APPLICATION OF 2D COASTAL PROCESSES MODELLING
 SELECTION OF THE PREFERRED MANAGEMENT OPTION FOR STOCKTON BEACH APPLICATION OF 2D COASTAL PROCESSES MODELLING C Allery 1 1 DHI Water and Environment, Sydney, NSW Abstract This paper presents an approach