CLAM PASS RESTORATION AND MANAGEMENT PLAN BATHYMETRIC MONITORING REPORT NO. 7 Including Interior Bay Dredge Cuts and Tidal Data
|
|
|
- Elmer Green
- 5 years ago
- Views:
Transcription
1 CLAM PASS RESTORATION AND MANAGEMENT PLAN BATHYMETRIC MONITORING REPORT NO. 7 Including Interior Bay Dredge Cuts and Tidal Data Submitted to: Florida Department of Environmental Protection DEP File No JC Submitted by: Pelican Bay Services Division, Collier County Prepared by: Humiston & Moore Engineers HM File No / January 2007 Main Office : 5679 Strand Court Naples, FL Phone Fax mail@humistonandmoore.com East Coast Office : 805 East Hillsboro, #103 Deerfield Beach, FL Phone Fax web site :
2 CLAM PASS BATHYMETRIC MONITORING REPORT NO. 7 Including Interior Bay Dredge Cuts and Tidal Data CONTENTS 1. Summary Introduction Inlet Cross Sections Interior Channels Tidal Study Shoreline Change Conclusions and Recommendations Recommendations for Ongoing Monitoring Previous Recommendations Comments on CP&E Independent Analysis of Clam Pass References...29 LIST OF TABLES 1. Average Cross Sectional Areas Cut # LIST OF FIGURES 1. Clam Bay Site Plan Clam Pass Dredge Cut # Average Cross Section of Flow in Cut #4 Segments Cumulative Shoaling in Cut #4 Segments High Tide Phase Lag Low Tide Phase Lag Clam Bay Tidal Range Relative Shoreline Position In Comparison to Clam Pass Contours...23 APPENDICES Appendix A, Cut # A-1 Aerial A-2 Cross Sectional Area Chart A-3 Cross Sectional Area Table A-4 Cross Sections (0+00 to 2+46) A-5 Cross Sections (3+43 to 6+59) A-6 Cross Sections (7+21 to 8+59)
3 Appendix B, Cut # B-1 Aerial B-2 Cross Sectional Area Chart B-3 Cross Sectional Area Table B-4 Cross Sections (0+00 to 2+66) B-5 Cross Sections (3+13 to 6+01) Appendix C, Cut # C-1 Aerial C-2 Cross Sectional Area Chart C-3 Cross Sectional Area Table C-4 Cross Sections (0+00 to 2+95) C-5 Cross Sections (3+65 to 7+03) C-6 Cross Sections (7+54) Appendix D, Cut # D-1 Aerial D-2 Cross Sectional Area Chart (0+00 TO 7+10) D-3 Cross Sectional Area Chart (7+50 TO 18+28) D-4 Cross Sectional Area Chart (18+70 TO 35+37) D-5 Cross Sectional Area Table D-6 Cross Sections (0+00 to 0+50) D-7 Cross Sections (0+75 to 1+25) D-8 Cross Sections (1+50 to 2+00) D-9 Cross Sections ( to ) D-10 Cross Sections (4+10 to 5+10) D-11 Cross Sections (5+60 to 6+60) D-12 Cross Sections (7+10 to 8+00) D-13 Cross Sections (8+50 to 9+50) D-14 Cross Sections (10+00 to 10+50) D-15 Cross Sections (11+00 to 12+00) D-16 Cross Sections (12+50 to 13+50) D-17 Cross Sections (14+00 to 15+00) D-18 Cross Sections (15+50 to 16+50) D-19 Cross Sections (17+00 to 18+00) D-20 Cross Sections (18+28 to 19+21) D-21 Cross Sections (20+82 to 22+20) D-22 Cross Sections (23+10 to 25+84) D-23 Cross Sections (26+39 to 29+13) D-24 Cross Sections (29+89 to 31+53) D-25 Cross Sections (32+04 to 34+23) D-26 Cross Sections (34+72 to 35+37) D-27 Inlet Volume Dredge and Cumulative Volume Dredge D-28 Cross Sections (3+65 to 7+03) Appendix E, Beach Profiles...77 E-1 Aerial E-2 Reference Monument Plots (R-38 to R-41) E-3 Reference Monument Plots (R-42 to R-44) E-4 Shoreline Position Relative to DEP Monument l E-2 Shoreline Change June 05 July 06 E-2 Shoreline Change
4 CLAM PASS RESTORATION AND MANAGEMENT PLAN BATHYMETRIC MONITORING REPORT NO. 7 January, Summary The Clam Pass Restoration and Management Plan was implemented in 1999 to improve flushing of the Clam Bay System and mangrove preserve. Additionally, the flood tidal shoal and some of the interior waterways were dredged at the same time to improve the hydraulic efficiency of the inlet and increase the tidal prism. The improved tidal prism means more water goes in and out of Clam Pass on each tidal cycle and this larger volume of water generates stronger currents in the inlet which help to keep the inlet open and maintain the flushing improvements. Since the 1999 dredging, annual monitoring data has continually shown that implementation of the dredging element of the Clam Bay Restoration and Management Plan has significantly improved tidal exchange throughout the bay system. The maintenance dredging of the flood shoals in January 2002 was shown to be beneficial to maintaining the improved tidal prism. Seven years after the initial dredging in 1999 and nearly four years after the maintenance dredging of the flood shoals in 2002, monitoring data show the average cross sectional flow area through the inlet remains at more than twice the cross sectional area prior to the 1999 dredging. Additionally, the tidal ranges and phase lags continue to show that the bay system is flushing more effectively than prior to the 1999 dredging. The 2005 Monitoring report recommended that another maintenance dredging event be schedule for the winter of 06/07. In response to this recommendation a Notice to Proceed has been granted by the Florida Department of Environmental Protection to conduct another maintenance dredging of Clam Pass. The maintenance dredging will be limited to Cut 4 between stations 0+00 and 18+00, which are located at the entrance of the inlet, and portions of the flood shoal. No dredging is currently proposed for any of the interior channels (18+28 through 35+37) including cut #1, cut #2, and cut #3. The 2006 average cross sectional area is nearing or surpassed the shoaling conditions which existed prior to the maintenance dredging which was completed in Although the tidal data shows that flow through the inlet is still significantly stronger than the pre-1999 conditions and may be sufficient to maintain flushing to the bay for the time being, there are indications that the flow through the inlet has diminished somewhat since the 2002 dredging. In order to reduce the potential for tidal exchange being diminished to the point where flushing might be inadequate, maintenance dredging is scheduled for early in There has been recent discussion about Collier County expanding the dredging to include the ebb shoal for the purpose of obtaining additional sand for nourishment of the Clam Pass Park beach. This approach would provide immediate relief to the erosion problem on the park beach; however, it may also have long term consequences that should be carefully considered because a common impact from dredging inlet ebb shoals is increased erosion of adjacent beaches.
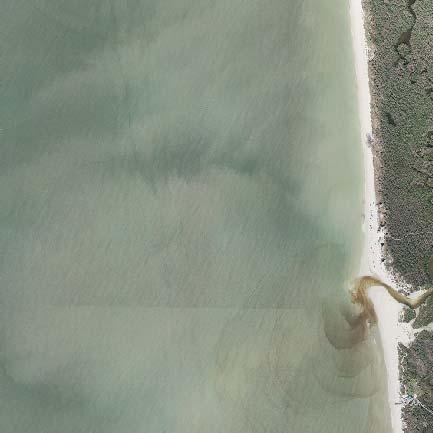
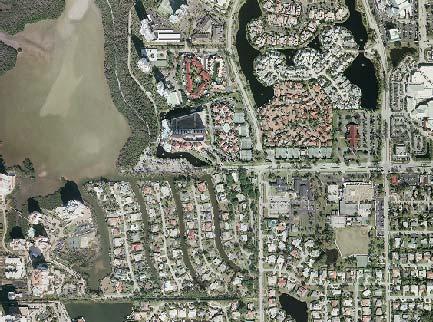
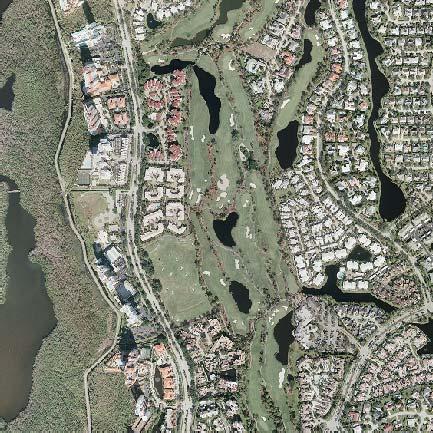
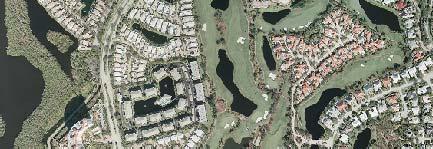
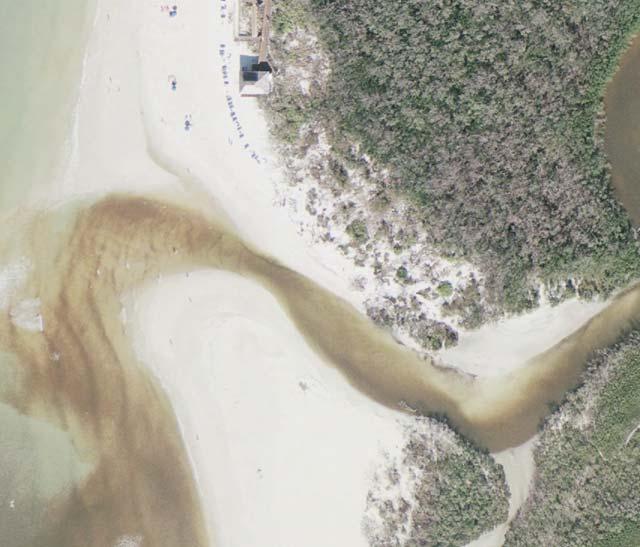
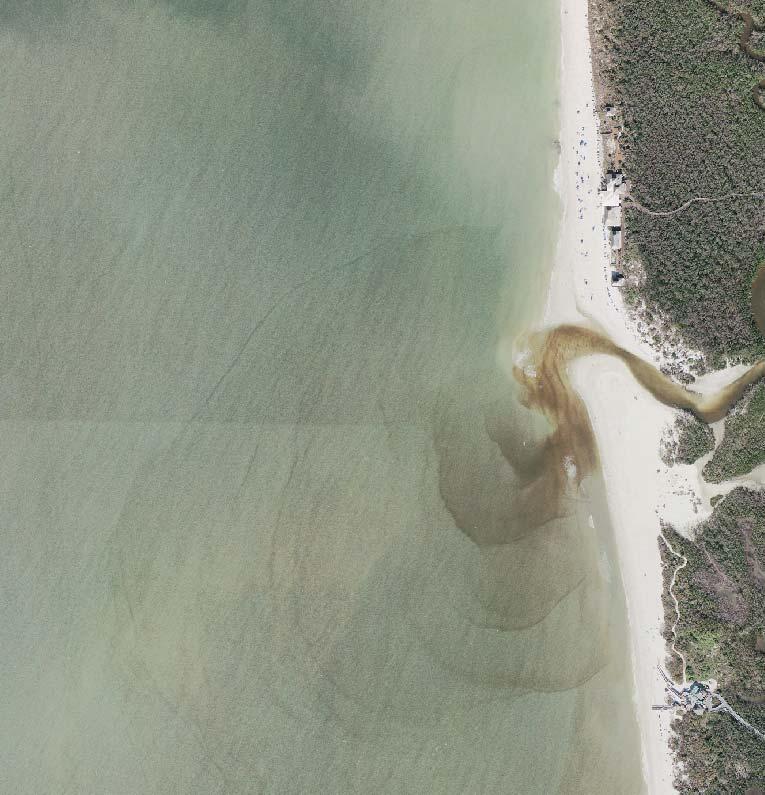
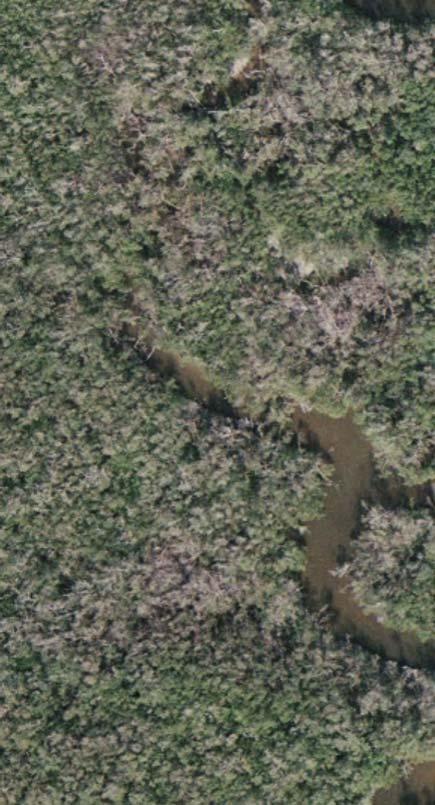
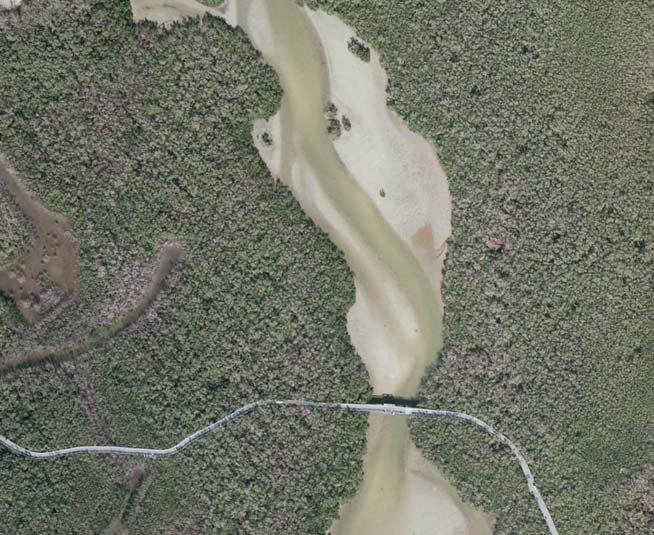
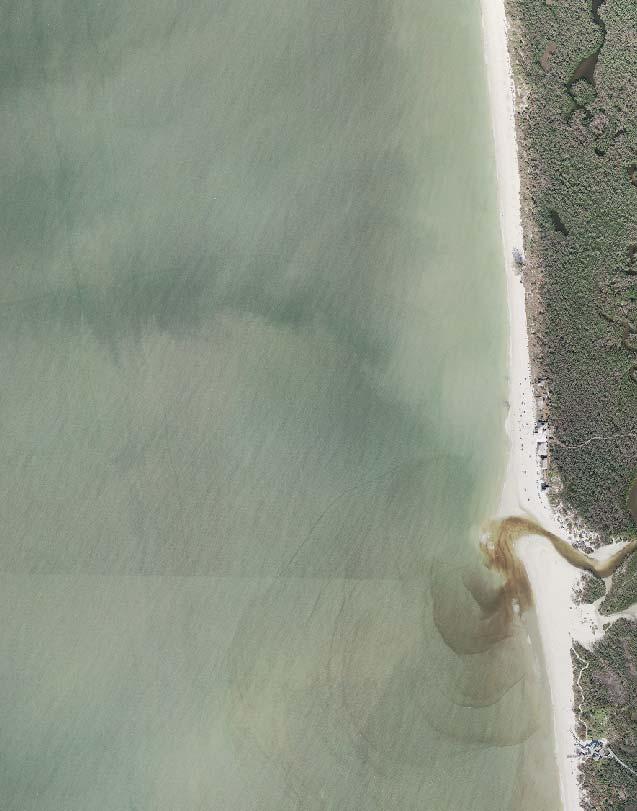
5 2. Introduction This report was prepared to fulfill the requirements of DEP permit JC and presents the ninth set of monitoring data collected following implementation of the dredging element of the Clam Bay Restoration and Management Plan in April Previous monitoring of Clam Pass dredging has been reported in Clam Pass Bathymetric Monitoring Reports numbered 1 through 8 which document dredging events and rates of shoaling in Clam Pass in fulfillment of Florida Department of Environmental Protection Special Permit Condition 10 contained in Permit No JC. Due to the dynamic nature of Clam Pass and the importance of maintaining the tidal flow to the Clam Bay system, Collier County had dredged Clam Pass in the spring of every year from 1995, to The dates and permit references under which dredging had been conducted from 1995 to 1999 are presented in earlier monitoring reports. In 1999, the pass was dredged under JCP permit JC, as part of the implementation of the Clam Bay Restoration and Management Plan, which included dredging portions of the flood shoals and inner channels to improve the hydraulic stability of the inlet and reduce flow restrictions to and from Upper Clam Bay and Inner Clam Bay. Figure 1 shows the cuts which were dredged as part of the Restoration and Management Plan. The most recent dredging of Clam Pass was completed in January 2002, as maintenance dredging under the same permit. The portion of Cut 4 which lies close to the inlet is the most rapid shoaling area in the system, and is the part of the project which required maintenance dredging in Another maintenance dredging event is schedule for early in 2007, which will also be completed under the JCP permit JC and limited to Cut 4. This report presents the results of the July 2006 monitoring of the inlet plus the immediate vicinity, which has been covered in previous monitoring reports. Additionally, this report includes monitoring of the inner channels. The inner channels are monitored on two year intervals because previous monitoring has demonstrated that the shoaling rates in these areas are much lower than the rates in the entrance channel and flood shoal. Figure 1 is a location map of the study area, which shows the locations of the four dredge cuts and the beach profiles surveyed at the DEP reference monuments. 3. Inlet Cross Sections The channel cross section plots for Clam Pass and the flood shoal are presented in Appendix D. This includes stations 0+00 through of Cut #4 which is the entrance channel and the portion of Cut #4 subject to the most active shoaling. Figures D-1 through D-21 show the November 1999 post dredging survey in comparison to the two most recent monitoring surveys from June 2005 and July Figure 2 illustrates the location of the monitoring stations. Cuts 1, 2, and 3 are inner channel cuts which will be discussed later. Clam Pass is a relatively small inlet with a relatively small tidal prism, and therefore has limited tidal energy to generate currents to scour sand from the channel. Because of this the inlet dynamics are predominately wave induced rather than tidally induced, it is susceptible to migration or even closure. The problem manifests itself when storm waves generate high levels of littoral transport along the beach, which may deposit significant amounts of sand in
6
7 the inlet. The effects of storms on the inlet are, however, highly variable because high storm surge associated with some storms may generate strong tidal currents and scour action to offset the shoaling caused by wave induced sand transport. This is what happened at Clam Pass during Tropical Storm Gabriel in The 2006 monitoring data illustrates the weather dependent variability of inlet dynamics. Figure D-5 shows that an increase in the cross sectional area of flow has occurred between July 2005 and July 2006 near the entrance of the inlet, at stations 0+00 to 1+00, while a decrease in cross sectional area occurred on most of the stations between 1+50 and within the interior portions of the inlet The increase in channel cross sectional area between stations 0+00 and 1+00 is due to the onshore migration of the ebb shoal due to wave action, resulting in a general deepening of the nearshore area around the inlet entrance. A significant amount of this sand moved onshore, primarily south of the inlet, however, some of the sand was pulled into the interior potions of the inlet and deposited on the flood shoal. The onshore movement of sand from the ebb shoal onto the beach south of the inlet is part of the natural process by which littoral drift bypasses the inlet. This illustrates why inlet sand bypassing may be more of a cyclical process as opposed to a steady process in which a predictable amount of sand may be expected to bypass on an annual basis. Channel cross sectional flow area represents an important indication of the stability of the inlet. The most active region of cut #4, in terms of sand transport and shoaling, is divided into three segments to evaluate the general conditions of cross sectional area and shoaling, as defined below and illustrated in figure 2. Segment # Station Limits A 0+00 to 3+00 B 3+65 to 6+10 C 6+60 to Segment A is the most active zone which includes the cut across the landward portion of the flood shoal and the beach. Segment B includes the portion of the flood shoal closest to the inlet. The channel is wider in segment C, which may be considered the inner portion of the flood shoal, and current velocities are therefore lower in this segment. The lower current velocities allow shoaling to occur here when sand is pulled into the inlet on flood tide. Segment A is typically the most dynamic because it crosses the littoral zone. Rapid shoaling may occur here during periods of high wave energy when littoral transport rates along the beach are high. Strong tidal currents may scour some of that sand out of the channel, particularly during a storm surge, or spring tide which is the part of each month when tidal currents are the strongest. To some extent the same is true for segment B because sand scoured from A on a flood tide is carried into B and C. Segment C has the largest cross section and therefore the slowest currents, and sediment that reaches this interior part of the flood shoal therefore tends to accumulate there until it is dredged. Dredging that keeps C open helps to maintain the strong tidal currents that are capable of scouring sand out of A and B. Table 1 and Figure 3 illustrate the variability that occurs from shoaling which decreases the cross section and scour which opens it back up again. Note that the cross sectional area for A and B fluctuates about the 200 square feet level, indicating that this is close to the equilibrium cross sectional area. Segment C, however, shows a tendency for the cross

8
9 section to steadily decrease following a dredging event. If the cross sectional area of C gets down to the 200 feet level, there is not enough tidal energy to overcome the frictional resistance to flow through a channel of the combined lengths of A, B, and C, and all three segments will continue to shoal and the potential for inlet closure increases. In this analysis, the channel width is measured at 0 ft. NGVD and the cross sectional area is calculated from the area bound by the bottom profile and 0 NGVD elevation. The 0 NGVD contour is used as a common datum for shoreline positioning. For reference purposes, mean high water (MHW) for this area is +1.5 feet above NGVD, mean tide level is +0.5 feet above NGVD, and mean low water (MLW) is 0.5 feet below NGVD 1. 1 The elevations of Mean High Water (MHW) and Mean Low Water (MLW) are based on DEP Special Report No. 87-2, Predicted Open Tidal Datums for the Florida Lower Gulf Coast, Balsillie, 1987, and discussions with the DEP Bureau of Survey and Mapping.
10 The cross sectional areas have been averaged within each segment for the surveys as shown in Table 1: Table 1 Average Cross Sectional Areas within Active Portion of Cut #4 Clam Pass Monitoring 1998 to 2006 Date of Survey Description of Survey Avg. Area (ft 2 ) Segment A Avg. Area (ft 2 ) Segment B Avg. Area (ft 2 ) Segment C 10/1998 Pre-dredge /1999 Post dredge / month monitoring / month monitoring no data 09/2001 Post Tropical Storm Gabrielle /2001 Pre-maintenance dredge /2002 Post maintenance dredge no data 04/ month monitoring / month monitoring /2003 Post storm / month monitoring / month monitoring / month monitoring Note: Monitoring time is in reference to completion of the April 1999 dredging. All three segments were dredged in Only segments B and C were dredged during the January 2002 maintenance dredging. Following the maintenance dredging in 2002, Segment A experienced shoaling in response to high wave energy. The shoaling took the form of a sand spit that grew across the inlet entrance from the south causing the inlet entrance to migrate north approximately 400 feet. In October 2002 scour from tidal currents during an elevated storm tide reopened Segment A along the dredged channel alignment. This is an example of how the increased tidal prism and stronger tidal flow resulting from the 1999 dredging has been effective in maintaining the average channel cross section above the pre-dredge condition in Based on the most recent monitoring of July 2006, the average cross sectional area in each of the three segments remains substantially above the 1999 pre-dredge condition. As in 2002, the 2006 monitoring data also indicate a high wave energy event affected the region landward transport of sand from segment A which increases the cross sectional area of flow, while decreasing sections B and C. In addition, it is evident through Table 1 that the average cross sectional area of flow of Segments A, B, and C are close to the levels of the December 2001 pre-maintenance dredging. Figure 3 presents a time series plot of the average cross sectional areas from Table 1. This further indicates that maintenance dredging is needed. A detailed listing of individual cross sectional areas for each station is presented in Appendix D. Another way to evaluate the stability of the inlet is to consider the amount of sand which is accumulating within each of the three segments. The volume of sand accumulated in each segment was calculated based on surveys conducted since the dredging of the inlet in April The results are presented in Figure 4, which represents the cumulative volumetric change within each segment. The volumetric change is presented as a total volume change measured across the entire surveyed cross section, and therefore may actually be more
11
12
13 than the total amount of sand accumulated within the limits of the designated dredge cut. In general, the total cumulative volume would normally be greater than that which accumulated within the more limited area between the dredge limits, which is apparent for Segment A in Figure 4. The baseline for the dredge cut volume is the dredge template; following a dredging event the dredge cut volume would be zero if all the lines and grades were achieved. In practice a small amount of material has been left in the dredge cut because there are some areas where the digging depth has been decreased to avoid excavating undesirable material. For convenience, the baseline for the total cumulative volume was arbitrarily established as the same value as the dredge cut volume for the 1999 post dredging data point on figure 4. This is why the total dredge cut volume may be a negative number if overdredging occurs beyond the lines and grades of the dredge cut. The total cumulative volume on Figure 4 is therefore to illustrate relative change for the purposes of comparison, but the actual values are arbitrary. The cumulative shoaling which has occurred since the 1999 dredging was summarized in previous reports and is reproduced below for convenience, because this describes how the increased tidal prism helps the inlet maintain itself, and how this process is affected by storm events. The summary below was updated to include the most recent monitoring interval: April 1999 to May 2000: Following the comprehensive dredging completed in April 1999, shoaling occurred in all three segments. This indicates that all three of these segments are within the active littoral portion of the inlet system. For Segment A, approximately 50% of the shoaling occurred within the dredge cut, the remainder represents material which accumulated in the ebb shoal or on the beach adjacent to the dredge cut. Practically all of the shoaling occurred within the dredge cut limits in segments B and C. May 2000 to February 2001: During this time period shoaling continued in Segment A yet at a slower rate, probably because the inlet cross sectional area was near an equilibrium condition where tidal currents were able to scour sand from the channel at approximately the same rate that wave action deposited sand in the channel. Segment B showed very little volumetric change. Segment C was not surveyed as part of the February 2001 survey. In general, the flattening of the cumulative shoaling curve indicates that segments A and B appear to be close to equilibrium. September 14, 2001: This interval was impacted by Tropical Storm Gabrielle. Segment A shows that in spite of storm waves that would tend to push sand into the inlet, strong tidal currents associated with the elevated storm tide scoured sand out of the inlet entrance. This restored the entrance channel to the straight alignment that had been dredged as a design element of the Restoration and Management Plan. This is a direct indication of successful establishment of improved inlet hydraulics from the 1999 implementation of the dredging element of the Restoration and Management Plan. February and August 2001 to September 19, 2001: Impacts of tropical storm Gabrielle are evident within each segment. The inlet channel in the seaward Segment A was scoured and enlarged due to strong currents accompanying the storm surge as discussed above. Segment B remained essentially the same; however, some of the sand scoured from Segment A during Gabrielle was carried in the inlet and deposited on the inner shoal in Segment C. This contributed to the increase in sand volume in Segment C for this
14 monitoring interval. It should be understood that Segment C is dredged to a much larger channel flow cross section than the entrance channel, so that a substantial amount of sand can accumulate in Segment C before it begins to adversely affect inlet hydraulics. This area is designed to act as a deposition basin which becomes a source of sand for beach nourishment when inlet dredging becomes necessary. September 2001 to December 2001: A pre-dredge survey was conducted in December This survey showed shoaling in Segment A subsequent to the scour which occurred during tropical storm Gabrielle. This shoaling represents reestablishment of the shoal volume which was diminished due to onshore transport during the storm. A slight reduction in volume was evident in segments B and C over this time. These changes probably represent redistribution of sand along the channel from tidal currents. A decrease in sand volume in segment C is unusual and may be the result of changes in the shape or location of the channel because the shoal geometry which formed under impacts of the storm is likely to be different to the geometry that conforms to normal tidal flow. December 2001 to January 2002: Segments B and C were dredged during this interval. This was maintenance dredging to prevent accumulation from reaching levels that could adversely affect inlet hydraulics and the self scouring capability of the inlet. Approximately 11,500 cubic yards of sand were dredged from these two segments. The sand was used to mitigate beach erosion on the county park south of the inlet. Segment A was not dredged except for a small amount of dredging that was necessary to get the dredge in the inlet. January 2002 to February 2002: Immediately following the dredging, the Segment A channel cross section increased in size due to the scour action of improved hydraulics resulting from the dredging. Segments B and C began to shoal. February 2002 to June 2003: Shoaling occurred in all three segments similar to the time period following the 1999 dredging. June 2003 to November 2003: An elevated storm tide impacted the area, and sand was again scoured from segments A, and B. Some of this sand was carried in the inlet and deposited in Segment C. November 2003 to May 2004: Minor shoaling occurred in segments A and C with minor scouring in Segment B. There were no significant storm events and these changes should be considered normal redistribution of sediments along the channel from tidal currents. May 2004 to June 2005: Shoaling occurred in all three segments. Some of the shoaling in A was the result of formation of a sand spit growing into the inlet from the south side, resulting in northward migration of the inlet. June 2005 to July 2006: Shoaling occurred in sections B and C, but there was a decrease of sand volume in section A. The decrease of material in section A is probably related to the 2005 Gulf Hurricane Season, during which there were periods of extreme waves and tidal elevations. These conditions resulted in a general lowering of the elevation of the flood shoal due to onshore movement of sand, and potentially scour due to higher current velocities associated with higher tide elevations. An increase in beach width on the south side of the inlet indicates that the onshore movement of sand from the flood shoal benefited the park beach to the south. Since a significant amount of the material in the ebb shoal
15 probably came from beaches to the north, this onshore movement is actually part of the normal inlet sand bypass process. The lower tidal velocities in segment C are less effective at scouring sand from the channel, resulting in more rapid accumulation of sand in Segment C under storm conditions. The project was designed this way, because sand can accumulate in Segment C for a longer period of time before the channel becomes restricted to a point where inlet hydraulics my be adversely affected. The monitoring data over the past 7 years show that the dredging completed in 1999, which removed a significant portion of the flood shoal, has resulted in improved stability of the inlet system. The improved tidal prism which resulted from the dredging has allowed the inlet to sustain the impact of the kind of storms which previously had a history of closing the inlet. Figure 4 also provides an overall estimate of the volume of sand within the three segments. Currently there are a total of approximately 12,000 cubic yards of sand within the dredge limits of segments A through C. In comparison, approximately 19,000 cubic yards of sand were dredged from the design cut from these three segments in Segments B and C contain approximately 9,400 cubic yards in comparison to 11,725 cubic yards that was removed in the 2002 maintenance dredging. 4. Interior Channels The interior channel cut locations are shown on Figure 1. The cuts selected for dredging were identified as channel sections which presented restrictions to flow in comparison to other channel sections within the bay system. Appendix A includes a detailed site plan for each dredge cut, cross sections at nominal intervals along each cut, and an illustration of the channel cross sectional area at each station from pre-dredge, post dredge, and most recent surveys. This information shows that the cross sectional area was significantly improved by dredging, and in all but few locations the cross sectional area has changed very little since the initial dredging. This illustrates the difference between the dynamic inlet entrance of Cut 4, which is exposed to high littoral sand transport rates, and interior channels of Cuts 1, 2, and 3, which are not. Dredging of the interior channels has contributed to the improved hydraulic efficiency of the bay system and the inlet, however, it is not anticipated that the interior channels will require maintenance dredging as frequently as is anticipated for cut #4 in the immediate vicinity of the inlet. The 2006/2007 dredging event will not include the interior cuts because little shoaling has occurred since the initial 1999 dredging event occurred. Since the shoaling rate in the less dynamic inner area has been shown to be very slow, it is recommended that surveys continue to be conducted under the monitoring program. However, a survey interval of 4 years should be sufficient for monitoring these relatively stable areas. 5. Tidal Study Prior to the commencement of the March 1999 dredging, water level recording gauges were installed at selected locations within the Clam Bay estuarine system and Gulf of Mexico to measure tidal ranges. Tides along the southwest Florida Coast are mixed; they exhibit
16 either diurnal (one tide per day) or semidiurnal (two tides per day) characteristics during each month depending on the phase of the lunar cycle. Pre-construction tidal data was collected for a full month to obtain average values representative of the general tidal characteristics for Clam Bay, and to establish baseline conditions against which improvements to tidal flow could be measured. The locations of the gages are included in Figure 1. The mixed tide characteristics of this area are important to those who frequently visit the inlet and witness short term changes. During the neap tide part of the month when tidal currents are not particularly strong, the inlet may take on wave dominant characteristics and appear to be shoaling near the entrance, particularly if the neap tide coincides with high wave energy events. During the ensuing spring tide, roughly two weeks later, tidal currents are considerably stronger and may efficiently scour out shoals that formed during the neap tide two weeks earlier. The purpose of the monitoring program is to monitor inlet characteristics on a more comprehensive long term basis, with less emphasis on day to day or week to week changes. One of the parameters monitored during the tidal study is tidal phase lag. This is the time difference between the high and low tide in the Gulf of Mexico and the corresponding high or low tide in the bay. The magnitude of the phase lag is an important indicator of inlet dynamics. Figures 5 and 6 show a comparison of the tidal phase lag at high and low tide conditions at three tide gage locations within the bay system. In each case the phase lag was reduced as a result of the dredging, indicating that the filling and draining of the bay occurred more quickly due to less resistance to flow at the inlet. Additionally, the pre-dredge low tide phase lag was larger than the pre-dredge high tide phase lag and the post-dredging low and high tide phases are now very similar. This asymmetric improvement is because the dredge cut represents a much greater percentage increase in cross section of flow near low tide than it does at high tide. This is illustrated by some of the more heavily shoaled areas that were so clogged with sand that they would be nearly dry at low tide, whereas after the dredging those areas are deep enough to support significant tidal flow even on the lowest tides. This enhanced flow near low tide contributed significantly to the improved tidal exchange. The most recent tidal data, from August through September 2006, shows an overall small decrease in the high tide and low tide phase lags over the previous period, with the exception of the data from the tide gage near the Registry Resort. The Registry tide phase lag increased by two-fold which is unrealistic and indicative of a faulty tide gauge. The data from this gage will therefore be not be considered in the analysis. The decrease in the phase lags at the other gage locations may be attributed to the increase in flow cross section in segment A. The tide phase lags remain significantly below the pre-1999 dredging conditions, indicating that the improvements continue to support better tidal circulation and hydraulic efficiency of the inlet.
17 3:00:00 2:00:00 1:00:00 0:00:00 High Tide Phase Lag CLAM PASS MONITORING Pre-Dredge Post-Dredge : : : : : : : : : : : : : : : : : : : No Data Collected No Data Collected No Data Collected Faulty Gauge No Data Collected No Data Collected Registry South North Location Hours FIGURE 5
18 3:00:00 2:00:00 1:00:00 0:00:00 Low Tide Phase Lag CLAM PASS MONITORING Pre-Dredge Post-Dredge : : : : : : : : : : : : : : : : : : : Registry South North Location Hours No Data Collected No Data Collected No Data Collected Faulty Gauge No Data Collected No Data Collected FIGURE 6
19 CLAM BAY TIDAL RANGES PRE-DREDGE RANGE POST-DREDGE RANGE 10/99-01/00 RANGE 03/00-05/00 RANGE 06/00-07/00 RANGE 09/00-10/00 RANGE 12/00-01/01 RANGE 02/01-05/01 RANGE 07/01-08/01 RANGE 09/01-11/01 RANGE 01/02-03/02 RANGE 04/02-07/02 RANGE 07/02-09/02 RANGE 11/02-02/03 RANGE 05/03-06/03 RANGE 09/03-11/03 RANGE 02/04-03/04 RANGE 04/04-06/04 RANGE 03/05-06/05 RANGE 07/05-11/05 RANGE 08/06-09/06 RANGE Gauge flooded, no data available Gauge not functioning, no data recorded Gauge flooded, no Data Collected No Data Collected No Data Collected No Data Collected No Data Collected Gauge down through 9/28/00 for repair of Naples Pier Preliminary tide data - not to be used for design purposes No NOAA Gulf data from 4/4/01 to No NOAA Gulf Data from 8/1/01 to `8/6/01 GULF REGISTRY SOUTH NORTH LOCATION TIDAL RANGE (FEET) FIGURE 7
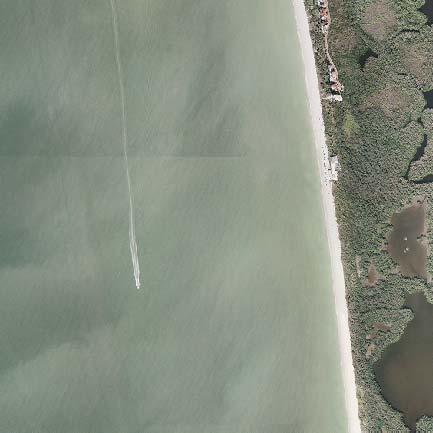
20 The relative tidal range was also evaluated for the post 1999 dredging conditions at each tide gage location as illustrated in Figure 7. In each case there was a significant increase in the tidal range as a result of the March 1999 Clam Bay Restoration dredging project. The dredging opened up the channel and reduced resistance to flow, thereby allowing more water into the bay in a shorter period of time. Since more water gets into the bay on flood tide and more leaves on ebb tide as a result of the reduced restrictions to flow, the average tidal range increased. The January 2002 maintenance dredging appears to have helped to maintain the improved tidal range, which remains significantly above the pre-1999 dredging range. The most recent tidal data, from July through November 04, 2005, and August 08, 2006 through September 24, 2006 show that the tide ranges have remained significantly higher than the pre-1999 dredging condition. 6. Shoreline Change Plots of wading depth profiles surveyed at DEP reference monuments R-38 through R-44 are presented in Appendix C. The beach profiles include data collected in 1999 plus the two most recent annual monitoring surveys to illustrate both cumulative and recent changes. The monitoring program includes profiles at 4 monuments north of the inlet, R-38 to R-41 and 3 monuments south of the inlet, R-42 to R-44. The following discussion considers the position of the 0 NGVD contour for evaluating changes in shoreline position. Over the most recent monitoring interval, the beach stations to the north of the inlet eroded, while south of the inlet both accretion and erosion occurred. The beach at 4 monuments R- 38 through R-41 north of the inlet receded an average of approximately -25 feet, with the most severe erosion of feet at R-41, the station closest to the inlet. For the purpose of comparison to an equivalent length of shoreline represented by the three monuments surveyed south of the inlet, the average change for the three monuments R-39 to R-41 closest to the north side of the inlet was erosion of -28 feet. South of the inlet the beach accreted at R-41 and R-44, and eroded at R-42 between June 2005 and July The average change for these three stations was accretion of approximately 10 feet. The reason part of this area accreted and part eroded is probably due to sand bypassing the inlet and moving onshore, with an uneven distribution of that material due to wave refraction patterns across uneven nearshore contours illustrated in Figure 9. Figure 8 shows a history of shoreline position relative to the 1999 post construction survey. This figure illustrates the longer term changes that have occurred since the 1999 dredging and beach fill. This shows that the beach 2,000 to 3,000 feet north of the inlet at R-38 and R-39 has increased in width by approximately 14 feet since 1999, with most of that increase occurring by April Closer to the inlet, at R-41, the beach width has fluctuated more dynamically over this period, however, due to recent erosion the net change has been shoreline recession of -56 feet between April 1999 and July Figure 8 shows that the shoreline at R-42 immediately south of the inlet has experienced both periods of erosion and accretion, and by July 2006 the shoreline was in the same position as The shoreline at R-43, 1000 feet to the south receded a total of -93 feet
21 RELATIVE SHORELINE POSITION IN COMPARISON TO 1999 CLAM PASS MONITORING Apr-99 Apr-02 Jun-03 Nov-03 May-04 Jun-05 Jul-06 R-38 R-39 R-40 R-41 R-42 R-43 R-44 DEP MONUMENTS SHORELINE CHANGE (FT) CLAM PASS FIGURE 8
22 between 1999 and In order to understand why there was such a significant loss in this area, it should be considered that the 1999 shoreline position was the post construction shoreline position after the beach fill was completed. The beach fill advanced the shoreline approximately 75 feet. The fill placed during that nourishment was relatively fine material from the flood shoal and interior channels, and the character of the material may have contributed to the relatively rapid loss, -53 feet of which occurred during the first year after placement. The shoreline at the next monument to the south followed a pattern similar to R- 42, with a nominal net shoreline advance of 2 feet between 1999 and The average shoreline position change for 2000 feet of shoreline north of the inlet between 1999 and 2006 was recession of -21 feet. For the same length of shoreline south of the inlet the average change was recession of -30 feet.
23
24 7. Conclusions and Recommendations The initial dredging of the flood shoals in 1999 and maintenance of the flood shoal channel in 2002 has resulted in significant improvement to the stability of Clam Pass. These improvements to the hydraulic stability of the inlet from the April 1999 dredging have persisted, however, the inlet channel and flood shoal areas have accumulated enough sand so that conditions are similar to those that existed prior to the maintenance dredging completed in January, Based on the July 2006 survey, there are approximately 12,000 cubic yards of sand within the currently permitted dredging limits. There are approximately 9,400 cubic yards in Segments B and C which were dredged in January This sand is expected to be beach quality. It has been nearly 5 years since the previous maintenance dredging. Although the tidal data show that flows through the inlet are still significantly stronger than the pre-1999 conditions, and may be sufficient to maintain flushing to the bay for the time being, there are indications that the flow through the inlet has diminished somewhat since the 2002 dredging. In order to reduce the potential for tidal exchange becoming diminished to the point where flushing might be inadequate, a Notice To Proceed to conduct another maintenance dredging has been obtained and dredging is scheduled to be conducted during Because of erosion along portions of the Clam Pass Park beach south of the inlet, County staff has recently considered the feasibility of obtaining additional sand for nourishment by expanding the dredging to include the inlet ebb shoal. This approach would provide immediate relief to the erosion problem on the park beach, however, it may also potentially have longer term consequences that should be carefully considered. A common impact from dredging significant portions of inlet ebb shoals is increased erosion of adjacent beaches. This occurs for several reasons including; interruption of natural transport which relies on the presence of an ebb shoal to bypass the inlet, diminished protection from waves for areas close to the shoal, and the readjustment of dredge cut slopes to a natural repose angle as the shoal begins to reform by trapping sand from the littoral system. A more detailed discussion of this is included in Section 10 below. In response to concern over the serious impacts that are likely to occur to the beach adjacent to the inlet from removal of the ebb shoal, and at the same time to provide some additional sand for nourishment of the eroded park beach, the entrance to the inlet will be dredged to the 80 feet width which was originally permitted and excavated during earlier maintenance prior to the 1999 improvements. This wider cut was not dredged in 1999 or in 2002, because it has been determined that 80 feet is significantly wider than the equilibrium channel width supported by tidal flow, and is therefore not necessary to achieve the improved flushing of Clam Bay. Furthermore, the wider cut quickly shoaled in with sand from the beaches immediately adjacent to the inlet. This 80 feet wide cut, however, does not have the potential for the level of serious impacts to adjacent beaches that should be expected from dredging the entire flood shoal, yet it will provide approximately 3,500 additional cubic yards of sand for nourishment. Additionally, careful observation of how the adjacent beaches respond to this relatively small increase in dredging scope may provide useful data regarding potential impacts from more aggressive dredging of the flood shoal.
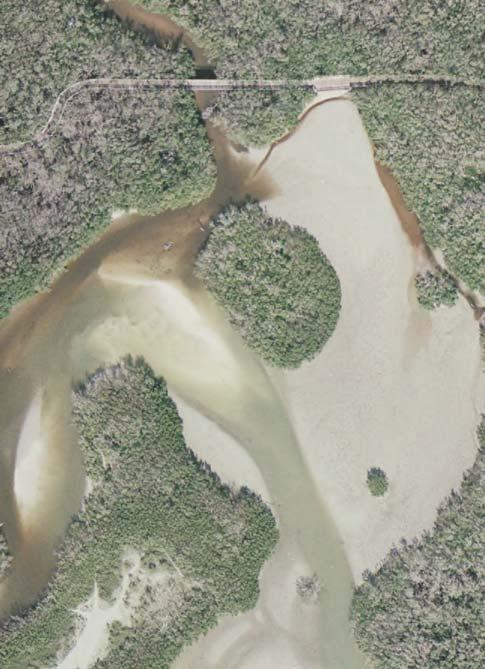
25 The upcoming dredging event therefore includes dredging Station 0+00 through Station 18+00, with a dredge cut width of 80 feet at the entrance to the channel between Stations 0+00 and It is recommended that the shoreline response to this dredging be considered in determining the appropriate dimensions for dredging the entrance channel in the future, because there has been no indication that dredging the entrance to dimensions much greater than the equilibrium section provides any benefit to extending the dredging interval. 8. Recommendations for Ongoing Monitoring. The tidal ranges and phase lags are important indicators of how well tidal flow through the inlet is flushing the bay system. This data is presented in Figures 6, 7, and 8. While these figures illustrate the improvements that have resulted from implementation of the Clam Bay Restoration and Management Plan, they also show that there is a significant amount of scatter in the data. As an extreme example, the most recent data shows the phase lag time at the Registry more than twice the average lag time over the time since the 1999 dredging. These inconsistencies have previously been treated as random scatter in the data because they have for the most part been relatively small in comparison to the overall flushing improvements. This random scatter might be related to factors such as wind influence on tidal flow, or storm water outflow. However, the scatter makes it difficult to identify small changes that would occur in response to the gradual shoaling in the inlet and the interior channels. It is therefore recommended that the tidal data collection program be expanded to include data collection at two additional stations to provide a level of redundancy that would be helpful in understanding the variability that has been fairly consistent in the data for seven years. The Clam Bay Restoration and Management Plan has so far been successful in maintaining a maintenance dredging interval of up to 5 years. This represents considerable cost savings over more frequent dredging, and this cost savings is considered justification for the additional data collection and analysis which may be used to improve management practices. With better understanding of how shoaling in the inlet influences the tidal parameters, it may be possible in the future to base scheduling of maintenance dredging on tidal measurements alone, and thereby reduce frequency and the cost of surveys for monitoring shoaling in the inlet. 9. Previous Recommendations. Recommendations made in previous reports that are still considered relevant to long term management are updated in this section. The long-term management of the Clam Pass inlet system should include continued monitoring of the inlet channel from the gulf to the interior, as well as the meandering connecting channels and along the dredge cut within the Clam Bay system. The July 2006 monitoring data show that cuts 1, 2, and 3 have remained relatively stable since the 1999 dredging. It is recommended that continued monitoring of these areas be conducted at four year intervals. This will reduce monitoring costs. However, there have been changes in the channel cross sections of the interior portion of cut 4 between Station and which demonstrate that this interior channel is a little more dynamic than cuts 1, 2, and 3. Most of the changes have been the result of readjustment of the dredge cut side slopes
26 resulting in a wider but shallower channel, with little change in net flow cross section. There has, however, been a more significant reduction of cross section, in comparison to the post 1999 dredging data, on three stations near the south end of cut 4, on stations to These are the three stations closest to and on the north side of the Clam Pass Park boardwalk bridge. The data show shoaling on these three stations north of the bridge, with an average cross section reduction in cross sectional area of approximately 35%. However, the cross sections at these stations remain approximately 175% greater than the pre-1999 dredging conditions. The recent shoaling in this area could therefore not be the cause of the recent large increase in phase lag measured at the Registry tide gage, and it must be concluded that the large increase in phase lag indicated for the Registry tide gage for 8/3/06 to 9/26/06 is erroneous. The shoaling on these stations has therefore not reached a condition that is critical to tidal flushing of outer Clam Bay, however, it is recommended that monitoring of the interior portions of cut 4 be continued on two year intervals. The tidal studies should be continued as an integral part of the annual monitoring because they will indicate when shoaling of the inlet and other channels has occurred to the extent where tidal circulation in the bay system is affected. (Recommendations regarding tidal studies are included in Section 8 above). Although dredging portions of the meandering channels between the four bays appears to have contributed to improving the flushing of Inner and Upper Clam Bay, the tidal exchange remains relatively low at the north end of the system. If biological studies indicate further enhancement to flushing of the remote northern portion of the bay system is necessary, that may be accomplished by straightening sections of the meandering channel which connect the bays. This approach would necessitate removing small areas of existing mangrove. Although this might be considered a negative impact to the mangrove community, this alternative could include restoration of mangroves within bypassed meandering sections of the channel, which in conjunction with the improved circulation to the mangrove wetland may constitute a net environmental benefit to the broader goal of managing the ecology of the overall bay system that would justify issuance of the required regulatory approvals. 10. Comments on Coastal Planning & Engineering independent analysis of Clam Pass Impacts. A report of an independent evaluation of dredging the Clam Pass ebb shoal was prepared in September 2006 by Coastal Planning and Engineering (CP&E) for the County. That report recommends mining the ebb shoal to obtain material for nourishment of Clam Pass Park Beach. The report concludes that implementation of the Clam Bay Restoration and Management Plan in 1999 disrupted natural north to south sand bypass of the inlet, which resulted in accumulation of sand on the beach north of the inlet and in the ebb shoal, and increased erosion of the beach south of the inlet. The process discussed in the CP&E report is that the Restoration and Management Plan dredging successfully increased the tidal prism, and the greater tidal energy on ebb flow has pushed sand further offshore where it has accumulated in the outer reaches of ebb shoal. This resulted in growth of the shoal, and sand trapped in the growing ebb shoal is a measure of a reduction in sand supply to the park beach.
27 This process as described in the CP&E report is one that may occur at inlets that are maintained by dredging, if the dredging actually increases the tidal prism. Monitoring data show that the Clam Pass tidal prism was increased by the 1999 dredging. However, there are site specific characteristics of Clam Pass that should be taken in to consideration before concluding that dredging the pass and erosion of the beach south of the inlet represent a direct cause and effect relationship. The CP&E report uses an empirical relationship to estimate the volume of sand that might be expected to be trapped by the growing ebb shoal. However, the empirical relationship is based on some rather broad assumptions, and an estimate based on the survey from September 2006 indicates that the ebb shoal actually contains a much smaller quantity of sand than the shoal volume predicted by empirical formula. Furthermore, based on recent accretion that has occurred south of the inlet, it is apparent that a significant amount of sand is already bypassing the inlet, which is an indication that the shoal is probably close to an equilibrium condition with respect to the tidal prism. Furthermore, what this empirical relationship says is that mining of all the sand from the ebb shoal will result in a condition which is much further from equilibrium than what exists now. In order to restore itself after such a mining operation, the shoal will accumulate sand at a higher rate and for a longer period of time, which would very likely result in a chronic erosion problem on both sides of the inlet. Review of historical data from the DEP Shoreline Change Atlas, plus more recent DEP survey data, seem to indicate some level of inlet effects on the downdrift beach. However, it is not clear from the recent monitoring data that the 1999 dredging has resulted in any significant increase in those effects. What should be a more important consideration is; to whatever extent the 1999 dredging may have affected the downdrift beach by trapping sand, an extensive mining of the ebb shoal will have a much greater impact. Increasing the scope of the shoal dredging does not seem to be an appropriate way to address the erosion problem. Summary Although inlet processes potentially impact the beach south of the inlet, the present maintenance plan for the inlet minimizes this potential by minimizing dredging of the ebb shoal. The changes that occurred during the 2005 to 2006 interval indicate that natural bypass is occurring. This does not necessarily mean that natural bypass is going to be sufficient to entirely address the erosion problem at the County Park beach, and additional nourishment may be necessary. However, removal of the Clam Pass ebb shoal should not be considered as the sand source for this nourishment because that would be trading one problem for another potentially more serious problem. A better solution would be to allow the natural bypass process to work and to supplement that process with nourishment form other sources as needed. The CP&E report does not address the issue of impacts from the proposed ebb shoal mining. Because of the potential impacts, it is doubtful that permits could be obtained for this proposal. It is recommended that if plans are ultimately developed for dredging the ebb shoal, those plans should include a contingency plan for addressing impacts that might occur from the dredging. It is likely that a contingency plan, including an approved sand source, would be a condition of the permit if such a permit is issued. It is not anticipated that dredging of the ebb shoal will have any adverse effect on the flushing of Clam Bay or on the mangrove communities in the Clam Bay system.
28 The erosion south of the inlet has been concentrated at R-43 approximately 1,000 feet south of the inlet. Since 1999 there has been very little net change in the park beach closer to the inlet at R-42, or further south at R-44. R-43, however, is in the vicinity of the park beach facility, and the erosion therefore creates a serious problem for the facilities and recreational value of the beach. This erosion hot spot is also evident in the historic data, and may be the result of wave refraction around nearshore contours. Erosion hot spots like this are fairly common adjacent to inlets because of wave refraction due to inlet shoals and tidal currents, and there is elevated hardbottom in the vicinity of the pass which might also contribute to the refraction patterns causing this localized erosion stress. Another alternative that could address this problem is an erosion control structure, such as a segmented breakwater. The use of erosion control structures may be a viable solution because of the localized nature of the problem and the high cost of nourishment if it is necessary to bring sand from a distant sand source.
29 11. References 1.) Agnoli, Barber, and Brundage, Inc. Beach Profile Monitoring Data at the Department of Environmental Protection Reference Monuments R-38 through R-44, 1999 to ) Coastal Planning and Engineering, Inc. Beach Profile Monitoring Data at the Department of Environmental Protection Reference Monuments R-38 through R-44, November, ) Johnson Engineering, Profile Monitoring Data at the Department of Envionmental Protection Reference Monuments R-38 through R-44, July ) Johnson Engineering. Hydrographic Monitoring Data Collected at Cut #4 within the Clam Bay System, July ) Coastal Planning and Engineering Hydrographic Monitoring Data Collected at Cut #4 within the Clam Bay System, September ) 7.) Agnoli, Barber, and Brundage, Inc. Hydrographic Monitoring Data Collected at Cut #4 within the Clam Bay System, 1999 to ) Humiston and Moore Engineers, Project Area Photographs of South Naples Beach. 9.) Humiston and Moore Engineers, Clam Pass Restoration and Management Plan Bathymetric Monitoring Reports 1 through 6, ) Pelican Bay Services District, Tide Data, ) Florida Department of Environmental Protection Joint Coastal Permit No JC. 12.) Walton and Adams, Capacity of Inlet Outer Bars to Store Sand, Fourteenth Coastal Engineering Conference, Hawaii, July, 1976.
30 APPENDIX A DREDGE CUT 1 A-1 Aerial A-2 Cross Sectional Area Chart A-3 Cross Sectional Area Table A-4 Cross Sections (0+00 to 2+46) A-5 Cross Sections (3+43 to 6+59) A-6 Cross Sections (7+21 to 8+59)
31
32 CLAM BAY CUT #1 Area (ft2) Area (ft2) Area (ft2) Area (ft2) Area (ft2) Area (ft2) Pre Dredge March-99 Jul-00 Apr-02 May-04 Jul % -1.3% % Pre Dredge -March-99 March-99 - Jul-00 Jul-00 - Apr-02 Apr-02 - May-04 May-04 - July-06 FIGURE: A CROSS SECTIONAL AREA (SQ. FT) VOLUME CHANGE (SQ. FT)
33 Station Number Distance to Next Station Distance Average Pre Dredge March-99 Jul-00 Apr-02 May-04 Jul-06 Area (ft 2 ) Volume (ft 3 ) Area (ft 2 ) Volume (ft 3 ) Area (ft 2 ) Volume (ft 3 ) Area (ft 2 ) Volume (ft 3 ) Area (ft 2 ) Volume (ft 3 ) Area (ft 2 ) Volume (ft 3 ) FIGURE: A-3
34
35
36
37 APPENDIX B B-1 Aerial B-2 Cross Sectional Area Chart B-3 Cross Sectional Area Table B-4 Cross Sections (0+00 to 2+66) B-5 Cross Sections (3+13 to 6+01) DREDGE CUT 2
38
39 CLAM BAY CUT #2 Area (ft2) Area (ft2) Area (ft2) Area (ft2) Area (ft2) Area (ft2) Pre Dredge March-99 Jul-00 Apr-02 May-04 Jun C9% 4.70% Pre Dredge -March-99 March-99 - Jul-00 Jul-00 - Apr-02 Apr-02 - May-04 May-04 - July 06 FIGURE: B CROSS SECTIONAL AREA (SQ. FT) VOLUME CHANGE (SQ. FT)
40 Station Number Distance to Next Station Distance Average Pre Dredge March-99 Jul-00 Apr-02 May-04 Jun-06 Area (ft 2 ) Volume (ft 3 ) Area (ft 2 ) Volume (ft 3 ) Area (ft 2 ) Volume (ft 3 ) Area (ft 2 ) Volume (ft 3 ) Area (ft 2 ) Volume (ft 3 ) Area (ft 2 ) Volume (ft 3 ) FIGURE: B-3
41
42
43 APPENDIX C DREDGE CUT 3 C-1 Aerial C-2 Cross Sectional Area Chart C-3 Cross Sectional Area Table C-4 Cross Sections (0+00 to 2+95) C-5 Cross Sections (3+65 to 7+03) C-6 Cross Sections (7+54)
44
45 CLAM BAY CUT #3 Area (ft2) Area (ft2) Area (ft2) Area (ft2) Area (ft2) Area (ft2) Pre Dredge March-99 Jul-00 Apr-02 May-04 Jun % -10.1% % 4.2% Pre Dredge -March-99 March-99 - Jul-00 Jul-00 - Apr-02 Apr-02 - May-04 May04 - Aug-06 FIGURE: C CROSS SECTIONAL AREA (SQ. FT) VOLUME CHANGE (CY)
46 Station Number Distance to Next Station Distance Average Pre Dredge March-99 Jul-00 Apr-02 May-04 Jun-06 Area (ft 2 ) Volume (ft 3 ) Area (ft 2 ) Volume (ft 3 ) Area (ft 2 ) Volume (ft 3 ) Area (ft 2 ) Volume (ft 3 ) Area (ft 2 ) Volume (ft 3 ) Area (ft 2 ) Volume (ft 3 ) FIGURE: C-3
47
48
49
50 APPENDIX D DREDGE CUT 4 D-1 Aerial D-2 Cross Sectional Area Chart (0+00 TO 7+10) D-3 Cross Sectional Area Chart (7+50 TO 18+28) D-4 Cross Sectional Area Chart (18+70 TO 35+37) D-5 Cross Sectional Area Table D-6 Cross Sections (0+00 to 0+50) D-7 Cross Sections (0+75 to 1+25) D-8 Cross Sections (1+50 to 2+00) D-9 Cross Sections ( to ) D-10 Cross Sections (4+10 to 5+10) D-11 Cross Sections (5+60 to 6+60) D-12 Cross Sections (7+10 to 8+00) D-13 Cross Sections (8+50 to 9+50) D-14 Cross Sections (10+00 to 10+50) D-15 Cross Sections (11+00 to 12+00) D-16 Cross Sections (12+50 to 13+50) D-17 Cross Sections (14+00 to 15+00) D-18 Cross Sections (15+50 to 16+50) D-19 Cross Sections (17+00 to 18+00) D-20 Cross Sections (18+28 to 19+21) D-21 Cross Sections (20+82 to 22+20) D-22 Cross Sections (23+10 to 25+84) D-23 Cross Sections (26+39 to 29+13) D-24 Cross Sections (29+89 to 31+53) D-25 Cross Sections (32+04 to 34+23) D-26 Cross Sections (34+72 to 35+37) D-27 Inlet Volume Dredge and Cumulative Volume Dredge D-28 Cross Sections (3+65 to 7+03)

51
52 CLAM PASS CUT #4 (STA STA. 7+10) Area (ft2) Area (ft2) Area (ft2) Area (ft2) Area (ft2) Jun-03 Nov-03 May-04 Jul-05 Jul_ % -8% -20% 35% June-03 - Nov-03 (cy) Nov-03 - May-04 c(y) May-04 - July-05 c(y) May-05 - July-06 c(y) Area Change Area Change Area Change Area Change FIGURE: D CROSS SECTIONAL AREA (SQ. FT) CROSS SECTIONAL AREA CHANGE (SQ. FT)
53 CLAM PASS CUT #4 (STA STA ) Area (ft2) Area (ft2) Area (ft2) Area (ft2) Area (ft2) Jun-03 Nov-03 May-04 Jul-05 Jul_2006-4% -5% -10% -12% FIGURE: D CROSS SECTIONAL AREA (SQ. FT) June-03 - Nov-03 (cy) Nov-03 - May-04 c(y) May-04 - July-05 c(y) May-05 - July-06 c(y) Area Change Area Change Area Change Area Change FT) CROSS SECTIONAL AREA CHANGE (SQ.
54 CLAM PASS CUT #4 (STA STA ) Area (ft2) Area (ft2) Area (ft2) Area (ft2) Area (ft2) Jun-03 Nov-03 May-04 Jul-05 Jul_2006 0% +2% FIGURE: D CROSS SECTIONAL AREA (SQ. FT) % -14% Ap-02 - June-03 (cy) June-03 - Nov-03 (cy) Nov-03 - May-04 c(y) May-04 - July-05 c(y) Area Change Area Change Area Change Area Change CRISS SECTIONAL AREA CHANGE (SQ. FT)
55 Station Number Distance to Next Station Distance Average Area (ft 2 ) Volume (ft 3 ) CUT #4 10/15/1998 4/22/1999 7/00 Aug-01 Apr-02 Jun-03 May-04 Jul-05 Area (ft 2 ) Volume (ft 3 ) Area (ft 2 ) Volume (ft 3 ) Area (ft 2 ) Volume (ft 3 ) Area (ft 2 ) Volume (ft 3 ) Area (ft 2 ) Volume (ft 3 ) Area (ft 2 ) Volume (ft 3 ) Area (ft 2 ) Volume (ft 3 ) Area (ft 2 ) Volume (ft 3 ) Jul_2006 FIGURE: E-3
56
57
58
59
60
61
62
63
64
65
66
67
68
69
70
71
72
73
74
75
76
77 APPENDIX E BEACH PROFILES E-1 Aerial E-2 Reference Monument Plots (R-38 to R-41) E-3 Reference Monument Plots (R-42 to R-44) E-4 Shoreline Position Relative to DEP Monument l E-2 Shoreline Change June 05 July 06 E-2 Shoreline Change
78
CLAM PASS ANNUAL RESTORATION & MANAGEMENT PLAN TIDAL ANALYSIS ELEMENT REPORT NO. 13
 CLAM PASS ANNUAL RESTORATION & MANAGEMENT PLAN TIDAL ANALYSIS ELEMENT REPORT NO. 13 Submitted to: Pelican Bay Services Division Prepared by: Humiston & Moore Engineers H&M File No. 13-078 November 2012
EVALUATION OF BEACH EROSION UP-DRIFT OF TIDAL INLETS IN SOUTHWEST AND CENTRAL FLORIDA, USA. Mohamed A. Dabees 1 and Brett D.
 EVALUATION OF BEACH EROSION UP-DRIFT OF TIDAL INLETS IN SOUTHWEST AND CENTRAL FLORIDA, USA Mohamed A. Dabees 1 and Brett D. Moore 1 The paper discusses the analysis of up-drift beach erosion near selected
Table 4. Volumetric Change Rates Pre-Project and Post-Project for the Town of Duck
 V. VOLUMETRIC CHANGES General Volumetric changes measured over the entire monitoring area for various time periods are provided in Table 4. The volume changes are given in terms of cubic yards/foot of
Volume and Shoreline Changes along Pinellas County Beaches during Tropical Storm Debby
 Volume and Shoreline Changes along Pinellas County Beaches during Tropical Storm Debby Ping Wang and Tiffany M. Roberts Coastal Research Laboratory University of South Florida July 24, 2012 Introduction
STATUS REPORT FOR THE SUBMERGED REEF BALL TM ARTIFICIAL REEF SUBMERGED BREAKWATER BEACH STABILIZATION PROJECT FOR THE GRAND CAYMAN MARRIOTT HOTEL
 August 23 STATUS REPORT FOR THE SUBMERGED REEF BALL TM ARTIFICIAL REEF SUBMERGED BREAKWATER BEACH STABILIZATION PROJECT FOR THE GRAND CAYMAN MARRIOTT HOTEL performed by Lee E. Harris, Ph.D., P.E. Consulting
Inlet Management Study for Pass-A-Grille and Bunces Pass, Pinellas County, Florida
 Inlet Management Study for Pass-A-Grille and Bunces Pass, Pinellas County, Florida Final Report Submitted By Ping Wang, Ph.D., Jun Cheng Ph.D., Zachary Westfall, and Mathieu Vallee Coastal Research Laboratory
Performance of Upham Beach T-Groin Project and Its Impact to the Downdrift Beach
 Performance of Upham Beach T-Groin Project and Its Impact to the Downdrift Beach Progress Report for the Period of October 2008 to April 2009 Submitted by Ping Wang, Ph.D., and Tiffany M. Roberts Department
Figure 4, Photo mosaic taken on February 14 about an hour before sunset near low tide.
 The Impact on Great South Bay of the Breach at Old Inlet Charles N. Flagg and Roger Flood School of Marine and Atmospheric Sciences, Stony Brook University Since the last report was issued on January 31
UPPER BEACH REPLENISHMENT PROJECT RELATED
 ASSESSMENT OF SAND VOLUME LOSS at the TOWNSHIP of UPPER BEACH REPLENISHMENT PROJECT RELATED to the LANDFALL OF HURRICANE SANDY - PURSUANT TO NJ-DR 4086 This assessment is in response to Hurricane Sandy
Appendix E Cat Island Borrow Area Analysis
 Appendix E Cat Island Borrow Area Analysis ERDC/CHL Letter Report 1 Cat Island Borrow Area Analysis Multiple borrow area configurations were considered for Cat Island restoration. Borrow area CI1 is located
Comparison of Predicted and Measured Shoaling at Morro Bay Harbor Entrance, California
 Comparison of Predicted and Measured Shoaling at Morro Bay Harbor Entrance, California by Edward F. Thompson, Inocencio P. DiRamos, and Robert R. Bottin, Jr. PURPOSE: This Coastal and Hydraulics Engineering
CHAPTER 281 INFLUENCE OF NEARSHORE HARDBOTTOM ON REGIONAL SEDIMENT TRANSPORT
 CHAPTER 281 INFLUENCE OF NEARSHORE HARDBOTTOM ON REGIONAL SEDIMENT TRANSPORT Paul C.-P. Lin, Ph.D., P.E. 1 and R. Harvey Sasso, P.E. 2 ABSTRACT The influence of nearshore hardbottom on longshore and cross-shore
STORM RESPONSE SIMULATION
 APPENDIX V STORM RESPONSE SIMULATION Final Environmental Impact Statement Village of Bald Head Island Shoreline Protection Project Brunswick County, North Carolina Delft3D Storm Response Simulations With
Impacts of breakwaters and training walls
 Across the eastern seaboard of Australia, breakwaters and training walls have instigated fundamental perturbations to coastal and estuary processes. This has induced long-term changes to foreshore alignments,
23- Year Sand Volume Changes at Site 132, 15th Street, Brigantine
 149 Figure75. Location map for the 9 NJBPN profile sites in Atlantic County, NJ ATLANTIC COUNTY SPRING 2008 to FALL 2009 150 The Atlantic County oceanfront shoreline consists of three barrier islands.
FINAL ENVIRONMENTAL IMPACT STATEMENT ON BROWARD COUNTY SHORE PROTECTION PROJECT SEGMENTS II AND III BROWARD COUNTY, FLORIDA
 FINAL ENVIRONMENTAL IMPACT STATEMENT ON BROWARD COUNTY SHORE PROTECTION PROJECT SEGMENTS II AND III BROWARD COUNTY, FLORIDA 1. PROJECT PURPOSE AND NEED 1.1. PROJECT AUTHORITY. 1.1.1. INITIAL AUTHORIZATION.
Delaware Chapter Surfrider Foundation - Indian River Inlet Monitoring
 Delaware Chapter Surfrider Foundation - Indian River Inlet Monitoring In 2012, the Delaware Surfrider Foundation Chapter formed the Surf Quality and Access Committee to focus on issues such as surf spot
Figure79. Location map for the 10 NJBPN profile sites in Atlantic County, NJ 155
 154 Figure79. Location map for the 10 NJBPN profile sites in Atlantic County, NJ 155 ATLANTIC COUNTY SPRING 2009 to FALL 2010 The Atlantic County coastline consists of three barrier islands. Between Little
page - Laboratory Exercise #5 Shoreline Processes
 page - Laboratory Exercise #5 Shoreline Processes Section A Shoreline Processes: Overview of Waves The ocean s surface is influenced by three types of motion (waves, tides and surface currents). Shorelines
RE: Hurricane Matthew Beach Damage Assessment and Recommendations [CSE 2416]
![RE: Hurricane Matthew Beach Damage Assessment and Recommendations [CSE 2416]](/thumbs/83/87675702.jpg "RE: Hurricane Matthew Beach Damage Assessment and Recommendations [CSE 2416]") October 25, 2016 Iris Hill Town Administrator Town of Edisto Beach 2414 Murray St Edisto Beach SC 29438 RE: Hurricane Matthew Beach Damage Assessment and Recommendations [CSE 2416] Dear Iris, Hurricane
October 25, 2016 Iris Hill Town Administrator Town of Edisto Beach 2414 Murray St Edisto Beach SC 29438 RE: Hurricane Matthew Beach Damage Assessment and Recommendations [CSE 2416] Dear Iris, Hurricane
The Impact on Great South Bay of the Breach at Old Inlet Charles N. Flagg School of Marine and Atmospheric Sciences, Stony Brook University
 The Impact on Great South Bay of the Breach at Old Inlet Charles N. Flagg School of Marine and Atmospheric Sciences, Stony Brook University The previous report provided a detailed look at the conditions
Town of Duck, North Carolina
 Tracking No. 00.00.2010 Erosion Mitigation And Shoreline Management Feasibility Study Town of Duck, North Carolina Coastal Planning & Engineering of North Carolina August 15, 2012 Tom Jarrett Robert Neal
Chapter 10 Lecture Outline. The Restless Oceans
 Chapter 10 Lecture Outline The Restless Oceans Focus Question 10.1 How does the Coriolis effect influence ocean currents? The Ocean s Surface Circulation Ocean currents Masses of water that flow from one
HURRICANE SANDY LIMITED REEVALUATION REPORT UNION BEACH, NEW JERSEY DRAFT ENGINEERING APPENDIX SUB APPENDIX D SBEACH MODELING
 HURRICANE SANDY LIMITED REEVALUATION REPORT UNION BEACH, NEW JERSEY DRAFT ENGINEERING APPENDIX SUB APPENDIX D SBEACH MODELING Rev. 18 Feb 2015 1 SBEACH Modeling 1.0 Introduction Following the methodology
BYPASS HARBOURS AT LITTORAL TRANSPORT COASTS
 BYPASS HARBOURS AT LITTORAL TRANSPORT COASTS by K. Mangor 1, I. Brøker 2, R. Deigaard 3 and N. Grunnet 4 ABSTRACT Maintaining sufficient navigation depth in front of the entrance at harbours on littoral
Impact of Dredging the Lower Narrow River on Circulation and Flushing
 Impact of Dredging the Lower Narrow River on Circulation and Flushing Craig Swanson Ph.D. Swanson Environmental Alex Shaw Ocean Engineering, URI Prof. Malcolm L. Spaulding Ocean Engineering, URI 29 January
CROSS-SHORE SEDIMENT PROCESSES
 The University of the West Indies Organization of American States PROFESSIONAL DEVELOPMENT PROGRAMME: COASTAL INFRASTRUCTURE DESIGN, CONSTRUCTION AND MAINTENANCE A COURSE IN COASTAL DEFENSE SYSTEMS I CHAPTER
Lecture Outlines PowerPoint. Chapter 15 Earth Science, 12e Tarbuck/Lutgens
 Lecture Outlines PowerPoint Chapter 15 Earth Science, 12e Tarbuck/Lutgens 2009 Pearson Prentice Hall This work is protected by United States copyright laws and is provided solely for the use of instructors
Shorelines Earth - Chapter 20 Stan Hatfield Southwestern Illinois College
 Shorelines Earth - Chapter 20 Stan Hatfield Southwestern Illinois College The Shoreline A Dynamic Interface The shoreline is a dynamic interface (common boundary) among air, land, and the ocean. The shoreline
SPECIAL SPRING 2018 STORM REPORT ON THE CONDITION OF THE MUNICIPAL BEACHES FOR THE BOROUGH OF STONE HARBOR, CAPE MAY COUNTY, NEW JERSEY
 SPECIAL SPRING 2018 STORM REPORT ON THE CONDITION OF THE MUNICIPAL BEACHES FOR THE BOROUGH OF STONE HARBOR, CAPE MAY COUNTY, NEW JERSEY Aerial photograph taken April 21, 2018 showing the view up the beach
New Jersey Coastal Zone Overview. The New Jersey Beach Profile Network (NJBPN) 3 Dimensional Assessments. Quantifying Shoreline Migration
 3 Dimensional Assessments. Quantifying Shoreline Migration") New Jersey Coastal Zone Overview The New Jersey Beach Profile Network (NJBPN) Objectives Profile Locations Data Collection Analyzing NJBPN Data Examples 3 Dimensional Assessments Methodology Examples Quantifying
New Jersey Coastal Zone Overview The New Jersey Beach Profile Network (NJBPN) Objectives Profile Locations Data Collection Analyzing NJBPN Data Examples 3 Dimensional Assessments Methodology Examples Quantifying
Long Beach Island Holgate Spit Little Egg Inlet Historical Evolution Introduction Longshore Transport Map, Survey and Photo Historic Sequence
 Appendix B Long Beach Island Holgate Spit Little Egg Inlet Historical Evolution Introduction The undeveloped southern end of Long Beach Island (LBI) is referred to as the Holgate spit as it adjoins the
New Jersey Beach Profile Network Atlantic County Profile Site Locations
 215 RICHARD STOCKTON COLLEGE OF NEW JERSEY New Jersey Beach Profile Network Atlantic County Profile Site Locations COASTAL RESEARCH CENTER Figure 128 There are nine NJBPN survey sites on the Atlantic County
Nearshore Placed Mound Physical Model Experiment
 Nearshore Placed Mound Physical Model Experiment PURPOSE: This technical note describes the migration and dispersion of a nearshore mound subjected to waves in a physical model. The summary includes recommendations
Request Number IR1-12: Flow Passage. Information Request
 Request Number IR1-12: Flow Passage Information Request Provide additional information about the 100 metre flow passage channel scenario between the Westshore Terminals and the proposed Project terminal
Feasibility Study for Restoration of Titlow Lagoon Fish Passage. South Puget Sound Salmon Enhancement Group
 Feasibility Study for Restoration of Titlow Lagoon Fish Passage South Puget Sound Salmon Enhancement Group January 2010 Feasibility Study for Restoration of Titlow Lagoon Fish Passage Prepared for South
APPENDIX J HYDROLOGY AND WATER QUALITY
 APPENDIX J HYDROLOGY AND WATER QUALITY J-1 Technical Report on Airport Drainage, Northern Sector Airport and Ordinance Creek Watershed / Preliminary Creek Constructed Natural Channel Culvert J-2 Preliminary
3.3 OCEANOGRAPHY/COASTAL PROCESSES
 3.3 OCEANOGRAPHY/COASTAL PROCESSES Beaches are dynamic and conditions vary based on the onshore/offshore movement of sand both seasonally and annually. Sand also moves alongshore within a generally defined
Shoreline Response to an Offshore Wave Screen, Blairgowrie Safe Boat Harbour, Victoria, Australia
 Shoreline Response to an Offshore Wave Screen, Blairgowrie Safe Boat Harbour, Victoria, Australia T.R. Atkins and R. Mocke Maritime Group, Sinclair Knight Merz, P.O. Box H615, Perth 6001, Australia ABSTRACT
Q1. What are the primary causes/contributors to coastal erosion at Westshore and the concept of longshore / littoral drift.
 Q1. What are the primary causes/contributors to coastal erosion at Westshore and the concept of longshore / littoral drift. In order of (timing related) contribution to present problem 1. Beach is too
COUPLED MANAGEMENT STRATEGY LAKE CATHIE ESTUARY & COAST
 Lake Cathie Progress Association Inc. ABN 28 251 433 854 P.O. Box 247 Lake Cathie NSW 2445 PHONE/FAX: 02 6584 8211 EMAIL: r3packag@bigpond.com 20 th October 2009 Port Macquarie Hastings Council PO Box
MIAMI BEACH 32ND STREET HOT SPOT: NUMERICAL MODELING AND DESIGN OPTIMIZATION. Adam Shah - Coastal Engineer Harvey Sasso P.E.
 ABSTRACT MIAMI BEACH 32ND STREET HOT SPOT: NUMERICAL MODELING AND DESIGN OPTIMIZATION Adam Shah - Coastal Engineer Harvey Sasso P.E. - Principal Coastal Systems International, Inc. 464 South Dixie Highway
Reading Material. Inshore oceanography, Anikouchine and Sternberg The World Ocean, Prentice-Hall
 Reading Material Inshore oceanography, Anikouchine and Sternberg The World Ocean, Prentice-Hall BEACH PROCESSES AND COASTAL ENVIRONMENTS COASTAL FEATURES Cross section Map view Terminology for Coastal
LAB: WHERE S THE BEACH
 Name: LAB: WHERE S THE BEACH Introduction When you build a sandcastle on the beach, you don't expect it to last forever. You spread out your towel to sunbathe, but you know you can't stay in the same spot
A REVIEW OF THE CONDITION OF THE MUNICIPAL BEACHES AS A RESULT OF HURRICANE SANDY IN THE BOROUGH OF STONE HARBOR, CAPE MAY COUNTY, NEW JERSEY
 A REVIEW OF THE CONDITION OF THE MUNICIPAL BEACHES AS A RESULT OF HURRICANE SANDY IN THE BOROUGH OF STONE HARBOR, CAPE MAY COUNTY, NEW JERSEY View along the dune scarp from 103 rd Street on October 31,
Nearshore Morphodynamics. Bars and Nearshore Bathymetry. Sediment packages parallel to shore, that store beach sediment
 Nearshore Morphodynamics http://coastal.er.usgs.gov/bier/images/chandeleur-xbeach-lg.jpg Bars and Nearshore Bathymetry Sediment packages parallel to shore, that store beach sediment Can be up to 50 km
IMPACTS OF COASTAL PROTECTION STRATEGIES ON THE COASTS OF CRETE: NUMERICAL EXPERIMENTS
 IMPACTS OF COASTAL PROTECTION STRATEGIES ON THE COASTS OF CRETE: NUMERICAL EXPERIMENTS Tsanis, I.K., Saied, U.M., Valavanis V. Department of Environmental Engineering, Technical University of Crete, Chania,
CHAPTER 134 INTRODUCTION
 CHAPTER 134 NEW JETTIES FOR TUNG-KANG FISHING HARBOR, TAIWAN Chi-Fu Su Manager Engineering Department Taiwan Fisheries Consultants, Inc. Taipei, Taiwan INTRODUCTION Tung-Kang Fishing Harbor, which is about
Evaluation of Ebb-Tidal Shoals as a Sand Source for Beach Nourishment: General Methodology with Reservoir Model Analysis
 Evaluation of Ebb-Tidal hoals as a and ource for each Nourishment: General Methodology with Reservoir Model Analysis Mohamed A. Dabees 1 and Nicholas C. Kraus 2 1 Humiston& Moore Engineers, 5679 trand
2015 ANNUAL REPORT - TO THE CITY OF NORTH WILDWOOD ON THE CONDITION OF THE CITY BEACHES
 2015 ANNUAL REPORT - TO THE CITY OF NORTH WILDWOOD ON THE CONDITION OF THE CITY BEACHES Ariel view of North Wildwood looking south from the Hereford Inlet perspective on June 24, 2015. The main channel
Beach Nourishment Impact on Beach Safety and Surfing in the North Reach of Brevard County, Florida
 Beach Nourishment Impact on Beach Safety and Surfing in the North Reach of Brevard County, Florida Prepared by John Hearin, Ph.D. Coastal Engineering Vice Chairman Cocoa Beach Chapter Port Canaveral Patrick
Ninilchik Harbor Page 2 of 11
 Ninilchik Harbor Ninilchik Harbor Page 2 of 11 Condition of Improvements 31 December 2017 Ninilchik Harbor, Alaska (CWIS No. 012640, 087345) Authorization Rivers and Harbors Act, 3 July 1958 (P.L. 85-500
CHAPTER 179. Performance of a Submerged Breakwater for Shore Protection
 CHAPTER 179 Abstract Performance of a Submerged Breakwater for Shore Protection Albert E. Browder',A. Member, ASCE; Robert G. Dean 2, Member, ASCE; and Renjie Chen 3 A summary is presented of the results
ST. JOSEPH PENINSULA, GULF COUNTY, FLORIDA Beach Re-Nourishment and Environmental Enhancement Project RECOMMENDATIONS
 ST. JOSEPH PENINSULA, GULF COUNTY, FLORIDA Beach Re-Nourishment and Environmental Enhancement Project RECOMMENDATIONS January 23, 2018 543 Harbor Boulevard, Suite 204 Destin, Florida 32541 850.654.1555
BALD HEAD ISLAND, NC SAND SHARING SYSTEM OVERVIEW AND ASSESSMENT. Erik J. Olsen, P.E. olsen associates, inc.
 BALD HEAD ISLAND, NC SAND SHARING SYSTEM OVERVIEW AND ASSESSMENT Erik J. Olsen, P.E. Olsen Associates, Inc. BACKGROUND Both the Village of Bald Head Island (VBHI) and the Bald Head Island Limited, LLC.
Chapter 15 SEASONAL CHANGES IN BEACHES OP THE NORTH ATLANTIC COAST OF THE UNITED STATES
 Chapter 15 SEASONAL CHANGES IN BEACHES OP THE NORTH ATLANTIC COAST OF THE UNITED STATES By John M. Darling Hydraulic Engineer, Research Division U. S. Army Coastal Engineering Research Center Corps of
Tanya M. Beck. Kelly Legault. Research Physical Scientist Coastal & Hydraulics Lab, ERDC Vicksburg, MS
 Inlet And Adjacent Shoreline Processes at Cascading Time Scales Using the Coastal Modeling System and GenCade Tanya M. Beck Research Physical Scientist Coastal & Hydraulics Lab, ERDC Vicksburg, MS Kelly
SACO RIVER AND CAMP ELLIS BEACH SACO, MAINE SECTION 111 SHORE DAMAGE MITIGATION PROJECT APPENDIX F ECONOMIC ASSESSMENT
 SACO RIVER AND CAMP ELLIS BEACH SACO, MAINE SECTION 111 SHORE DAMAGE MITIGATION PROJECT APPENDIX F ECONOMIC ASSESSMENT Department of the Army New England District, Corps of Engineers 696 Virginia Road
Passage Key Inlet, Florida; CMS Modeling and Borrow Site Impact Analysis
 Passage Key Inlet, Florida; CMS Modeling and Borrow Site Impact Analysis by Kelly R. Legault and Sirisha Rayaprolu PURPOSE: This Coastal and Hydraulics Engineering Technical Note (CHETN) describes the
2018 Annual Beach Monitoring Report
 May 1, 218 Town of Hilton Head Island, SC 218 Annual Beach Monitoring Report Submitted to: Town of Hilton Head Island, SC November 15, 217 Prepared by: Olsen Associates, Inc. 2618 Herschel Street Jacksonville,
WATERWAYS AND HARBORS DIVISION Proceedings of the American Society of Civil Engineers. EQUILIBRIUM FLOW AREAS OF INLETS ON SANDY COASTS a
 6405 February, 1969 WWl J oumal of the WATERWAYS AND HARBORS DIVISION Proceedings of the American Society of Civil Engineers EQUILIBRIUM FLOW AREAS OF INLETS ON SANDY COASTS a By Morrough P. O'Brien,!
2014 ANNUAL REPORT - TO THE CITY OF NORTH WILDWOOD ON THE CONDITION OF THE CITY BEACHES
 2014 ANNUAL REPORT - TO THE CITY OF NORTH WILDWOOD ON THE CONDITION OF THE CITY BEACHES View on September 25, 2014 looking northwest into Hereford Inlet. Considerable southerly expansion of the tip of
Absecon Island Shore Protection The planning behind the project
 Absecon Island Shore Protection The planning behind the project Most residents of Atlantic City, Ventnor, Margate and Longport are now aware of upcoming plans to protect their common coastline with a beachfill
APPLICATION OF SHORE PROTECTION SCHEMES IN HORNB^K Mads Peder J0rgensen ' Peer Skaarup 2 Karsten Mangor 3 J0rgen Juhl 4
 APPLICATION OF SHORE PROTECTION SCHEMES IN HORNB^K Mads Peder J0rgensen ' Peer Skaarup 2 Karsten Mangor 3 J0rgen Juhl 4 ABSTRACT Hornbask Harbour was built more than a hundred years ago on a sandy coast
DUNE STABILIZATION AND BEACH EROSION
 DUNE STABILIZATION AND BEACH EROSION CAPE HATTERAS NATIONAL SEASHORE NORTH CAROLINA ROBERT DOLAN PAUL GODFREY U. S. DEPARTMENT OF INTERIOR NATIONAL PARK SERVICE OFFICE OF NATURAL SCIENCE WASHINGTON, D.
Figure 262. Location map for the 10 NJBPN profile sites in Atlantic County, NJ 279
 278 Figure 262. Location map for the 10 NJBPN profile sites in Atlantic County, NJ 279 ATLANTIC COUNTY SUMMARY The Atlantic County coastline consists of three barrier islands. The island of Little Beach
Severe Beach Erosion Caused by Permanent Beach Sand Loss Through Rollover Fish Pass Bolivar Peninsula, Texas
 DRAFT DRAFT DRAFT DRAFT DRAFT DRAFT DRAFT DRAFT Severe Beach Erosion Caused by Permanent Beach Sand Loss Through Rollover Fish Pass Bolivar Peninsula, Texas September, 1999 For J. Martin Green and Alan
Beach profile surveys and morphological change, Otago Harbour entrance to Karitane May 2014 to June 2015
 Beach profile surveys and morphological change, Otago Harbour entrance to Karitane May 2014 to June 2015 Prepared for Port Otago Ltd Martin Single September 2015 Shore Processes and Management Ltd Contact
The Continuing Evolution of the New Inlet
 The Continuing Evolution of the New Inlet Charles N. Flagg, Roger Flood and Robert Wilson School of Marine and Atmospheric Sciences, Stony Brook University It is now a year plus since super storm Sandy
MIDNIGHT PASS POSITION PAPER
 Th. Midnight Pass - SOCIETY, INC. "MIDNIGHT PASS - PASS IT ON!" POST OFFICE BOX 88666 ROBERT D. MBAWR, PRESmEh7 (818) 84~1885 SARASOTA, FLORIDA 54881 JAMES P. BERBERT. EXECUTIVE DIRECTUR (818) 9S88817
ATLANTIC COUNTY 2006 to 2008
 ATLANTIC COUNTY 2006 to 2008 The Atlantic County oceanfront shoreline consists of three barrier islands where the northern one, Little Beach Island and a third of the second, Brigantine Island, are undeveloped
Nome Harbor Page 2 of 12
 Nome Harbor Nome Harbor Page 2 of 12 Condition of Improvements 30 December 2015 Nome Harbor, Alaska (CWIS No. 010422, 012270, 072742, 087755) Authorization (1) Rivers and Harbors Act, 8 August 1917 (House
Beach Restoration in Okaloosa and Walton Counties. FSBPA Technology Conference Clearwater, FL
 Beach Restoration in Okaloosa and Walton Counties FSBPA Technology Conference Clearwater, FL Presented by: Duncan Greer, E.I. February 5, 2015 PRESENTATION OUTLINE 1. Overview of Project Locations 2. Eglin
To: William Woods, Jenni Austin Job No: CentrePort Harbour Deepening Project - Comments on community queries
 Memo To: William Woods, Jenni Austin From: Richard Reinen-Hamill Date: Subject: cc: 1 Purpose This memo sets out our response to issues raised at and after Seatoun community consultation sessions held
Natural Mechanisms of Sediment Bypassing at Tidal Inlets
 Natural Mechanisms of Sediment Bypassing at Tidal Inlets by D. M. FitzGerald, N. C. Kraus, and E. B. Hands PURPOSE: The Coastal and Hydraulics Engineering Technical Note (CHETN) described herein describes
Chapter 11 Tides. A tidal bore is formed when a tide arrives to an enclosed river mouth. This is a forced wave that breaks.
 Chapter 11 Tides A tidal bore is formed when a tide arrives to an enclosed river mouth. This is a forced wave that breaks. Tidal range can be very large Tide - rhythmic oscillation of the ocean surface
Regular Workshop October 20, 2014 Agenda Item: Dr. Albert E. Browder, PE; Olsen Associates, Inc.
 Regular Workshop October 20, 2014 Agenda Item 8 Agenda Item: Presenter: Summary: Beach Update Town Manager; Dr. Albert E. Browder, PE; Olsen Associates, Inc. At the January 21, 2014 Regular Workshop Meeting,
Jimmy s beach preliminary results
 Jimmy s beach preliminary results LP 668979 Jimmy s Beach Restoration Society 1 Outline 1. Long term: GIS analyses. Aerial photos, charts Shoreline analyses Storm data from MHL/DECC 2. Medium term: morphologic
Figure 106. Locations of the 28 NJBPN profile stations in Ocean County, NJ.
 130 Figure 106. Locations of the 28 NJBPN profile stations in Ocean County, NJ. 131 2016-2017 Beach Fills in Ocean County: The federal/state/local storm damage reduction project (beachfill) between Manasquan
MOREHEAD CITY HARBOR, NC. Dredged Material Management Plan (DMMP)
") MOREHEAD CITY HARBOR, NC Dredged Material Management Plan (DMMP) Public Meeting/Info Session 15 January 2014 US Army Corps of Engineers Morehead City Harbor DMMP Presentation Topics Morehead City Harbor
MOREHEAD CITY HARBOR, NC Dredged Material Management Plan (DMMP) Public Meeting/Info Session 15 January 2014 US Army Corps of Engineers Morehead City Harbor DMMP Presentation Topics Morehead City Harbor
USE OF SEGMENTED OFFSHORE BREAKWATERS FOR BEACH EROSION CONTROL
 .. CETN-III-22 4/84 PURPOSE: USE OF SEGMENTED OFFSHORE BREAKWATERS FOR BEACH EROSION CONTROL To provide information on the functional application of and general design considerations for using offshore
New Jersey Beach Profile Network Ocean County Profile Site Locations
 125 RICHARD STOCKTON COLLEGE OF NEW JERSEY COASTAL RESEARCH CENTER New Jersey Beach Profile Network Ocean County Profile Site Locations Figure 73 156 155 154 153 152 151 15 149 The Ocean County shoreline
Sandy Beach Morphodynamics. Relationship between sediment size and beach slope
 Sandy Beach Morphodynamics Relationship between sediment size and beach slope 1 Longshore Sorting - Willard Bascom Beach Slope, Grain Size, and Wave Energy Beach at Sandwich Bay, Kent, UK near the Straights
SHORE PROTECTION AND HABITAT CREATION AT SHAMROCK ISLAND, TEXAS ABSTRACT
 SHORE PROTECTION AND HABITAT CREATION AT SHAMROCK ISLAND, TEXAS M. Cameron Perry, P.E., and Daniel J. Heilman, P.E. Coastal Engineer Shiner Moseley & Associates., Inc. 555 N. Carancahua Corpus Christi,
Assateague Island National Seashore North End Restoration Project Timeline
 Assateague Island National Seashore North End Restoration Project Timeline Date Event Some information provided in the Project Introduction document. Detailed events are available in a timeline compiled
COASTAL ENVIRONMENTS. 454 lecture 12
 COASTAL ENVIRONMENTS Repeated movement of sediment & water constructs a beach profile reflecting the balance between average daily or seasonal wave forces and resistance of landmass to wave action Coasts
GENERAL METHODOLOGY FOR INLET RESERVOIR MODEL ANALYSIS OF SAND MANAGEMENT NEAR TIDAL INLETS. Mohamed A. Dabees 1, Nicholas C.
 GENERAL METHODOLOGY FOR INLET RESERVOIR MODEL ANALYSIS OF SAND MANAGEMENT NEAR TIDAL INLETS Mohamed A. Dabees 1, Nicholas C. Kraus 2 1 Humiston& Moore Engineers, 5679 Strand Court, Naples, FL 34109, USA.
CHAPTER 86 PERFORMANCE OF A JETTY-WEIR INLET IMPROVEMENT PLAN. J. A. Purpura 1, B. C. Beechley 2. C. W. Baskette, Jr. 3, J. C. Roberge 1 * ABSTRACT
 CHAPTER 86 PERFORMANCE OF A JETTY-WEIR INLET IMPROVEMENT PLAN by J. A. Purpura 1, B. C. Beechley 2 C. W. Baskette, Jr. 3, J. C. Roberge 1 * ABSTRACT Comprehensive monitoring has been carried out since
Chapter 6: Santander case
 6 Santander case 6.1 Introduction Port activity in Santander dates back more than 2,000 years ago. Throughout this period, the sea and the port have been the fundamental elements of a community which,
TRANSPORT OF NEARSHORE DREDGE MATERIAL BERMS
 Proceedings of the 6 th International Conference on the Application of Physical Modelling in Coastal and Port Engineering and Science (Coastlab16) Ottawa, Canada, May 10-13, 2016 Copyright : Creative Commons
NC TERMINAL GROIN STUDY FINAL REPORT
 II. Physical Assessment This section addresses the geological framework, physical processes, and human-induced changes that influence erosional-depositional sedimentation patterns at tidal inlets and along
Effectiveness of Beach Nourishment in Response to Sea Level Rise
 2014 FSBPA Annual Conference Effectiveness of Beach Nourishment in Response to Sea Level Rise Navarre Beach Santa Rosa County July 18, 2005 Lovers Key Lee County April 23, 2012 South County St. Lucie County
APPENDIX C. Fluvial and Tidal Hydraulics Report
 APPENDIX C Fluvial and Tidal Hydraulics Report BUENA VISTA LAGOON ENHANCEMENT PROJECT FLUVIAL AND TIDAL HYDRAULICS ANALYSES Prepared for: SANDAG 401 B Street, Suite 800 San Diego, California 92101 Contact:
BEACH PROCESSES AND COASTAL ENVIRONMENTS
 BEACH PROCESSES AND COASTAL ENVIRONMENTS COASTAL FEATURES Cross section Map view TOPICS: Terminology Waves Beach Morphology Barriers Coastal Migration Tides Tidal Flats and Marshes Sediment Budgets Human
CALCASIEU SALINITY STRUCTURES. HYDRODYNAMIC MODELING (To Support Design of Salinity Barriers)
") CALCASIEU SALINITY STRUCTURES HYDRODYNAMIC MODELING (To Support Design of Salinity Barriers) Presentation Overview 1 2 3 4 5 Project Overview and CEA Circulation Modeling Vessel Hydrodynamics Modeling
CALCASIEU SALINITY STRUCTURES HYDRODYNAMIC MODELING (To Support Design of Salinity Barriers) Presentation Overview 1 2 3 4 5 Project Overview and CEA Circulation Modeling Vessel Hydrodynamics Modeling
SELECTION OF THE PREFERRED MANAGEMENT OPTION FOR STOCKTON BEACH APPLICATION OF 2D COASTAL PROCESSES MODELLING
 SELECTION OF THE PREFERRED MANAGEMENT OPTION FOR STOCKTON BEACH APPLICATION OF 2D COASTAL PROCESSES MODELLING C Allery 1 1 DHI Water and Environment, Sydney, NSW Abstract This paper presents an approach
FINAL REPORT FOR 2013 ON THE CONDITION OF THE MUNICIPAL OCEANFRONT BEACHES THE BOROUGH OF AVALON, CAPE MAY COUNTY, NEW JERSEY
 FINAL REPORT FOR 2013 ON THE CONDITION OF THE MUNICIPAL OCEANFRONT BEACHES THE BOROUGH OF AVALON, CAPE MAY COUNTY, NEW JERSEY View from 12 th Street to the south taken February 28, 2013, following completion
Southern California Beach Processes Study
 Southern California Beach Processes Study Torrey Pines Field Site 5th Quarterly Report 31 May 22 to California Resources Agency and California Department of Boating and Waterways R.T. Guza 1, W.C. O Reilly
HARBOUR SEDIMENTATION - COMPARISON WITH MODEL
 HARBOUR SEDIMENTATION - COMPARISON WITH MODEL ABSTRACT A mobile-bed model study of Pointe Sapin Harbour, in the Gulf of St. Lawrence, resulted in construction of a detached breakwater and sand trap to
Proceedings, 2001National Conference on Beach Preservation Technology, pp COASTAL INLET BANK EROSION. William C.
 Proceedings, 2001National Conference on Beach Preservation Technology, pp. 274-283 COASTAL INLET BANK EROSION William C. Seabergh 1 Abstract: Much focus is placed on beach erosion on the open coast. However,