The Islands. Barbados. A prefeasibility study. R. Drieman M. Hinborch M. Monden E.A.J. Vendrik
|
|
|
- Ruth Haynes
- 5 years ago
- Views:
Transcription


1 The Islands Barbados A prefeasibility study R. Drieman M. Hinborch M. Monden E.A.J. Vendrik
2 General notice to the reader: In the academic programme for Hydraulic Engineering we have in the 4th year (i.e. in the first year of the Master Programme) the requirement that students should do in a group of four to six persons a so-called "groupwork". It is also called "Master Project". During this groupwork they should make a full design of something. The work should be integral, starting with terms of reference, and ending with the real design. This can be a structure, but also it can be a harbour lay-out, a policy plan design, etc. The total time available for the project is in the order of two months and will provide 10 European Credits. It has to be practical and applied. It is certainly not an M.Sc. thesis assignment (the thesis work is individual, 6 months and more focussed on research or advanced design work on details). But it is also not an apprenticeship, internship or traineeship where the student has to work together with a group of experienced people. For this groupwork they have to solve the problem on their own (of course with guidance). This report is the result of such a Master Project. This report has been assessed by staff of TU Delft. It has been provided with a passing mark (i.e. a mark between 6 and 10 on a scale of 10), and consequently considered sufficient for publication. However, this work has not been fully corrected by TU Delft staff and therefore should be considered as a product made in the framework of education, and not as a consultancy report made by TU Delft. The opinions presented in this report are neither the opinions of TU Delft, neither of the other sponsoring organisations. Department of Hydraulic Engineering Delft University of Technology


3 The Islands Barbados A prefeasibility study R. Drieman M. Hinborch M. Monden E.A.J. Vendrik Committee Chairman: Prof.dr.ir. M.J.F. Stive Other members: Dr.ir. R.J. Verhaeghe Ir. H.J. Verhagen Sponsors III
4
5 Preface This report is the result of a three month study period for the course Multidisciplinary Master Project given at the Faculty of Civil Engineering and Geosciences at Delft University of Technology. In this course a group of students executes a study project abroad. In our case the project was executed in Jamaica at the coastal engineering company Smith Warner International Ltd. (SWIL). We would like to thank the people at Smith Warner for making this project possible. Further, we would like to thank our committee, Prof.dr.ir M.J.F. Stive, Dr.ir. R.J. Verhaeghe and Ir. H.J. Verhagen, for their assistance during the project. Kingston, June 2009 R. Drieman M. Hinborch M. Monden E.A.J. Vendrik V
6
7 Table of contents Preface... V List of figures...ix List of tables... X Abstract...XI 1... Introduction Project description Site description Scope of work Determining wave boundary conditions Model inputs Mesh and boundaries Calibration Long term model Results Detailed wave models Model input Mesh and boundaries Results Stability analysis Model input Mesh and boundaries Swell results Hurricane results Design storm Long term beach stability Beach profile analysis Model input Results existing situation Results new situation with The Islands Cost analysis Compute the amount of material Cost estimation Conclusions and recommendations References VII
8
9 List of figures Figure 1.1: Location of The Islands [6] [7]...1 Figure 1.2: Cross section of the concept of a ring of breakwaters with the islands in their lee [2]...2 Figure 1.3: Cross section of the concept with submerged breakwaters [2]...3 Figure 1.4: Preliminary masterplan of The Islands showing the primary coastal components [8]...4 Figure 1.5: Project location [7]...5 Figure 1.6: Pictures of the project site. Clockwise from upper left: Flour Mill, Brandon s Beach, view on the coast at the project site, Brighton Beach at the Hot Pot [7]...6 Figure 1.7: Coral at the project site...6 Figure 1.8: Bathymetry for the project location with depth below mean sea level in meters [10]...7 Figure 1.9: Overview of the used MIKE 21 models...8 Figure 2.1: Mesh and boundaries for the large scale wave models...9 Figure 2.2: Location of the offshore wave buoy, indicated with a red dot...10 Figure 2.3: Calibration plots for wave height, period and direction...11 Figure 2.4: Scaled and unscaled model wave heights and measured wave height for the total measurement period...13 Figure 2.5: Unscaled maximum wave heights for the 3 year model period...14 Figure 2.6: Scaled results of the 3 yr wave model at the location of the wave buoy...15 Figure 3.1: Mesh for the detailed wave models with a detail of the project location..18 Figure 3.2: Maximum wave heights in the existing and new situation for the detailed wave model...18 Figure 3.3: Locations of output nodes and line outputs in the detailed wave models. The point Off stands for offshore wave buoy. This is the same buoy that has been used to calibrate the model. On stands for onshore wave buoy and ADCP stands for Acoustic Doppler Current Profiler. [8]...19 Figure 3.4: Wave height for a line over the breakwater, the location of which is indicated schematically...20 Figure 4.1: Initial layer thickness. Purple is no initial layer thickness and red up to 1.4 m sediment...21 Figure 4.2: Tracks of significant hurricanes in relation to the project location...22 Figure 4.3: Detail of the mesh for the coupled models...23 Figure 4.4: Maximum wave heights during the simulated swell period...24 Figure 4.5: Significant wave heights and wave directions near the peak of the swell period Figure 4.6: Current speed and direction near the peak of the swell period Figure 4.7: Detail of currents near Runaway Beach...27 Figure 4.8: Detail of currents near Half Moon Beach Figure 4.9: Bed level change at the end of the swell period simulation Figure 4.10: Detail of bed level change at the end of the swell period simulation at New Coconut Beach. Unit: [m] Figure 4.11: Detail of bed level change at the end of the swell period simulation at Runaway Beach. Unit: [m] IX
10 Figure 4.12: Detail of bed level change at the end of the swell period simulation at the southern end of Runaway Beach and the navigation channel. Unit: [m]...30 Figure 4.13: Detail of bed level change at the end of the swell period simulation near Half Moon Beach. Unit: [m]...30 Figure 4.14: Maximum wave heights during a hurricane...32 Figure 4.15: Significant wave height and wave direction for a time step in the beginning of the hurricane...33 Figure 4.16: Significant wave height and wave direction for a time step at the end of the hurricane...34 Figure 4.17: Significant wave heights and wave directions at the tip of the southern island...35 Figure 4.18: Maximum surface elevation during a hurricane...36 Figure 4.19: Current speed and direction for a time step half way the duration of the hurricane...37 Figure 4.20: Current speed and direction for a time step at the end of the hurricane..38 Figure 4.21: Detail of the currents in the channel between Runaway Island and the southern island and at the tip of the southern island...39 Figure 4.22: Bed level change after a hurricane...40 Figure 4.23: Detail of the bed level change after a hurricane for Half Moon Beach and New Coconut Beach...41 Figure 4.24: Location of the revetment at the southern island...41 Figure 5.1: Locations of profile measurements [7]...43 Figure 5.2: Beach width Paradise South...45 Figure 5.3: Beach width BL&P North...45 Figure 5.4: Beach width Brandons...46 Figure 5.5 Summary of LITDRIFT results for the existing situation. In the figure the accumulated transport in the simulation period are displayed. The unit of the numbers is m Figure 5.6: Summary of LITDRIFT results for the situation with The Islands in place. In the figure the accumulated transport in the simulation period are displayed. The unit of the numbers is m Figure 5.7: Location of proposed sea wall...52 Figure 5.8: Proposed changes to reduce erosion at Runaway Beach...53 Figure 7.1: Locations of the design modifications for improving the design of The Islands [8]...57 List of tables Table 4.1: 1/150 year hurricane design parameters...42 Table 5.1: Sediment parameters...47 Table 5.2: Summarized values of accumulated transport in existing and new situation...51 Table 6.1: Cost estimate of The Islands...56 X
11 Abstract In Barbados the problem arose of lack of space for development on the existing shoreline. Therefore the project The Islands has been conceptualized. In front of the west coast of Barbados, a group of artificial islands will be created. On the islands there will be space for luxurious villas and hotels. The location of the islands is in the west of Barbados in front of the coast of Brighton Beach and Brandon s Beach north of the Barbados Port. For the project The Islands already some initial work has been performed on basis of which an architect made a design for The Islands. The design consists of a group of islands and some beach extensions. The purpose of this study was to determine the feasibility of the different coastal components of the masterplan and to identify potential impacts of the proposed plan on the coastal environment. For the different parts of the islands the stability in different wave and current conditions has been researched. The main tool for this research was the engineering software package MIKE 21, developed by DHI. With this program calculations have been made to determine the wave climate at the project location and to determine the stability of several components in the design. With wave-energy spectra from a database based on numerical hindcasting, the long term wave climate around Barbados has been determined. With this a more detailed model for the project location with and without the islands has been run to get detailed wave data. After this a stability analysis has been executed to determine the short term stability of the beaches and other components during a swell and a hurricane event. Also a long term beach stability analysis has been executed with LITDRIFT. With the results of the models some conclusions have been drawn and some design modifications have been suggested, such as a revetment, some groynes and maintenance dredging. XI
12


13 1 Introduction 1.1 Project description In the past numerous land reclamation projects have been executed all over the world to create new land and lengthen shorelines. But the Palm Islands in Dubai took it to a new scale for tourism development and added the complexity of the land being detached from the mainland. Also in Barbados the problem arose of lack of space for development on the existing shoreline and therefore the project The Islands has been conceptualized. In front of the coast of Barbados, a group of artificial islands will be created. On the islands there will be space for luxurious villas and hotels. The location of the islands is in the west of Barbados in front of the coast of Brighton Beach and Brandon s Beach north of the Barbados Port. The project location can be seen in Figure 1.1. Figure 1.1: Location of The Islands [6] [7] 1
14 This location was chosen because of the relatively wide shallow area in front of the coast at this part of Barbados. Most other parts of the shore only have a narrow shelf, which would make construction of the islands more difficult because of deep water. Another big advantage of the chosen location is that it is sheltered from large waves. Barbados is mainly attacked by waves from the east, from the Atlantic Ocean. This means the west side of the island is not directly attacked by large ocean waves. Also the location just north of the port has the advantage of being just at the end of two littoral cells. Therefore the area is sheltered from large waves and currents and the construction of the islands should not significantly affect beaches north and south of the project site. For the project The Islands already some initial work has been performed. In the preceding research two different island concepts were considered. The idea of the first concept is an outer ring of breakwaters with The Islands in their lee (similar to the approach of the palm islands in Dubai). A cross section of this concept is shown in Figure 1.2. Figure 1.2: Cross section of the concept of a ring of breakwaters with the islands in their lee [2] 2
15 The second concept is a series of wider islands with mild slopes protected by submerged breakwaters. A cross section of this concept is shown in Figure 1.3. Figure 1.3: Cross section of the concept with submerged breakwaters [2] Based on the preceding research there was a preference for the second concept. For this concept an architect made a design for the islands based on some given site extents (see Appendix A). The design is shown in Figure 1.4. Part of the project is an extension of the current beaches. This design is the starting point of further research to determine the critical spots in this design of The Islands. 3
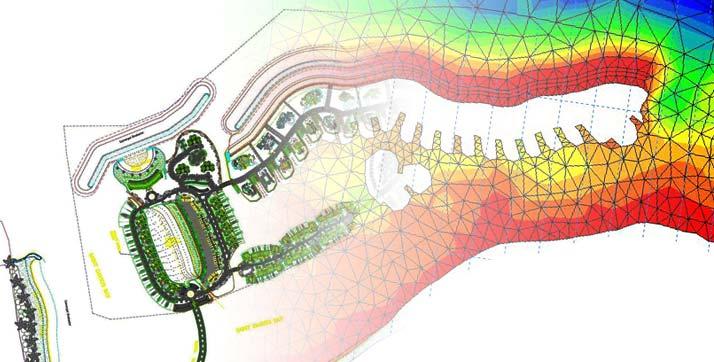
16 4 2 Legend 1. New Coconut Beach 2. Local extension of Brighton Beach 3. Half Moon Beach 4. Runaway Beach 5. Lagoon swimming pool 6. Town houses around the lagoon 7. Southern small island 8. Northern small island 8 Saint David s Bay Saint David s Bay 1 Figure 1.4: Preliminary masterplan of The Islands showing the primary coastal components [8] The design of The Islands consists of a group of islands in the total available area of 94 hectares. The Islands are approximately 1500 m long and 500 m wide. The main part of the design is a long island with a beach at the seaside, protected by submerged reef breakwaters. In this way a sheltered area is created between the island and the existing coast, which is called Saint David s Bay. At the bay side of the island mooring facilities for boats are situated. Apart from this long island there are several smaller islands that are connected via bridges. The island in the south has a shallow lagoon in the middle, connected to the sea and the bay by two small channels. The total design can be divided in eight different parts (see Figure 1.4): 4

17 1. New Coconut Beach: a new stretch of beach in the south at Flour Mill. This beach will be protected by a groyne at the west end of the beach. 2. Local extension of Brighton Beach. To block the view on the industry along this stretch of beach, a strip of trees is made. By doing this the existing beach gets smaller and a beach extension is needed. 3. Half Moon Beach on the seaside of the southern island: this is a small circular beach. Part of the design is a reef breakwater, which will protect the beach. At the beach a hotel will be build. 4. Runaway Beach: this is the entire stretch of beach along the main island. This beach will also be protected by a reef breakwater and by groynes at the tips of the beach. Along the beach and on the bay side of the island houses will be build. At the bay side there will also be mooring places for boats. 5. The lagoon at the southern island: this is a shallow swimming area with a beach, connected to the sea by narrow channels at both sides of the lagoon. 6. Town houses around the lagoon: some smaller houses will be build around the lagoon. A bridge to the southern island will be the main connection to the shore. 7. The southern small island in the bay: a smaller island with houses connected to the island with the lagoon by a bridge. 8. The northern small island in the bay: a small island in the bay with a few houses. 1.2 Site description As can be seen in figure 1.1 the project location for The Islands is located off the coast of Brighton Beach and Brandon s Beach on the west coast of Barbados. It extends from somewhat north of the Hot Pot (warm water outlet of a power plant) in the north to the Flour Mill (just north of Barbados Port) in the south and is approximately a half to one kilometre wide (see Figure 1.5). At this location the island shelf of Barbados is relatively wide, which makes it a good location for the construction of artificial islands. Figure 1.6 gives an impression of the project site. Figure 1.5: Project location [7] 5

![[7] A detailed bathymetry at the project location is available from Lidar and chart data [10] (see Figure 1.8).](/docs-images/93/112888356/images/18-1.jpg "The project location is relatively shallow with maximum depths of up to 10 m.")
18 Figure 1.6: Pictures of the project site. Clockwise from upper left: Flour Mill, Brandon s Beach, view on the coast at the project site, Brighton Beach at the Hot Pot [7] A detailed bathymetry at the project location is available from Lidar and chart data [10] (see Figure 1.8). The project location is relatively shallow with maximum depths of up to 10 m. Because of coral reefs the seabed is quite irregular and there are quite some shallow spots (see Figure 1.7). Figure 1.7: Coral at the project site 6

19 Figure 1.8: Bathymetry for the project location with depth below mean sea level in meters [10] In 2008 a benthic survey [2] was executed, in which the ecological state of the seabed at the project site has been researched. On the project site is a highly stressed coral community, which has natural and anthropogenic causes. In some areas there is 5-10% living coral. The reef acts as fishing ground for local fisherman. Relocation of existing live coral will almost certainly be required. A more detailed description of the benthic survey can be found in Appendix A. 1.3 Scope of work The project The Islands is still in its feasibility stage. The purpose of this study was to determine the feasibility of the different coastal components of the masterplan and to identify potential impacts of the proposed plan on the coastal environment. For the different parts of the islands as given in paragraph 1.1 the stability in different wave and current conditions has been researched. The main tool for these calculations was the engineering software package MIKE 21 of DHI. This program is used for among other things the simulation of waves, currents and sediment transport. In Figure 1.9 an 7
20 overview is given of the different models that were used for optimizing the first design of the islands. Figure 1.9: Overview of the used MIKE 21 models First the long term wave climate around Barbados was determined with the MIKE 21 spectral wave module. This wave climate was calibrated with measurements from a wave buoy near the project location. The output of the large scale wave model was used for determining the wave climate at the project location on a more detailed scale. This was done for the existing situation and the new situation with the islands. The output of the large scale wave model also served as input for several MIKE 21 coupled models. In the coupled models simulations of events were made for waves, hydrodynamics and sediment transport in one. This was done for a swell period and for hurricanes. The output of the small scale wave models was used to determine the long shore transport for the existing beaches and the new beaches of The Islands with LITDRIFT. Apart from the hurricane modelling with the coupled models, a wave model was used to determine extreme wave conditions for a hurricane. The results of the models were analysed to determine the parts of The Islands that needed further attention because of instabilities. These instabilities can consist of too high wave heights, too much sediment transport or too large currents. The design can be optimised by designing breakwaters, groynes and scour protection and if there are no other options, adapting the shape or layout of The Islands. Eventually this led to some recommendations for making a more detailed design of The Islands. 8

21 2 Determining wave boundary conditions The most important input for the simulations is the wave climate. Before running the small scale models of the project location, the wave boundary conditions had to be determined. The deep water wave conditions on the ocean had to be transformed to wave conditions near the shore. This was done with MIKE 21 spectral waves. 2.1 Model inputs In order to run the MIKE 21 model input data is needed. The external input data consists of the bathymetry with depth information and data for waves and winds. The wave input consists of wave-energy spectra from the AES database [9] for a location about 200 km north of Barbados. The benefit of using the spectra, rather than wave parameters, is the more detailed information. In the spectra the distribution of the wave energy over the frequencies and directions is available. In the AES database data for the period January 1992 to June 2003 are available with a time step of 6 hours. The database also contains information about wind speed and direction. The AES wave data is based on numerical hindcasting of waves in the Northern Atlantic Ocean. The data are produced by the Meteorological Service of Canada and Oceanweather Inc. In Appendix B.1 the method of adapting the AES wave data to the correct MIKE 21 input is described. 2.2 Mesh and boundaries To calculate how the wave climate changes when it travels a mesh needs to be created. The mesh consists of a number of triangular elements, in each of which MIKE 21 calculates the wave conditions. Because these wave conditions change with the water depth, the mesh has to be combined with the bathymetry of the area. In Figure 2.1 the computational mesh and boundaries for the large scale wave models is given. Figure 2.1: Mesh and boundaries for the large scale wave models 9

22 It consists of around 2200 elements, what gives an acceptable computation time while there is still enough detail at important locations. The mesh covers a sufficiently large area around Barbados to allow waves from everywhere to propagate towards the project location in the southwest of the island. As can be seen from the colours in Figure 2.1 (representing the bathymetry) Barbados has a really narrow shelf, outside of which the depths are very large. On the deep open sea little changes in wave properties will occur. Therefore large elements in the mesh are sufficient to get quite accurate results. Near the shore, transformation of wave properties will occur due to shoaling, refraction and wave breaking. To get accurate model results, smaller elements in the mesh are needed. Waves at the east coast of Barbados will not reach the project location, so on that side the elements can be somewhat bigger. At the project location the mesh has the smallest elements, because detailed information about the wave properties is needed here. The boundary of the mesh is divided in a northeast and a southwest boundary. The wave direction in the AES data is mainly between north and east. Therefore the waveenergy spectra are put on the northeast boundary. The southwest boundary is taken as a closed boundary in the computation, this means all waves are absorbed by the boundary and no waves propagate from this boundary into the mesh. This closed boundary is needed to keep the computation stable. 2.3 Calibration First the wave model was calibrated by running it over a short time period. The output of the model was compared to the measured wave data from a wave buoy near the project location. The location of this buoy is indicated in Figure 2.2. Figure 2.2: Location of the offshore wave buoy, indicated with a red dot For the calibration AES data of the period 15/02/2002 to 28/02/2002 were used. This period covers a distinct period of swell in the measured wave data. The calibration model was optimized by changing different parameters in the MIKE 21 Spectral Wave model. The calibration model results for significant wave height, peak wave period and mean wave direction are given in Figure
23 Figure 2.3: Calibration plots for wave height, period and direction The shape of the plot of the model wave height is quite similar to the measured values. The swell peak is clearly visible in the model although the values are consistently lower. The high values in the last days are probably caused by a shift in the input wave direction from the AES spectra. During the calibration period the input wave direction is mainly northeast, but in the last days it becomes north to northwest. This causes a more direct approach of waves to the project location in the model and therefore (too) high waves. The model wave period matches the measured period quite good. Although it only gives the higher values, the shape of the model is similar to the measured periods. The mean wave direction in the model is almost constant, whereas it is very scattered in the measurements. Probably this is the result of inaccurate measurements; the measurements show waves coming from the east, which would mean waves are coming from the coast. Therefore the wave direction is not taken into account in the calibration. 11
24 Several parameters were changed one by one for calibration of the model to increase the wave heights, but without good results: - Including diffraction to cause waves to bend more around the tips of Barbados: Hardly any changes were visible in the model results. This is probably because diffraction only has influence on small scale models. - Changing the bottom friction: less bottom friction causes less dissipation of wave energy in shallow water. No changes were visible in the model results. Probably this is because the island shelf of Barbados is quite narrow and still deep in comparison to the wave height. Therefore the influence of bottom friction on the waves is minimal. The most important parameters of the model are given in Appendix B.2 with their final values. Since changing model parameters did not work to get better model results for the wave height another calibration method was chosen. With the root-mean-square method an average factor is determined by which all wave heights from the model are multiplied. The multiplied wave heights should give a reasonable fit to the measured wave heights. To determine this multiplication factor the model was run over the entire period for which measurements were available. This is the period 10/02/2002 to 28/04/2003. Also for this longer period the model gives overall lower values for the wave height than the measurements. Therefore using a scaling factor is a good method to fit the model output to the measured values, because it scales up all values. The scaling factor calculated from the model results and the measured data is The scaled significant wave height for the entire period for which measurements are available is given in figure 3.2. It can be seen that the scaled wave heights fit the measurements quite well. The wave period is not scaled, because it already fits to the measurements reasonably. This is maybe not entirely correct because the wave height and period are related to each other. But because the results of this scaling are quite good, this error is accepted. 12
25 Figure 2.4: Scaled and unscaled model wave heights and measured wave height for the total measurement period 13

26 2.4 Long term model The calibrated model of the whole of Barbados was used to calculate the wave climate for a longer period. A three year period was taken from 4/28/2000 until 4/28/2003. This period also covers the period for which measurements are available. From this model, output was generated in the form of wave-energy spectra along the boundaries of the small scale model. This output was used as wave input on the boundaries of the small scale model of the project location. The spectra were therefore first scaled with the calibration factor. Because the calibration factor was determined for wave heights, it had to be squared before applied on the spectra. 2.5 Results Figure 2.5 shows the maximum occurring wave height at each location in the 3 year period. The largest wave heights occur at the northeast boundary, this is where the waves enter the domain. Towards Barbados the waves get less high. The west of Barbados is sheltered from large waves. This means that the wave heights at the project location are not so high anymore. Figure 2.5: Unscaled maximum wave heights for the 3 year model period The plotted results for the wave height for the 3 year period in Figure 2.6 show two seasons in the wave climate. During summer there is a low and quite constant wave height of less than half a meter, except for an occasional summer storm. In winter the overall wave height is somewhat higher and several storm and swell peaks can be seen with wave heights of up to almost 1.5 m. 14
27 Figure 2.6: Scaled results of the 3 yr wave model at the location of the wave buoy 15
28 16
29 3 Detailed wave models With the results of the long term wave model for the wave climate around Barbados, more detailed results could be calculated with a small scale wave model. This was done for the existing situation and the new situation with the islands. In this way a comparison can be made from which the influence of the islands on the wave climate can be determined. 3.1 Model input The wave input for the detailed wave models consists of the wave-energy spectra generated in the large wave model. These spectra are first scaled with the squared calibration factor. A test run of the model showed that the small scale model with the scaled spectra on the boundaries gave almost exactly the same results as the large scale model for the location of the wave boy. The bathymetry with depth information also serves as input for the models. In the model for the existing situation this is the original bathymetry. For the new situation this bathymetry is adapted with the design of The Islands. Because of the small scale of the models, no wind input is used. 3.2 Mesh and boundaries In Figure 3.1 the mesh for the detailed wave models for the new situation with The Islands is given. To make sure that the running of the model wouldn t take too long roughly the same number of elements was used as in the mesh for the whole of Barbados. The mesh for the existing situation is basically the same, but without The Islands in it. The boundaries of the mesh are chosen far away enough from the project location to include all features in the bathymetry that can influence the waves at the islands. At the boundaries the element size is quite large, but close to the islands and the shore the element size is small to get accurate and detailed results from the model. To prevent problems with stability the transition between the large and small elements is made gradually. To further reduce the computation time the different islands were made into one big shape, since the waves between the islands aren t of interest for this model. 17


30 Figure 3.1: Mesh for the detailed wave models with a detail of the project location 3.3 Results The simulation period for the detailed wave models is 8 months from 15/02/2002 to 14/10/2002 with a time step of 6 hours. Because of the very long computation time of these models, it was not possible to get results for a longer period. But in the simulated period the more rough winter wave climate with swell and the calm summer climate are included. Therefore the results are probably accurate enough for making long term predictions. Figure 3.2: Maximum wave heights in the existing and new situation for the detailed wave model 18
31 In Figure 3.2 the result for the maximum occurring wave height during the simulation period is shown for the existing and new situation. Little changes can be seen for most of the area, what means that the influence of the island on the wave climate is very local. In the situation with the islands it can be seen that the area between the islands and the coast is sheltered from the waves. Only very small waves occur in this area. From the detailed wave models output was generated for use in LITDRIFT sediment models. In Figure 3.3 the location of the output nodes is given for which the wave height, wave period and wave direction were calculated for each time step of the eight month simulation period. The location of the nodes was chosen such that along all the beaches wave information is available. Also output was generated for the locations of the offshore and inshore wave buoys and a current meter. For five cross sections over the breakwater and beach of Runaway Beach and Half Moon Beach output was generated in the form of wave output along a line. In this way the propagation of waves from offshore over the breakwater and toward the shore can be seen (Figure 3.4). Figure 3.3: Locations of output nodes and line outputs in the detailed wave models. The point Off stands for offshore wave buoy. This is the same buoy that has been used to calibrate the model. On stands for onshore wave buoy and ADCP stands for Acoustic Doppler Current Profiler. [8] 19
32 Figure 3.4: Wave height for a line over the breakwater, the location of which is indicated schematically 20

33 4 Stability analysis The stability of the different parts of the islands has to be determined for different events. The most important events are a swell period and a hurricane, in which the highest wave heights occur. With the MIKE 21 Coupled Model the waves, hydrodynamics and sediment transport can be calculated in one model. In this model the interaction between waves, currents and sediment transport is simulated, with which bed level changes can be calculated. This was done for a swell period of approximately one week and a hurricane of 10 hours. With the results of these models the critical spots in the design are determined where problems with erosion can be expected. 4.1 Model input Swell input The wave input for the swell model consists of the scaled wave-energy spectra as calculated in the large model for the swell period of 19/02/2002 to 25/02/2002. A time step of 1 hour is used for the model. For the swell model no wind input is used. For the hydrodynamics a tidal variation is put on the north and south boundaries. This tidal variation is determined with the MIKE 21 tidal prediction based on a global tide model. The maximum tidal range is about 0.8 m. In addition to this a constant elevation of 0.5 m is added to account for global sea level rise for over a period of 100 years, which is the lifetime of the islands. The sediment properties are taken constant with a mean grain diameter of 0.3 mm with a grading coefficient of 1.4. These values are based on a sediment analysis for the Environmental Monitoring Programme for the Barbados Port Authority [1], which can be found in Appendix E. To enable the model to calculate sediment transport an initial layer thickness of the sediment has to be defined. This is done for the locations of the beaches. All other locations are supposed to have little contribution to the sediment transport and therefore have no initial layer thickness. This can be seen in Figure 4.1. Figure 4.1: Initial layer thickness. Purple is no initial layer thickness and red up to 1.4 m sediment. 21
![4.1.2 Hurricane input The wave and wind conditions for the hurricane are determined with HURWave [3], a program developed by in-house staff of SWIL.](/docs-images/93/112888356/images/34-0.jpg "HURWave combines a database of hurricane tracks with parametric 1 wind-distribution algorithms and statistical analysis tools to determine deep-water design wave conditions at any location within the")
34 4.1.2 Hurricane input The wave and wind conditions for the hurricane are determined with HURWave [3], a program developed by in-house staff of SWIL. HURWave combines a database of hurricane tracks with parametric 1 wind-distribution algorithms and statistical analysis tools to determine deep-water design wave conditions at any location within the Caribbean. The coordinates of the project location are put in the program, which then gives all storms that passed within a certain radius (300 km) from the location. The most important ones were plotted in a map which can be seen in Figure 4.2. Figure 4.2: Tracks of significant hurricanes in relation to the project location Of these storms the highest wave heights according to HURWave occurred for Janet (1955). These waves however were coming from the northeast (HURWave does not take land into account) so they couldn t have occurred at the project location. Therefore the storm with the second highest waves was used, Allen (1980). The results from HURWave for the wave height, period and direction and for the wind speed and direction were used as input for the large scale model. With this model the boundary conditions for the small scale hurricane model were determined. The wave-energy spectra calculated in the large scale model were used as input along the boundary of the small scale model for a period of 10 hours with a time step of 15 minutes. On these spectra no calibration factor was applied. This is because the calibration factor was determined for a long term model and based on long term measurements. No detailed information of hurricanes was available to determine a calibration factor for a hurricane event. Because of the high wind speeds during a hurricane the wind speed and direction also serve as input for the model. 1 HURWave uses the wave predictions from a parametric hurricane wave model by Young (1995) 22
 is added to the water level.")
35 Because of the short simulation period a variation of the tide is not taken into account, but a constant high tide of 0.4 m +MSL is taken. Also a constant elevation of 0.5 m is added to account for sea level rise. In addition to this the IBR (inverse barometric rise) is added to the water level. This is the rise in water level caused by the low pressure in the centre of the hurricane. Since HURWave also calculates this pressure, the IBR can be calculated from this. More information about the in- and output of HURWave can be found in Appendix C. The sediment properties and the initial layer thickness are the same as for the swell model. 4.2 Mesh and boundaries The mesh for the coupled model is mostly the same as the mesh for the detailed wave model with the islands. The main difference is the use of a quadrangular mesh at the location of the beaches instead of a triangular mesh. With this quadrangular mesh the sediment transport can be calculated more accurately. Also the gaps and channels between the islands are now included, for more accurate results. Figure 4.3: Detail of the mesh for the coupled models 23

36 4.3 Swell results Wave conditions In Figure 4.4 a plot with the maximum occurring wave height is displayed. Offshore the maximum occurring wave height is about 1.6 m. From the image can be seen that the breakwaters along the beaches function quite good, the wave heights are reduced quite well. Figure 4.4: Maximum wave heights during the simulated swell period. 24

37 In Figure 4.5 a plot of the significant wave height and wave direction near the peak of the swell period can be found. The maximum occurring offshore wave heights are in the order of 1.6 m. The wave heights are reduced to approximately 0.1 m in the lagoon behind the islands. Figure 4.5: Significant wave heights and wave directions near the peak of the swell period. 25

38 4.3.2 Hydrodynamics In Figure 4.6 a plot of the significant current speed and direction near the peak of the swell period can be found. Just offshore of the islands the occurring current speeds are in the order of 0.5 to 1.1 m/s. In the lagoon behind the islands current speeds of about 0.20 m/s will occur. Figure 4.6: Current speed and direction near the peak of the swell period. 26


39 In Figure 4.7 a detail of the plot in Figure 4.6 is shown. The detail shown is near Runaway Beach. It can be seen that around the breakwater in front of Runaway Beach the currents are higher than those offshore. The current speed is in the order of 0.7 m/s above the breakwater and 0.3 m/s behind the breakwater. Figure 4.7: Detail of currents near Runaway Beach. In Figure 4.8 a detail of the plot in Figure 4.6 is shown. The detail shows currents along the breakwater in front of Half Moon Beach. It can be seen that around the breakwater in front of Half Moon Beach the currents are higher than those offshore. The current speed is in the order of 0.7 m/s above the breakwater. At the south eastern tip of the breakwater a maximum current speed of about and 0.9 m/s will occur. Behind the breakwater current speeds of 0.3 m/s and less will occur. Figure 4.8: Detail of currents near Half Moon Beach. 27

40 4.3.3 Sediment transport In Figure 4.9 the total bed level change that occurred during the simulated swell period is displayed. From this picture it can be seen that the topside of all the beaches will be eroded by a few centimetres. This sediment is deposited down the beach slope, causing the entire beach profile to flatten. These few centimetres are no threat, the beach will probably be restored in the cause of time to its original profile. Figure 4.9: Bed level change at the end of the swell period simulation. 28


41 Figure 4.10 shows a detail of the bed level change at New Coconut Beach. From this image it becomes clear that at the end of the groyne west of New Coconut Beach a scour hole will develop. The maximum bed level change in this scour hole is approximately 0.2 m. Figure 4.10: Detail of bed level change at the end of the swell period simulation at New Coconut Beach. Unit: [m]. From Figure 4.11 it can be seen that some sedimentation spots seaward of the crest (the crest is represented by the sixth row of quadrangular cells from the beach) will develop. This is not logical, because sediment won t be transported over the breakwater in seaward direction. Figure 4.11: Detail of bed level change at the end of the swell period simulation at Runaway Beach. Unit: [m]. 29

![Here sand will be washed out to the north. Figure 4.12: Detail of bed level change at the end of the swell period simulation at the southern end of Runaway Beach and the navigation channel. Unit: [m].](/docs-images/93/112888356/images/42-1.jpg "Figure 4.13 shows a detail of the bed level change around Half Moon Beach. One can see that at the topside of the beach a layer of about 0.1 m will be eroded.")
42 Figure 4.12 shows a detail of the bed level change at the southern end of Runaway Beach. It can be seen that a large sedimentation spot will develop (the purple spot). In the navigation channel accretion will take place too. The accretion will be in the order of half a meter. The same kind of problem will occur near the northern groyne of Runaway Beach. Here sand will be washed out to the north. Figure 4.12: Detail of bed level change at the end of the swell period simulation at the southern end of Runaway Beach and the navigation channel. Unit: [m]. Figure 4.13 shows a detail of the bed level change around Half Moon Beach. One can see that at the topside of the beach a layer of about 0.1 m will be eroded. The purple spot in front of the beach indicates that a sedimentation spot will develop with a thickness of approximately 0.6 m. South of Half Moon Beach another large sedimentation spot will develop. This spot consists of sediment that has been eroded from Half Moon Beach. The thickness of the spot is approximately 0.5 m. Figure 4.13: Detail of bed level change at the end of the swell period simulation near Half Moon Beach. Unit: [m]. 30
43 4.3.4 Suggested design modifications From the above results it became clear some unwanted erosion and sedimentation problems will occur if no measures are taken. Below some design modifications are suggested to reduce or prevent problems. - At the tip of the groyne west of New Coconut Beach, a scour hole will develop. This scour hole might cause the groyne to get unstable. To prevent this, a bottom protection near the tip of the groyne is needed. - At Runaway Beach sediment will be eroded. This sediment will be deposited at the southern end of the submerged breakwater and in the navigation channel south of Runaway Island. This sedimentation is unwanted, especially in the navigation channel. To prevent this sedimentation, it is suggested to extend the groyne at the southern end of Runaway Beach. - Near the northern end of Runaway Beach sediment will be deposited. This is also eroded from Runaway Beach, just like the case at the southern end of the beach. It is suggested to extend the northern groyne also, to prevent the sediment to be washed out. - Sediment will be eroded from Half Moon Beach and will be deposited at the southern end of the breakwater. To prevent this, it is suggested to build a groyne at the southern end of the beach. 31
44 4.4 Hurricane results Wave conditions The model results for the wave height are given in Figure 4.14, which shows the maximum occurring wave heights. At sea wave heights of up to 9 m can be seen, but at the project location waves get lower because they come near to the shore. In front of the breakwater at Runaway Beach the maximum wave height is about 5 m. Behind the breakwater the wave height is no more than approximately 2.5 m, which shows the effect of the breakwater. Even during a hurricane no high waves occur in the bay behind the islands; the wave heights get not much higher than 2 m. Only in the north and south there is some penetration of higher waves behind the islands. This means there will be probably no large effects of beach erosion due to waves behind the islands during a hurricane. Figure 4.14: Maximum wave heights during a hurricane 32

45 In Figure 4.15 and Figure 4.16 the significant wave height and the wave direction can be seen for two different time steps during the hurricane. One in the beginning and one at the end. With the passing of the hurricane, the wave direction changes from northwest to southwest. This can be clearly seen at the open sea. But due to effects of refraction the wave directions at the beaches are almost constant. Also the wave penetration behind the islands is not very dependent on the wave direction. Figure 4.15: Significant wave height and wave direction for a time step in the beginning of the hurricane 33

46 Figure 4.16: Significant wave height and wave direction for a time step at the end of the hurricane 34

47 Figure 4.17 shows the significant wave heights and directions at the tip of the southern island, north of Half Moon Beach. This spot is situated behind the gap between the breakwaters of Runaway and Half Moon Beach. Through this gap there is quite some wave penetration. Waves of up to 3.5 m hit the island under an almost straight angle. Figure 4.17: Significant wave heights and wave directions at the tip of the southern island 35

48 4.4.2 Hydrodynamics In Figure 4.18 the maximum surface elevation during a hurricane is shown. The still water level during a hurricane including high tide, IBR and sea level rise is approximately 1.2 m above mean sea level. It can be seen that a maximum setup of about 0.7 m above this still water level occurs. This is a total water level of 1.9 m above mean sea level. In addition to this, wave run up at the beaches can be expected. Figure 4.18: Maximum surface elevation during a hurricane 36

49 In Figure 4.19 and Figure 4.20 the current speed and direction for two different time steps during the hurricane are shown. It can be seen that the current direction is completely turned between these time steps. This is probably caused by the change in wind direction during the passing of the hurricane. The largest currents occur in front of the breakwater at Runaway Beach, but no erosion problems are expected here. Also strong currents of up to 2.5 m/s occur in the navigation channel between Runaway Island and the southern island. Sediment eroded from the channel can be deposited just outside of the channel, where the current is less strong. Figure 4.19: Current speed and direction for a time step half way the duration of the hurricane 37
50 Figure 4.20: Current speed and direction for a time step at the end of the hurricane 38

51 Also southwest of the channel at the tip of the southern island high currents occur during a hurricane. This can be seen in Figure Figure 4.21: Detail of the currents in the channel between Runaway Island and the southern island and at the tip of the southern island 39

52 4.4.3 Sediment transport Figure 4.22 shows the total bed level change after a hurricane. The most important feature that can be seen is beach flattening. Sediment is transported from the higher parts of the beaches to the lower parts, creating a less steep beach profile. This can be seen at Runaway Beach, New Coconut Beach, Half Moon Beach and at the existing beaches. Figure 4.22: Bed level change after a hurricane 40


53 Figure 4.23 shows a detail of the bed level change at Half Moon and New Coconut Beach. An erosion and sedimentation of up to about 0.30 m can be seen. This will not have big consequences for the stability of the beaches, because probably the old beach profile will be restored in the time after the hurricane. Figure 4.23: Detail of the bed level change after a hurricane for Half Moon Beach and New Coconut Beach Conclusions and design modifications No extensive measures are needed to prevent problems due to a hurricane. With a good design of the breakwaters, Runaway Beach and Half Moon Beach are protected well against the high waves during a hurricane. Only the tip of the southern island, behind the gap in the breakwaters, high waves can penetrate and attack the island. Here also high currents occur. To prevent damage, a good revetment with scour protection is needed here (see Figure 4.24). Figure 4.24: Location of the revetment at the southern island In the navigation channel between Runaway Island and the southern island high currents occur. Sedimentation at the ends of the channel can be expected, which could cause problems for navigation. But the amount of sedimentation is dependent on the amount of sediment in the channel, which is probably not very high. Also the direction of the current in the channel changes with the passing of the hurricane. Therefore the sediment transported first in one direction will be transported back later. So probably the amount of sediment transport is not big enough to cause problems for navigation. 41
54 4.5 Design storm With HURWave the design wave parameters for a 1/150 year storm were determined. This was done for three different directions. These directions are the sectors from south to west southwest ( degrees), from west southwest to west northwest ( degrees) and from west northwest to north ( degrees). With this division of sectors, effects of waves from all possible directions at the project location are taken into account. With a extreme value evaluation the extreme wave parameters for the design storm have been determined. The wave parameters for the three directions from HURWave serve as input for MIKE 21 models to determine the design wave height at the different locations of The Islands. A coupled model with waves and hydrodynamics was used for this, with on the boundaries the constant wave parameters from HURWave. The maximum values from these models in front of the submerged breakwater at Runaway Beach are shown in Table 4.1. As can be seen, the 1/150 year storm with a mean direction of 330 degrees is governing, because it gives the highest wave height. The design parameters can be used in a further design. Table 4.1: 1/150 year hurricane design parameters Breakwater Runaway Beach Design storm H s max [m] T p max [s] Mean dir [deg] 1/150 yr 330 degrees /150 yr 270 degrees /150 yr 210 degrees

55 5 Long term beach stability In this chapter the long term stability of several beaches in The Islands will be investigated. First an analysis of recent cross-shore profile data of the existing beach will be made. Thereafter, several beach profiles will be analysed with the aid of LITDRIFT, which is a sub-program of LITPACK [5]. LITDRIFT can calculate the accumulated sediment drift along a profile as a result of wave action on that profile. The existing situation will be investigated as well as the situation with The Islands in place. 5.1 Beach profile analysis Beach profile data From [1] beach profile data has been obtained. Three beach profiles have been monitored from approximately 1994 until Several times a year the bathymetry of the profile has been measured. In Figure 5.1 the three locations of measurements are displayed. Paradise South is located just north of the project area. BL&P North is located just north of the Hot Pot. Brandons is located at Brandon s Beach, north of the Flour Mill. The profiles have been measured on a line perpendicular to the coastline, with the points displayed in the figure as starting point. Figure 5.1: Locations of profile measurements [7] Long term profile evolution In Appendix D annual profile measurements have been plotted. The measurements for the month September were used, because data of this month were available almost every year. Where there wasn t any data available for September the measurements of June were used. With the aid of these plots the long term profile evolution can be described. Paradise South For the location Paradise South yearly profiles have been plotted in Appendix D.1. From Figure D.1 can be seen that for the entire beach profile has been accreted between 1994 and Figure D.2 shows that in the period from 1997 to 2000 the profile has been eroded. Figure D.3 shows that between 2000 and 2003 the beach has been accreted again. In Figure D.4 one can see that between 2003 and 2006 the beach has undergone an accretion again. A special case is the change in profile between 2005 and 2006: the flat upper side of the beach has been lowered by 0.5 m. This material has been deposited on the slope of the beach, which caused the waterline to move 1 m seaward. 43
56 Figure D.12 shows the elevation varying in time of three points at fixed distances from the starting point of the profile. The distance of these points to the starting point can be seen in the legend. The straight black lines are linear trend lines which belong to the three sets of scatter data. These trend lines have a positive slope, which means that the mean position of the three points is moving upwards. This means that in the monitored period on average an accretion has been occurred. BL&P North For the location BL&P North yearly profiles have been plotted in Appendix D.2. From Figure D.5 can be seen that between 1994 and 1997 the beach profile is barely changing, which means the profile is quite stable. Figure D.6 shows that in the period from 1997 to 2000 the beach is also almost stable, besides a little setback in Figure D.7 shows that between 2000 and 2001 the beach profile has been shifted landward. After that event, the beach has been stable until 2005, which can be seen from Figure D.8. Figure D.13 shows the elevation varying in time of three points at fixed distances from the starting point of the profile. From this plot can be seen that the beach is nearly stable. The three trend lines, which correspond to three fixed positions in the cross shore profile, are almost horizontal, which means that on average the beach is stable in the monitored period. Brandons For the location Brandons yearly profiles have been plotted in Appendix D.3. From Figure D.9 can be seen that in the period between 1997 and 2000 the beach profile has been shifted seaward. Figure D.10 shows that that beach is quite stable in the period between 2000 and From Figure D.11 can be seen that the beach has been eroded between 2003 and Figure D.14 shows the elevation varying in time of three points at fixed distances from the starting point of the profile. The plot shows that the points at 24 m and 36 m from the starting point of the profile are accreting, whereas the erosion in the point at 42 m is very small. From this can be concluded that on average the profile is accreting in the monitored period Analysis of beach width The available beach profile data has been used to analyse the change of the beach width in the period the data has been collected. On the next page the results of the analysis have been plotted as scatter data for the three different measurement locations. The points represent the position of the waterline relative to the starting point of the profile at different moments with an interval of approximately six months. A linear trend line has been plotted through the data, to give an indication if the average position of the waterline is stable, advancing or retreating. Hereafter the graphs will be discussed. 44
57 Paradise South Figure 5.2 shows the beach width graph of measuring point Paradise South. The trend line shows that the average waterline position has been moved seaward in the course of time. Beach width Paradise South Beach width (pos. of waterline) [m] 41,00 39,00 37,00 35,00 33,00 31,00 29,00 27,00 25, Time Beach width (position of waterline) Lineair (Beach width (position of waterline)) Figure 5.2: Beach width Paradise South BL&P North Figure 5.3 shows the beach width graph of measuring point BL&P North. The trend line is almost horizontal, which means that the average position of the waterline is stable. The scatter in this data is very large however, which means that variation of the beach width is quite large. Beach width BL&P North Beach width (pos. of waterline) [m] 37,00 36,00 35,00 34,00 33,00 32,00 31,00 30,00 29, Time Beach width (position of waterline) Lineair (Beach width y = -4E-06x (position + 31,934 of waterline)) Figure 5.3: Beach width BL&P North 45
58 Brandons Figure 5.4 shows the beach width graph of measuring point Brandons. Just like at measuring point Paradise South, the trend line shows that the mean waterline has been moved seaward in the course of time. Beach width Brandons Beach width (pos. of waterline) [m] 41,00 39,00 37,00 35,00 33,00 31,00 29,00 27, Time Beach width (position of waterline) Lineair (Beach width (position of waterline)) Figure 5.4: Beach width Brandons 5.2 Model input The main input for LITDRIFT consists of wave data at the seaward end of the crossshore profiles and information about the bathymetry of the profile and sediment information. Hereafter the input will be discussed. Wave data Wave data have been extracted at several points in the detailed wave models describing the original situation and the situation with The Islands in place. The locations of these points can be found in Figure 3.3. At these locations parametric data has been extracted about significant wave height H s, peak period T p and the mean wave direction for the period between 15 February 2002 and 14 October 2002 with intervals of six hours. Because of a lack of time only a period of eight months has been simulated, instead of one year, which was originally planned to simulate. Cross-shore profiles The output nodes along the beaches serve as starting points for the cross-shore profiles to be used in LITDRIFT. Cross-shore profiles have been established at a line starting in a wave output node perpendicular to the local beach. The bathymetry of the profiles has been interpolated from depth survey [10]. For the beach extension at the existing beach and at New Coconut Beach no bathymetric data is available, because these are new beaches to be created. Therefore at these beaches an underwater slope of 1:25 and a dry beach slope of 1:10 have been assumed as reasonable values. Sediment data LITDRIFT needs the bottom roughness, the fall velocity and the geometric spreading of the sediment as input. Several typical grain diameters (D 16, D 50, D 60, D 84 and D 90 ) are needed to calculate the values of the parameters. In Appendix E representative values for D 16, D 50, D 60, D 84 and D 90 are calculated, with the aid of sediment data from [1]. In Table 5.1 the results of this calculation have been summarized. 46
59 Table 5.1: Sediment parameters Grain size parameter Value [mm] D D D D D The parameters are calculated with the aid of a spreadsheet. The calculated values of the parameters are: - Bottom roughness: m - Fall velocity: 0.06 m/s - Geometric spreading: 1.42 These values are used as input parameters for LITDRIFT. 5.3 Results existing situation In Appendix F the results of the LITDRIFT simulations have been summarized. In the different sections in that appendix the results can be seen per profile and per beach in the existing and the new situation with The Islands in place. For every profile different graphs are shown. In the first graph the following results have been displayed as a function of the distance from the starting point of the profile: - Bathymetry of the profile. - Positive and negative sediment drift distribution along the profile. - Total transport distribution along the profile. In the second graph the following results have been displayed as a function of time: - Significant wave height H s - Sediment transport In the third graph the following results have been displayed as a function of time: - Accumulated sediment transport across the profile - Wave direction Below the graphs one can read what direction has been taken positive or negative. In Figure 5.5 the results of the LITDRIFT calculations for the existing situation have been summarized. In the figure the total net accumulated sediment transport in the simulation period of eight months can be seen. The arrows represent the direction of the net accumulated transport and the numbers the net accumulated transport in m 3. 47
60 Existing beach without extension Figure 5.5 Summary of LITDRIFT results for the existing situation. In the figure the accumulated transport in the simulation period are displayed. The unit of the numbers is m 3. From Figure 5.5 can be seen that during the simulation period between profile 11 and 8 accretion will take place, because of the fact that the sediment drift across profile 8 is smaller than the sediment drift across profile 11. Between profile 7 and 8 erosion will take place, because the sediment drift across profile 8 is greater than across profile 7. South of profile 8 accretion will take place. The difference between the transport along profile 4 and 5 is negligible, so the part of the existing beach between profile 7 and 8 is almost stable. Now the results of the LITDRIFT simulations for the existing situation will be compared with the measured findings described in Section 5.1. Only the measuring points BL&P North and Brandons will be considered, because the position of Paradise South is North of profile 11. Therefore no comparison can be made for this measuring point. 48
61 Measuring location BL&P North is located between profile 8 and 11. As stated before, according to the LITDRIFT results accretion will take place between profile 8 and 11. According to the beach profile analysis the average position of the waterline is stable. Measuring location Brandons is located between profile 4 and 5. As stated before, according to the LITDRIFT results the beach will be stable between profile 4 and 5. According to the beach profile analysis the waterline in this profile has moved in seaward direction. Maybe these differences between the simulations and the measured findings occur due to the fact that only 8 months have been simulated instead of an entire year. The period between 15 February 2002 and 14 October 2002 has been simulated. This period does not cover the winter period of October until January. Probably some swell events would have occurred in this winter period, which could influence the simulation results. To get more reliable LITDRIFT results, it is suggested to rerun LITDRIFT with as input a wave input which covers an entire year. In section 5.4 a table can be found in which the accumulated transports of both the existing and the new situation have been summarized. 5.4 Results new situation with The Islands In Appendices F.2 to F.4 the results of the LITDRIFT simulations have been summarized. The results of the different beaches, namely the existing beach with extension, New Coconut Beach and Runaway Beach are given. For an explanation about the graphs in Appendix F, see Section 5.3. In Figure 5.6 the results of the LITDRIFT calculations for the new situation with The Islands in place have been summarized. In the figure the net accumulated sediment transport in the simulation period of eight months can be seen. The arrows represent the direction of the net accumulated transport and the numbers the net accumulated transport in m 3. 49
62 Existing beach with extension Runaway Beach New Coconut Beach Figure 5.6: Summary of LITDRIFT results for the situation with The Islands in place. In the figure the accumulated transport in the simulation period are displayed. The unit of the numbers is m 3. 50
63 Hereafter the results will be analysed per beach. Existing Beach with extension From Figure 5.6 can be seen that between profile 11 and profile 6 the amount of transported sediment is moving southward and decreasing in quantity. Between profile 4 and 6 the sediment drift is directed to the north an also decreasing. This implies that somewhere near profile 6 accretion will take place. Between profile 11 and profile 8 the accumulated amount of transported material is decreasing from m 3 to 4984 m 3. This means between these profiles a lot of accretion will take place. Near profile 6 sediment will pile up, because at that place the sediment comes from two directions. In Table 5.2 the accumulated transport values have been summarized for both the existing and the new situation. Table 5.2: Summarized values of accumulated transport in existing and new situation Profile number Accumulated transport in m 3 Existing situation New situation Note the difference in sediment drift through profile 11 in the original and the new situation. The sediment drift in the original situation is smaller than the new situation. This indicates that the islands influence the morphology at profile 11. Because of the fact that profile 11 is the most northern profile, the extend of the influence of the islands on the morphology is not known. To determine this influence range, more LITDRIFT calculations should be made, taking more profiles to the north into account. New Coconut Beach One can see that through profile 3 only 242 m 3 of sediment transport in the 8 months of simulation will take place. This means that south of profile 4 there is almost no input of sediment. Through profile 4 there is transport of sediment to the north. This implies that the bend south of profile 4, between the existing beach and New Coconut Beach, will be eroded, because of the difference in sediment drift between profile 3 and 4. The calculated amount of 242 m 3 in the simulation period seems very low. Mainly because this beach is very exposed to waves compared to the other beaches. Further investigations and calculations might be needed to make sure that the calculated value is reasonable. Runaway Beach From the results along Runaway Beach can be concluded that from profile 25 until profile 23 southward transport will take place. Because of the fact that there is no inflow of sediment at the northern side of Runaway Beach and that the sediment transport is decreasing in southern direction, the beach will erode with a decreasing 51

64 rate of erosion in southward direction. Near profile 22 the sediment drift is in northward direction. At the southern end of the breakwater there is no sediment inflow too, so erosion will also occur from profile 22 northward. Between profile 22 and 23 sediment will pile up, because there the sediment comes from northern and southern direction. Suggested design modifications From the description of the results follows that some problems will occur if no measures are taken. Hereafter solutions to solve the problems are given. It should be noted that these suggested design modifications are based on eight months of wave data instead of one year, which was originally planned to simulate. - The existing beach will accrete near profile 6. This sediment comes from the north and the south. To prevent the lagoon between the islands and the existing beach to fill up with sediment, some maintenance dredging would be necessary. The middle of the lagoon should be dredged. The dredged material should be deposited north of the project location and in front of the bend in the beach near the Flour Mill. - The bend in the beach will be subject to erosion. In the bend the highway is located close to the beach. To prevent the highway to be undermined, a sea wall might be needed to protect the highway. The location of the seawall needed is indicated in Figure 5.7. Sea wall Figure 5.7: Location of proposed sea wall. 52

65 - At Runaway Beach a lot of sediment transport takes place, causing it to erode. By changing the orientation of the beach, the transport can be reduced. A solution could be to make the angle of the beach perpendicular to the dominant wave direction. An indication of a suggested change is shown in Figure 5.8. Groins should be added to keep the sand in place. The black lines indicate the proposed changes. In grey the old coastline and the submerged breakwater are shown. The breakwater should still be present, but the orientation of the breakwater should be changed a little. Figure 5.8: Proposed changes to reduce erosion at Runaway Beach. 53

66 6 Cost analysis In this chapter an estimate of the costs for The Islands will be made. Section 6.1 describes how the total amount of material is computed and in section 6.2 a cost estimate is presented. 6.1 Compute the amount of material To calculate the amount of material needed for The Islands a 3D model of the project area is made with and without the The Islands. The heights of the area without The Islands can be found respectively in Figure 6.1 and with in Figure 6.2. Figure 6.1: Heights of the project area without The Islands Figure 6.2: Heights of the project area with The Islands From the difference between the heights with and without The Islands the amount of material needed for the different locations can be computed. The elevation for the different locations is shown in Figure
67 Figure 6.3: Amount of material needed for the different locations In the figure can be found that most of the material per square meter is needed for the northern small island in the bay, the most northern part of the southern small island in the bay and the middle part of Runaway Island. For these locations the elevation is more than 12 meter. The total amount of material needed to create The Islands is 5 million m Cost estimation For the different components of the project a distribution of the different materials is estimated. This estimate is used to give a rough estimate about the costs of The Islands. The costs per m 3 of material have been obtained from [2]. An overview of the costs can be found in the table below. 55
68 Table 6.1: Cost estimate of The Islands Description Quantity Unit Rates/ Unit (US$) Low Rates/ Unit (US$) High US$ Total Low US$ Total High Royal Palace Hotel Beach sand m 3 $25 $35 $ $ Gravel/Sand Fill m 3 $20 $45 $ $ Boulders m 3 $200 $250 $ $ Revetment m 3 $270 $360 $ $ Sub Total Sub Total $ $ Runaway Islands Beach sand m 3 $25 $35 $ $ Gravel/Sand Fill m 3 $20 $45 $ $ Boulders m 3 $200 $250 $ $ Steep piles m 2 $650 $750 $ $ Sub Total Sub Total $ $ Lagoon Beach sand m 3 $25 $35 $ $ Gravel/Sand Fill m 3 $20 $45 $ $ Steep piles m 2 $650 $750 $ $ Sub Total Sub Total $ $ Southern small island Gravel/Sand Fill m 3 $20 $45 $ $ Steep piles m 2 $650 $750 $ $ Sub Total Sub Total $ $ Northern small island Gravel/Sand Fill m 3 $20 $45 $ $ Steep piles 400 m 2 $650 $750 $ $ Sub Total Sub Total $ $ New Coconut Beach Beach sand 1000 m 3 $25 $35 $ $ Gravel/Sand Fill 3000 m 3 $20 $45 $ $ Sub Total Sub Total $ $ Enlarged beach Beach sand m 3 $25 $35 $ $ Gravel/Sand Fill m 3 $20 $45 $ $ Sub Total Sub Total $ $ Total $ $

69 7 Conclusions and recommendations Based on the results of all the wave, hydrodynamic and sediment models an overview of the recommended design modifications for improving the design of The Islands is given in this chapter. The locations of the design modifications are given in Figure 7.1. The modifications are described below. Figure 7.1: Locations of the design modifications for improving the design of The Islands [8] Recommended design modifications 1. Extension of the groyne at the south end of Runaway Beach to prevent erosion of sediment from behind the breakwater (see Section 4.3). 2. Extension of the groyne at the north end of Runaway Beach to prevent erosion of sediment from behind the breakwater (see Section 4.3). 3. Bottom protection around the tip of the groyne at the west end of New Coconut Beach to prevent the development of a scour hole (see Section 4.3). 4. Maintenance dredging in the lagoon behind the islands to prevent a salient to develop (see Section 5.4). 5. Sea wall or revetment to protect undermining of the highway close to the beach by erosion of the beach (see Section 5.4). 6. Groynes perpendicular to the beach and/or adjustment of the beach orientation to prevent erosion of Runaway Beach (see Section 5.4). 7. Revetment at the tip of the southern island to protect the island against damage due to high waves and currents during a hurricane (see Section 4.4). 57
OECS Regional Engineering Workshop September 29 October 3, 2014
 B E A C H E S. M A R I N A S. D E S I G N. C O N S T R U C T I O N. OECS Regional Engineering Workshop September 29 October 3, 2014 Coastal Erosion and Sea Defense: Introduction to Coastal Dynamics David
Appendix E Cat Island Borrow Area Analysis
 Appendix E Cat Island Borrow Area Analysis ERDC/CHL Letter Report 1 Cat Island Borrow Area Analysis Multiple borrow area configurations were considered for Cat Island restoration. Borrow area CI1 is located
IMPACTS OF COASTAL PROTECTION STRATEGIES ON THE COASTS OF CRETE: NUMERICAL EXPERIMENTS
 IMPACTS OF COASTAL PROTECTION STRATEGIES ON THE COASTS OF CRETE: NUMERICAL EXPERIMENTS Tsanis, I.K., Saied, U.M., Valavanis V. Department of Environmental Engineering, Technical University of Crete, Chania,
Available online at ScienceDirect. Procedia Engineering 116 (2015 )
") Available online at www.sciencedirect.com ScienceDirect Procedia Engineering 116 (2015 ) 320 325 8th International Conference on Asian and Pacific Coasts (APAC 2015) Department of Ocean Engineering, IIT
Available online at www.sciencedirect.com ScienceDirect Procedia Engineering 116 (2015 ) 320 325 8th International Conference on Asian and Pacific Coasts (APAC 2015) Department of Ocean Engineering, IIT
HARBOUR SEDIMENTATION - COMPARISON WITH MODEL
 HARBOUR SEDIMENTATION - COMPARISON WITH MODEL ABSTRACT A mobile-bed model study of Pointe Sapin Harbour, in the Gulf of St. Lawrence, resulted in construction of a detached breakwater and sand trap to
Evaluation of a proposed solution to beach erosion at Negril
 Mondon, E. M. and Warner, P.S. 2012. Evaluation of a proposed solution to beach erosion at Negril. Caribbean Journal of Earth Science, Volume 43, 11-23. Available online: 2 nd July 2012. Geological Society
Technical Brief - Wave Uprush Analysis Island Harbour Club, Gananoque, Ontario
 Technical Brief - Wave Uprush Analysis RIGGS ENGINEERING LTD. 1240 Commissioners Road West Suite 205 London, Ontario N6K 1C7 October 31, 2014 Table of Contents Section Page Table of Contents... i List
SELECTION OF THE PREFERRED MANAGEMENT OPTION FOR STOCKTON BEACH APPLICATION OF 2D COASTAL PROCESSES MODELLING
 SELECTION OF THE PREFERRED MANAGEMENT OPTION FOR STOCKTON BEACH APPLICATION OF 2D COASTAL PROCESSES MODELLING C Allery 1 1 DHI Water and Environment, Sydney, NSW Abstract This paper presents an approach
DUXBURY WAVE MODELING STUDY
 DUXBURY WAVE MODELING STUDY 2008 Status Report Duncan M. FitzGerald Peter S. Rosen Boston University Northeaster University Boston, MA 02215 Boston, MA 02115 Submitted to: DUXBURY BEACH RESERVATION November
INTRODUCTION TO COASTAL ENGINEERING AND MANAGEMENT
 Advanced Series on Ocean Engineering Volume 16 INTRODUCTION TO COASTAL ENGINEERING AND MANAGEMENT J. William Kamphuis Queen's University, Canada World Scientific Singapore New Jersey London Hong Kong Contents
BILLY BISHOP TORONTO CITY AIRPORT PRELIMINARY RUNWAY DESIGN COASTAL ENGINEERING STUDY
 Bâtiment Infrastructures municipales Transport Industriel Énergie Environnement BILLY BISHOP TORONTO CITY AIRPORT PRELIMINARY RUNWAY DESIGN COASTAL ENGINEERING STUDY N. Guillemette 1, C. Glodowski 1, P.
STATUS REPORT FOR THE SUBMERGED REEF BALL TM ARTIFICIAL REEF SUBMERGED BREAKWATER BEACH STABILIZATION PROJECT FOR THE GRAND CAYMAN MARRIOTT HOTEL
 August 23 STATUS REPORT FOR THE SUBMERGED REEF BALL TM ARTIFICIAL REEF SUBMERGED BREAKWATER BEACH STABILIZATION PROJECT FOR THE GRAND CAYMAN MARRIOTT HOTEL performed by Lee E. Harris, Ph.D., P.E. Consulting
CROSS-SHORE SEDIMENT PROCESSES
 The University of the West Indies Organization of American States PROFESSIONAL DEVELOPMENT PROGRAMME: COASTAL INFRASTRUCTURE DESIGN, CONSTRUCTION AND MAINTENANCE A COURSE IN COASTAL DEFENSE SYSTEMS I CHAPTER
INTRODUCTION TO COASTAL ENGINEERING
 The University of the West Indies Organization of American States PROFESSIONAL DEVELOPMENT PROGRAMME: COASTAL INFRASTRUCTURE DESIGN, CONSTRUCTION AND MAINTENANCE A COURSE IN COASTAL DEFENSE SYSTEMS I CHAPTER
Cross-shore sediment transports on a cut profile for large scale land reclamations
 Cross-shore sediment transports on a cut profile for large scale land reclamations Martijn Onderwater 1 Dano Roelvink Jan van de Graaff 3 Abstract When building a large scale land reclamation, the safest
HURRICANE SANDY LIMITED REEVALUATION REPORT UNION BEACH, NEW JERSEY DRAFT ENGINEERING APPENDIX SUB APPENDIX D SBEACH MODELING
 HURRICANE SANDY LIMITED REEVALUATION REPORT UNION BEACH, NEW JERSEY DRAFT ENGINEERING APPENDIX SUB APPENDIX D SBEACH MODELING Rev. 18 Feb 2015 1 SBEACH Modeling 1.0 Introduction Following the methodology
To: William Woods, Jenni Austin Job No: CentrePort Harbour Deepening Project - Comments on community queries
 Memo To: William Woods, Jenni Austin From: Richard Reinen-Hamill Date: Subject: cc: 1 Purpose This memo sets out our response to issues raised at and after Seatoun community consultation sessions held
SHORE PROTECTION AND HABITAT CREATION AT SHAMROCK ISLAND, TEXAS ABSTRACT
 SHORE PROTECTION AND HABITAT CREATION AT SHAMROCK ISLAND, TEXAS M. Cameron Perry, P.E., and Daniel J. Heilman, P.E. Coastal Engineer Shiner Moseley & Associates., Inc. 555 N. Carancahua Corpus Christi,
THE WAVE CLIMATE IN THE BELGIAN COASTAL ZONE
 THE WAVE CLIMATE IN THE BELGIAN COASTAL ZONE Toon Verwaest, Flanders Hydraulics Research, toon.verwaest@mow.vlaanderen.be Sarah Doorme, IMDC, sarah.doorme@imdc.be Kristof Verelst, Flanders Hydraulics Research,
Modeling Sediment Transport Along the Upper Texas Coast
 Modeling Sediment Transport Along the Upper Texas Coast David B. King Jr. Jeffery P. Waters William R. Curtis Highway 87 roadbed, Jefferson County Galveston District Corps Sabine Pass to San Luis Pass
April 7, Prepared for: The Caribbean Disaster Emergency Response Agency Prepared by: CEAC Solutions Co. Ltd.
 April 7, 2006 Prepared for: The Caribbean Disaster Emergency Response Agency Prepared by: Introduction CEAC Solutions Co. Ltd was commissioned in May 2005 to prepare coastal beach erosion hazard maps for
The development of the historical harbour of Paphos, Cyprus H.J. van Wijhe*, M. Meletiou^ Division, P.O. Box 152, 8300 AD Emmeloord, The Netherlands
 The development of the historical harbour of Paphos, Cyprus H.J. van Wijhe*, M. Meletiou^ Division, P.O. Box 152, 8300 AD Emmeloord, The Netherlands Abstract The harbour of Paphos originates from ancient
APPENDIX G WEATHER DATA SELECTED EXTRACTS FROM ENVIRONMENTAL DATA FOR BCFS VESSEL REPLACEMENT PROGRAM DRAFT REPORT
 APPENDIX G WEATHER DATA SELECTED EXTRACTS FROM ENVIRONMENTAL DATA FOR BCFS VESSEL REPLACEMENT PROGRAM DRAFT REPORT Prepared for: B.C. Ferries Services Inc. Prepared by: George Roddan, P.Eng. Roddan Engineering
MONITORING SEDIMENT TRANSPORT PROCESSES AT MANAVGAT RIVER MOUTH, ANTALYA TURKEY
 COPEDEC VI, 2003 in Colombo, Sri Lanka MONITORING SEDIMENT TRANSPORT PROCESSES AT MANAVGAT RIVER MOUTH, ANTALYA TURKEY Isikhan GULER 1, Aysen ERGIN 2, Ahmet Cevdet YALCINER 3 ABSTRACT Manavgat River, where
MODELING OF CLIMATE CHANGE IMPACTS ON COASTAL STRUCTURES - CONTRIBUTION TO THEIR RE-DESIGN
 Proceedings of the 14 th International Conference on Environmental Science and Technology Rhodes, Greece, 3-5 September 2015 MODELING OF CLIMATE CHANGE IMPACTS ON COASTAL STRUCTURES - CONTRIBUTION TO THEIR
CHAPTER 134 INTRODUCTION
 CHAPTER 134 NEW JETTIES FOR TUNG-KANG FISHING HARBOR, TAIWAN Chi-Fu Su Manager Engineering Department Taiwan Fisheries Consultants, Inc. Taipei, Taiwan INTRODUCTION Tung-Kang Fishing Harbor, which is about
Reading Material. Inshore oceanography, Anikouchine and Sternberg The World Ocean, Prentice-Hall
 Reading Material Inshore oceanography, Anikouchine and Sternberg The World Ocean, Prentice-Hall BEACH PROCESSES AND COASTAL ENVIRONMENTS COASTAL FEATURES Cross section Map view Terminology for Coastal
Inlet Management Study for Pass-A-Grille and Bunces Pass, Pinellas County, Florida
 Inlet Management Study for Pass-A-Grille and Bunces Pass, Pinellas County, Florida Final Report Submitted By Ping Wang, Ph.D., Jun Cheng Ph.D., Zachary Westfall, and Mathieu Vallee Coastal Research Laboratory
LAB: WHERE S THE BEACH
 Name: LAB: WHERE S THE BEACH Introduction When you build a sandcastle on the beach, you don't expect it to last forever. You spread out your towel to sunbathe, but you know you can't stay in the same spot
Southern California Beach Processes Study
 Southern California Beach Processes Study Torrey Pines Field Site 5th Quarterly Report 31 May 22 to California Resources Agency and California Department of Boating and Waterways R.T. Guza 1, W.C. O Reilly
Shoreline Evolution Due to Oblique Waves in Presence of Submerged Breakwaters. Nima Zakeri (Corresponding Author), Mojtaba Tajziehchi
, Mojtaba Tajziehchi") Shoreline Evolution Due to Oblique Waves in Presence of Submerged Breakwaters Nima Zakeri (Corresponding Author), Mojtaba Tajziehchi Department of Civil Engineering, Faculty of Engineering, University
Shoreline Evolution Due to Oblique Waves in Presence of Submerged Breakwaters Nima Zakeri (Corresponding Author), Mojtaba Tajziehchi Department of Civil Engineering, Faculty of Engineering, University
MIKE Release General product news for Marine software products, tools & features. Nov 2018
 MIKE Release 2019 General product news for Marine software products, tools & features Nov 2018 DHI 2012 MIKE 3 Wave FM New advanced phase-resolving 3D wave modelling product A MIKE 3 FM Wave model - why?
MIAMI BEACH 32ND STREET HOT SPOT: NUMERICAL MODELING AND DESIGN OPTIMIZATION. Adam Shah - Coastal Engineer Harvey Sasso P.E.
 ABSTRACT MIAMI BEACH 32ND STREET HOT SPOT: NUMERICAL MODELING AND DESIGN OPTIMIZATION Adam Shah - Coastal Engineer Harvey Sasso P.E. - Principal Coastal Systems International, Inc. 464 South Dixie Highway
Evaluation of June 9, 2014 Federal Emergency Management Agency Flood Insurance Study for Town of Weymouth, Norfolk, Co, MA
 Evaluation of June 9, 2014 Federal Emergency Management Agency Flood Insurance Study for Town of Weymouth, Norfolk, Co, MA Prepared For: Woodard & Curran 95 Cedar Street, Suite 100 Providence, RI 02903
Hydrodynamic and hydrological modelling to support the operation and design of sea ports
 Hydrodynamic and hydrological modelling to support the operation and design of sea ports Data needs and examples Martijn de Jong (port/nautical requirements, waves, currents) Sofia Caires (mean and extreme
Understanding the Tsunami Wave
 The First Tsunami attack on Sri Lanka Krakatoa Island 27 th August 1883 Understanding the Tsunami Wave Generation Propagation Nearshore Transformation Shoreline Entry Inland Dissipation 1 Generation and
STUDY ON TSUNAMI PROPAGATION INTO RIVERS
 ABSTRACT STUDY ON TSUNAMI PROPAGATION INTO RIVERS Min Roh 1, Xuan Tinh Nguyen 2, Hitoshi Tanaka 3 When tsunami wave propagation from the narrow river mouth, water surface is raised and fluctuated by long
Taranaki Tsunami Inundation Analysis. Prepared for Taranaki Civil Defence Emergency Management Group. Final Version
 Taranaki Tsunami Inundation Analysis Prepared for Taranaki Civil Defence Emergency Management Group Final Version June 2012 AM 12/07 HBRC Plan Number 4362 Asset Management Group Technical Report Prepared
Technical Brief - Wave Uprush Analysis 129 South Street, Gananoque
 Technical Brief - Wave Uprush Analysis 129 South Street, Gananoque RIGGS ENGINEERING LTD. 1240 Commissioners Road West Suite 205 London, Ontario N6K 1C7 June 12, 2013 Table of Contents Section Page Table
LITTLE LAGOON & LITTLE LAGOON PASS: RESEARCH UPDATES & DIRECTIONS
 LITTLE LAGOON & LITTLE LAGOON PASS: RESEARCH UPDATES & DIRECTIONS Bret M. Webb, PhD, PE, DCE Professor Department of Civil, Coastal, and Environmental Engineering October 19, 2017 LLPS Meeting Acknowledgments
Volume and Shoreline Changes along Pinellas County Beaches during Tropical Storm Debby
 Volume and Shoreline Changes along Pinellas County Beaches during Tropical Storm Debby Ping Wang and Tiffany M. Roberts Coastal Research Laboratory University of South Florida July 24, 2012 Introduction
Chesil Beach, Dorset UK High energy, shingle coastline. Brighton Beach, Sussex UK Pebble beach
 Beaches: Depositional landform Extends from the highest high tide to the lowest low tide. Very important temporary store in coastal system. Accretion: sediment returning to the visible portion of a beach
Beach Wizard: Development of an Operational Nowcast, Short-Term Forecast System for Nearshore Hydrodynamics and Bathymetric Evolution
 Beach Wizard: Development of an Operational Nowcast, Short-Term Forecast System for Nearshore Hydrodynamics and Bathymetric Evolution Ad Reniers Civil Engineering and Geosciences, Delft University of Technology
Appendix D: SWAN Wave Modelling
 Appendix D: SWAN Wave Modelling D.1 Preamble The Eurobodalla Shire Council area is subject to extreme waves originating from offshore storms. When swell waves approach the coast, they are modified by the
Figure 4, Photo mosaic taken on February 14 about an hour before sunset near low tide.
 The Impact on Great South Bay of the Breach at Old Inlet Charles N. Flagg and Roger Flood School of Marine and Atmospheric Sciences, Stony Brook University Since the last report was issued on January 31
Exemplar for Internal Assessment Resource Geography Level 3. Resource title: The Coastal Environment Kaikoura
 Exemplar for internal assessment resource Geography 3.5A for Achievement Standard 91430 Exemplar for Internal Assessment Resource Geography Level 3 Resource title: The Coastal Environment Kaikoura This
Coastal Wave Energy Dissipation: Observations and Modeling
 Coastal Wave Energy Dissipation: Observations and Modeling Jeffrey L Hanson US Army Corps of Engineers Field Research Facility USACE Field Research Facility Kent K. Hathaway US Army Corps of Engineers
Nearshore Placed Mound Physical Model Experiment
 Nearshore Placed Mound Physical Model Experiment PURPOSE: This technical note describes the migration and dispersion of a nearshore mound subjected to waves in a physical model. The summary includes recommendations
COFFS HARBOUR SEDIMENT MODELLING AND INVESTIGATION
 COFFS HARBOUR SEDIMENT MODELLING AND INVESTIGATION Luke McAvoy Undergraduate Engineer (Civil) Griffith School of Engineering, Griffith University, Gold Coast, Australia Daniel Rodger Senior Engineer Water
Deep-water orbital waves
 What happens when waves approach shore? Deep-water orbital waves Fig. 9.16, p. 211 Wave motion is influenced by water depth and shape of the shoreline wave buildup zone surf zone beach Wave base deepwater
Oceans and Coasts. Chapter 18
 Oceans and Coasts Chapter 18 Exploring the oceans The ocean floor Sediments thicken and the age of the seafloor increases from ridge to shore The continental shelf off the northeast United States Constituent
Low-crested offshore breakwaters: a functional tool for beach management
 Environmental Problems in Coastal Regions VI 237 Low-crested offshore breakwaters: a functional tool for beach management K. Spyropoulos & E. Andrianis TRITON Consulting Engineers, Greece Abstract Beach
Currents measurements in the coast of Montevideo, Uruguay
 Currents measurements in the coast of Montevideo, Uruguay M. Fossati, D. Bellón, E. Lorenzo & I. Piedra-Cueva Fluid Mechanics and Environmental Engineering Institute (IMFIA), School of Engineering, Research
Julebæk Strand. Effect full beach nourishment
 Julebæk Strand Effect full beach nourishment Aim of Study This study is a part of the COADAPT funding and the aim of the study is to analyze the effect of beach nourishment. In order to investigate the
Preliminary Wake Wash Impact Analysis Redwood City Ferry Terminal, Redwood City, CA
 Technical Memorandum Preliminary Wake Wash Impact Analysis Redwood City Ferry Terminal, Redwood City, CA 1. Introduction The following preliminary wake wash impact analysis was initiated by the Port of
Using sea bed roughness as a wave energy dissipater
 Island Sustainability II 203 Using sea bed roughness as a wave energy dissipater T. Elgohary 1, R. Elgohary 1 & M. Hagrass 2 1 Department of Civil Engineering (Irrigation and Hydraulic), The Tenth of Ramadan
Implications of proposed Whanganui Port and lower Whanganui River dredging
 PO Box 637 Wanganui 4540 Attention: Rowan McGregor Dear Rowan 1 Summary We understand that it has been proposed to bring large vessels into the Port at Whanganui requiring the excavation of a channel up
Model Test Setup and Program for Experimental Estimation of Surface Loads of the SSG Kvitsøy Pilot Plant from Extreme Wave Conditions
 Model Test Setup and Program for Experimental Estimation of Surface Loads of the SSG Kvitsøy Pilot Plant from Extreme Wave Conditions according to Co-operation Agreement (phase 4) between WAVEenergy (Norway)
Wave-dominated embayed beaches. Andrew D Short School of Geosciences University of Sydney
 Wave-dominated embayed beaches Andrew D Short School of Geosciences University of Sydney Wave-dominated embayed beaches wave-dominated beaches embayed beaches morphodynamics of W-D embayed beaches circulation,
Shoreline Response to an Offshore Wave Screen, Blairgowrie Safe Boat Harbour, Victoria, Australia
 Shoreline Response to an Offshore Wave Screen, Blairgowrie Safe Boat Harbour, Victoria, Australia T.R. Atkins and R. Mocke Maritime Group, Sinclair Knight Merz, P.O. Box H615, Perth 6001, Australia ABSTRACT
Wave Transformation Modeling with Bottom Friction Applied to the Southeast Oahu Reefs. Mary A. Cialone and Jane McKee Smith
 Wave Transformation Modeling with Bottom Friction Applied to the Southeast Oahu Reefs Mary A. Cialone and Jane McKee Smith Outline Objective Study Area STWAVE Friction Formulations Model Validation Summary
Advanced Series on Ocean Engineering - Volume 14 COASTAL STABILIZATION. Richard Silvester John R C Hsu. \v? World Scientific
 Advanced Series on Ocean Engineering - Volume 14 COASTAL STABILIZATION Richard Silvester John R C Hsu \v? World Scientific Contents PREFACE xv 1 INTRODUCTION 1 /. / Coastal Environment 2 J.2 State of Beach
CMS Modeling of the North Coast of Puerto Rico
 CMS Modeling of the North Coast of Puerto Rico PRESENTED BY: Dr. Kelly Rankin Legault, Ph.D., P.E. 1 Dr. Alfredo Torruella, Ph.D. 2 1 USACE Jacksonville District 2 University of Puerto Rico October 2016
Coastal Sediment Transport Modeling Ocean Beach & San Francisco Bight, CA
 1 Coastal Sediment Transport Modeling Ocean Beach & San Francisco Bight, CA Honghai Li and Lihwa Lin Engineering Research and Development Center U.S. Army Corps of Engineers Frank Wu, Lisa Andes, and James
Nearshore Morphodynamics. Bars and Nearshore Bathymetry. Sediment packages parallel to shore, that store beach sediment
 Nearshore Morphodynamics http://coastal.er.usgs.gov/bier/images/chandeleur-xbeach-lg.jpg Bars and Nearshore Bathymetry Sediment packages parallel to shore, that store beach sediment Can be up to 50 km
6/19/2006 The Reef Ball Foundation 1
 6/19/2006 The Reef Ball Foundation 1 Overview Reef Balls are prefabricated concrete modules used as a base for natural coral reefs to form. Reef Balls have been used in 55 countries in over 3,500 projects
PHYSICAL AND NUMERICAL MODELLING OF WAVE FIELD IN FRONT OF THE CONTAINER TERMINAL PEAR - PORT OF RIJEKA (ADRIATIC SEA)
") PHYSICAL AND NUMERICAL MODELLING OF WAVE FIELD IN FRONT OF THE CONTAINER TERMINAL PEAR - PORT OF RIJEKA (ADRIATIC SEA) DALIBOR CAREVIĆ (1), GORAN LONČAR (1), VLADIMIR ANDROČEC (1) & MARIN PALADIN (1) 1.
PHYSICAL AND NUMERICAL MODELLING OF WAVE FIELD IN FRONT OF THE CONTAINER TERMINAL PEAR - PORT OF RIJEKA (ADRIATIC SEA) DALIBOR CAREVIĆ (1), GORAN LONČAR (1), VLADIMIR ANDROČEC (1) & MARIN PALADIN (1) 1.
BYPASS HARBOURS AT LITTORAL TRANSPORT COASTS
 BYPASS HARBOURS AT LITTORAL TRANSPORT COASTS by K. Mangor 1, I. Brøker 2, R. Deigaard 3 and N. Grunnet 4 ABSTRACT Maintaining sufficient navigation depth in front of the entrance at harbours on littoral
Undertow - Zonation of Flow in Broken Wave Bores
 Nearshore Circulation Undertow and Rip Cells Undertow - Zonation of Flow in Broken Wave Bores In the wave breaking process, the landward transfer of water, associated with bore and surface roller decay
A Preliminary Review of Beach Profile and Hardbottom Interactions
 A Preliminary Review of Beach Profile and Hardbottom Interactions Douglas W. Mann, P.E., D.CE. CB&I A World of Solutions Presentation Goal Lead to a better understanding of the challenges regarding the
Comparisons of Physical and Numerical Model Wave Predictions with Prototype Data at Morro Bay Harbor Entrance, California
 Comparisons of Physical and Numerical Model Wave Predictions with Prototype Data at Morro Bay Harbor Entrance, California by Robert R. Bottin, Jr. and Edward F. Thompson PURPOSE: This Coastal and Hydraulics
Aalborg Universitet. Estimation of wave conditions at Liseleje location Bogarino, Bruno; Brorsen, Michael. Publication date: 2007
 Aalborg Universitet Estimation of wave conditions at Liseleje location Bogarino, Bruno; Brorsen, Michael Publication date: 27 Document Version Publisher's PDF, also known as Version of record Link to publication
Beach profile surveys and morphological change, Otago Harbour entrance to Karitane May 2014 to June 2015
 Beach profile surveys and morphological change, Otago Harbour entrance to Karitane May 2014 to June 2015 Prepared for Port Otago Ltd Martin Single September 2015 Shore Processes and Management Ltd Contact
Overview. Beach Features. Coastal Regions. Other Beach Profile Features. CHAPTER 10 The Coast: Beaches and Shoreline Processes.
 Overview CHAPTER 10 The Coast: Beaches and Shoreline Processes Coastal regions constantly change. The beach is a dominant coastal feature. Wave activity continually modifies the beach and coastal areas.
Simulation of hydraulic regime and sediment transport in the Mekong delta coast
 Simulation of hydraulic regime and sediment transport in the Mekong delta coast 1. Introduction Coastal erosion in the Mekong Delta has been recorded in recent years and the erosion rate has been increasing
Compiled by Uwe Dornbusch. Edited by Cherith Moses
 REPORT ON WAVE AND TIDE MEASUREMENTS Compiled by Uwe Dornbusch. Edited by Cherith Moses 1 Aims...1 2 Summary...1 3 Introduction...1 4 Site selection...1 5 Wave recorder settings...2 6 Results...2 6.1 Water
Figure 1. Schematic illustration of the major environments on Mustang Island.
 STOP #1: PACKERY CHANNEL BEACH TO BAY We will start this field guide near the north jetty of Packery Channel and hike across the island to Corpus Christi Bay (fig. 1). The island emerges from the Gulf
LOCALLY CONCENTRATED SEVERE BEACH EROSION ON SEISHO COAST CAUSED BY TYPHOON T0709
 F-4 Fourth International Conference on Scour and Erosion 2008 LOCALLY CONCENTRATED SEVERE BEACH EROSION ON SEISHO COAST CAUSED BY TYPHOON T0709 Yoshimitsu TAJIMA 1 and Shinji SATO 2 1 Member of JSCE, Associate
SHORELINE EVOLUTION DUE TO HIGHLY OBLIQUE INCIDENT WAVES AT WALVIS BAY, NAMIBIA
 SHORELINE EVOLUTION DUE TO HIGHLY OBLIQUE INCIDENT WAVES AT WALVIS BAY, NAMIBIA Berry Elfrink, 1 Gordon Prestedge 2, Cesar B.M. Rocha 3, and Jørgen Juhl 4 Abstract: This paper describes the development
Comparison of Predicted and Measured Shoaling at Morro Bay Harbor Entrance, California
 Comparison of Predicted and Measured Shoaling at Morro Bay Harbor Entrance, California by Edward F. Thompson, Inocencio P. DiRamos, and Robert R. Bottin, Jr. PURPOSE: This Coastal and Hydraulics Engineering
The Continuing Evolution of the New Inlet
 The Continuing Evolution of the New Inlet Charles N. Flagg, Roger Flood and Robert Wilson School of Marine and Atmospheric Sciences, Stony Brook University It is now a year plus since super storm Sandy
(Refer Slide Time: 0:36)
") Port and Harbour Structures. Professor R. Sundaradivelu. Department of Ocean Engineering. Indian Institute of Technology, Madras. Module-2. Lecture-8B. Wave Rose Diagram. (Refer Slide Time: 0:36) We will
Port and Harbour Structures. Professor R. Sundaradivelu. Department of Ocean Engineering. Indian Institute of Technology, Madras. Module-2. Lecture-8B. Wave Rose Diagram. (Refer Slide Time: 0:36) We will
Chapter 10 Lecture Outline. The Restless Oceans
 Chapter 10 Lecture Outline The Restless Oceans Focus Question 10.1 How does the Coriolis effect influence ocean currents? The Ocean s Surface Circulation Ocean currents Masses of water that flow from one
Natural Bridges Field Trip Activity
 Natural Bridges Field Trip Activity This is due in class on MONDAY- March 1 - not in sections! Name TA: NOTE ON THE GRADING OF THIS ASSIGNMENT: Many of the questions below (especially in the tidepool part)
LAKKOPETRA (GREECE) EUROSION Case Study. Contact: Kyriakos SPYROPOULOS. TRITON Consulting Engineers. 90 Pratinou Str Athens (GREECE)
 EUROSION Case Study. Contact: Kyriakos SPYROPOULOS. TRITON Consulting Engineers. 90 Pratinou Str Athens (GREECE)") LAKKOPETRA (GREECE) Contact: Kyriakos SPYROPOULOS TRITON Consulting Engineers 90 Pratinou Str. 11634 Athens (GREECE) Tel: +32 10 729 57 61 Fax: +32 10 724 33 58 e-mail: kspyropoulos@tritonsa.gr 19 1 1.
LAKKOPETRA (GREECE) Contact: Kyriakos SPYROPOULOS TRITON Consulting Engineers 90 Pratinou Str. 11634 Athens (GREECE) Tel: +32 10 729 57 61 Fax: +32 10 724 33 58 e-mail: kspyropoulos@tritonsa.gr 19 1 1.
Legal, scientific and engineering aspects of Integrated Coastal Zone Management (ICZM) in Poland
 in Poland") Gdańsk, March 21 st 2013 Legal, scientific and engineering aspects of Integrated Coastal Zone Management (ICZM) in Poland Rafał Ostrowski Institute of Hydro-Engineering of the Polish Academy of Sciences
Gdańsk, March 21 st 2013 Legal, scientific and engineering aspects of Integrated Coastal Zone Management (ICZM) in Poland Rafał Ostrowski Institute of Hydro-Engineering of the Polish Academy of Sciences
Artificial headlands for coastal restoration
 Artificial headlands for coastal restoration J. S. Mani Professor, Department of Ocean Engineering, Indian Institute of Technology Madras, Chennai 636, India Abstract Construction of a satellite harbour
HYDRODYNAMICS AND MORPHODYNAMICS IN THE SURF ZONE OF A DISSIPATIVE BEACH
 HYDRODYNAMICS AND MORPHODYNAMICS IN THE SURF ZONE OF A DISSIPATIVE BEACH Leo C. van Rijn, Dirk Jan R. Walstra, Bart T. Grasmeijer and Kees Kleinhout Abstract: Two profile models have been compared with
Undertow - Zonation of Flow in Broken Wave Bores
 Lecture 22 Nearshore Circulation Undertow - Zonation of Flow in Broken Wave Bores In the wave breaking process, the landward transfer of water, associated with bore and surface roller decay within the
WAVE FORECASTING FOR OFFSHORE WIND FARMS
 9 th International Workshop on Wave Hindcasting and Forecasting, Victoria, B.C. Canada, September 24-29, 2006 WAVE FORECASTING FOR OFFSHORE WIND FARMS Morten Rugbjerg, Ole René Sørensen and Vagner Jacobsen
Shoreline Studies Program, Department of Physical Sciences, VIMS
 Living Shoreline Training Class 2017 1 Demonstration sites discussed in this talk. 2 A shoreline management plan for the entire creek made conceptual shoreline management recommendations along every stretch
Lee E. Harris, Ph.D., P.E. Assoc. Professor of Ocean Engineering. Doug Bowlus and Ashley Naimaster Ocean Engineering Graduate Students
 FLORIDA TECH OCEAN ENGINEERING PROFESSOR LEE HARRIS AND HIS GRADUATE STUDENTS ASSIST WITH POST-HURRICANE IVAN CORAL REEF RESTORATION IN THE CAYMAN ISLANDS Lee E. Harris, Ph.D., P.E. Assoc. Professor of
CALCULATIONS OF THE MOTIONS OF A SHIP MOORED WITH MOORMASTER UNITS
 CALCULATIONS OF THE MOTIONS OF A SHIP MOORED WITH MOORMASTER UNITS By J. de Bont 1, W. van der Molen 2, J. van der Lem 3, H. Ligteringen 4, D. Mühlestein 5 and M. Howie 6 ABSTRACT Container ships should
Impacts of breakwaters and training walls
 Across the eastern seaboard of Australia, breakwaters and training walls have instigated fundamental perturbations to coastal and estuary processes. This has induced long-term changes to foreshore alignments,
Nearshore waveclimate
 Advisory and Research Group on Geo Observation Systems and Services Methods and validation of the nearshore branch of waveclimate.com P. Groenewoud, C.F. de Valk - ARGOSS G. Klopman - Albatros Flow Research
An Update of Coastal Erosion in Puerto Rico
 Jack Morelock and Maritza Barreto An Update of Coastal Erosion in Puerto Rico Department of Marine Sciences, University of Puerto Rico at Mayagüez and Geography Department, University of Puerto Rico at
ABSTRACT. KEY WORDS: Navigation safety; numerical modeling; waves; current; sediment transport; channel infilling; morphology change.
 The 25th (2015) International Polar and Engineering Conference Li, H., L. Lin, Z. Demirbilek, T. M. Beck, and H. R. Moritz (2015). Wave-Current Conditions and Navigation Safety at an Inlet Entrance. The
OCEAN WAVES NAME. I. Introduction
 NAME OCEAN WAVES I. Introduction The physical definition of a wave is a disturbance that transmits energy from one place to another. In the open ocean waves are formed when wis blowing across the water
Bay County, MI Coastal Hazard Analysis Flood Risk Review Meeting. May 14, 2018
 Bay County, MI Coastal Hazard Analysis Flood Risk Review Meeting May 14, 2018 Agenda Introductions Coastal Flood Risk Study and Mapping Program Current Status Technical Overview of Study and Mapping Floodplain
COMPARISON OF DEEP-WATER ADCP AND NDBC BUOY MEASUREMENTS TO HINDCAST PARAMETERS. William R. Dally and Daniel A. Osiecki
 COMPARISON OF DEEP-WATER ADCP AND NDBC BUOY MEASUREMENTS TO HINDCAST PARAMETERS William R. Dally and Daniel A. Osiecki Surfbreak Engineering Sciences, Inc. 207 Surf Road Melbourne Beach, Florida, 32951