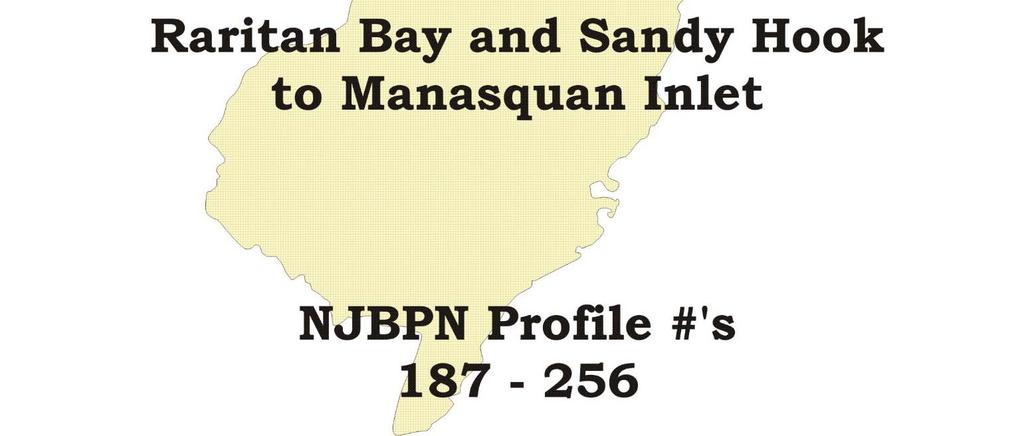
Figure 1. Survey site locations in Monmouth County.
|
|
|
- Kathlyn Merritt
- 5 years ago
- Views:
Transcription

1 6

2 Figure 1. Survey site locations in Monmouth County. 7
3 Individual Site Descriptions: The restoration of the Sea Bright shoreline was essentially complete by the fall 2013 survey. The NY Corps District returned to the original borrow zone offshore to extract sand for the work. The beaches along Raritan Bay were badly eroded, but some recovery has been documented. The New York District Corps of Engineers (ACOE) undertook multiple efforts in restoration. The Asbury Park Press reported that $36.9 million was spent placing 900,000 cu. yds. of new sand along the Keansburg Raritan Bay shoreline, along with 2.1 million cu. yds. ($25.6 million) placed between Sea Bright and Monmouth Beach. Long Branch received 3.3 million cu. yds. ($40.1 million), Asbury Park to Manasquan was enhanced with the placement of 2.3 million cu. yds. ($43.6 million). This effort was 100% federally funded under Public Law passed by Congress in In addition, the impediments to continuing the ACOE project between Long Branch (Elberon to Loch Arbor) and Asbury Park have been resolved and later in 2014 work will commence placing an initial shore protection project between the two earlier efforts. This will not be 100% federally funded, but revert back to 65% federal and 35% State and local (NJ splits these costs 75-25% with the local municipalities on a prorated shoreline proportional cost of the entire project). This year, the focus was put on the degree, style and percentage in recovery from the damage to the beach and dune system brought on by Hurricane Sandy October 29-30, TABLE 1 Monmouth County Sand Volumes & Shoreline Changes Due to Sandy LOCATION Beach Loss Gain Offshore Shoreline Beach Recovery Offshore Shoreline Percent Percent Percent During Sandy fm Sandy Storm Retreat by Fall 2013 Transfer to Bch Advance Bch Recovery Offshore loss Shoreline cu yds/ft. cu yds/ft. feet cu yds/ft. cu yds/ft. feet cu yds/ft. cu yds/ft. feet Highlands Beach ACOE Work % no data 115% Via Ripa ACOE Work % no data 70% Shrewsbury Way ACOE Work % no data 23% Sea Bright Public Beach ACOE Work % no data 664% Municipal Beach ACOE Work % no data 607% Sunset Court ACOE Work % no data 989% Cottage Road ACOE Work % no data 452% Monmouth Beach Club ACOE Work % no data 167% 177 Ocean Avenue % 396% -134% Seven Presidents Park % 69% 29% Broadway Avenue % 398% 47% Morris Avenue % 86% 38% West End Avenue % 96% 78% 805 Ocean Avenue (site moved) % 51% -113% Pullman Avenue % 43% 533% Roosevelt Avenue % 120% 244% Darlington Avenue % 36% 53% Allenhurst % 590% 85% 7th Ave Asbury Park % 133% 33% 3rd Ave Asbury Park % 123% 81% Ocean Grove % 88% 64% Bradley Beach % 85% 58% Avon By the Sea % 116% 93% 5th Ave Belmar % 142% 90% 18th Ave Belmar % 162% 107% Brighton Spring Lake % 68% 103% Salem Ave Spring Lake % 340% 47% NY Ave Sea Girt % 112% 58% Trenton Ave Sea Girt % 37% 30% Riddle Way Manasquan % 57% -25% Pompano Ave Manasquan % 54% 77% Average Volume Changes % 101.4% 62.0% Each cross section was examined from prior to Sandy to the survey after the storm and to October 2013 data. The objective is shown above in the average sand volume losses at the beach, deposition offshore and the percentage of the year later recovery represents of those initial losses. The NY District ACOE had started 8
4 restoration from Monmouth Beach north into Sea Bright, so beach recovery is shown in high percentage recovery numbers. However, it is interesting to note that even for Hurricane Sandy, with data from the hardest hit NJ shoreline, a year after the storm the Monmouth County beaches recovered an average of 60.1% of the beach sand lost, 62.0% of the shoreline retreat was regained as a result of 101.4% transfer of the sand deposited offshore during the storm back to the beach. The value greater than 100% of the deposit sand volume documented is largely due to the fact that swimmer surveys do not go far enough out to sea to cover all sediment transport seaward deposited in between 15 and 18 feet of depth. Sand will slowly return from deeper water and the 101.4% value proves that point. Over the next four years, absent another storm of equal intensity, one could expect to see about 150% return of sand the CRC documented as deposited offshore as material carried further seaward slowly migrates landward. The fact that the ACOE has completed restoration from Sandy Hook to Manasquan River Inlet does complicate this evaluation going forward. It is however, a point to make that even intense storms do see a prolonged period of sand recovery in both beach/dune volume and shoreline positions. Cliffwood Park, Aberdeen; #187 This is a small County Park, established shortly before surveying commenced in The shoreline faces north, northeast into Raritan Bay and is subject to a significant wave fetch across the bay. Hurricane Sandy transported the entire dune landward into the parking and access areas for the park. Between December 2012 and April 2013 this sand was relocated back to the beach and shoreline and by October 2013 a small dune had begun to form at the center of the original feature (March 2012 survey). By the fall of 2013 this site had lost yds 3 /ft. with an 8.4 foot shoreline retreat largely the result of Sandy. The summer of 2013 produced little net recovery in either sand volume or shoreline position. Union Beach; #286 The Union Beach site is now located in the middle of the municipal bathing beach on Raritan Bay. Formerly, positioned about 1,000 feet south along the bayshore, the old site was hardened with rock revetment over ten years ago and this effort virtually eliminated any change above low tide. The site was moved to provide more meaningful data on bay beach changes. Hurricane Sandy pushed sand landward beyond the parking lot, but did not severely affect the shoreline position. Between April and October 2013 just over 12 yds 3 /ft. of new sand was placed on the beach to approximately the elevation of high tide. The sand came from Amboy Aggregates funded by Union Beach in the amount of 14,000 cubic yards and the placement method was by truck. Spy House Museum, Port Monmouth; #185 The easternmost site along the Monmouth County Raritan Bay shoreline is positioned west of Highlands and Atlantic Highlands at a Monmouth County Park site dedicated to an historic building dating to the revolution. Significant shore rehabilitation work preceded Hurricane Sandy and served to absorb some of the impact. This new work had a positive impact in that little erosion took place during the storm, but no recovery or added sand has appeared since Hurricane Sandy. Gunnison Beach, Sandy Hook National Seashore; #285 Three additional cross sections were established 18 years ago to collect data on sand volumes being added to the National Seashore. Gunnison Beach is the northernmost site, but still a substantial distance south of the tip of Sandy Hook spit. Access to the shoreline further north is restricted by limited roads. Sandy s storm waves sliced over 40 yds 3 /ft. from the active beach, did not transport much of that material onto the wide, normally dry 9
5 beach and appeared to deposit yds 3 /ft. directly offshore within 350 feet of the low tide line. Since then onshore transport has moved yds 3 /ft. back onto the dry beach such that the Fall 2013 beach portion of the profile almost exactly duplicates the pre-sandy situation. Parking Lot E, Sandy Hook National Seashore; #284 This public bathing beach was selected because it was located in the middle of Sandy Hook and represented both a public use area and an easy access point to conduct surveys. Sandy obliterated the dune at the site, washing the material landward. Sand was pushed back to generate a small, narrow dune more landward than the original. This was added to by the fall of 2013 with additional reclaimed sand. The beach and offshore segments gained material advancing the shoreline 56 feet and adding 68 yds 3 /ft. to the sand volume. Highlands Beach, Sandy Hook National Seashore; #184 The southern site was initially established as the terminal location for the oceanfront beaches because it was felt that the Federal shoreline was not a State responsibility. After almost a decade of work it seemed obvious that the rest of Sandy Hook needed to be covered if only to understand what transpired along the Sea Bright beach section. The sand deposited at the seawall was stripped away during Sandy and the shoreline retreated 46 feet as well. A year later some recovery had occurred prior to the NY Corps District completing the Monmouth County shoreline restoration (October 2013 survey). This added yds 3 /ft. with a 36-foot shoreline advance documented. Via Ripa, Sea Bright; #183 This northern location lies just south of the bridge to Atlantic Highlands across the entrance into the Shrewsbury and Navesink Estuaries. Hurricane Sandy severely reduced the beach volume, but did deposit abundant sand offshore ( yds 3 /ft. from the beach, depositing yds 3 /ft. offshore). Since Nov 26, 2012 natural recovery added yds 3 /ft. to the beach as yds 3 /ft. moved landward. The Army Corps project added 43.1 yds 3 /ft. to the beach producing a shoreline position almost equal to pre-sandy conditions. Shrewsbury Way, Sea Bright; #282 This site was the only northern Monmouth County site along Phase I Federal project that had exceeded the initial sand volume placed on the beach (116%). Even so, the storm waves broke over the Sea Bright seawall as they ramped up the sand against the rocks allowing wave run-up to crest the 28-foot wall. The beach profile was cut by yds 3 /ft. and the shoreline retreated 88 feet during Sandy. Natural recovery shifted some sand back to the beach from offshore, but the site continued to lose sand volume from the beach ( yds 3 /ft.). The Army Corps project restored sand to the beach, but the shoreline falls 156 feet short of the pre-sandy conditions. Sea Bright Public Beach, Sea Bright; #182 The next location north was obtained by NJ State purchase 25 years ago and converted into a public bathing area with some off-street parking. There was a modest dune at the toe of the rocks, but the waves ramped up and over the rocks using that sand as a deposit forming the ramp. In addition there was a timber bulkhead protecting a 20-foot wide gap in the rock seawall at this location. Sandy blew through the timber section and poured into Ocean Avenue with sand, debris and lots of salt water. This compounded the water coming in from Raritan Bay making flooding the worst ever recorded. This beach contained 98% if the initial Federal project s 10
6 fill material as of fall No dune existed other than grass growing at the toe of the rock seawall. The federal project was complete at this side by March 2013 with some berm adjustment occurring over the summer. The current shoreline lies 62 feet seaward of the pre-sandy conditions. Sea Bright Municipal Beach; #181 The peninsula widens here to include commercial businesses on both sides of Ocean Avenue plus parking for the beach. However, no rock seawall extended across a gap at the municipal beach. An ancient timber bulkhead was the back shot position for the survey and it had gaps cut in it to allow easy public access to the beach. The resulting storm wave damage and tidal flooding was intense and destruction was wide spread and devastating. Sand was hauled back to create a sizable dune ridge by March 2013 and some material was added to the post-sandy beach as well. The federal project shows dramatically as a yds 3 /ft. wedge of sand added to the beach by October 2013 advancing the shoreline 104 feet beyond that present prior to Sandy. No dune was constructed as of the October 2013 survey. Sunset Court, Sea Bright; #180 The next location north of Cottage Road maintained 45% of the initial sand volume placed in The repeated deposition of maintenance material at Cottage Road moved north through this location. There was no dune, other than grass here and there among the rocks of the seawall. Storm waves over-topped the wall in quantity and caused flooding. Sand appeared offshore in quantity as material was pumped onto the beach by the Federal project (82.94 yds 3 /ft.). More material was added to the outer beach by October 2013 (39.92 yds 3 /ft.) pushing the shoreline 65 feet further seaward from the March 2013 position. Cottage Road, Monmouth Beach; #179 The Cottage Road location has been the Hot Spot erosion area in an otherwise very successful Federal beach restoration project. Here a massive stone groin was privately built decades ago to restrict sand movement north from the beach fronting a private beach club from the 19 th Century. The groin obviously serves its intended purpose, but to the detriment of the Federal beach project s durability just north of the groin. The Cottage Road site commenced losing sand as soon as it was completed. Losses were replaced in 1997, 1999, 2001, and modest sand volume was added in 2010 from Shrewsbury River dredging. There was only a narrow, dry beach that gets wet to the rocks under normal wave action at high tide. Just prior to Sandy the construction of a 2012 restoration had started here and was moving northward. Sandy barreled over the seawall, dumping many thousands of tons of seawater into the highway making storm surge flooding worse. The post-storm survey in late March 2013 showed even more loss at the low tide line. By October 2013 a restoration had occurred where the berm was regenerated at elevation 10.0 feet and extending 500 feet from the seawall at that elevation. The spring to fall 2013 survey comparison found a shoreline advance of 293 feet due to the placement by the ACOE of yds 3 /ft. in new sand. Monmouth Beach Club, Monmouth Beach; #178 The Valentine Street site is located on the premises of the venerable Monmouth Beach Club with the survey starting point in the landward segment of the timber deck overlooking the seawall. Destroyed by the storm, this site has been rebuilt and the sand replaced to the initial federal project specifications. The dimensions of sand placement between March and October of 2013 is an impressive yds 3 /ft. with a 231-foot shoreline advance seaward. 11
7 Ocean Avenue Long Branch; #177 This site was once a USO non-commissioned officer s beach recreation area for Fort Monmouth personnel. Presently part of the Seven-Presidents Park system belonging to Monmouth County, this site saw severe erosion during Sandy, followed by further losses offshore as some sand moved landward by March The federal sand placement project was underway to the south in Long Branch, but had not impacted this location as of October Seven Presidents Park, Long Branch; #176 This site was converted into open parkland space 25 years ago with the purchase of all commercial and private buildings near the waterfront. The area has 25 foot dunes with several prominent gaps to allow public easy access to the beach. The Federal project was completed here in 1999 and 74% of the initial sand placed was still present in October The cross section is located at the southern gap in the dunes, so storm damage in the form of abundant sand washed landward into the parking lot was evident. The storm damage is seen between the fall 2012 and spring 2013 surveys because the site was done prior to the hurricane. Some transfer of sand from offshore onto the beach occurred by October Broadway Avenue, Long Branch; #175 Here the Corps project beach was at 79% of the as-built sand volume in the fall of Sandy s waves rolled across this beach as well and impacted the steel wall protecting the bluff. Water crashed down on the paved promenade without incident and cascaded into the new development causing minor flooding and damage. The storm transferred sand offshore between the early October 2012 and March 2013 surveys with yds 3 /ft. deposited on the beach from a loss seen offshore of yds 3 /ft. by the time of the October 2013 survey. Morris Avenue, Long Branch; #174 This site is positioned along the old Long Branch beachfront along the former Ocean Avenue now reduced to a promenade. Sandy took the boardwalk away at the top of the bluff above the rock seawall. Since the storm sand moved landward from offshore regenerating the beach to that present just prior to the hurricane. Once again, the Corps program did not start until after the October 2013 survey date so all changes shown are natural. The pre-storm survey occurred in October 2012, so the comparison is between that and the spring 2013 survey. The post-storm transfer of sand back to the beach took about a year, but the ACOE plan calls for a complete restoration to the original design specifications. West End Avenue, Long Branch; #173 Located near the southern end of Phase I within the NY District Corps of Engineers Monmouth County beach restoration project, this site has a rock revetment protecting the base of the bluff, with the boardwalk positioned at the edge of the bluff some 15 feet above the revetment. In 1999 the initial beach replenishment was completed giving this location a 250-foot wide beach, but no dune was included. Sandy rolled over the beach and struck the revetment with massive force tearing out the bluff under and the boardwalk over the grass strip. The erosion extended to the concrete curbing bordering the old roadway. Water damage existed on properties landward of the roadway as evidenced by debris and sand deposits. This site recovered in a similar pattern to the other Long Branch sites. Surveys prior to the storm were completed in October 2012, so the spring 2013 coverage shows the extensive beach erosion and the transport of sand offshore. The October 2013 survey shows a relatively complete reversal to the pre-sandy cross section by a year later. Sand did not return to the 12
8 upper bluff however, the boardwalk position is gone and any replacement would have to be located on the old roadway, which was the original southbound roadway of a former four-lane Ocean Avenue along this segment. Lake Tackanassee, Long Branch; #272 This new cross section designed to replace original site #172 abandoned years ago was positioned just south of a series of major condominium complexes between West End Avenue and the Lake. This is the northernmost estuary lake along the Monmouth County shoreline and, like the others has a fresh water drainage system constricted at the shoreline by a bay-mouth barrier. There is no bluff here, so the storm waves simply rolled over everything in their path into the lake where Ocean Avenue crosses it on a bridge. An historic life-saving station converted to a bathing complex was utterly destroyed. All traces of the beach survey established two years ago were gone, so the site was navigated to using the GPS coordinates for the reference monuments. The profile ran up-grade to a point where the slope reversed down-grade seaward into the water. It was necessary to relocate the profile to the south, further from the condominium s parking lot retaining bulkhead, so the post- Sandy cross sections appear to be dramatically different in backshore orientation and elevation. This is real and unavoidable. All changes since the storm were variations in cross shore sediment transfers leading to some beach accumulation, but no net change to be concerned about. This phase of the NY District shore protection project is scheduled to start in late 2014 or early Pullman Avenue, Elberon; #171 The single cross section located in Elberon at Pullman Avenue demonstrated the susceptibility of even the high bluff located here (28 feet NAVD88) to major erosion from the storm surge and waves generated by Hurricane Sandy. Homes built at the bluff edge were destroyed by waves with about a third of each lot s width inland gone. The rock revetment and timber wall account for about 40% of the bluff height and were unaffected. Apparently waves broke on the revetment with crests at least 35 feet high because both homes were smashed in on the seaward side. This was not from wave spray on impact with the fortifications. The end of Pullman Avenue was eroded landward by about 50 feet. This is clearly illustrated in the cross sections where the bluff lost yds 3 /ft. in Cretaceous-aged sediment due to the storm. Deposition occurred offshore where yds 3 /ft. of beach and bluff material was deposited. The scour at the base of the rock revetment protecting this coast was extensive taking sand to -10-foot elevations (as recorded with the Jan 13, 2013 survey 2.5 months later). Since then sand moved back landward, first by the spring 2013 survey back to the pre-sandy elevations, then by the fall 2013 survey, depositing a dry sand beach over half way up the revetment adding yds 3 /ft. of new material and creating the best beach ever recorded at this location since Roosevelt Avenue, Deal #170; The Roosevelt Avenue site is located north of the Deal sewage pumping station built in 1906 at the base of the sedimentary bluff. It is essentially a three-story building with just the top story presented at the end of Roosevelt Avenue. South of this street is a series of private homes built on the bluff with a decent sand beach seaward of the dune-mantled bluff edge. Phillips Avenue is the location of a public bathing complex that was totally destroyed by the loss of the Phillips Avenue fishing pier built decades ago over the rock groin at the end of Phillips Avenue. North of Roosevelt Avenue there is essentially no dry beach between closely-spaced groins. Site #170 has a 26-year history of a wet beach against the rocks. Occasional offshore bars have migrated to the shoreline yielding a temporary dry beach less than 25 feet in width. Sandy s waves over-topped the rock wall and scoured deeply into the soil, fill debris (bricks etc.) and bluff sediments. Since Sandy the beach sand excavated at the base of the rock revetment and carried offshore has slowly returned so that the 13
9 spring 2013 survey found that the sand profile closely matched the pre-sandy condition. However, more material moved landward so that by October 2013 a dry beach was present at the base of the rocks as sand added to that deposited during the first few months following Hurricane Sandy. Southern Deal; Deal is divided from Allenhurst by a massive boxed pair of groins that retain all sand on the Allenhurst beach, letting none past to the north. The Darlington Avenue site is about a mile north into Deal and was picked because there was a pocket beach centered at Darlington Avenue extending several blocks in either direction. The sediment bluff, once exposed 25 years ago had been armored by individual property owners over time with timber bulkhead seawalls. The beach varied little over time. The wave forces over-matched the newer timber structures smashing them to rubble and exposing an erosional scarp in the bluff sediments. The spring 2013 survey shows the upper bluff sediment loss with a post-sandy beach profile far below that seen in October 2012 just prior to the storm. By the fall 2013 survey approximately half the sand present prior to Sandy had returned from offshore. Allenhurst Loch Arbor; The site #168 at Allenhurst sits on top of an ancient concrete wall that drops vertically to the sand beach. There is a wooden walk elevated above the road just landward of the concrete wall. The boardwalk is 20 feet above sea level, behind a vertical concrete wall located about 100 feet from the low tide line on the beach. About 50 feet of the boardwalk was stripped from the supports and shifted toward the roadway with ample evidence that waves had moved across the lawns of the major houses further landward. There was a recovery berm and offshore bar along the entire segment between the Deal boundary groin and the Deal Lake flume. Loch Arbor is only a two-block shoreline with half a public beach and half in private ownership. There has been a long history of storm waves washing through the private beach club into Deal Lake. This clearly had occurred as the road across the estuary lake bay mouth barrier was still closed. Deal Lake is the largest of the now-closed stream estuaries along the Monmouth County shoreline. It has been mapped as open to the tide flow as late as 1880, but closed by There was no paved road across the bay mouth sand bar until after 1920 according to the earliest aerial photography. There is a sizable weir and boxed flume carrying freshwater seaward to drain the lake. This was still functioning though sand had spilled into the lake at the seaward end. No Federal Project sand was deposited along this short segment, but over the past 13 years material has escaped by the large terminal groin in Asbury Park enhancing this small reach. The April 2013 survey represents a post-sandy situation with a very narrow beach and deep scour offshore with sand extending beyond the range of these surveys to water 20 feet in depth. The spring 2013 to fall 2013 comparison shows that yds 3 /ft. was deposited on the beach to the concrete wall transferring much of that sand back to the beach without any human intervention. The zero elevation shoreline position advanced 106 feet seaward and the October 2013 cross section very closely resembles that present October 5, 2012 (except to the offshore portion where the pre-sandy conditions favored shallower water 400 feet seaward of the reference location; yds 3 /ft.). Asbury Park; Sites 267 & 167 The Federal project beach in Asbury Park had no dune, but the sand was ramped up to the elevation of the boardwalk. As a consequence, at both survey sites there was minor walk deck damage, some railings destroyed and the majority of the wave energy passed over the boardwalk into Ocean Avenue. Sand was in front of business establishments on the landward side of the boardwalk with flow at each street end. The impact of Hurricane Sandy can be seen with a comparison of the fall 2012 survey taken prior to Sandy with the spring 14
10 2013 cross section taken in April The beach at site 267 lost yds 3 /ft. while yds 3 /ft. were deposited offshore out to 915 feet from the reference into 17 feet of water. The shoreline retreated 81 feet in the process. By the fall of 2013, the shoreline had advanced 27 feet with yds 3 /ft. returned to the beach. At site #167 on Third Avenue, the same process repeated with a storm loss of yds 3 /ft. from the beach, an 84-foot shoreline retreat and sand moved well offshore beyond 17.6-foot depths (NAVD88). By October yds 3 /ft. had returned to the beach as yds 3 /ft. migrated onshore or to the south from the storm deposits seaward. The shoreline advanced 68 feet. Ocean Grove; Ocean Grove had severe damage to the beach and boardwalk focused to the south of Main Street. At Ocean Pathway the dune remained as did the large, open, but roofed seating area seaward of the boardwalk. The dune remained with the instrument monument about 1.5 feet from the scarp. The pre-sandy survey shows the beach/dune system just prior to the storm. The April 2013 profile shows a narrow beach, cut dune and a deposit over 2 feet thick for 300 feet offshore (the profile extends to 950 feet to an elevation of feet NAVD88). The April survey defined a storm loss of yds 3 /ft. on the beach, dune and near shore with yds 3 /ft. deposited offshore (94 feet of shoreline retreat). By the fall of yds 3 /ft. had recovered on the beach as yds 3 /ft. migrated landward (the shoreline advanced 60 feet in the process). Bradley Beach; The McCabe Avenue site had some damage, but fared better than most locations. The dunes did survive in places and kept the worst of wave impacts out of the Borough. Storm surge flooding did occur with damage to some structures and boardwalk sections. The storm-generated changes at the site saw the elimination of the dune, but less retreat on the beach, perhaps due to the extraction of the dune volume (25.33 yds 3 /ft. in sand volume taken above the elevation of 7.24 feet on the berm). The shoreline retreat was just 48 feet without a serious trough at the foot of the beach slope yds 3 /ft. was deposited offshore between and feet elevation offshore (816 feet from the reference). The recovery deposit seen in the April 2013 cross section amounted to 7.09 yds 3 /ft. extracted from overwash deposits on the uplands. Avon-by-the-Sea; Avon has one site located at Sylvania Avenue where damage to the boardwalk was extensive extending to the structures adjacent to the boardwalk. Sand occupied Ocean Avenue with evidence of wave damage to businesses on the far side of the roadway. Avon had a landscaped dune that did little to protect the infrastructure, so once the waves crossed the beach, there was little to prevent them from dissipating their energy on the infrastructure. Sand lost from the beach was carried inland, not deposited in a 2-foot thick wedge offshore. The recovered overwash material was pushed back onto the beach by the June survey date in 2013 producing most of the recovery evidenced. Little further recovery occurred between June and September Belmar; Sites 163 & 162 Belmar has two survey sites, one at 18 th Avenue and the second at 5 th Avenue near Shark River Inlet. The Belmar beach has a boardwalk between it and Ocean Avenue that suffered damage but was still largely present. Sand was in Ocean Avenue. The erosion is defined by the April 2013 survey data with some deep scour and offshore deposition in evidence at site #163, but there was less scour at site #162 and deposition offshore. Sand 15
11 recovery was vigorously pursued in moving the overwash deposition back to the beach and appears to have contributed to the overall recovery prior to the ACOE work in Spring Lake; Sites 161 & 160 Two cross sections located in Spring Lake showed that the dune, developed decades ago landward of the boardwalk, was also insufficient to protect the town landward of it. Storm wave up-rush went under the boardwalk, hit the dunes, was forced upward lifting the entire Spring Lake boardwalk off excellent concrete supports and eventually deposited most of it in Ocean Avenue. Hurricane Irene had previously damaged some of the structure the August previously in 2011, so the walk had recently been re-surfaced with composite decking. Large quantities of sand had been transported onto Ocean Avenue and down many side streets. Large scale damage to homes was not evident; however flooding by the water level was evident. The estuary lake (Lake Como) between Spring Lake and Belmar was likewise being both pumped out and excavated to locate and clear the drainage weir to the ocean. The October 2012 survey preceded the storm, so the comparison between that and the April 2013 survey defines the Sandy impacts. Nearshore and beach scour with deposition offshore beyond the limits of surveying occurred both places yds 3 /ft. lost from the beach and yds 3 /ft. gained offshore to a point 857 feet from the reference at an elevation of feet (NAVD88). Sea Girt Borough; Sites 159 & 158 Sea Girt is divided into two parts, each with a profile site. The southern site at Trenton Avenue typifies the coastal bluff with major homes and a wide, reasonably high dune landward of the boardwalk that protected the bluff face from erosion and kept the overwash out of the street ends. Some overwash had occurred at Trenton Avenue, but was well on its way to clean-up. The boardwalk had been damaged at Trenton Avenue, but otherwise survived. A dune had grown seaward of the boardwalk since the ACOE project, but it had been eroded away. The northern half is represented by the New York Avenue site #159 where a shore-parallel Ocean Avenue allows vehicle to park at the boardwalk and beach for public access. Homes exist across Ocean Avenue. Here there were incipient dunes built since Hurricane Irene in 2011, Sandy s waves washed over the beach, across the boardwalk and down the streets a block inland. Tidal flooding also entered by way of Wreck Pond, the second estuary lake north of Manasquan Inlet. New York Avenue lost yds 3 /ft. from the beach and nearshore. By the April 2013 a new dune had been placed on the beach using sand recovered from inland with a wider base, but about the same height. Deposition offshore amounted to yds 3 /ft. that was documented 936 feet seaward from the reference monument. Clearly the majority of the sand was further seaward because by September yds 3 /ft. had returned to the beach producing an 86-foot advance in the zero elevation position. The Trenton Avenue site saw similar erosion and deposition offshore ( yds3 lost from the beach and yds 3 /ft. gained offshore) with recovered sand positioned seaward of the boardwalk as a substantial restoration dune. Recovery saw yds 3 /ft. added to the beach as sand from offshore moved landward. The shoreline advanced 34 feet seaward in the process. Manasquan Borough; Sites 157 & 256 Manasquan is located at the southern limit of the NY District s massive Monmouth County beach restoration project and positioned just north of the Manasquan Inlet. Developed at the turn of the 20 th Century, many small homes populate the former primary dune between the ocean and First Avenue. Prior to the ACOE project, the 16
12 Borough had established a small dune system seaward of the paved promenade that is in front of the oceanfront homes This was primarily in response to the December 1992 northeast storm that last damaged the community. Litigation over the dune height, width and access pathways limited the enthusiasm for enlarging the dune s footprint in spite of the Borough s winning the litigation. Sandy broke through the dune line and passed over the promenade into the initial row of homes. Since there are frequently more than one dwelling between the promenade and First Avenue, a great deal of moderate damage was done as water, sand and debris were forced between the narrow passages between buildings. Vast amounts of sand and debris clogged First Avenue such that the oceanfront area was still closed to the public and barely passable on November 12, There are two cross sections in Manasquan. No promenade remained at Pompano Avenue (site #256) with tiny remnant dunes present at Riddle Way (site #157). A ridge of excavated sand had been built along the alignment of the promenade at the south end of the Borough Beach. At Riddle Way the dune was all but removed, but the promenade surface remained intact. The dune provided yds 3 /ft. of sand to the beach during the storm, but the beach lost and additional yds 3 /ft. as the offshore added yds 3 /ft. The shoreline retreated 24 feet. At the Pompano Avenue site (#256) the dune was removed as well as the entire promenade with most of the sand transported inland. A huge bar appeared offshore (59.36 yds 3 /ft. deposited). Since April 2013 only yds 3 /ft. has returned to the beach, but yds 3 /ft. of that deposit has moved elsewhere either landward or toward the Manasquan Inlet. 17


13 NJBPN 187 Beach Park, Cliffwood Beach This is the westernmost NJBPN site located on Raritan Bay. The photograph on the left shows the shoreline on December 13, The photo on the right, at low tide shows the new dune fence with a modest dune (taken on October 7, 2013). Figure 2. The site lost its dune with the material transported landward into the parking lot. Sand was hauled back to the beach, but the dune has yet to grow beyond a minor feature. Sandy s bay waves had no impact on the offshore section of this profile in spite of being far larger amplitude than normal. 18

14 NJBPN 286 Beach Street, Union Beach This site is located at the public bathing beach and was established in The photograph on the left shows the shoreline on November 13, The photo on the right shows the beach following addition of 14,000 cu. yds. of trucked in sand as a result of the municipality s efforts in replacing lost sand following Sandy (taken on October 7, 2013). Figure 3. The beach was essentially submerged by the storm surge with the smaller period bay fetch storm waves simply passing over it inland where they did the damage to structures without eroding the beach. Since there was no dune, there was no resistance. The wave depth effect is seen in the lack of alteration on the Raritan Bay floor by any event in 28 years of surveying. The State and Borough cooperated in placing 14,000 cubic yards of trucked-in sand on the beach by the fall of


15 NJBPN 185 Spy House, Port Monmouth This site was enhanced by adding slope protection to the eroding uplands bluff prior to Sandy. The photograph on the left shows the shoreline on December 13, The right picture was taken October 7, 2013 at a higher level of the tide. Figure 4. The newly armored bluff slope retained its integrity and did not fail. The beach changed little other then became a little lower (-0.88 yds 3 /ft. in lost sand volume over 18 months including Hurricane Sandy). 20
.")

16 NJBPN 285 Gunnison Beach, Sandy Hook National Seashore This is the northernmost ocean NJBPN survey site that has shown advances in the berm position since The photograph on the left shows a sand ridge in the process of attaching to the beach following Sandy (Jan. 22, 2013). By October 29, 2013 the sand was effectively added to the shoreline widening the beach another 100 feet. Figure 5. The Sandy loss volume migrated back onto the shoreline as a huge bar that returned the profile cross section to that seen prior to the storm yds 3 /ft. was added to the total sand volume since survey 44 in March
.")

17 NJBPN 284 Parking Lot E, Sandy Hook National Seashore Hurricane Sandy s damage was significant because it broke through the dunes, but the beach remained (Jan. 22, 2013). By October 29, 2013 a modest berm had welded back to the shoreline and a new dune had been completed. Figure 6. Here the dune was erased and restored partially with recovered sand from inland. The berm re-grew as sand migrated landward. The net change since March 2012 amounted to a yds 3 /ft. added to the offshore region as compared to survey

18 NJBPN 184 Highlands Beach, Sandy Hook National Seashore This southern Sandy Hook site is located near the entrance to the park and has gained in volume since the 1995 start of the federal shore protection project. The left view was taken following Sandy on Jan 22, By October 29, 2013 the ACOE had returned and placed sand to design template cross section. Erosion of the berm is evident following a minor NE storm. Figure 7. The NY District Corps of Engineers Shore protection project for northern Monmouth County starts here and continues south. The site was restored with yds 3 /ft. added to the berm. Some loss had already occurred by the end of October 2013, but the profile extended further seaward than it did in March


19 NJBPN 183 Via Ripa Street, Sea Bright This site was near the northern limit of the initial Federal shore protection project and shows the narrower beach following Sandy on Nov. 26, The right side shows the results of the placement of yds 3 /ft. of new sand on the beach by Oct 17, Figure 8. This site was also restored prior to the fall 2013 survey, so the cross section shows the addition of yds 3 /ft. in new sand to the profile when compared to March


20 NJBPN 282 Shrewsbury Way, Sea Bright The left view shows the remnants of the dunes with sand ramped up to the seawall taken November 26, The ACOE pumped sand back to the original design cross section and the sand the storm pushed up the seaward face of the seawall was extracted and formed into the dune seen on the right view October 17, Figure 9. A new dune was created from sand hauled back to the beach and material excavated from the ramp Sandy built up the face of the seawall. This site gained yds 3 /ft. when compared to November 2012 because sand offshore migrated toward the beach, adding to its volume. 25

21 NJBPN 182 Public Beach, Sea Bright Low, wide dunes established naturally following the initial Federal beach nourishment project did not stop the Sandy storm waves (left view November 26, By October 8, 2013 the ACOE had restored the beach width and a dune was added from sand extracted from inland and the material ramped up to the rock seawall. Figure 10. The work completed by the ACOE is evident in the final plot of this series yds 3 /ft. was added during the restoration with the dune built from the ramp of sand and material brought back from inland. 26

22 NJBPN 181 Municipal Beach, Sea Bright This site was the most heavily damaged along the northern Monmouth County shoreline from Hurricane Sandy, with the left view showing sand pushed back to the beach from inland deposits in November 26, By October 8, 2013 the ACOE had deposited yds 3 /ft. to restore the design cross section. The change in proximity of the buildings to the water is evident. Figure 11. The large ridge shown in survey 46 was recovered sand from inland that was spread to add to the beach. Later the ACOE finished the restoration with yds 3 /ft. of new sand. As yet no dune has been placed on the cross section, but a more rugged barrier extends across the gap in the seawall that produced the extensive damage during Sandy. 27
 shows where Sandy s waves pushed sand into a gentle ramp up the seaward rock slope and allowed the wave bores to pour over the wall into Ocean")

23 NJBPN 180 Sunset Court, Sea Bright This site received sand from the initial Federal beach nourishment project. The left photograph (Nov. 21, 2012) shows where Sandy s waves pushed sand into a gentle ramp up the seaward rock slope and allowed the wave bores to pour over the wall into Ocean Avenue and associated properties. The restoration by the ACOE had just been completed in the right photo taken October 8, 2013 with the addition of yds 3 /ft. to the profile s cross section. Figure 12. The Army Corps project returned yds 3 /ft. to the beach with no dune developed along this segment as yet. 28

. Figure 13.")
24 NJBPN 179 Cottage Road, Monmouth Beach This site has the worst erosion history of any site in Monmouth County. Chronic volume losses have been recorded over the years because the rock groin just south of the site blocks sand transport from the south. Most of the sand placed by Jan was moved to the nearshore or over the seawall during Sandy. The left photograph (Nov 21, 2012) shows the renourishment activities following the storm and the Oct. 4, 2013 shows the completed work ( yds 3 /ft. added to the beach). Figure 13. This series of cross sections show the beach prior to Sandy where earlier pumping to remedy chronic erosion had been cut into just before Sandy. That sand was lost to the seawall with little recovery by March The ACOE placed yds 3 /ft. at this site making a total restoration possible. 29
. Hurricane Sandy removed significant amounts of sand from the berm, destroyed a moderate-sized dune and badly damaged the beach club buildings.")

25 NJBPN 178 Monmouth Beach Club, Monmouth Beach This profile received the initial Federal beach nourishment project and the winter 2011 to 2012 renourishment (left photo taken Nov. 25, 2012 after Sandy). Hurricane Sandy removed significant amounts of sand from the berm, destroyed a moderate-sized dune and badly damaged the beach club buildings. The right photo taken October 4, 2013 shows the results of the ACOE work to restore the project to design specifications ( yds 3 /ft. of added sand). Figure 14. This beach club has been totally reconstructed with the new beach in place by October The fill amounted to yds 3 /ft. providing a buffer for future storms. This site appears to have nearly all the sand shifts within the envelope surveyed by the CRC to 18-foot depths offshore. 30
. The right photo was taken October 4, 2013 following the recovery of 22.")

26 NJBPN Ocean Avenue, Long Branch Sand was placed during the initial Federal beach nourishment project. This site was the southernmost one NOT surveyed prior to Sandy. After Sandy, the berm was reduced in elevation and pushed landward (left photo taken November 25, 2012). The right photo was taken October 4, 2013 following the recovery of yds 3 /ft. on the beach naturally, prior to the arrival of the ACOE to complete the northern segment of their project. Figure 15. The restoration stopped north of this location, but continued following the #47 survey date. The pre-sandy profile is well seaward of the final survey in this series, but considerable sand volume did return to the shoreline. 31
.")
. Figure 16.")
27 NJBPN 176 Seven President s Park, Long Branch This site is a popular recreational park with a partial ridge of 25-foot elevation dunes and an expansive berm that has undergone variable volume changes through the years (left photo taken Nov. 13, 2012). During Hurricane Sandy, the gradelevel public access points created channeled flow from the storm waves and washed sand landward into the parking lots. Natural recovery added yds 3 /ft. to the beach prior to the ACOE work (right photo taken October 3, 2013). Figure 16. At the park the beach recovered from the March 2013 situation, but far from the pre-sandy cross sections done in The ACOE has completed restoration of the site by


28 NJBPN 175 Broadway Avenue, Long Branch This site was part of the Federal shore protection project and renourishment activities (left photo taken November 13, 2012). H. Sandy relocated the berm sand over the vertical steel wall, but the vast majority of sand was deposited offshore. The railing on the left photograph was bent landward by wave action 17 feet above the zero datum elevation. Natural recovery from the offshore deposits added yds 3 /ft. to the beach prior to 2014 ACOE restoration activities. Figure 17. In Long Branch infrastructure damage was less due to a seawall and a steel bulkhead protecting the bluff. The boardwalk suffered damage to the south, but this area was flooded, but not crushed. The return of sand from offshore is clear when the March and October 2013 profiles are compared. Sand shifts from the bar offshore in March to the beach by October. 33
.")

29 NJBPN 174 Morris Avenue, Long Branch This site participated in the Federal beach nourishment project and was a direct beneficiary from the 2010 maintenance fill completed to the south (left photo taken November 13, 2012). No attempt has been made to replace the boardwalk since Sandy, but natural recovery from offshore deposits returned yds 3 /ft. to the beach prior to the ACOE completing the project s restoration in Figure 18. At Morris Avenue the recovery was less on the beach, but most of the bar did move landward. The damage was confined to sand loss from the beach and the loss of the boardwalk and some bluff sediment. 34

. By October 3, 2013 natural recovery restored 22.96 yds 3 /ft. to the beach, but no local restoration to the boardwalk had occurred.")
30 NJBPN 173 West End Avenue, Long Branch This site is located near the southern limit of the Federal beach nourishment project. Long Branch did not include the construction of a protective dune. It was decided at the time of project planning that the bluff elevation and the presence of the rock revetment was enough protection for landward properties. While the revetment held in place during H. Sandy, the boardwalk built on the upper bluff sediments was destroyed when the bluff retreated to the edge of the old southbound Ocean Ave. roadway (left photo taken November 13, 2012). By October 3, 2013 natural recovery restored yds 3 /ft. to the beach, but no local restoration to the boardwalk had occurred. In 2014 the ACOE announced the project s restoration. -10 Figure 19. The storm loss at the bluff is evident as is the deep scour at the base of the rock seawall. Sand returned to the beach following the storm by October
31 NJBPN Ocean Ave, Long Branch This site, established in 2010, is located on the northeastern edge of Lake Takanassee and within a groin compartment. The left photo (taken November 13, 2012) shows the lowered berm and debris from structures that were destroyed in the storm. On the right (Oct. 17, 2013) the swash zone and beach extends to the north. The ACOE restoration effort will extend to the south into Elberon this coming year. Figure 20. Sandy forced the relocation of the site to another fixed object. The difference in data will be minimal since the two spots are about 15 feet apart. Sandy altered the site by opening the lake to tidal flow that has since ceased. Little recovery has occurred, but the ACOE is about to continue the shore protection program south into Elberon to Allenhurst eventually. 36
. Waves apparently broke over the rock revetment, attacked upper un-armored bluff sediments and pushed the edge back 40 feet.")

32 NJBPN 171 Pullman Avenue, Elberon This site is located on the highest point along the bluff shoreline and in the past, has had very little sub-aerial beach as this community was not included in the Federal beach nourishment projects (left photo taken November 13, 2012). Waves apparently broke over the rock revetment, attacked upper un-armored bluff sediments and pushed the edge back 40 feet. The loss of over 12 cubic yards per foot of bluff sediment to the beach zone apparently has resulted in a dry beach by Oct. 2, Figure 21. The hurricane took a significant sediment volume from the bluff and added it to the beach sand volume available. This is evident in the dry beach seen in the October 2013 survey. Once previously this site had a dry sand beach extending between the groins. 37


33 NJBPN 170 Roosevelt Avenue, Deal This profile is located between two rock groins that limit sediment movement. This area has never received sand from direct beach nourishment and has never benefited from the addition of sand from the littoral system derived from the Federal beach fills. The photo on the left (taken November 13, 2012) shows the impacts of Sandy where waves crashed over the rocks and dug deeply into the area just landward of the rock revetment. By October 2, 2013 sand moved offshore and eroded from the bluff contributed to an addition of yds 3 /ft. to generate a dry beach at this site for the 2 nd time in 28 years. Figure 22. Damage occurred above the rock revetment here too, but little bluff sand was added to the cell. A dry beach did appear by October 2013 as sand transported offshore moved landward over the year following the hurricane. 38
. By October 2, 2013 natural recovery added 21.60 yds 3 /ft.")

34 NJBPN 169 Darlington Avenue, Deal The Darlington site has a small sub-aerial beach contained between two larger groins. The upland bluff was eroded significantly during Sandy and added to the beach sand volume (Nov. 13, 2012). By October 2, 2013 natural recovery added yds 3 /ft. back to the beach with some reconstruction of bluff protection structures. Figure 23. At the Darlington street end, little bluff loss was seen, however to the north entire lots were cut back 35 to 50 feet as timber walls were no match for Sandy. The beach does not appear to have gained a large volume of new sand, but the recovery from the June survey is considerable. 39


35 NJBPN 168 Corlies Avenue, Allenhurst This site in Allenhurst also represents the shoreline conditions for Loch Arbor s 2-block shoreline. Here an old concrete wall protects the sedimentary bluff. Age and decay has had an effect, but Sandy s waves clearly broke over the top of the wall with sufficient force to dislodge about 50 feet of the boardwalk (left photograph in front of the white truck, taken November 13, 2012). Substantial sand returned naturally (46.93 yds 3 /ft.) as offshore deposits migrated landward (Oct. 1, 2013). Figure 24. The Allenhurst beach recovered from the April condition with a yds 3 /ft. addition to the beach from offshore material carried there by the storm. The beach is not quite back to the pre-sandy condition but is within the variations seen normally previously. 40
 sand stripped from the beach, pushed landward and washed up to the boardwalk as a ramp allowing the waves to pass over the")

36 NJBPN 267 7th Avenue, Asbury Park This site is the northernmost site included in the Federal shore protection southern project. The left photo (taken on November 13, 2012) sand stripped from the beach, pushed landward and washed up to the boardwalk as a ramp allowing the waves to pass over the structure inland. Natural recovery permitted yds 3 /ft. in offshore deposition to return to the beach by October 1, Figure 25. Asbury recycled sand back to the beach from the streets and sand moved landward from the bar deposited offshore. Between these two sources, the beach was pretty good for the summer of The ACOE has completed a restoration to existing specs for this site in
. By October 1, 2013 natural recovery had restored 26.98 yds 3 /ft.")

37 NJBPN 167 3rd Avenue, Asbury Park Asbury Park experienced sand stripped from the beach and ramped up to the boardwalk allowing the waves to pass over the structure without destroying it (left photo taken November 13, 2012). By October 1, 2013 natural recovery had restored yds 3 /ft. to the beach prior to the ACOE completing this southern section s project restoration. Figure 26. The boardwalk survived at this location, but overwash occurred generally across the structure along the boardwalk. Sand was carted back to the beach and material carried offshore moved landward in high volumes. 42
. By September 29, 2013 the beach had recovered 22.65 yds 3 /ft.")
38 NJBPN 166 Ocean Pathway, Ocean Grove Following Sandy, the dunes along the northern Ocean Grove shoreline survived in partial sections, but were removed south of Main Street. Sand was excavated from Ocean Avenue and carted back to the beach (vehicle in left photo November 13, 2012). By September 29, 2013 the beach had recovered yds 3 /ft. prior to the ACOE commencing restoration work. Figure 27. The dune survived at the northern section of Ocean Grove with about half removed. The pedestrian access points to the beach were avenues for overwash to go inland. Sand also moved landward to make the recovery seen. 43
. No dune was restored by September 30, 2013, but 9.77 yds 3 /ft.")

39 NJBPN 165 McCabe Avenue, Bradley Beach The promenade was impacted, but not destroyed but abundant sand was still present in Ocean Avenue (left photo taken Nov 12, 2012). No dune was restored by September 30, 2013, but 9.77 yds 3 /ft. in offshore sand deposits had returned to the beach prior to the ACOE work on this shoreline. Figure 28. Sandy removed the dune and overtopped the promenade. Sand was carted back and appears as the ridge seen in survey #46. Recovery from offshore and the spreading of the lost sand has made for a decent beach recovery prior to the ACOE work later into
. 10.48 yds 3 /ft.")
40 NJBPN 164 Sylvania Avenue, Avon-by-the Sea This site is located north of the Shark River inlet and was nourished in the 1999 Federal shore protection project. During Sandy, the beach had been totally submerged and sand was washed inland well beyond Ocean Avenue (left photo taken November 12, 2012) yds 3 /ft. in natural recovery was added to the beach by Sept 27, 2013 prior to the ACOE restoring the beach to their design specifications. Figure 29. A large volume of sand was transported landward into the municipality. The upper, landward berm lost yds 3 /ft. to this process. Recovered sand was hauled back to the beach and pushed seaward helping regenerate the berm. Offshore there were small differences among the four surveys which was somewhat unusual. 45
. Natural recovery brought 31.76 yds 3 /ft.")
41 NJBPN th Avenue, Belmar This site did not have a dune prior to Sandy but had a wide, dry beach. During Sandy, the dry beach was submerged by the storm surge. Sand was carried landward onto Ocean Avenue accompanied by extensive flooding (left photo taken November 12, 2012). Natural recovery brought yds 3 /ft. of sand back to the beach leaving little additional sand placement by the ACOE later into Figure 30. The Belmar beach has never instituted a dune system so the Sandy storm surge pushed water across the beach in spite of the 350-foot width into the City. The April profile reflects the work expended hauling this sand back to the beach. The sand deposited offshore did move landward recreating a beach nearly as wide but lower in elevation by fall


42 NJBPN th Avenue, Belmar The southern Belmar shoreline was completely overrun by the force of Hurricane Sandy. The Lake Como segment was closed to traffic because multiple pumping pipelines were in place moving lake water back to the sea. Nothing but the supports remained from the boardwalk (left photo, November 12, 2012) yds 3 /ft. recovered on the beach naturally by 9/27/2013. Figure 31. Southern Belmar had a narrower beach zone, so flooding and overwash was more severe. The boardwalk has been replaced, sand hauled back to the beach and by the fall survey in 2013, the configuration was essentially somewhat better than prior to Sandy. The offshore region supplied yds 3 /ft. in lost sand back into the beach system greatly benefiting this particular segment. 47
.")

43 NJBPN 161 Brighton Avenue, Spring Lake During Sandy, Spring Lake lost the entire boardwalk deck. Extensive damage occurred at the ocean-side bathing buildings with most of the dunes breached and some segments removed entirely (left photo taken November 12, 2012). A massive effort restored the boardwalk by Sept 26, 2013 and yds 3 /ft. in eroded beach/dune sand returned to the beach naturally. Figure 32. The Spring Lake boardwalk was lifted off the concrete supports completely and was reduced to debris in Ocean Avenue. The dunes survived in part with significant gaps. Municipal beach facilities built years ago to serve public needs on the boardwalk and beach were severely damaged, but were repaired along with an entirely new boardwalk timber structure and deck. The beach recovered with help from sand moving landward from offshore (17.33 yds 3 /ft.) and from material hauled back from inland. 48
44 NJBPN 160 Salem Avenue, Spring Lake Sandy caused serious dune erosion that allowed waves to move sand into Ocean Avenue and strip the boardwalk deck from the supports. A ridge of sand had been carted back to the beach as the feature showing on the beach on the November 12 th survey line (left photo taken November 12, 2012). By the end of September 2013 the boardwalk was replaced with a modest recovery in beach sand from offshore sources. The ACOE completed restoration in Figure 33. At Salem Avenue the boardwalk was carried over the remnant of the dune. Sand was hauled back from Ocean Avenue, but yds 3 /ft. returned from offshore to widen the beach to 87% of that present prior to Sandy. 49
. Boardwalk damage restored and 39.16 yds 3 /ft.")

45 NJBPN 159 New York Avenue, Sea Girt \ Sandy caused damages along the northern Sea Girt shoreline and impacted the infrastructure more intensely than at locations further south. The boardwalk was damaged and washed over completely. Sand was being carted back the beach as a sizable ridge (left photo taken November 12, 2012). Boardwalk damage restored and yds 3 /ft. in lost sand was returned by Sept 26, 2013 from deposits formed offshore. Figure 34. Following Hurricane Irene in 2011, the Borough built a modest dune along the northern public oceanfront seaward of the boardwalk. Sandy s waves wiped it out and poured across the boardwalk inland. Massive breaching at Wreck Pond to the immediate north made matters worse. The beach gained yds 3 /ft. from offshore by the fall of 2013 greatly enhancing the April cross section shown in red above. A large cross section dune has been restored as well. 50
.")
.")
46 NJBPN 158 Trenton Avenue, Sea Girt H. Sandy reduced the elevation and width of the berm and the sand from the street end was carted back to the beach (see the ridge shown in the left photo taken November 12, 2012). The ridge of recovered sand remains along this segment of the Borough beach and was augmented by yds 3 /ft. in sand returned to the beach from offshore. Figure 35. The southern segment of Sea Girt has a well-defended bluff with an extensive dune seaward of the bluff face (last exposed in the Dec NE storm). Sandy damaged the dune, but stopped short of the bluff and homes built on it. Sand was hauled back to the beach from a breach at Trenton Avenue. The offshore region supplied yds 3 /ft. to the beach by fall 2013 (52% of that present prior to Sandy). 51
.")

47 NJBPN 157 Riddle Way, Manasquan Both Manasquan sites were heavily damaged with massive waves and flooding that transported sand among the homes and into First Avenue. The promenade survived at Riddle Way, but the dune was removed and washed landward (photo taken November 12, 2012). Material was recovered and spread with little help from offshore migration (1.20 yds 3 /ft. 9/25/2013). Figure 36. Sandy erased the dune, washed landward with extensive sand deposition on First Avenue at the beach in Manasquan. Between the materials hauled back and the transfer of yds 3 /ft. to the beach from offshore, the beach recovered, but only 9% from the April survey back to the pre- Sandy situation by fall
.")

48 NJBPN 256 Pompano Avenue, Manasquan This site is located just north of the Manasquan Inlet. Following Sandy, damages were worse at this location than to the north. The promenade was removed, as were the dunes and all the berm sand had been transported through the homes into First Avenue in the Borough (left photo taken November 12, 2012). By 9/25/2013 the structural damage was restored, no dune replaced the loss and just yds 3 /ft. was recovered naturally by the beach from offshore. Figure 37. At Pompano Avenue, the beach was narrower, therefore more sand was moved into First Avenue accompanied by total loss of the dune, promenade and with damage to many homes at the oceanfront yds 3 /ft. in sand loss was returned to the beach by fall 2013, but no new dune was developed by that time. 53
TABLE OF CONTENTS APPENDIX & BIBLIOGRAPHY
 TABLE OF CONTENTS Executive Summary 1 Acknowledgements 3 Introduction 3 The New Jersey Coastal Zone 3 Storm Recovery and Beach Project Effectiveness 3 Monmouth County 4 Figure 1. Monmouth County Station
Beach Dune Performance Assessment of. New Jersey Beach Profile Network (NJBPN) Sites at. Between Manasquan Inlet and Allenhurst, New Jersey
 Sites at. Between Manasquan Inlet and Allenhurst, New Jersey") Beach Dune Performance Assessment of New Jersey Beach Profile Network (NJBPN) Sites at Between Manasquan Inlet and Allenhurst, New Jersey Related to FEMA DR JI 4086 Declared for Hurricane Sandy December
Beach Dune Performance Assessment of New Jersey Beach Profile Network (NJBPN) Sites at Between Manasquan Inlet and Allenhurst, New Jersey Related to FEMA DR JI 4086 Declared for Hurricane Sandy December
Figure 38. Locations of the 28 NJBPN profile stations in Ocean County, NJ.
 55 Figure 38. Locations of the 28 NJBPN profile stations in Ocean County, NJ. 56 Individual Site Descriptions: Northern Ocean County recovered its beaches approaching pre-hurricane Sandy elevation or width,
Figure79. Location map for the 10 NJBPN profile sites in Atlantic County, NJ 155
 154 Figure79. Location map for the 10 NJBPN profile sites in Atlantic County, NJ 155 ATLANTIC COUNTY SPRING 2009 to FALL 2010 The Atlantic County coastline consists of three barrier islands. Between Little
ATLANTIC COUNTY 2006 to 2008
 ATLANTIC COUNTY 2006 to 2008 The Atlantic County oceanfront shoreline consists of three barrier islands where the northern one, Little Beach Island and a third of the second, Brigantine Island, are undeveloped
SPECIAL SPRING 2018 STORM REPORT ON THE CONDITION OF THE MUNICIPAL BEACHES FOR THE BOROUGH OF STONE HARBOR, CAPE MAY COUNTY, NEW JERSEY
 SPECIAL SPRING 2018 STORM REPORT ON THE CONDITION OF THE MUNICIPAL BEACHES FOR THE BOROUGH OF STONE HARBOR, CAPE MAY COUNTY, NEW JERSEY Aerial photograph taken April 21, 2018 showing the view up the beach
FINAL REPORT FOR 2013 ON THE CONDITION OF THE MUNICIPAL OCEANFRONT BEACHES THE BOROUGH OF AVALON, CAPE MAY COUNTY, NEW JERSEY
 FINAL REPORT FOR 2013 ON THE CONDITION OF THE MUNICIPAL OCEANFRONT BEACHES THE BOROUGH OF AVALON, CAPE MAY COUNTY, NEW JERSEY View from 12 th Street to the south taken February 28, 2013, following completion
UPPER BEACH REPLENISHMENT PROJECT RELATED
 ASSESSMENT OF SAND VOLUME LOSS at the TOWNSHIP of UPPER BEACH REPLENISHMENT PROJECT RELATED to the LANDFALL OF HURRICANE SANDY - PURSUANT TO NJ-DR 4086 This assessment is in response to Hurricane Sandy
23- Year Sand Volume Changes at Site 132, 15th Street, Brigantine
 149 Figure75. Location map for the 9 NJBPN profile sites in Atlantic County, NJ ATLANTIC COUNTY SPRING 2008 to FALL 2009 150 The Atlantic County oceanfront shoreline consists of three barrier islands.
Beach Dune Performance Assessment of. New Jersey Beach Profile Network (NJBPN) Sites at. Long Beach Island, New Jersey. After Hurricane Sandy
 Sites at. Long Beach Island, New Jersey. After Hurricane Sandy") Beach Dune Performance Assessment of New Jersey Beach Profile Network (NJBPN) Sites at Long Beach Island, New Jersey After Hurricane Sandy November 13, 2012 The Richard Stockton College of NJ Coastal Research
Beach Dune Performance Assessment of New Jersey Beach Profile Network (NJBPN) Sites at Long Beach Island, New Jersey After Hurricane Sandy November 13, 2012 The Richard Stockton College of NJ Coastal Research
Figure 262. Location map for the 10 NJBPN profile sites in Atlantic County, NJ 279
 278 Figure 262. Location map for the 10 NJBPN profile sites in Atlantic County, NJ 279 ATLANTIC COUNTY SUMMARY The Atlantic County coastline consists of three barrier islands. The island of Little Beach
A REVIEW OF THE CONDITION OF THE MUNICIPAL BEACHES AS A RESULT OF HURRICANE SANDY IN THE BOROUGH OF STONE HARBOR, CAPE MAY COUNTY, NEW JERSEY
 A REVIEW OF THE CONDITION OF THE MUNICIPAL BEACHES AS A RESULT OF HURRICANE SANDY IN THE BOROUGH OF STONE HARBOR, CAPE MAY COUNTY, NEW JERSEY View along the dune scarp from 103 rd Street on October 31,
New Jersey Beach Profile Network Atlantic County Profile Site Locations
 215 RICHARD STOCKTON COLLEGE OF NEW JERSEY New Jersey Beach Profile Network Atlantic County Profile Site Locations COASTAL RESEARCH CENTER Figure 128 There are nine NJBPN survey sites on the Atlantic County
Figure 38. Locations of the 28 NJBPN profile stations in Ocean County, NJ.
 52 Figure 38. Locations of the 28 NJBPN profile stations in Ocean County, NJ. 53 Individual Site Descriptions: Beaches in Northern Ocean County continued to recover slowly as sand transported offshore
2013 ANNUAL REPORT - TO THE CITY OF NORTH WILDWOOD ON THE CONDITION OF THE CITY BEACHES
 2013 ANNUAL REPORT - TO THE CITY OF NORTH WILDWOOD ON THE CONDITION OF THE CITY BEACHES View on June 18, 2013 from the 2 nd Avenue jetty looking south while the 2013 beach nourishment project was under
Figure 41. Locations of the 28 NJBPN profile stations in Ocean County, NJ.
 57 Figure 41. Locations of the 28 NJBPN profile stations in Ocean County, NJ. 58 Hurricane Sandy s Impact on the Ocean County Shoreline; In general terms, all forms of damage to beaches, dunes and public
Figure 78. Map of Cape May County showing the locations of the 31 profile sites in the county.
 103 Figure 78. Map of Cape May County showing the locations of the 31 profile sites in the county. 104 Cape May County in 2015: Cape May County has 31 survey stations between Reeds Beach on the Western
FINAL REPORT FOR 2012 ON THE CHANGES SEEN ON THE OCEANFRONT BEACHES
 FINAL REPORT FOR 2012 ON THE CHANGES SEEN ON THE OCEANFRONT BEACHES IN THE BOROUGH OF MANTOLOKING, OCEAN COUNTY, NEW JERSEY FOCUSED ON THE IMPACTS OF HURRICANE SANDY View looking north on Route 5 on October
Figure 46. Locations of the 28 NJBPN profile stations in Ocean County, NJ. A new site was added in the Borough of Seaside Heights (#248).
.") 90 Figure 46. Locations of the 28 NJBPN profile stations in Ocean County, NJ. A new site was added in the Borough of Seaside Heights (#248). 91 OCEAN COUNTY SPRING 2008 to FALL 2009 The Ocean County shoreline
90 Figure 46. Locations of the 28 NJBPN profile stations in Ocean County, NJ. A new site was added in the Borough of Seaside Heights (#248). 91 OCEAN COUNTY SPRING 2008 to FALL 2009 The Ocean County shoreline
Volume and Shoreline Changes along Pinellas County Beaches during Tropical Storm Debby
 Volume and Shoreline Changes along Pinellas County Beaches during Tropical Storm Debby Ping Wang and Tiffany M. Roberts Coastal Research Laboratory University of South Florida July 24, 2012 Introduction
PREPARED FOR: THE BOROUGH OF AVALON 3100 DUNE DRIVE AVALON, NJ 08202
 FINAL REPORT FOR 2012 ON THE CONDITION OF THE MUNICIPAL OCEANFRONT BEACHES FOLLOWING HURRICANE SANDY IN THE BOROUGH OF AVALON, CAPE MAY COUNTY, NEW JERSEY View from 78 th Street to the north immediately
Figure 106. Locations of the 28 NJBPN profile stations in Ocean County, NJ.
 130 Figure 106. Locations of the 28 NJBPN profile stations in Ocean County, NJ. 131 2016-2017 Beach Fills in Ocean County: The federal/state/local storm damage reduction project (beachfill) between Manasquan
New Jersey Coastal Zone Overview. The New Jersey Beach Profile Network (NJBPN) 3 Dimensional Assessments. Quantifying Shoreline Migration
 3 Dimensional Assessments. Quantifying Shoreline Migration") New Jersey Coastal Zone Overview The New Jersey Beach Profile Network (NJBPN) Objectives Profile Locations Data Collection Analyzing NJBPN Data Examples 3 Dimensional Assessments Methodology Examples Quantifying
New Jersey Coastal Zone Overview The New Jersey Beach Profile Network (NJBPN) Objectives Profile Locations Data Collection Analyzing NJBPN Data Examples 3 Dimensional Assessments Methodology Examples Quantifying
Beach, dune and development in the Borough of Mantoloking as of January Prepared for The Borough of Mantoloking: April 2, 2008
 Summary of 20-years of Shoreline Monitoring Between Maryland Avenue, Point Pleasant Beach, Bay Head, Mantoloking, Brick Township, to 1 st Avenue in Normandy Beach, Ocean County, New Jersey & an Evaluation
2014 ANNUAL REPORT - TO THE CITY OF NORTH WILDWOOD ON THE CONDITION OF THE CITY BEACHES
 2014 ANNUAL REPORT - TO THE CITY OF NORTH WILDWOOD ON THE CONDITION OF THE CITY BEACHES View on September 25, 2014 looking northwest into Hereford Inlet. Considerable southerly expansion of the tip of
2015 ANNUAL REPORT - TO THE CITY OF NORTH WILDWOOD ON THE CONDITION OF THE CITY BEACHES
 2015 ANNUAL REPORT - TO THE CITY OF NORTH WILDWOOD ON THE CONDITION OF THE CITY BEACHES Ariel view of North Wildwood looking south from the Hereford Inlet perspective on June 24, 2015. The main channel
FINAL REPORT FOR 2013 ON THE CONDITION OF THE MUNICIPAL BEACHES IN THE TOWNSHIP OF UPPER, CAPE MAY COUNTY, NEW JERSEY
 FINAL REPORT FOR 2013 ON THE CONDITION OF THE MUNICIPAL BEACHES IN THE TOWNSHIP OF UPPER, CAPE MAY COUNTY, NEW JERSEY Aerial photograph at Corson s Inlet showing conditions on December 1, 2013 of the north
New Jersey Beach Profile Network Ocean County Profile Site Locations
 125 RICHARD STOCKTON COLLEGE OF NEW JERSEY COASTAL RESEARCH CENTER New Jersey Beach Profile Network Ocean County Profile Site Locations Figure 73 156 155 154 153 152 151 15 149 The Ocean County shoreline
FINAL REPORT FOR 2009 ON THE CONDITION OF THE MUNICIPAL OCEANFRONT BEACHES IN THE BOROUGH OF AVALON, CAPE MAY COUNTY, NEW JERSEY
 FINAL REPORT FOR 2009 ON THE CONDITION OF THE MUNICIPAL OCEANFRONT BEACHES IN THE BOROUGH OF AVALON, CAPE MAY COUNTY, NEW JERSEY Storm waves pound the inlet revetment September 10, 2009 as the series of
RE: Hurricane Matthew Beach Damage Assessment and Recommendations [CSE 2416]
![RE: Hurricane Matthew Beach Damage Assessment and Recommendations [CSE 2416]](/thumbs/83/87675702.jpg "RE: Hurricane Matthew Beach Damage Assessment and Recommendations [CSE 2416]") October 25, 2016 Iris Hill Town Administrator Town of Edisto Beach 2414 Murray St Edisto Beach SC 29438 RE: Hurricane Matthew Beach Damage Assessment and Recommendations [CSE 2416] Dear Iris, Hurricane
October 25, 2016 Iris Hill Town Administrator Town of Edisto Beach 2414 Murray St Edisto Beach SC 29438 RE: Hurricane Matthew Beach Damage Assessment and Recommendations [CSE 2416] Dear Iris, Hurricane
Atlantic Coast of Long Island, Jones Inlet to East Rockaway Inlet, Long Beach Island, NY Construction Update
 Atlantic Coast of Long Island, Jones Inlet to East Rockaway Inlet, Long Beach Island, NY Construction Update June 2016 US Army Corps of Engineers Project Purpose Three specific damage mechanisms of coastal
Absecon Island Shore Protection The planning behind the project
 Absecon Island Shore Protection The planning behind the project Most residents of Atlantic City, Ventnor, Margate and Longport are now aware of upcoming plans to protect their common coastline with a beachfill
OCEAN COUNTY 2006 to 2008
 OCEAN COUNTY 2006 to 2008 Ocean County finally started to benefit from long-awaited startup of Federal beach nourishment projects when sand was pumped onto Surf City, Long Beach Island in late 2006. This
Delaware Chapter Surfrider Foundation - Indian River Inlet Monitoring
 Delaware Chapter Surfrider Foundation - Indian River Inlet Monitoring In 2012, the Delaware Surfrider Foundation Chapter formed the Surf Quality and Access Committee to focus on issues such as surf spot
Impact of Hurricane Matthew on the Atlantic Coast of Florida
 Impact of Hurricane Matthew on the Atlantic Coast of Florida A coastal engineer was driving across country and his jeep broke down in front of a monastery. It was late in the day and the monks invited
Executive Director and Director of Education New Jersey Sea Grant Consortium
 Welcome to the 12 th Annual State of the Shore Media Event Claire antonucci Executive Director and Director of Education New Jersey Sea Grant Consortium CLAIRE ANTONUCCI Characterized by endless snowfall,
The Stockton University Coastal
 Hurricane Sandy: Beach-dune recovery at New Jersey Beach Profile Network (NJBPN) sites By Kimberly K. McKenna 1, Stewart C. Farrell 1, and Jeffrey A. Gebert 2 1 Stockton University Coastal Research Center
Beach profile surveys and morphological change, Otago Harbour entrance to Karitane May 2014 to June 2015
 Beach profile surveys and morphological change, Otago Harbour entrance to Karitane May 2014 to June 2015 Prepared for Port Otago Ltd Martin Single September 2015 Shore Processes and Management Ltd Contact
ATLANTIC COAST OF LONG ISLAND, JONES INLET TO EAST ROCKAWAY INLET, LONG BEACH ISLAND, NY. Contract #2 Construction Scope. April 18th-19th 2018
 ATLANTIC COAST OF LONG ISLAND, JONES INLET TO EAST ROCKAWAY INLET, LONG BEACH ISLAND, NY Contract #2 Construction Scope April 18th-19th 2018 New York District PLAN COMPONENTS Length of Beachfill 35,000
Dear Mr. Howard Ruben,
 Mr. Howard Ruben ( Howard.Ruben@usace.army.mil) The U.S. Army Corps of Engineers New York District Planning Division-Environmental Branch 26 Federal Plaza New York, New York 10278-0090 Dear Mr. Howard
FINAL REPORT FOR 2011 ON THE CONDITION OF THE MUNICIPAL BEACHES IN THE CITY OF BRIGANTINE BEACH, ATLANTIC COUNTY, NEW JERSEY
 FINAL REPORT FOR 2011 ON THE CONDITION OF THE MUNICIPAL BEACHES IN THE CITY OF BRIGANTINE BEACH, ATLANTIC COUNTY, NEW JERSEY Photograph was taken October 10, 2011 from 10 th Street North looking south
Long Beach Island Holgate Spit Little Egg Inlet Historical Evolution Introduction Longshore Transport Map, Survey and Photo Historic Sequence
 Appendix B Long Beach Island Holgate Spit Little Egg Inlet Historical Evolution Introduction The undeveloped southern end of Long Beach Island (LBI) is referred to as the Holgate spit as it adjoins the
2018 Beach Preservation Project Information
 QUICK FACTS Beach Renourishment to begin late April 2018 o U.S. Army Corps of Engineers project o Project Area: 8 th St. E. to end of E. Ashley Ave. o Project Length: 2 miles o Cost: $10,900,000 o Funding:
Figure 4, Photo mosaic taken on February 14 about an hour before sunset near low tide.
 The Impact on Great South Bay of the Breach at Old Inlet Charles N. Flagg and Roger Flood School of Marine and Atmospheric Sciences, Stony Brook University Since the last report was issued on January 31
DUNE STABILIZATION AND BEACH EROSION
 DUNE STABILIZATION AND BEACH EROSION CAPE HATTERAS NATIONAL SEASHORE NORTH CAROLINA ROBERT DOLAN PAUL GODFREY U. S. DEPARTMENT OF INTERIOR NATIONAL PARK SERVICE OFFICE OF NATURAL SCIENCE WASHINGTON, D.
Protecting our Beaches
 Protecting our Beaches South Amelia Island Shore Stabilization Project Nassau County, FL Mr. Drew Wallace President South Amelia Island Shore Stabilization Association (SAISSA) Mr. Bill Moore, AICP Project
North Shore of Long Island, Feasibility Study
 North Shore of Long Island, Asharoken New York Asharoken, Feasibility Study Asharoken, NY Public Meeting June 30, 2015 US Army Corps of Engineers US Army Corps of Engineers New York BUILDING STRONG BUILDING
4/20/17. #32 - Coastal Erosion Case Histories - Lake Michigan
 Writing Assignment Due Monday by 11:59 pm #32 - Coastal Erosion Case Histories - Lake Michigan See main class web pages for detailed instructions Submit papers Illinois Compass No copying: Compass will
Estuarine Shoreline Stabilization
 Estuarine Shoreline Stabilization Property Owner s Guide to Determining the Most Appropriate Stabilization Method Estuarine shorelines are dynamic features that experience continued erosion. Land is lost
Performance of Upham Beach T-Groin Project and Its Impact to the Downdrift Beach
 Performance of Upham Beach T-Groin Project and Its Impact to the Downdrift Beach Progress Report for the Period of October 2008 to April 2009 Submitted by Ping Wang, Ph.D., and Tiffany M. Roberts Department
Overview. Beach Features. Coastal Regions. Other Beach Profile Features. CHAPTER 10 The Coast: Beaches and Shoreline Processes.
 Overview CHAPTER 10 The Coast: Beaches and Shoreline Processes Coastal regions constantly change. The beach is a dominant coastal feature. Wave activity continually modifies the beach and coastal areas.
Building Coastal Resiliency at Plymouth Long Beach
 Building Coastal Resiliency at Plymouth Long Beach Department of Marine and Environmental Affairs March 30, 2017 Introducing Green Infrastructure for Coastal Resiliency Plymouth Long Beach & Warren s Cove
LAB: WHERE S THE BEACH
 Name: LAB: WHERE S THE BEACH Introduction When you build a sandcastle on the beach, you don't expect it to last forever. You spread out your towel to sunbathe, but you know you can't stay in the same spot
STATUS REPORT FOR THE SUBMERGED REEF BALL TM ARTIFICIAL REEF SUBMERGED BREAKWATER BEACH STABILIZATION PROJECT FOR THE GRAND CAYMAN MARRIOTT HOTEL
 August 23 STATUS REPORT FOR THE SUBMERGED REEF BALL TM ARTIFICIAL REEF SUBMERGED BREAKWATER BEACH STABILIZATION PROJECT FOR THE GRAND CAYMAN MARRIOTT HOTEL performed by Lee E. Harris, Ph.D., P.E. Consulting
Dune Monitoring Data Update Summary: 2013
 Dune Monitoring Data Update Summary: 13 Shoreline Studies Program Virginia Institute of Marine Science College of William & Mary Gloucester Point, Virginia September 13 Dune Monitoring Data Update Summary:
Coastal management has lagged behind the growth in population leading to problems with pollution
 Fifty percent of the population of the industrialized world lives within 100 km of a coast. Coastal management has lagged behind the growth in population leading to problems with pollution and natural
Inlet Management Study for Pass-A-Grille and Bunces Pass, Pinellas County, Florida
 Inlet Management Study for Pass-A-Grille and Bunces Pass, Pinellas County, Florida Final Report Submitted By Ping Wang, Ph.D., Jun Cheng Ph.D., Zachary Westfall, and Mathieu Vallee Coastal Research Laboratory
COASTAL HAZARDS. What are Coastal Hazards?
 COASTAL HAZARDS What are Coastal Hazards? Hazards in the New Jersey coastal zone include unavoidable risks to life and property generated by: coastal flooding, waves, high winds and waves, short-term and
HURRICANE SANDY LIMITED REEVALUATION REPORT UNION BEACH, NEW JERSEY DRAFT ENGINEERING APPENDIX SUB APPENDIX D SBEACH MODELING
 HURRICANE SANDY LIMITED REEVALUATION REPORT UNION BEACH, NEW JERSEY DRAFT ENGINEERING APPENDIX SUB APPENDIX D SBEACH MODELING Rev. 18 Feb 2015 1 SBEACH Modeling 1.0 Introduction Following the methodology
ALTERNATIVES FOR COASTAL STORM DAMAGE MITIGATION
 ALTERNATIVES FOR COASTAL STORM DAMAGE MITIGATION Dave Basco Old Dominion University, Norfolk, Virginia, USA National Park Service Photo STRUCTURAL (changes to natural, physical system) hardening (seawalls,
Beach Nourishment Impact on Beach Safety and Surfing in the North Reach of Brevard County, Florida
 Beach Nourishment Impact on Beach Safety and Surfing in the North Reach of Brevard County, Florida Prepared by John Hearin, Ph.D. Coastal Engineering Vice Chairman Cocoa Beach Chapter Port Canaveral Patrick
Shorelines Earth - Chapter 20 Stan Hatfield Southwestern Illinois College
 Shorelines Earth - Chapter 20 Stan Hatfield Southwestern Illinois College The Shoreline A Dynamic Interface The shoreline is a dynamic interface (common boundary) among air, land, and the ocean. The shoreline
The Richard Stockton College of New Jersey Coastal Research Center
 The Richard Stockton College of New Jersey Coastal Research Center New Jersey Beach Profile Network 20-Year Report On Shoreline Changes In New Jersey Raritan Bay to Delaware Bay Prepared for: New Jersey
Oceans and Coasts. Chapter 18
 Oceans and Coasts Chapter 18 Exploring the oceans The ocean floor Sediments thicken and the age of the seafloor increases from ridge to shore The continental shelf off the northeast United States Constituent
Essentials of Oceanography Eleventh Edition
 Chapter Chapter 1 10 Clickers Lecture Essentials of Oceanography Eleventh Edition The Coast: Beaches and Shoreline Processes Alan P. Trujillo Harold V. Thurman Chapter Overview Coastal regions have distinct
EVALUATION OF BEACH EROSION UP-DRIFT OF TIDAL INLETS IN SOUTHWEST AND CENTRAL FLORIDA, USA. Mohamed A. Dabees 1 and Brett D.
 EVALUATION OF BEACH EROSION UP-DRIFT OF TIDAL INLETS IN SOUTHWEST AND CENTRAL FLORIDA, USA Mohamed A. Dabees 1 and Brett D. Moore 1 The paper discusses the analysis of up-drift beach erosion near selected
ALTERNATIVES FOR COASTAL STORM DAMAGE MITIGATION AND FUNCTIONAL DESIGN OF COASTAL STRUCTURES
 The University of the West Indies Organization of American States PROFESSIONAL DEVELOPMENT PROGRAMME: COASTAL INFRASTRUCTURE DESIGN, CONSTRUCTION AND MAINTENANCE A COURSE IN COASTAL DEFENSE SYSTEMS I CHAPTER
ST. JOSEPH PENINSULA, GULF COUNTY, FLORIDA Beach Re-Nourishment and Environmental Enhancement Project RECOMMENDATIONS
 ST. JOSEPH PENINSULA, GULF COUNTY, FLORIDA Beach Re-Nourishment and Environmental Enhancement Project RECOMMENDATIONS January 23, 2018 543 Harbor Boulevard, Suite 204 Destin, Florida 32541 850.654.1555
Navarre Beach & Dune Restoration Project Status Report to be regularly updated June 17, 2016 Report
 Navarre Beach & Dune Restoration Project Status Report to be regularly updated June 17, 2016 Report Work Completed (June 11 to June 17) Weeks Marine Inc. (Contractor): o continued filling Segment 4 including
Recycling of Surplus Sand to Extend the Time Between Beach Fill Episodes
 Recycling of Surplus Sand to Extend the Time Between Beach Fill Episodes Cape May County, New Jersey Dr. Stewart Farrell Coastal Research Center 1795 Franklin Map Shows Inlets Inlet Morphology has Remained
OECS Regional Engineering Workshop September 29 October 3, 2014
 B E A C H E S. M A R I N A S. D E S I G N. C O N S T R U C T I O N. OECS Regional Engineering Workshop September 29 October 3, 2014 Coastal Erosion and Sea Defense: Introduction to Coastal/Marine Structures
Beach Renourishment in Jacksonville
 Beach Renourishment in Jacksonville Kevin Bodge, PhD, P.E. - Olsen Associates, Inc. 1978 Oct 2004 2000 2016 2011 Oct 2016 Coastal Duval County, FL Nassau Sound Blount Island Ft. George Inlet St. Johns
Town of Duck, North Carolina
 Tracking No. 00.00.2010 Erosion Mitigation And Shoreline Management Feasibility Study Town of Duck, North Carolina Coastal Planning & Engineering of North Carolina February 28, 2013 Ken Willson 1 Tracking
The 2017 Panama City Beaches Beach Interim Renourishment Project. Answers to Common Questions
 The 2017 Panama City Beaches Beach Interim Renourishment Project The fourth renourishment of the Panama City Beaches will be under construction during March and April 2017, with a planned completion by
Blakely Island, N Thatcher Bay. Restoration Recommendation: Rank Score (total score)
") Soft Shore Protection/Structure Removal Blueprint for San Juan County Forage Fish Beaches Appendix 2: Recommendations for sites scoring below the top ten, sorted by island (east to west) Blakely Island,
Soft Shore Protection/Structure Removal Blueprint for San Juan County Forage Fish Beaches Appendix 2: Recommendations for sites scoring below the top ten, sorted by island (east to west) Blakely Island,
Controlling Coastal erosion
 Controlling Coastal erosion Coastal Erosion Rates in the U.S. Coastal Erosion and Stabilization Economic pressures demanding the stabilization of beaches and coastlines are immense Coastal Erosion and
Reading Material. Inshore oceanography, Anikouchine and Sternberg The World Ocean, Prentice-Hall
 Reading Material Inshore oceanography, Anikouchine and Sternberg The World Ocean, Prentice-Hall BEACH PROCESSES AND COASTAL ENVIRONMENTS COASTAL FEATURES Cross section Map view Terminology for Coastal
The purpose and needs of the Figure Eight Island Inlet and Shoreline Management Project are as follows:
 Chapter 2 PURPOSE AND NEEDS 1. What are the purpose and needs of this project? The main concern of residents and owners at Figure Eight Island are economic losses resulting from damages to structures and
County of Santa Barbara Permit Option Analysis Goleta Beach JULY 13, 2017
 County of Santa Barbara Permit Option Analysis Goleta Beach JULY 13, 2017 Introduction 2 Goleta Beach Park welcomes 1.5 million visitors annually Amenities include: Picnic Areas and Group Areas w/bbqs
Chapter. The Dynamic Ocean
 Chapter The Dynamic Ocean An ocean current is the mass of ocean water that flows from one place to another. 16.1 The Composition of Seawater Surface Circulation Surface Currents Surface currents are movements
USE OF SEGMENTED OFFSHORE BREAKWATERS FOR BEACH EROSION CONTROL
 .. CETN-III-22 4/84 PURPOSE: USE OF SEGMENTED OFFSHORE BREAKWATERS FOR BEACH EROSION CONTROL To provide information on the functional application of and general design considerations for using offshore
RI Regulatory Setbacks & Buffers: Coastal Management Issues
 RI Regulatory Setbacks & Buffers: Coastal Management Issues New England Onsite Wastewater Training Program @ URI OWT 155 - November 29, 2012 James Boyd - Coastal Policy Analyst Photo: October 30, 2012
AD-A II~lllII I I 7
 AD-A284 157 II~lllII CONSTRUCTION OF BREAK WATERS AND BEACEFILL AT THE NAVAL AIR STATION, PATUXENT RIVER, MARYLAND C D.W.Yang, J.McWilliams 2, S.Ming 2 ABSTRACT Construction of the breakwaters and beach
Chapter 10 Lecture Outline. The Restless Oceans
 Chapter 10 Lecture Outline The Restless Oceans Focus Question 10.1 How does the Coriolis effect influence ocean currents? The Ocean s Surface Circulation Ocean currents Masses of water that flow from one
SACO RIVER AND CAMP ELLIS BEACH SACO, MAINE SECTION 111 SHORE DAMAGE MITIGATION PROJECT APPENDIX F ECONOMIC ASSESSMENT
 SACO RIVER AND CAMP ELLIS BEACH SACO, MAINE SECTION 111 SHORE DAMAGE MITIGATION PROJECT APPENDIX F ECONOMIC ASSESSMENT Department of the Army New England District, Corps of Engineers 696 Virginia Road
An Update of Coastal Erosion in Puerto Rico
 Jack Morelock and Maritza Barreto An Update of Coastal Erosion in Puerto Rico Department of Marine Sciences, University of Puerto Rico at Mayagüez and Geography Department, University of Puerto Rico at
The Impact on Great South Bay of the Breach at Old Inlet Charles N. Flagg School of Marine and Atmospheric Sciences, Stony Brook University
 The Impact on Great South Bay of the Breach at Old Inlet Charles N. Flagg School of Marine and Atmospheric Sciences, Stony Brook University The previous report provided a detailed look at the conditions
GONE! Coastal Erosion Happens During Storms! Why Worry About Coastal Setbacks? Goals for Today
 RI Regulatory Setbacks & Buffers: Coastal Zone Management Issues New England Onsite Wastewater Training Program @ URI OWT 155 November 21, 2013 Goals for Today Understand the impacts of storms, coastal
Affects of Tides on Lateral Coastal Access at. Las Varas Ranch. Gaviota, California. Photos Courtesy of California Coastal Records Project
 Affects of Tides on Lateral Coastal Access at Las Varas Ranch Gaviota, California Photos Courtesy of California Coastal Records Project September 18, 2014 Santa Barbara County Trails Council 1 As part
Chesil Beach, Dorset UK High energy, shingle coastline. Brighton Beach, Sussex UK Pebble beach
 Beaches: Depositional landform Extends from the highest high tide to the lowest low tide. Very important temporary store in coastal system. Accretion: sediment returning to the visible portion of a beach
Earth Science Chapter 16 Section 3 Review
 Name: Class: Date: Earth Science Chapter 16 Section 3 Review Multiple Choice Identify the choice that best completes the statement or answers the question. 1. The movement of water that parallels the shore
FINDING OF NO SIGNIFICANT IMPACT
 DEPARTMENT OF THE ARMY CHARLESTON DISTRICT, CORPS OF ENGINEERS 69A HAGOOD AVENUE CHARLESTON, SOUTH CAROLINA 29403-5107 FINDING OF NO SIGNIFICANT IMPACT EDISTO BEACH COASTAL STORM DAMAGE REDUCTION GENERAL
BALD HEAD ISLAND, NC SAND SHARING SYSTEM OVERVIEW AND ASSESSMENT. Erik J. Olsen, P.E. olsen associates, inc.
 BALD HEAD ISLAND, NC SAND SHARING SYSTEM OVERVIEW AND ASSESSMENT Erik J. Olsen, P.E. Olsen Associates, Inc. BACKGROUND Both the Village of Bald Head Island (VBHI) and the Bald Head Island Limited, LLC.
Lecture Outlines PowerPoint. Chapter 15 Earth Science, 12e Tarbuck/Lutgens
 Lecture Outlines PowerPoint Chapter 15 Earth Science, 12e Tarbuck/Lutgens 2009 Pearson Prentice Hall This work is protected by United States copyright laws and is provided solely for the use of instructors
The Impact on Great South Bay of the Breach at Old Inlet Charles N. Flagg School of Marine and Atmospheric Sciences, Stony Brook University
 The Impact on Great South Bay of the Breach at Old Inlet Charles N. Flagg School of Marine and Atmospheric Sciences, Stony Brook University This is the sixth in a series of reports describing the evolution
Long Term Success and Future Approach of the Captiva and Sanibel Islands Beach Renourishment Program
 2017 National Conference on Beach Preservation Technology February 8-10, 2017; Stuart, Florida Long Term Success and Future Approach of the Captiva and Sanibel Islands Beach Renourishment Program Thomas
General Coastal Notes + Landforms! 1
 General Coastal Notes + Landforms! 1 Types of Coastlines: Type Description Primary Coast which is essentially in the same condition when sea level stabilized Coastline after the last ice age, younger.
Chapter 12: Coasts (after a brief review of Tides)
") Chapter 12: Coasts (after a brief review of Tides) 1 Questions from previous classes: What happens when a wave meets a current? wave = people walking current = bus If wave goes with the current, the wave
Chapter 12: Coasts (after a brief review of Tides) 1 Questions from previous classes: What happens when a wave meets a current? wave = people walking current = bus If wave goes with the current, the wave
page - Laboratory Exercise #5 Shoreline Processes
 page - Laboratory Exercise #5 Shoreline Processes Section A Shoreline Processes: Overview of Waves The ocean s surface is influenced by three types of motion (waves, tides and surface currents). Shorelines
The Sand Beaches of New Hampshire and Maine
 The Sand Beaches of New Hampshire and Maine Beach Preservation and Erosion Control Photographs provided by Joe Kelly and Steve Adams Cover photo: Reid State Park, ME Introduction The sand beaches of New