211
|
|
|
- Curtis Turner
- 5 years ago
- Views:
Transcription
1 211
2 212
3 213
4 214
5 215
6 216
7 217
8 218
9 219
10 220
11 221
12 222
13 223
14 224
15 225
16 226
17 227
18 228
19 229


20 Kahoolawe Behavioral Data Analysis by Site January, February and March Breaches: Slaps: Dives: Doug Perrine/ HWRF/ Seapics.com/NOAA Fisheries Permit # 882 Doug Perrine/ HWRF/ Seapics.com/NOAA Fisheries Permit # 882 Flip Nicklin/ Minden Picutres/NOAA Fisheries Permit #
21 231
22 Chapter 7: Conclusions The following summarizes the findings by question. Question A: Does the Sanctuary Ocean Count census data from at each site reflect a 5-7% annual increase in population growth for the North Pacific stock of humpback whales as reported by whale researchers? Researchers report that the Hawaii sub-population of humpback whales has increased at an annual rate of 5-7 percent. The census summary for the ocean count data reflects a gradual overall population increase over the census period. However, the data does not appear to fully reflect the 5-7% annual population increase reported by whale researchers. The highly variable census counts from year to year can be partially attributed to weather and its affect on visibility conditions. A trend noted in the ten-year census summary analysis indicated consistently higher sightings in January and February than in March. A possible explanation for lower whale counts in March is that some whales may have began their migration back to the feeding grounds in Alaska by the time of the March census. The census summary by island suggest that volunteers on Kauai saw the most whales over the five-year period in January and February while volunteers on Oahu counted the highest average in March. The islands of Kauai and Hawaii also have similar average census counts for each month with the volunteers on Oahu saw lower average counts. In the census summary by year, volunteers on Kauai counted the most humpback whales on average in every year but This could be because in 2010, Kauai experienced numerous site closures due to bad weather, presence of a submarine around the island, as well as rescheduling the February count due to a tsunami warning. In the year 2007, all the islands have relatively close census averages (a difference of 0.67) as to suggest suitable viewing conditions on each island, each count period. Question B: Which ocean count sites on each island are humpback whales sighted consistently from year to year? The four most consistent sites on every island could help track the population more reliably and accurately around the three islands in upcoming years because of the consistency in the census data for the first ten years of the Sanctuary Ocean Count project. The following are the four most consistent ocean count sites on each island. Kauai Oahu Hawaii Kilauea Lighthouse Laie Point Puukohala Heiau Crater Hill Halona Blowhole Mile Marker 7 Makahuena Point Lanai Lookout Lapakahi State Park Poipu Beach Park Hanauma Bay Kapaa Beach Park 232
23 Question C: Are there similarities in the census data results among ocean count sites along the same coastline? Kauai Anecdotal evidence suggested that March, and more recently February, were considered the peak of whale season on Kauai. Surprisingly, for sites on three of the coastlines, South, East and West Shore, January had the largest average amount of humpback whale sightings followed by February and March s average. The North Shore had a higher average in February with its lowest average in March. For all the coastlines, the month of March had the lowest overall average of humpback whale sightings as to support the earlier claim that many of the whales have left the breeding area by late March. This comprehensive ten-year analysis depicts different results than Dr. Maldini s original 2002 annual report. Dr. Maldini reported that in January, February and March, the volunteers at East Shore sites counted the highest overall average number of humpback whale sightings (Maldini 88,90,92). However, in the ten-year summary analysis ( ), which is the focus of this report, it appears in January, South Shore saw the highest average. In February and March, Kauai s North Shore had the overall highest average of humpback whale sightings. Interestingly, North Shore contains the most sites with the highest elevation on the island. However, volunteers at these sites did not always count the most humpback whale sightings as Kauai s South Shore, with elevations below 50 ft. Further analysis would need to be done to see how elevation levels effect the overall ocean count census. However, from the ten-year summary on Kauai, it seems to suggest that sites at higher elevations do not necessarily always see the most humpback whales. Oahu The average number of humpback whale sightings varied between the coastlines of Oahu. The four main coastlines are as follows: Waianae, South Shore, North Shore and Windward Coast. Waianae Coast encompasses 3 ocean count sites, South Shore encompasses 4 ocean count sites, and both North Shore and Windward Coast encompass 9 ocean count sites. For sites along three of the coastlines, Waianae, South Shore and North Shore, February had the largest average amount of humpback whale sightings followed closely by January s average. The Windward Coast had a higher average in March with its lowest average in January. In comparison with results found by Dr. Daniela Maldini in her annual 2002 report (one of the first Ocean Count census taken), there are similarities and differences in which coastline had the most average number of humpback whales. In both the 2002 and the comprehensive ten-year analysis between 2002 and 2010, the North Shore of Oahu had the highest average in January. In February, North Shore had the highest average while in the 2002 analysis, South Shore had the highest number of average sightings. In March 2002, it was found that volunteers at South Shore sites counted on average more humpback whales (Maldini 88,90,92). In the comprehensive analysis of , Windward Coast saw on average the most whales of all four coasts on Oahu in March. 233
24 Hawaii As with the island of Kauai, for sites along three of the coastlines, South Shore, Kona Coast and Kohala Coast, January had the largest average amount of humpback whale sightings. The Hamakua Coast had an overall higher average in February with its lowest average number of sightings in March. In fact, all the coastlines around the island of Hawaii had the lowest average count of humpback whale sightings in March. Hawaii s comprehensive ten-year analysis illustrates different results than Dr. Maldini s original 2002 coastline comparison report. She found that in both January and February, sites along the Kona Coast had the highest overall average of humpback whale sightings. In March, she reported that the Hilo Coastline had the highest average (Maldini 88,90,92). However, in the ten-year summary analysis ( ), it appears that in January, February and March, Kohala Coast had the highest overall average every month. Coastline comparison similarities between the islands of Oahu, Kauai and Hawaii Interestingly, when comparing all three islands coastline comparison graphs, the trends are rather similar. Three out of four coastlines on every island have the highest overall average of humpback whale sightings fall within one particular count month with one coastline being different. Both Oahu and Hawaii tend to have similar looking graphs with January and February averages being closely related for most of the coastlines. Finally, every coastline, with the exception of Windward Coast on Oahu, have there lowest averages of humpback whale sightings in the month of March. Researchers have hypothesized and speculated that the peak breeding season for humpback whales is over by late March and many of the whales have left the main Hawaiian Islands by the time of the last sanctuary ocean count. Thus, the comprehensive ten-year analysis of the ocean count data seems to support this claim. Question D: How does the proportion of calves vary between the islands of Kauai, Oahu and Hawaii for the years 2002, ? For the 2002, analysis, the proportion of calves does vary between the three islands with a greatest overall difference of about 7%. The current analysis shows Kauai had the least overall percentage at about 10% followed by Hawaii at about 15% and then Oahu at 17% relative to the total number of whales sighted. The year 2002 was included in the analysis to compare the earliest ocean count research with the present percentage of calves sighted. On the basis of the current analysis, a higher proportion of calves are sighted on Oahu, followed by the island of Hawaii. Future analysis using the proportion of calves for each ocean count site could yield vital information as to possible calving and/or nursery areas. Interestingly, whale researchers had announced that the island of Kauai has fewer calves than the other two islands and that the overall percentage is around 10%. The Sanctuaries Ocean Count project seems to be yielding the same results using there trained volunteers from the fifteen shore-based sites around the island. 234
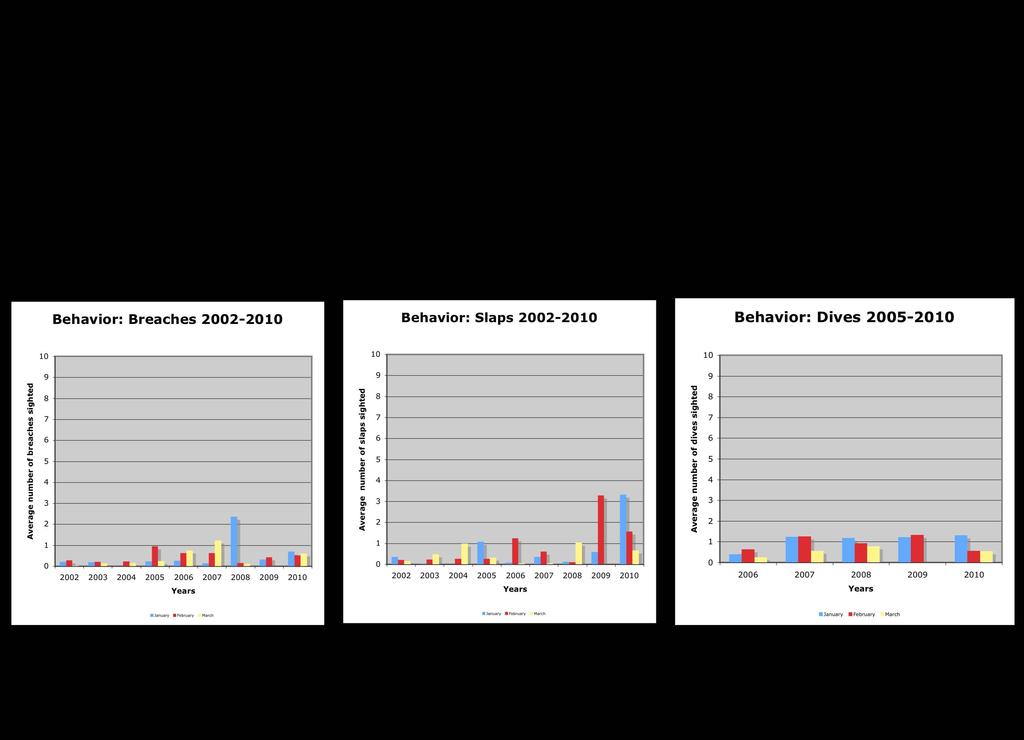
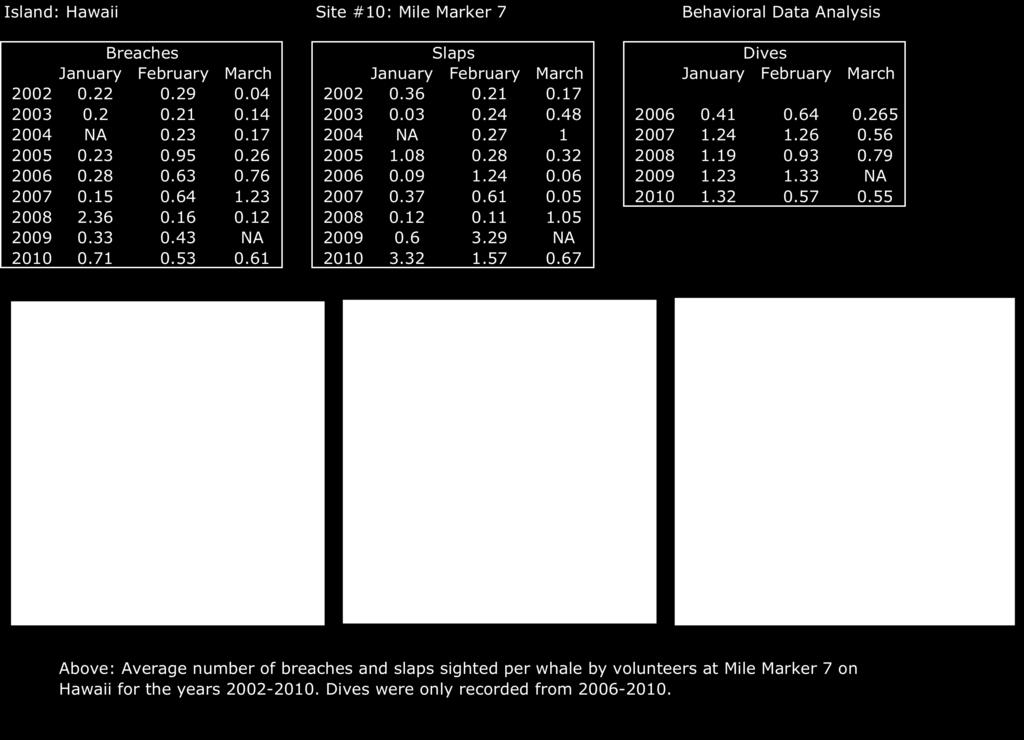
25 Question E: For the three selected surface whale behaviors (breaches, slaps and dives), how do the sites on every island compare in the number of sightings of each particular behavior from in January, February and March? The overall average per whale for each island was rather close for each particular behavior. Some preliminary conclusions drawn from the behavioral summary by island analysis include for Oahu, volunteers in the month of March saw the overall highest average for all three behaviors. For Hawaii, slaps and dives and the highest count averages in January, and with dives, March had the lowest overall average number of sightings. For Kauai, no real pattern emerged between the three behaviors but less variability was found between January, February and March s averages for each particular behavior. For Kahoolawe, March had the highest average number of sightings for both the breach and dive behaviors. For breaches, Hawaii had the highest average for January (x=.390) and February (x=.416) while Oahu had the highest for March (x=.329). For slaps, Kauai had the highest in February (x=.684) and March (x=.800) while Hawaii had the highest average for January (x=.802). For dives, Kauai had the highest average in January (x=.272), February (x=.270) and March (x=.365). Formal behavioral conclusions using the Sanctuary Ocean Count data are beyond the scope of this project and further indepth, specialized analysis is needed to see how the whales use the behaviors. Chapter 10: Recommendations The following recommendations for further study are proposed. Humpback Whale Census Analysis Further data analysis is needed to better refine the trends indicated by the census data. In addition, more work is needed to correlate ocean count data with population studies conducted by whale researchers. This internship project did not investigate how visibility conditions affected the census data. Therefore, further examination into this variable is needed. Major Coastline Comparison Further analysis by a geographer or surveyor is needed to see how elevation levels affect the overall ocean count census. 235
26 Proportion of calves Expand this analysis to the raw data for to all islands. Future analysis using the proportion of calves computed for each ocean count site could yield vital information leading to the identification of more calving and nursery areas. Humpback Whale Behavior Analysis In depth analysis of the behavioral and any implications they may have on how various ocean count sites may be used by humpback whales is beyond the scope of this internship project and is best left to humpback whale researchers. Maps This internship project did not analyze the ocean count maps. These require analysis and could prove important. 236
: 88,90,92. Darling, Jim. Hawaii's Humpbacks Unveiling the Mysteries. 1. Vancouver BC, Canda: Granville Island Publishing Ltd., 2009.")

27 Chapter 11: Bibliography and Acknowledgements Maldini, Daniela, and Peter Nilsson. "Distribution Patterns and Behaviors of Humpback Whales around Oahu, Kauai, Hawaii and Kahoolawe." (2006): Maldini, Daniela. "Year 2002 Sanctuary Ocean Count Results." (2002): 88,90,92. Darling, Jim. Hawaii's Humpbacks Unveiling the Mysteries. 1. Vancouver BC, Canda: Granville Island Publishing Ltd., , 40, Calambokidis, J., E.A.Falcone, T.J. Quinn, A.M. Burdin, P.J. Clapham, J.K.B. Ford, C.M.Gabriele, R.LeDuc, D. Mattila, L. Rojas-Bracho, J.M. Straley, B.L.Taylor, J.Urban, D. Weller, B.H. Witteveen, M.Yamaguchi, A.Bendlin, D. Camacho, K. Flynn, A.Havron, J. Huggins, N. Maloney SPLASH: structure of populations, levels of abundance and status of humpback whales in the North Pacific. Final Report for Contract AB133F-03-RP Prepared by Cascadia Research for U.S.Department of Commerce, Western Administrative Center, Seattle, WA. 57pp Acknowledgements Thank you to everyone who gave insight and direction for this project and report. Allen Tom, Pacific Islands Regional Coordinator Jean Souza, Kauai Programs Coordinator Christine Brammer, Oahu Programs Coordinator Claire Kavanaugh, Oahu Office Staff Fiona Langenburger, Oahu Office Staff Joey Lecky, Oahu Office Staff Justin Viezbicke, Hawaii Programs Coordinator Dr. Daniela Maldini Ed Lyman 237
ABUNDANCE, DISTRIBUTION PATTERNS AND HABITAT USE OF HUMPBACK WHALES IN INSHORE WATERS OF THE ISLANDS OF O AHU, KAUA I, HAWAI I AND KAHO OLAWE (2003)
") ABUNDANCE, DISTRIBUTION PATTERNS AND HABITAT USE OF HUMPBACK WHALES IN INSHORE WATERS OF THE ISLANDS OF O AHU, KAUA I, HAWAI I AND KAHO OLAWE (2003) Daniela Maldini, Ph.D. Beaufort 9 Consulting PO Box
ABUNDANCE, DISTRIBUTION PATTERNS AND HABITAT USE OF HUMPBACK WHALES IN INSHORE WATERS OF THE ISLANDS OF O AHU, KAUA I, HAWAI I AND KAHO OLAWE (2003) Daniela Maldini, Ph.D. Beaufort 9 Consulting PO Box
Drownings in Hawaii, A review of death certificates by the Injury Prevention and Control Program, Hawaii DOH
 Drownings in Hawaii, 99-97. A review of death certificates by the Injury Prevention and Control Program, Hawaii DOH There were 6 drownings in the state over the 5-year period, with no apparent trend over
BAJA BLUE WHALE RESEARCH 2011
 BAJA BLUE WHALE RESEARCH 2011 Summary of research conducted by Cascadia Research as a part of an Oceanic Society Research Expedition with volunteers from Road Scholar Expedition Dates: ch 26 il 2, 2011
2016 West Coast Entanglement Summary
 March 2017 2016 West Coast Entanglement Summary Overview of Entanglement Data west coast region MMHSRP Permit #18786 In 2016, 71 separate cases of entangled whales were reported off the coasts of Washington,
Season Summary on Large Whale Entanglement threat and reports received around the Main Hawaiian Islands
 2011-2012 Season Summary on Large Whale Entanglement threat and reports received around the Main Hawaiian Islands Compiled by: Ed Lyman Hawaiian Islands Humpback Whale National Marine Sanctuary May 22,
What s UP in the. Pacific Ocean? Learning Objectives
 What s UP in the Learning Objectives Pacific Ocean? In this module, you will follow a bluefin tuna on a spectacular migratory journey up and down the West Coast of North America and back and forth across
Student Population Projections By Residence. School Year 2016/2017 Report Projections 2017/ /27. Prepared by:
 Student Population Projections By Residence School Year 2016/2017 Report Projections 2017/18 2026/27 Prepared by: Revised October 31, 2016 Los Gatos Union School District TABLE OF CONTENTS Introduction
Habitat Use and Behavioral Monitoring of Hawaiian Monk Seals in Proximity to the Navy Hawaii Range Complex
 Project Annual Report Habitat Use and Behavioral Monitoring of Hawaiian Monk Seals in Proximity to the Navy Hawaii Range Complex Report Period: July 2011 June 2012 Submitted by: Kenady Wilson, Scientist
National Report on Large Whale Entanglements
 National Report on Large Whale Entanglements Confirmed in the United States in 2017 In 2017, 76 confirmed cases of large whale entanglements were documented along the coasts of the United States. Seventy
1999 On-Board Sacramento Regional Transit District Survey
 SACOG-00-009 1999 On-Board Sacramento Regional Transit District Survey June 2000 Sacramento Area Council of Governments 1999 On-Board Sacramento Regional Transit District Survey June 2000 Table of Contents
DISENTANGLEMENT RESPONSE CHECKLIST
 A. Awareness Stage: DISENTANGLEMENT RESPONSE CHECKLIST Receive report. Ask reporting source to provide information on entangled animal. Follow and fill out Entanglement Reporting Form. (It is essential
Movements of satellite-tagged false killer whales around the main Hawaiian Islands: implications for management
 Movements of satellite-tagged false killer whales around the main Hawaiian Islands: implications for management Robin W. Baird 1, Gregory S. Schorr 1, Daniel L. Webster 1, Daniel J. McSweeney 2, M. Bradley
DISTRIBUTION STATEMENT A. Approved for public release; distribution is unlimited.
 DISTRIBUTION STATEMENT A. Approved for public release; distribution is unlimited. Examination of Health Effects and Long-Term Impacts of Deployments of Multiple Tag Types on Blue, Humpback, and Gray Whales
TRENDS IN PARTICIPATION RATES FOR WILDLIFE-ASSOCIATED RECREATION BY RACE/ETHNICITY AND GENDER:
 TRENDS IN PARTICIPATION RATES FOR WILDLIFE-ASSOCIATED RECREATION BY RACE/ETHNICITY AND GENDER: 1980-2001 Allan Marsinko Professor Department of Forestry and Natural Resources Clemson University Clemson,
Surf Survey Summary Report
 Port Otago Limited 15 Beach Street Port Chalmers Surf Survey Summary Report August 13-September 1 Leigh McKenzie Summary of Surf Locations of Interest Port Otago Ltd is undertaking monitoring of changes
Any Island... Any Adventure... Did You Know? Call Eco-Adventures For All Your Island Vacation Plans! FPO
 Any Island... Any Adventure... FPO Call Eco-Adventures For All Your Island Vacation Plans! SCUBA DIVE SNORKEL HIKE GOLF KAYAK LUAU WINDSURF HORSEBAC K R NIIHAU There are 132 islands in the Hawaiian chain,
OCN 201 Tides. Tsunamis, Tides and other long waves
 OCN 201 Tides Tsunamis, Tides and other long waves Storm surges Caused by winds and low atmospheric pressure associated with large storms Can raise sea surface by up to 25 ft, bottom contours magnify effect
Challenges in communicating uncertainty of production and timing forecasts to salmon fishery managers and the public
 Challenges in communicating uncertainty of production and timing forecasts to salmon fishery managers and the public Alaska Fisheries Science Center Joseph A. Orsi and Phillip R. Mundy Auke Bay Laboratories
Figure 26. Map of ocean related share of GDP in counties of the Gulf of Mexico coast region in (Data Source: National Ocean Economics Program.
 Figure 22. Map of ocean related share of GDP in counties of the North and Middle Atlantic coastal regions in 2009. This map shows the share of ocean related GDP (value added economic activity) in 2009
Compression Study: City, State. City Convention & Visitors Bureau. Prepared for
 : City, State Prepared for City Convention & Visitors Bureau Table of Contents City Convention & Visitors Bureau... 1 Executive Summary... 3 Introduction... 4 Approach and Methodology... 4 General Characteristics
Status of humpback, blue, and gray whales along the US West Coast and relevance to entanglements
 Status of humpback, blue, and gray whales along the US West Coast and relevance to entanglements John Calambokidis Research Biologist Cascadia Research Goals of talk Updated status of humpback, blue and
AGENCY: National Marine Fisheries Service (NMFS), National Oceanic and Atmospheric
, National Oceanic and Atmospheric") This document is scheduled to be published in the Federal Register on 05/30/2013 and available online at http://federalregister.gov/a/2013-12869, and on FDsys.gov BILLING CODE 3510-22-P DEPARTMENT OF COMMERCE
This document is scheduled to be published in the Federal Register on 05/30/2013 and available online at http://federalregister.gov/a/2013-12869, and on FDsys.gov BILLING CODE 3510-22-P DEPARTMENT OF COMMERCE
Evaluating the Design Safety of Highway Structural Supports
 Evaluating the Design Safety of Highway Structural Supports by Fouad H. Fouad and Elizabeth A. Calvert Department of Civil and Environmental Engineering The University of Alabama at Birmingham Birmingham,
Award Number: N
 Examination of health effects and long-term impacts of deployments of multiple tag types on blue, humpback, and gray whales in the eastern North Pacific Annual report for 2011 prepared by John Calambokidis,
L E S S O N : Tsunami Simulation Experiment
 e h p L E S S O N : Tsunami Simulation Experiment Summary: Students read the article, Building a Tsunami Warning System, and discuss what a tsunami is and why it is important to have a tsunami warning
Growth: Humans & Surf Clams
 Growth: Humans & Surf Clams East Coast MARE Materials For the leader: Projector Whiteboard to project data graph onto White paper & markers For the activity: Copy of data table Copy of map Class graphing
Prostate cancer prevalence (40+), for the State of Hawaii, for the Year(s)
, for the State of Hawaii, for the Year(s)") Prostate cancer prevalence (40+), for the State of Hawaii, for the Year(s) - 2011 Prostate cancer prevalence (40+), by State, County, Island, Community, Adult Age Group, DOH Race-Ethnicity, Education Level,
Prostate cancer prevalence (40+), for the State of Hawaii, for the Year(s) - 2011 Prostate cancer prevalence (40+), by State, County, Island, Community, Adult Age Group, DOH Race-Ethnicity, Education Level,
Lesson 3: Which fish should I eat?
 Lesson 3: Which fish should I eat? Objectives: Students will know how to answer the question, Are some fish less harmful to eat from the Hudson River than others? and be able to provide evidence to support
Cambridge International Examinations Cambridge Ordinary Level
 Cambridge International Examinations Cambridge Ordinary Level *3365325931* ENVIRONMENTAL MANAGEMENT 5014/21 Paper 2 May/June 2018 1 hour 30 minutes Candidates answer on the Question Paper. No Additional
Preliminary analysis of yellowfin tuna catch, effort, size and tagging data using an integrated age-structured model
 Preliminary analysis of yellowfin tuna catch, effort, size and tagging data using an integrated age-structured model Introduction John Hampton Secretariat of the Pacific Community Noumea, New Caledonia
Figure 39. Yearly Trend in Death Rates for Drowning: NSW, Year
 10.0 DROWNING 10.1 Deaths due to Drowning: The drowning death rate showed a statistically significant decrease between 199 and 1999 (Figure 39). Between 199 and 1999, 46 people died from drowning, at a
Salmon bycatch patterns in the Bering Sea pollock fishery
 Salmon bycatch patterns in the Bering Sea pollock fishery James Ianelli Seattle, WA Data from the North Pacific Observer Program (Fisheries Monitoring and Assessment) were analyzed for seasonal, temporal,
Tahiti, French Polynesia 2013 Deployments Status Fish Tagged Reported Days at Large 6 3/28/ /6/ /6/
 A total of 12 Wildlife Computers minipat tags were deployed from Kelsey Lee on Pacific blue marlin in French Polynesia between February 21, 2013 and April 16, 2013. Each tag was programmed to report 180
Free fish and invertebrate ID classes gets SCUBA divers involved in marine conservation
 Proceedings of the 2007 Georgia Basin Puget Sound Research Conference, Vancouver, BC pg. 1 Free fish and invertebrate ID classes gets SCUBA divers involved in marine conservation Janna Nichols, Anne Stoltz,
Observations of Deer and Wolves during the 2017 Moose Survey
 Observations of Deer and Wolves during the 2017 Moose Survey Mike Schrage, Fond du Lac Resource Management Division Introduction Each year, we conduct an aerial survey in northeastern Minnesota in an effort
Agenda Item G.1.b Supplemental WDFW Report June 2017
 1 Agenda Item G.1.b Supplemental WDFW Report June 2017 WASHINGTON DEPARTMENT OF FISH AND WILDLIFE REPORT ON SCOPING OF CATCH SHARING PLAN CHANGES AND INTERNATIONAL PACIFIC HALIBUT COMMISSION DATA REQUEST
Overview of herring related findings of NCEAS Portfolio Effects Working Group
 Overview of herring related findings of NCEAS Portfolio Effects Working Group Northwest Eric Ward, Rich Brenner eric.ward@noaa.gov richard.brenner@alaska.gov September 8, 2017 Acknowledgments Thanks to
Scoping Document July 2016
 Amendment 10 to the Fishery Management Plan for the Dolphin Wahoo Fishery of the Atlantic and Amendment 44 to the Fishery Management Plan for the Snapper Grouper Fishery of the South Atlantic Region July
Bottomfish Habitat and Restricted Fishing Area Analysis
 Bottomfish Habitat and Restricted Fishing Area Analysis Robert O Conner, NOAA National Marine Fisheries Service Chris Kelley, Hawaii Undersea Research Laboratory, University of Hawaii Study Area Essential
U.S. Pacific Coast Krill (Euphausiids)
") Agendum E.3.b Supplemental NMFS PowerPoint Presentation September 2004 U.S. Pacific Coast Krill (Euphausiids) Prepared by: Susan E. Smith Roger Hewitt NMFS Southwest Fisheries Science Center, NOAA 8604
Agendum E.3.b Supplemental NMFS PowerPoint Presentation September 2004 U.S. Pacific Coast Krill (Euphausiids) Prepared by: Susan E. Smith Roger Hewitt NMFS Southwest Fisheries Science Center, NOAA 8604
Regional Analysis of Extremal Wave Height Variability Oregon Coast, USA. Heidi P. Moritz and Hans R. Moritz
 Regional Analysis of Extremal Wave Height Variability Oregon Coast, USA Heidi P. Moritz and Hans R. Moritz U. S. Army Corps of Engineers, Portland District Portland, Oregon, USA 1. INTRODUCTION This extremal
Puget Sound s whales face intertwined obstacles By The Seattle Times, adapted by Newsela staff Jul. 15, :00 AM
 Puget Sound s whales face intertwined obstacles By The Seattle Times, adapted by Newsela staff Jul. 15, 2014 4:00 AM A sheet of water cascades off the back of an Orca that surfaced in Haro Strait near
Office of Science & Technology
 NOAA Fisheries Highlights of FEUS 2015 Highlights from the Annual Report Fisheries Economics of the United States, 2015 Office of Science & Technology Fisheries and the Economy U.S. fisheries provide jobs,
Hawaiian Islands. Thursday, March 30 Tuesday, April 11, 2017 Thursday, June 29 Tuesday, July 11, 2017 Thursday, November 2 Tuesday, November 14, 2017
 Hawaiian Islands Discover the tropical beauty of Hawaii during this magnificent vacation, and enjoy pure tropical bliss as you island hop from Oahu to Hawaii and Kauai to Maui. Whether you re admiring
Search for the missing sea otters
 Search for the missing sea otters Objectives: Based on a real study of sea otter declines Apply your knowledge of basic concepts of population and community ecology Interpret data from graphs and tables
Why Are Temperatures Different Near the Coasts and Inland?
 2.6 Investigate Why Are Temperatures Different Near the Coasts and Inland? Earlier in this Learning Set, you analyzed climate maps that indicated the effects of latitude on temperature. The maps are repeated
Puget Sound's whales face intertwined obstacles
 Puget Sound's whales face intertwined obstacles By The Seattle Times, adapted by Newsela staff on 07.15.14 Word Count 892 A sheet of water cascades off the back of an Orca that surfaced in Haro Strait
Briefing Paper #1. An Overview of Regional Demand and Mode Share
 2011 Metro Vancouver Regional Trip Diary Survey Briefing Paper #1 An Overview of Regional Demand and Mode Share Introduction The 2011 Metro Vancouver Regional Trip Diary Survey is the latest survey conducted
2017/2018 Salmon Fishery Planning
 2017/2018 Salmon Fishery Planning Sockeye and Pink Salmon Key Management Issues for 2017 FN Forum Meeting March 7-9 th, 2017 1. 2017 Management Issues Outline Fraser Sockeye and Pink Forecasts Environmental
Surf Clams: Latitude & Growth
 Surf Clams: Latitude & Growth East Coast MARE Materials For the leader: Projector Whiteboard to project data graph onto For the activity: Copy of data table Copy of map Computer program to graph in or
Maui (Reference Maps Of The Islands Of Hawai'i) By James A. Bier
 By James A. Bier") Maui (Reference Maps Of The Islands Of Hawai'i) By James A. Bier If you are looking for the ebook by James A. Bier Maui (Reference Maps of the Islands of Hawai'i) in pdf form, then you have come on to
Maui (Reference Maps Of The Islands Of Hawai'i) By James A. Bier If you are looking for the ebook by James A. Bier Maui (Reference Maps of the Islands of Hawai'i) in pdf form, then you have come on to
WORLD. Geographic Trend Report for GMAT Examinees
 2012 WORLD Geographic Trend Report for GMAT Examinees WORLD Geographic Trend Report for GMAT Examinees The World Geographic Trend Report for GMAT Examinees identifies mobility trends among candidates applying
WINTER FIELD REPORT AUGUST 2006
 WINTER FIELD REPORT AUGUST 2006 Aloha friends and supporters! Our 2006 field season was very productive in terms of all three of our consortium s main goals: conservation, research and education, and we
Zooplankton Migration Patterns at Scotton Landing: Behavioral Adaptations written by Lauren Zodl, University of Delaware
 Zooplankton Migration Patterns at Scotton Landing: Behavioral Adaptations written by Lauren Zodl, University of Delaware Summary: Zooplankton have evolved specific migration patterns that increase their
Citation for published version (APA): Canudas Romo, V. (2003). Decomposition Methods in Demography Groningen: s.n.
: Canudas Romo, V. (2003). Decomposition Methods in Demography Groningen: s.n.") University of Groningen Decomposition Methods in Demography Canudas Romo, Vladimir IMPORTANT NOTE: You are advised to consult the publisher's version (publisher's PDF) if you wish to cite from it. Please
University of Groningen Decomposition Methods in Demography Canudas Romo, Vladimir IMPORTANT NOTE: You are advised to consult the publisher's version (publisher's PDF) if you wish to cite from it. Please
Relationships of Hip Height Measurements with Growth and Carcass Traits of Crossbred and Angus Cattle
 Relationships of Hip Height Measurements with Growth and Carcass Traits of Crossbred and Angus Cattle P.J. Zerbino) R.R. Frahm2 and J. W. Castree3 Story in Brief Hip heights were measured on 286 three-breed
Travel and Rider Characteristics for Metrobus
 Travel and Rider Characteristics for Metrobus 040829040.15 Travel and Rider Characteristics for Metrobus: 2012-2015 Overview The Miami Dade County Metropolitan Planning Organization (MPO) conducted a series
Final Report Alaska Department of Fish and Game State Wildlife Grant T July 1, 2003 June 30, 2006:
 Final Report Alaska Department of Fish and Game State Wildlife Grant T-1-6-4 July 1, 2003 June 30, 2006: Acoustic Monitoring for Killer Whales in the Bering Sea John Hildebrand and Erin Oleson Marine Physical
Steelhead Tagging Project at Moricetown Canyon. Data Analysis and Recommendations
 Steelhead Tagging Project at Moricetown Canyon AUGUST TO SEPTEMBER 2007 by Wet suwet en Fisheries Data Analysis and Recommendations by SKR Consultants Ltd. Smithers, B.C. for Pacific Salmon Foundation
HADDOCK ON THE SOUTHERN SCOTIAN SHELF AND IN THE BAY OF FUNDY (DIV. 4X/5Y)
") Canadian Science Advisory Secretariat Science Advisory Report 26/47 HADDOCK ON THE SOUTHERN SCOTIAN SHELF AND IN THE BAY OF FUNDY (DIV. 4X/5Y) Context Haddock (Melanogrammus aeglefinus) are found on both
Canadian Science Advisory Secretariat Science Advisory Report 26/47 HADDOCK ON THE SOUTHERN SCOTIAN SHELF AND IN THE BAY OF FUNDY (DIV. 4X/5Y) Context Haddock (Melanogrammus aeglefinus) are found on both
Peace River Water Use Plan. Monitoring Program Terms of Reference. GMSMON-1 Peace River Creel Survey
 Peace River Water Use Plan Monitoring Program Terms of Reference GMSMON-1 Peace River Creel Survey April 10, 2008 Terms of Reference for the Peace River Water Use Plan Monitoring Program: Peace River Creel
Information Paper for SAN (CI-4) Identifying the Spatial Stock Structure of Tropical Pacific Tuna Stocks
 Identifying the Spatial Stock Structure of Tropical Pacific Tuna Stocks") Current knowledge, key uncertainties and future research directions for defining the stock structure of skipjack, yellowfin, bigeye and South Pacific albacore tunas in the Pacific Ocean Information Paper
Current knowledge, key uncertainties and future research directions for defining the stock structure of skipjack, yellowfin, bigeye and South Pacific albacore tunas in the Pacific Ocean Information Paper
12. School travel Introduction. Part III Chapter 12. School travel
 12. School travel 12.1 Introduction This chapter presents the evidence on changes in travel patterns for the journey to school in the three towns over the period of the Sustainable Travel Town project.
Story of Marine Debris from the 2011 Tsunami in Japan in Model Simula;ons and Observa;onal Reports
 Story of Marine Debris from the 2011 Tsunami in Japan in Model Simula;ons and Observa;onal Reports Jan Hafner, Nikolai Maximenko Interna4onal Pacific Research Center University of Hawaii 23-28 February
THE OREGON. PLAN for Salmon and Watersheds. Stock Assessment of Anadromous Salmonids, Report Number: OPSW-ODFW
 THE OREGON PLAN for Salmon and Watersheds Stock Assessment of Anadromous Salmonids, Report Number: OPSW-ODFW-1- The Oregon Department of Fish and Wildlife prohibits discrimination in all of it s programs
Prospects for effective conservation of bigeye tuna stocks in the Western Central Pacific Ocean
 PFRP Page 1 7 th regular session of the Scientific Committee Western Central Pacific Fisheries Commission Ponhpei, Micronesia, 8-17 August 2011 Ref.: WCPFC-SC7-2011/ Prospects for effective conservation
Marine Management Strategy Frequently Asked Questions
 Marine Management Strategy Frequently Asked Questions Can I still go fishing at Rottnest? Yes Where will I be able to go fishing on Rottnest Island? Recreational fishing can occur at any location outside
A Model for Tuna-Fishery Policy Analysis: Combining System Dynamics and Game Theory Approach
 A Model for Tuna-Fishery Policy Analysis: Combining System Dynamics and Game Theory Approach E. Widodo, Budianto Department of Industrial Engineering, Institut Teknologi Sepuluh Nopember, ITS, Surabaya,
Updated landings information for the commercial fisheries in Puerto Rico with emphasis on silk and queen snapper and parrotfish fisheries
 Updated landings information for the commercial fisheries in Puerto Rico with emphasis on silk and queen snapper and parrotfish fisheries Nancie J. Cummings and Daniel Matos-Caraballo SEDAR 26-DW-03 Date
1998 SURVEY OF FRONT SEAT OCCUPANT RESTRAINT USE IN EIGHTEEN TEXAS CITIES. by Katie N. Womack. October 1998
 1998 SURVEY OF FRONT SEAT OCCUPANT RESTRAINT USE IN EIGHTEEN TEXAS CITIES by Katie N. Womack October 1998 This report was prepared in cooperation with the Traffic Operations Division Texas Department of
SEA GRANT PROGRESS REPORT
 SEA GRANT PROGRESS REPORT Project Title: The relationship between seasonal migrations of berried female lobster Homarus americanus, egg development and larval survival. Principal Investigator: Winsor H.
Reducing Risk of Whale Entanglements in Oregon Dungeness Crab Gear
 Session 3 Reducing Risk of Whale Entanglements in Oregon Dungeness Crab Gear CaseID: 20150703Mn NMFS MMHSRP Permit #: 18786 Overview West Coast Information Framing the problem Summary of West Coast large
Tsunami Preparedness in the Capital Region
 Tsunami Preparedness in the Capital Region A presentation by: the CRD Local Government Emergency Program Advisory Commission (LG EPAC) and your community emergency programs What is a tsunami? A tsunami
Evaluating the Influence of R3 Treatments on Fishing License Sales in Pennsylvania
 Evaluating the Influence of R3 Treatments on Fishing License Sales in Pennsylvania Prepared for the: Pennsylvania Fish and Boat Commission Produced by: PO Box 6435 Fernandina Beach, FL 32035 Tel (904)
Sanctuary Ocean Count
 Sanctuary Ocean Count http://hawaiihumpbackwhale.noaa.gov Project Handbook CONTACT SHEET BIG ISLAND For questions, please contact the O`ahu Sanctuary office at: 1-888-55WHALE ext. 253 (1-888-559-4253)
Recent Environmental Conditions and BC Salmon Outlook to 2020
 Recent Environmental Conditions and BC Salmon Outlook to 2020 K. Hyatt & S. Grant Pacific Biological Station, Nanaimo Contributors: I. Perry, L. Weitkamp, M. Galbraith, J. Boldt, P. Chandler, S. King,
Area I Crab Fisherman Association
 Area I Crab Fisherman Association October 26, 216 Debra Myles Review Panel Manager- Roberts Bank Terminal2 Project Canadian Environmental Assessment
LAKE WASHINGTON SOCKEYE SALMON STUDIES. Richard E. Thorne and James J. Dawson
 FRI-UW-7613 October 1976 LAKE WASHINGTON SOCKEYE SALMON STUDIES 1975 1976 by Richard E. Thorne and James J. Dawson Final Report Service Contract No. 648 Washington State Department of Fisheries For the
Average Runs per inning,
 Home Team Scoring Advantage in the First Inning Largely Due to Time By David W. Smith Presented June 26, 2015 SABR45, Chicago, Illinois Throughout baseball history, the home team has scored significantly
Public Hearing Document
 Regulatory Amendment 1 to the Fishery Management Plan for the Dolphin and Wahoo Fishery of the Atlantic Modify commercial trip limits for dolphin Environmental Assessment Regulatory Impact Review Regulatory
PRE-SEASON PLANNING FOR FRASER SALMON and STOCKS OF CONCERN. Forum on Conservation and Harvest Planning for Fraser Salmon January 22, 2010
 PRE-SEASON PLANNING FOR FRASER SALMON and STOCKS OF CONCERN Forum on Conservation and Harvest Planning for Fraser Salmon January 22, 2010 2 Outline South Coast Chinook Status Management Actions Recovery
13. TIDES Tidal waters
 Water levels vary in tidal and non-tidal waters: sailors should be aware that the depths shown on the charts do not always represent the actual amount of water under the boat. 13.1 Tidal waters In tidal
Cove Point Beach Restoration: Utilization of a Spawning Habitat by Horseshoe Crabs (Limulus polyphemus)
") Cove Point Beach Restoration: Utilization of a Spawning Habitat by Horseshoe Crabs (Limulus polyphemus) Paul Bushmann, Jessica Peterson, Bethany Enyeart and Deborah Smith Anne Arundel Community College
Cove Point Beach Restoration: Utilization of a Spawning Habitat by Horseshoe Crabs (Limulus polyphemus) Paul Bushmann, Jessica Peterson, Bethany Enyeart and Deborah Smith Anne Arundel Community College
Tsunami Preparedness in the Capital Region
 Tsunami Preparedness in the Capital Region A presentation by: the CRD Local Government Emergency Program Advisory Commission (LG EPAC) and your community emergency programs What is a tsunami? A tsunami
Georgia Bass Clubs. Tournament Creel Report
 Georgia Clubs 2016 Tournament Creel Report Submitted By: Clint Peacock Fisheries Biologist Georgia Department of Natural Resources Wildlife Resources Division Introduction This is the 39 th year Georgia
Active Travel and Exposure to Air Pollution: Implications for Transportation and Land Use Planning
 Active Travel and Exposure to Air Pollution: Implications for Transportation and Land Use Planning Steve Hankey School of Public and International Affairs, Virginia Tech, 140 Otey Street, Blacksburg, VA
DEER AND ELK POPULATION STATUS AND HARVEST STRUCTURE IN WESTERN NORTH AMERICA: A SUMMARY OF STATE AND PROVINCIAL STATUS SURVEYS.
 DEER AND ELK POPULATION STATUS AND HARVEST STRUCTURE IN WESTERN NORTH AMERICA: A SUMMARY OF STATE AND PROVINCIAL STATUS SURVEYS. JUSTIN BINFET,' Wyoming Game and Fish Department, 5400 Bishop Boulevard,
Pacific Region Contaminants Atlas
 Western Washington University Western CEDAR Salish Sea Ecosystem Conference 2016 Salish Sea Ecosystem Conference (Vancouver, BC) Pacific Region Contaminants Atlas Rob Knight Community Mapping Network,
Modify Federal Regulations for Swordfish Trip Limits the Deep-set Tuna Longline Fishery. Decision Support Document November 2010
 Agenda Item J.2.a Attachment 2 November 2010 Modify Federal Regulations for Trip Limits the Deep-set Tuna Longline Fishery (Action Pursuant to Modification of Routine Management Measures under the Framework
Thanks to: -Current and former Habitat staff -Fish Program Marine Fish Division & Region 6 Staff
 Thanks to: -Current and former Habitat staff -Fish Program Marine Fish Division & Region 6 Staff - Overview Intro to forage fish What they are and why are they important Nearshore Forage Fish Habitat surveys
Atlantic croaker, Micropogonias undulatus (Linnaeus, 1766)
") Atlantic croaker, Micropogonias undulatus (Linnaeus, 1766) Although Atlantic croaker occur throughout much of Florida, they are seldom found south of Tampa Bay on the gulf coast or south of the Indian
Atlantic croaker, Micropogonias undulatus (Linnaeus, 1766) Although Atlantic croaker occur throughout much of Florida, they are seldom found south of Tampa Bay on the gulf coast or south of the Indian
CHAPTER 1 ORGANIZATION OF DATA SETS
 CHAPTER 1 ORGANIZATION OF DATA SETS When you collect data, it comes to you in more or less a random fashion and unorganized. For example, what if you gave a 35 item test to a class of 50 students and collect
Exemplar for Internal Assessment Resource Geography Level 3. Resource title: The Coastal Environment Kaikoura
 Exemplar for internal assessment resource Geography 3.5A for Achievement Standard 91430 Exemplar for Internal Assessment Resource Geography Level 3 Resource title: The Coastal Environment Kaikoura This
Spatial/Seasonal overlap between the midwater trawl herring fishery and predator focused user groups
 Spatial/Seasonal overlap between the midwater trawl herring fishery and predator focused user groups A working paper submitted to the Herring PDT Micah Dean July 26, 2017 Introduction A goal of Amendment
Summary. Introduction
 Horseshoe Crab Spawning Activity in Maryland Coastal Bays: 2002-2009 Steve Doctor, Maryland Fisheries Service Carol Cain, Maryland Coastal Bays Program Summary The areas of the greatest horseshoe crabs
Results of Survey of Workshop Participants Graphs and Summaries Regarding Costs, Feasibility and other Factors
 Results of Survey of Workshop Participants Graphs and Summaries Regarding Costs, Feasibility and other Factors Survey results summarized and graphed for PSMFC by Marianne Rogers, NOAA There were 35 surveys
Forward ebrochure Visit Koloa Landing Previous Page Close ebrochure Next Page
 1 Niihau H a Kauai w a Oahu Lanai Molokai Maui i i a n Kahoolawe I s l a n d s Hawaii 2 PARADISE BY DESIGN Koloa Landing at Poipu Beach will be a private, oceanside resort community located in one of the
Exploration of ecosystem factors responsible for coherent recruitment patterns of Pacific cod and walleye pollock in the eastern Bering Sea
 Exploration of ecosystem factors responsible for coherent recruitment patterns of Pacific cod and walleye pollock in the eastern Bering Sea Patricia A. Livingston, James Ianelli, Grant Thompson, and Ed
British Columbia Lingcod Egg Mass Survey Photo by LEMS volunteer: Jackie Hildering
 British Columbia Lingcod Egg Mass Survey 2010 Photo by LEMS volunteer: Jackie Hildering Kevin Kaufman & Jeff Marliave Vancouver Aquarium August, 2010 Introduction This year marked the 17 th anniversary
Dauphin Lake Fishery. Status of Walleye Stocks and Conservation Measures
 Dauphin Lake Fishery Status of Walleye Stocks and Conservation Measures Date: December, 21 Dauphin Lake Fishery Status of Walleye Stocks and Conservation Measures Background: Walleye stocks in Dauphin